
Abstract
In the present study, fabrication of micro-channel on glass fiber reinforced plastic (GFRP) sheet has been performed through micro-electrochemical spark machining process. Box-Behnken design has been followed to conduct experiments and the influence of machining parameters and their ranges that is, applied voltage (50 V–60 V), duty factor (35%–45%), electrolyte concentration (20–30 wt%), and pulse frequency (6–10 kHz) on the micro-channel quality has been investigated. The width of micro-channel (WMC), delamination extent (DE), and heat-affected zone (HAZ) are considered as the responses. Response surface method (RSM) with desirability analysis and multi-objective optimization are utilized to optimize the process. The minimum observed WMC, DE, and HAZ are 532.81, 1.09, and 50.52 μm respectively which are obtained at machining voltage: 50 V, duty factor: 35%, concentration: 20 wt% of NaOH, and pulse frequency: 10 kHz. The fiber breakage and re-deposition/adhesion of broken fiber and matrix materials are observed at the edges of the micro-channel.
Keywords
Introduction
Fiber-reinforced plastics (FRPs) are one of the advanced composite materials and has enormous potential for various applications such as in aviation, automobile, marine, and electronics industries.1,2 Among different FRPs, Glass-fiber reinforced plastic (GFRP) belongs to FRP family which consists of epoxy as matrix and glass fiber as reinforcement. It shows notable properties like dimensional stability at high temperature, high stiffness, lightweight, electrical, corrosion, and chemical resistance.1–4 Despite of the above advantages and applications, it is not used widely due to its poor machinability. Conventional machining processes are not very successful in shaping of the GFRP composites because of their anisotropic properties, brittle nature of fibers, and poor thermal conductivity.1,3 In addition, severe delamination, fiber cracking/breaking, and dimensional inaccuracy2,3,5 are observed.
The non-traditional machining processes like abrasive water jet machining (AWJM), laser beam machining (LBM), and electrical discharge machining (EDM) are utilized to cut FRPs. Nevertheless, these processes also have certain limitations which make them unsuitable for GFRP, such as, inability to fabricate blind machining features (by AWJM),6,7 fiber damage, delamination, and heat affected zone (by Laser),8–10 and restricted only for conductive composite (by EDM).11–14
Micro-electro chemical spark machining (micro-ECSM) process is an emerging hybrid process that removes materials by the action of two simultaneous processes that is, micro electro chemical machining (micro-ECM) and micro electro discharge machining (micro-EDM). This process can machine both conductive and non-conductive materials. 15 Due to the involvement of two machining processes, the material removal rate (MRR) is faster than any of the individual process. 16 In this connection various research articles are reported. For instance, Manna and Narang 17 revealed the feasibility of micro-ECSM process to fabricate the contour shape on e-glass–fiber–epoxy composites and reported that MRR of 2.975 mg/min. In general, the fibers are burned or melt by the discharge energy which help to seal the edges and improves the dimensional accuracy. 18 Dhanvijay et al. 19 reported that continuous electrolyte flow, improves the availability of fresh electrolyte in the machining zone, which enhances MRR. Malik and Manna 20 found that voltage and electrolyte concentration are prominent factors for MRR of e-glass fiber epoxy composite. Electrolyte layer above the workpiece (Quartz) were another significant parameter to improve the machining performance, as lowering the level, thermal energy is concentrated due to reduction in resistivity between the electrode and discharge current. 21 Sabahi et al. 22 integrate an upward magnetic field with ECSM to enhance the electrical conductivity which resulted in a reduction in HAZ of the micro-channels. Further, it reveals that NaOH electrolyte reduces the HAZ in comparison to KOH electrolyte. 23 Cao et al. 24 recommended that a small depth of the machined layer with a moderate feed rate should be used during the micro-milling on Pyrex glass in order to avoid tool breakage and workpiece cracks. 25 Another report reveals that increasing the pulse off time and tool rotation speed, the groove width and machining depth on Pyrex glass are reduced. 26 The fluctuation of depth in the micro channel on Quartz is controlled by reducing the voltage and feed rate. 27 Mehrabi et al. 28 applied an electrolyte injection approach to supply the working fluid to a deeper machining section and prevent the accumulation of the debris. This enhances the material removal rate in optical glasses.
The above literature reveals that micro-ECSM process is mostly utilized for machining of glasses material and very few literatures describes the machining of Glass-fiber reinforced plastic (GFRP). In addition, the influence of machining parameters on dimensional accuracy of the fabricated shape on GFRP is still required to be disclosed. Hence, the objective of the present study is to fabricate micro-channels on GFRP sheet through micro-ECSM process and study of influence of different machining parameters such as voltage (V), duty factor (D), electrolyte concentration (C), and frequency (F) on the responses. The response surface methodology (RSM) technique-based on Box-Behnken method is used to design the experiments. Different responses such as width of micro channel (WMC), delamination extent (DE), and heat affected zone (HAZ) are considered for analyzing the quality of the fabricated micro-channels. At last, the quality of the micro-channel edges are evaluated through Field emission scanning electron microscopy. The details of the study are described in the following sections.
Principle of micro-ECSM process
Micro-ECSM works on the combined principle of the micro-ECM and micro-EDM processes.16,47 Figure 1(i) represents the schematic view of the micro-ECSM process. In this machining method, the tool and job are immersed in the electrolyte solution. The level of the electrolyte above the surface to be machined is maintained within 1–2 mm. A DC pulse power supply is used to meet the power requirement. An auxiliary electrode is used as an anode whose surface area is larger than the tool electrode. 45 The tool is made as cathode 47 and connected to the negative terminal of the power supply. When the potential difference is applied across the tool and workpiece, the electrolysis process is initiated, due to which hydrogen bubbles formed near cathode (Figure 1(i)(a)), whereas at the anode, oxygen bubbles are generated. On increasing the voltage, the intensity of bubble formation and size of bubbles increases. These large sizes of bubbles coalesce with other bubbles and form a gas film on the tool surface (Figure 1(i)(b)). This isolates the tool from the electrolyte and hence, the current density inside the gas film rises. With increasing the voltage more than critical voltage, this gas film breaks, and the formation of spark occurs (Figure 1(i)(c)), which melts and vaporizes the material from the close vicinity. Due to the occurrence of high intensity of sparks, the tool electrode is also undergo erosion. The intensity of the spark depend on the electrical energy input, electrical properties of the tool, and electrolyte concentration.16,29
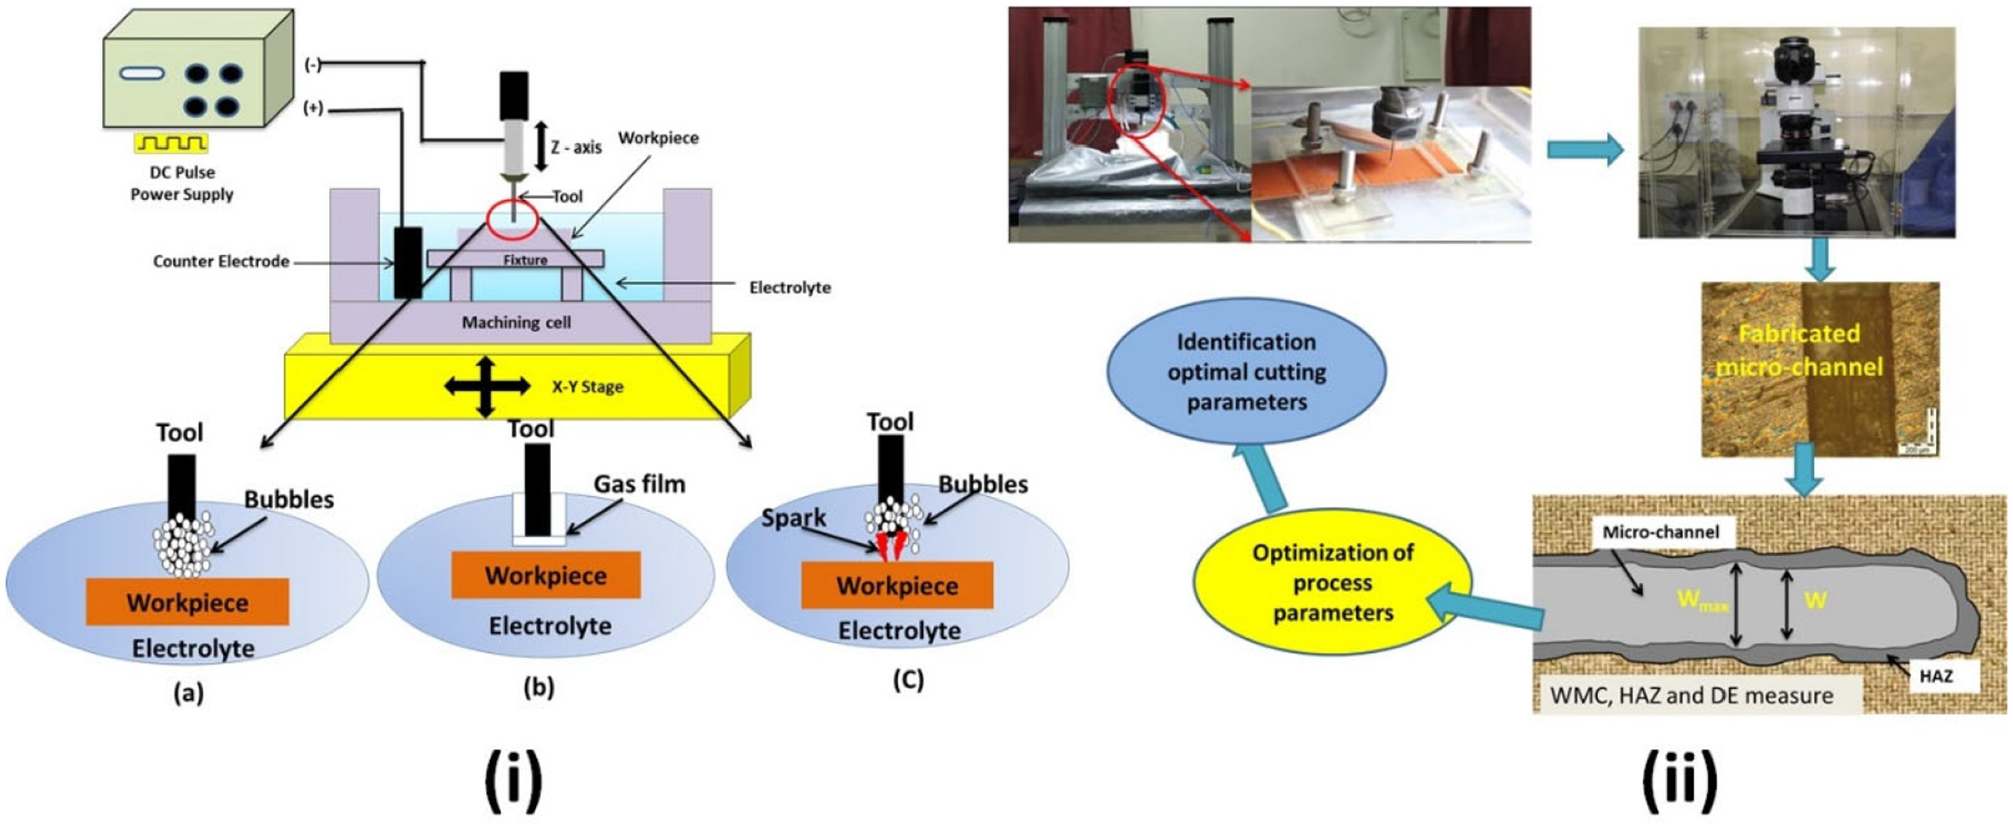
(i) Schematic diagram of micro-ECSM process: (a) hydrogen gas bubbles formation, (b) gas film, and (c) spark generation and (ii) flowchart showing the methodology.
Methodology
The total work have been accomplished in three stages: In the first stage, machining of micro-channel by using micro-electrochemical sparks machining process at variable input machining parameters. The responses, that is, the width of the micro-channel (WMC), delamination extent (DE), and heat-affected damage (HAZ) area analysis, have been measured in the second stage. And in the third stage, the optimal machining condition is estimated for minimum delamination extent and HAZ with appropriate micro-channel width. The methodology’s flow chart has been presented in Figure 1(ii).
Experimental details
Setup configuration
All the experiments are carried out with an in-house designed and developed micro-ECSM setup (Advanced Manufacturing Laboratory, IIT(ISM) Dhanbad) (Figure 2). It comprises of three motorized stage (i.e. X, Y, and Z with resolution of 0.125 microns), Spindle with tool holder, electrolyte tank, workpiece holding fixture, and a pulse power supply unit. The motion is controlled by a micro-motion controller which receives command in CNC program executed in a PC. The horizontal motion of the workpiece is carried out by X and Y stages, whereas the vertical movement of the tool is provided by Z stage. A tank of dimension 100 × 100 × 50 mm3 is made from Perspex sheet (thickness 5 mm) is used as a machining chamber, and it contains a workpiece clamping arrangement for all the machining operations. The power requirement of the machining process is maintained by a DC pulse power supply with adjustable parameters (i.e. voltage: 10–150 V, duty factor: 5%–70%, and frequency: 0.1–10 kHz).
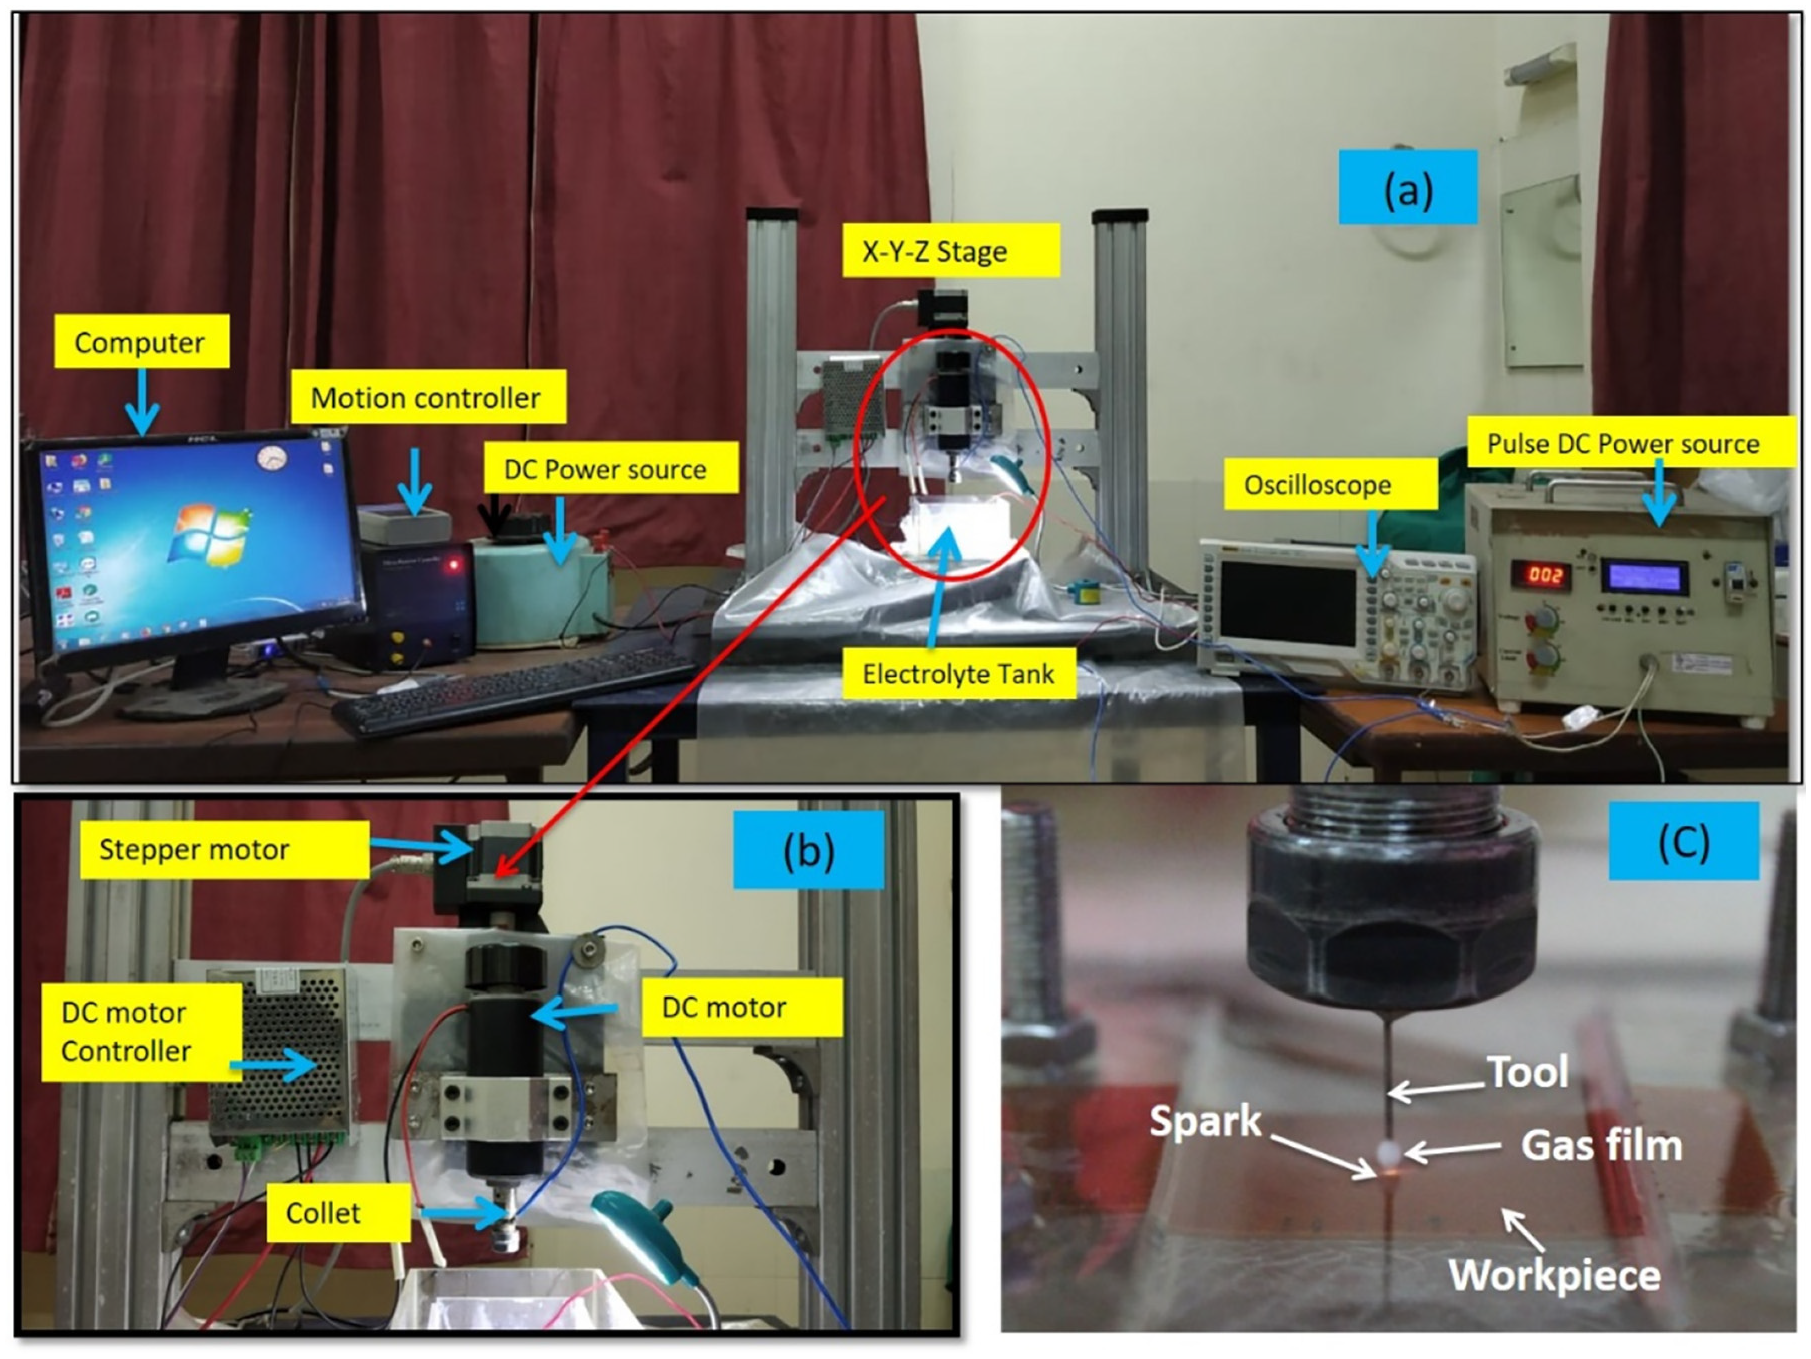
(a) In-house fabricated micro-ECSM facility, (b) spindle and collet arrangement, and (c) enlarged view of machining zone.
Material specification
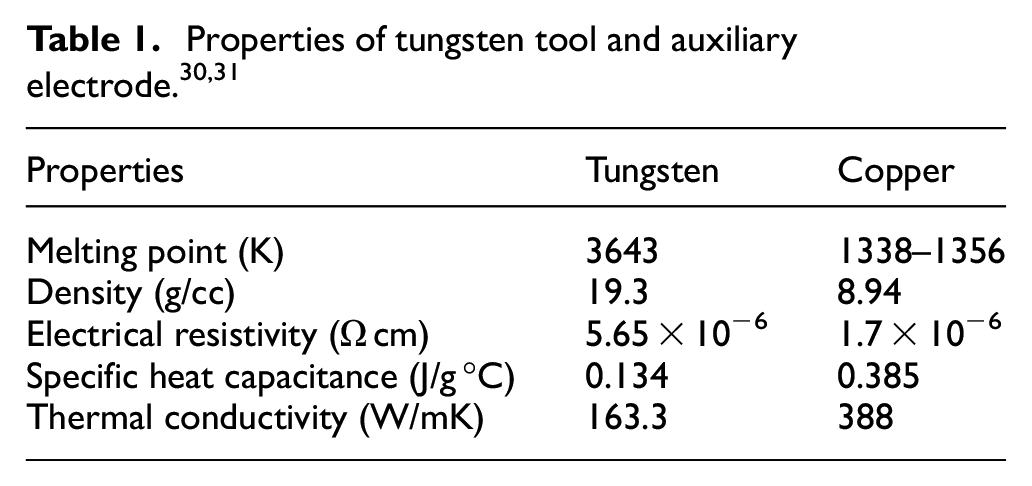
Glass-fiber reinforced plastic (GFRP) composite sheet of dimension 88 × 28 × 1.8 mm3 has been used as the workpiece (Figure 3(a)). The GFRP with density: 2.57 g/cm3, tensile Strength: 3.5 GPa, and coefficient of thermal expansion 50–52 × 107 m/m°C1 has been used for the experiments. A rectangular block of copper having dimensions 48 × 12 × 5 mm3 has been used (Figure 3(b)) as anode. A cylindrical tungsten rod of diameter 500 µm is used as cathode (Figure 3(c)). The property of the tungsten rod and copper block is shown in Table 1. Sodium hydroxide (NaOH) (Merck life science Pvt. Ltd.) mixed in de-ionized water of variable weight percentage, is used for conducting experiments.
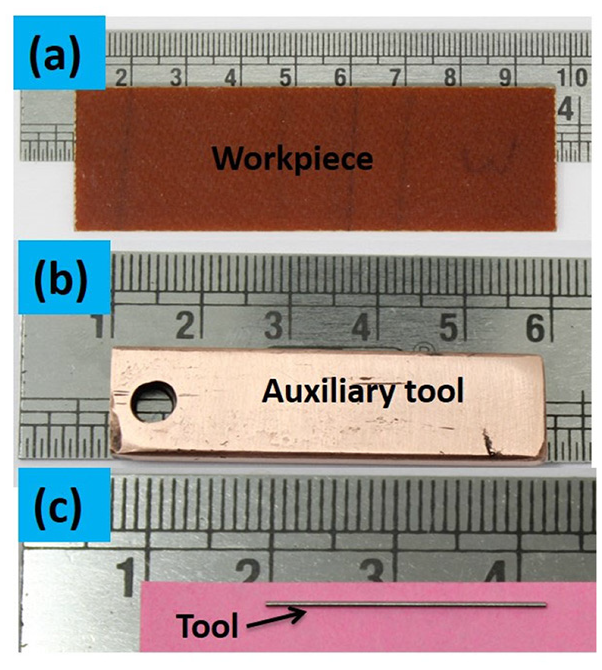
Material used in experiments: (a) GFRP composite, (b) copper electrode, and (c) tungsten tool rod.
Experimental procedure
A micro-channel has been fabricated by varying the input process parameters, that is, voltage, duty factor, electrolyte, and its concentration at different levels. Initially, the flatness of tool bottom surface (TBS) has been checked by using tool maker microscope (Make:Banbros Engg. Pvt. Ltd, model: TM-50). The uneven surfaces of TBS are made smooth and parallel to the horizontal axis by mechanical polishing with emery paper having grades ranging from 1500 to 2000. The tool is laterally moved over the abrasive paper by pressing on it. The complete TBS flatness methodology is shown in Figure 4(a). Then proper cleaning of a micro tool, workpiece and auxiliary tool electrode has been carried out by using ultrasonic bath (in the presence of acetone) for fifteen minutes in order to remove all dirt particles from the surface. Then workpiece and tools are allowed to dry in the oven at 80°C for 10 min to remove the moisture. The workpiece is clamped adequately in the machining tank with the help of a fixture, such that its top surface parallel to the tool bottom surface. The micro tool is clamped in tool holder assembly through collet. The tool electrode has been connected to the negative terminal of the power supply while the auxiliary electrode at positive terminal. At first, the tool is slowly moved toward the workpiece till the tool bottom surface comes in contact with the workpiece top surface (WTS), and it is marked as zero reference point. The tool then retracts to 20 µm above the WTS to maintain the gap, and facilitate the circulation of electrolytes and allow bubbles to form at TBS (Figure 4(b)). Initially, pilot experiments have been performed (based on the previous literature17,19,20,44) to select the ranges of the input machining parameters. And based on the trial experiments, the ranges of the parameters have been decided.
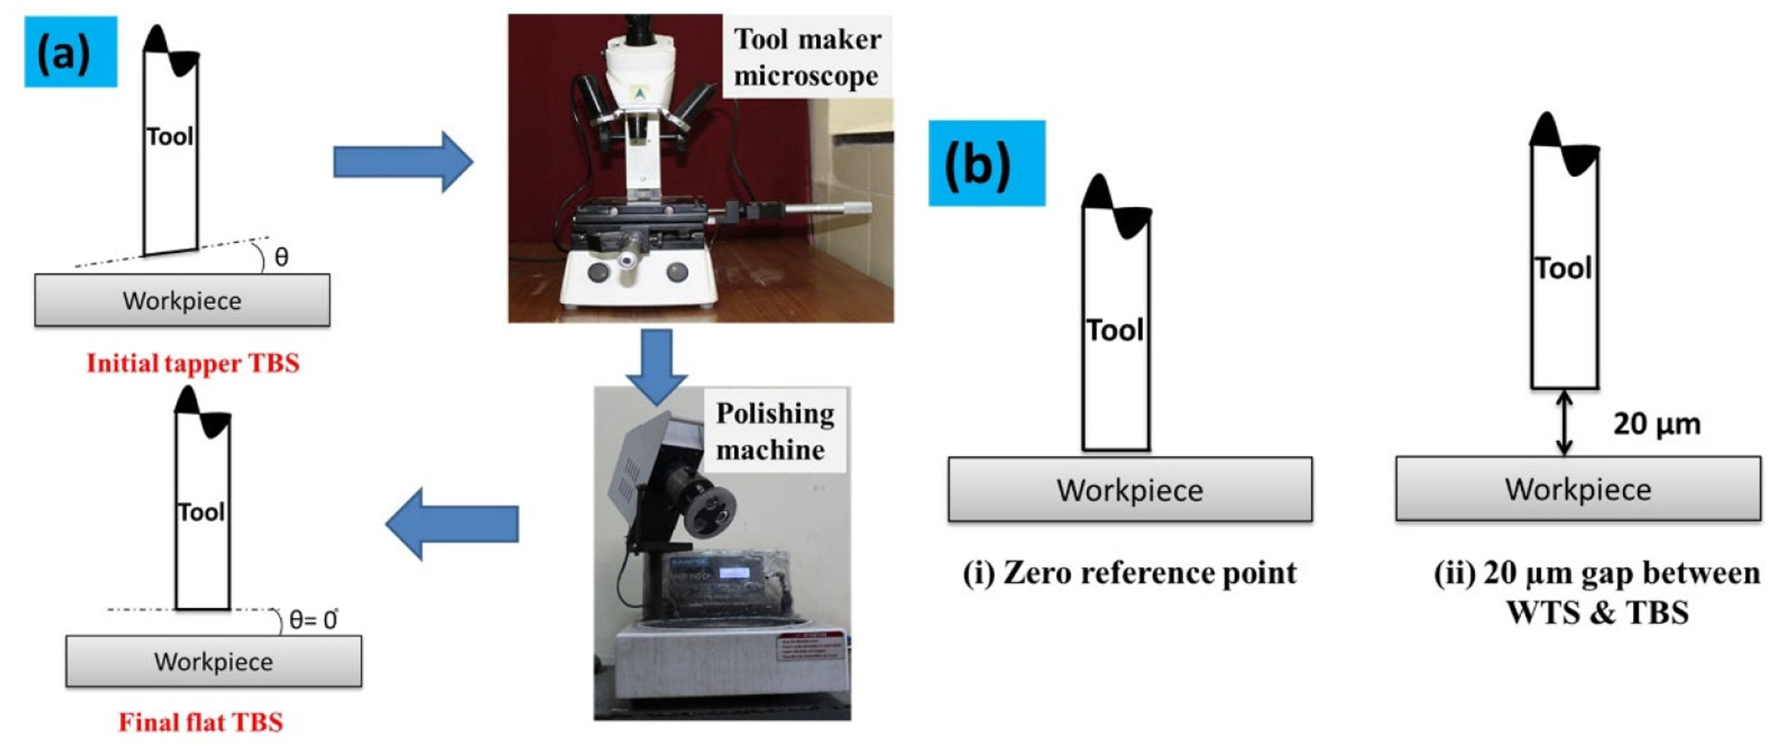
(a) Tool bottom surface (TBS) flatness methodology and (b) maintaining gap between WTS and TBS.
The NaOH electrolyte solution of different concentrations has been prepared by mixing the calculated amount of electrolyte pallets (Merck life science Pvt. Ltd.) in distilled water. The electrolyte solution is filled in the machining tank. The workpiece has been fully submerged in the electrolyte, and the level of electrolyte 1–2 mm above the top surface of the workpiece is maintained. The electrolyte solution has been supplied externally to the machining tank during the operation in order to maintain the level of the electrolyte. Since the energy released during the discharge raised the temperature of the electrolyte and vaporized it, and hence the level of electrolyte deteriorated. After each set of experiment the electrolyte and tool electrode has been changed in order to get the best result.
The machining of the workpiece has been performed by implementing layer by layer approach. In this approach, mechanical contact between tool and workpiece is almost avoided. Hence, it improves the flushing ability, which removes the debris material easily from the machining zone and improves the surface finish. 31 A micro channel of depth 50 µm and length 3000 µm has been fabricated. Each machining layer depth of 25 µm is chosen as suggested by Cao et al. 24
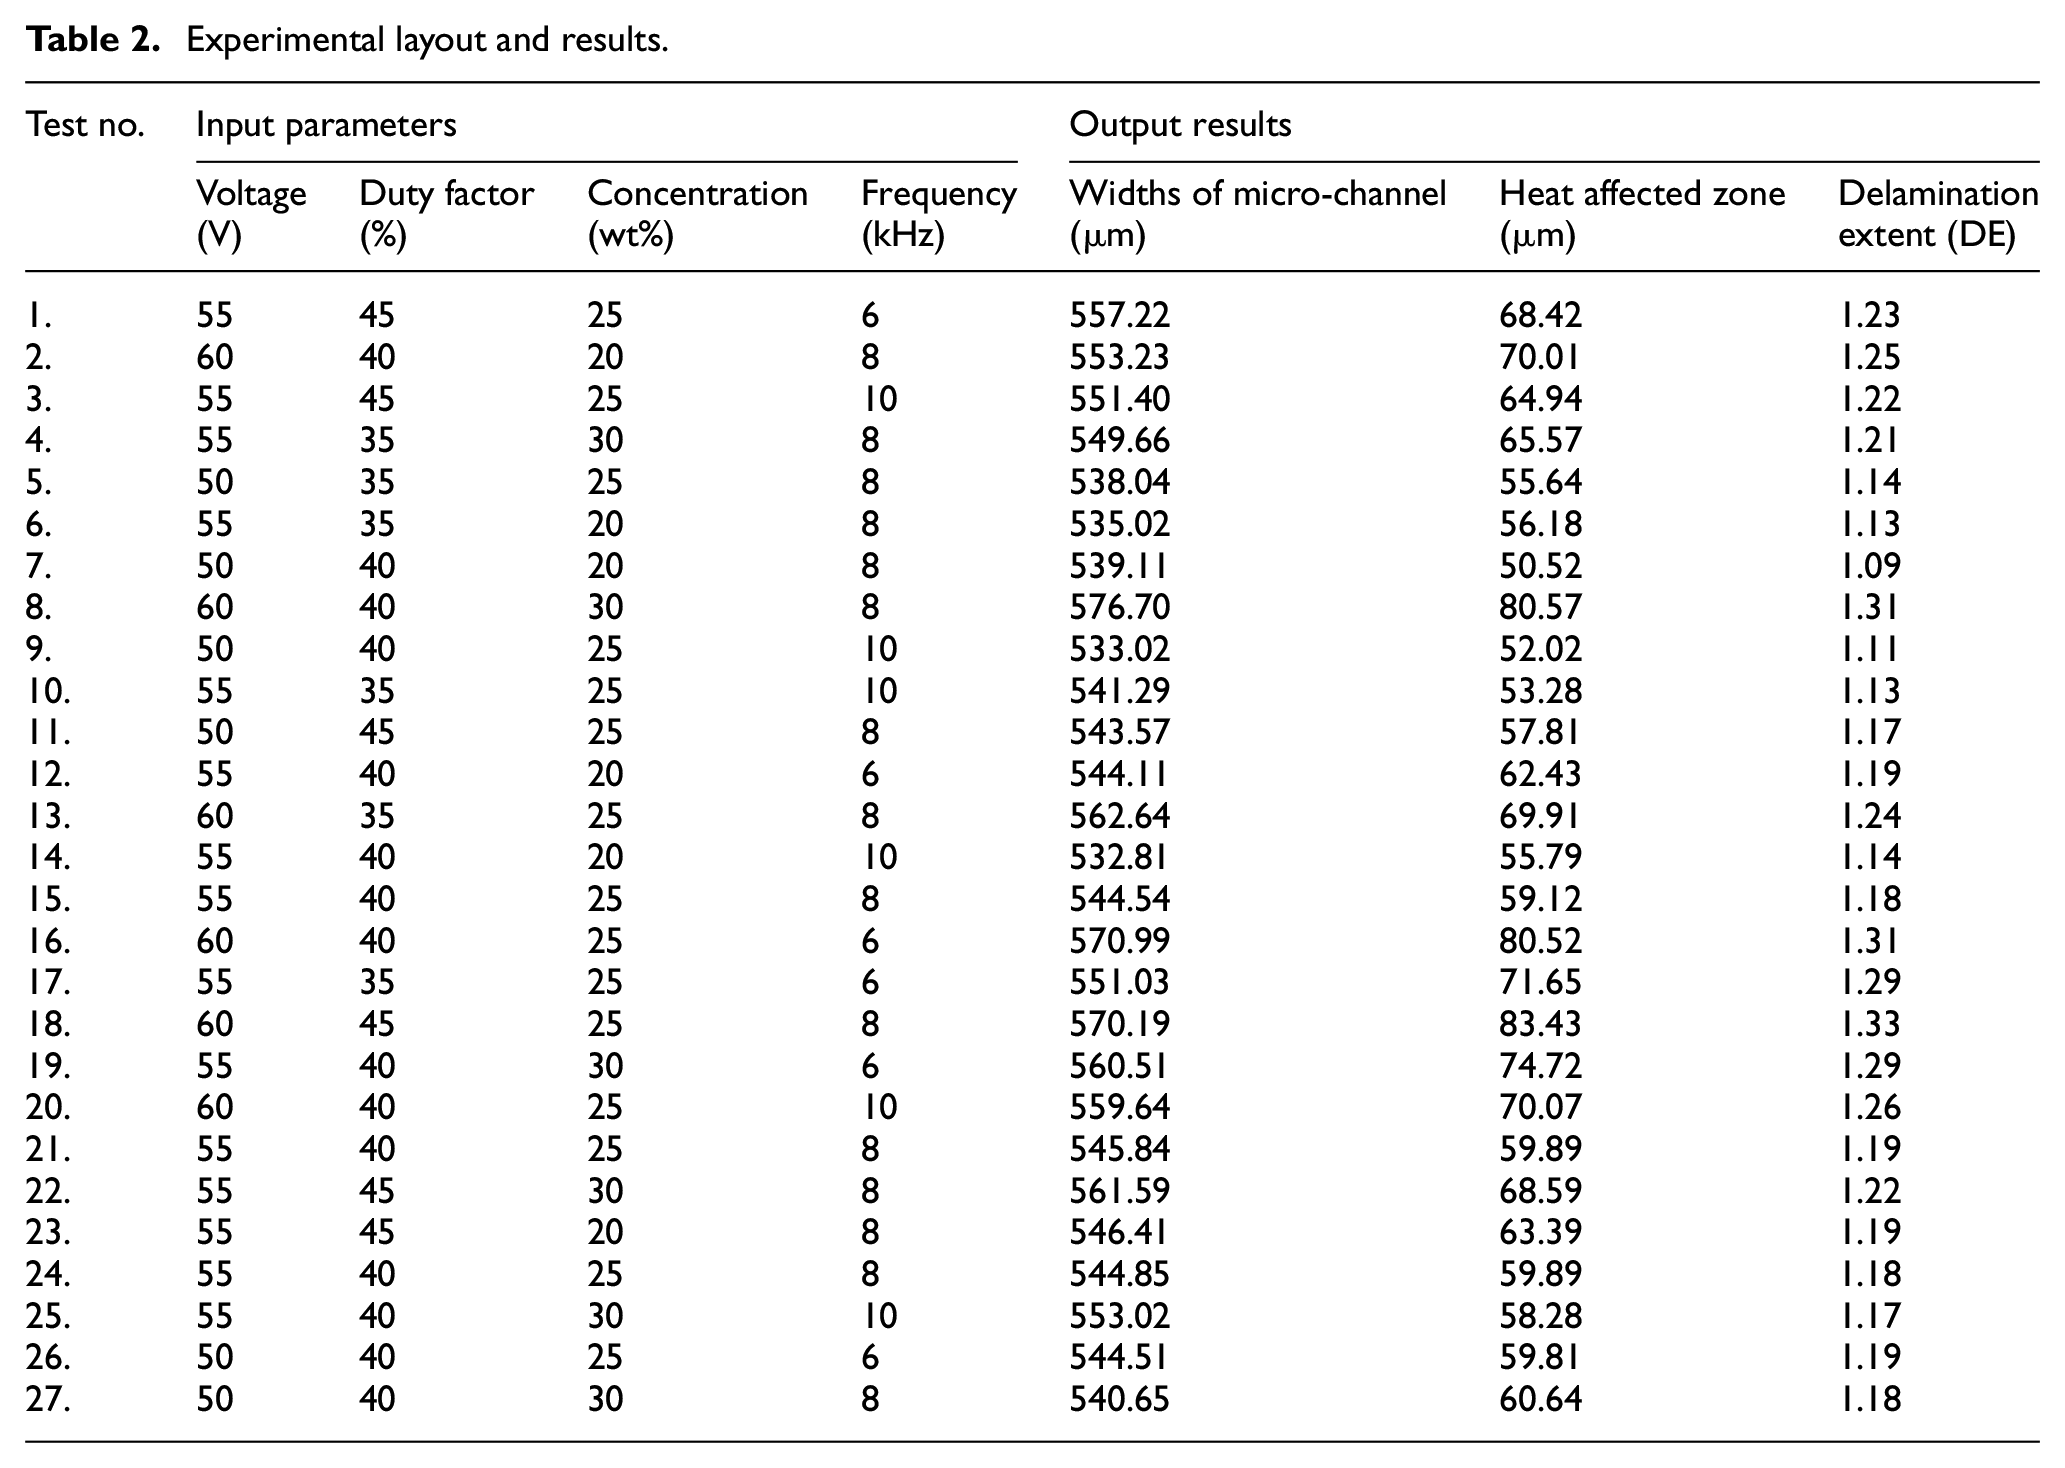
The Box–Behnken design of response surface methodology (RSM) has been selected to perform the experiments. A total of 27 experiments have been designed. The four independent input cutting parameters and their three levels consider in this study are applied voltage (V): 50–60 V; Duty factor (D): 35%–45%; Concentration (C): 20–30 wt%; and frequency (F): 6–10 kHz respectively. A micro channel of depth 50 µm and the long straight cut of length 3000 µm have been made. Each set of experiments has been repeated two times to ensure the repeatability of the result and to eliminate the influence of unknown factors; experiments were conducted in random order.
The machining quality of the fabricated micro-channel has been quantified by measuring the micro-channel widths, delamination extent, and width of the heat affected zone by using an optical microscope (OLYMPUS 35) with magnification 10×. The variations of widths of micro-channel (WMC) have been measured at ten random positions along the lengths of micro-channel of 3000 µm at the top of the machined surface viz. W1, W2…W9, and W10. The mean of measured width is considered for analysis. The schematic and actual measuring of micro-channel width has been represented in Figure 5(a) and (b).
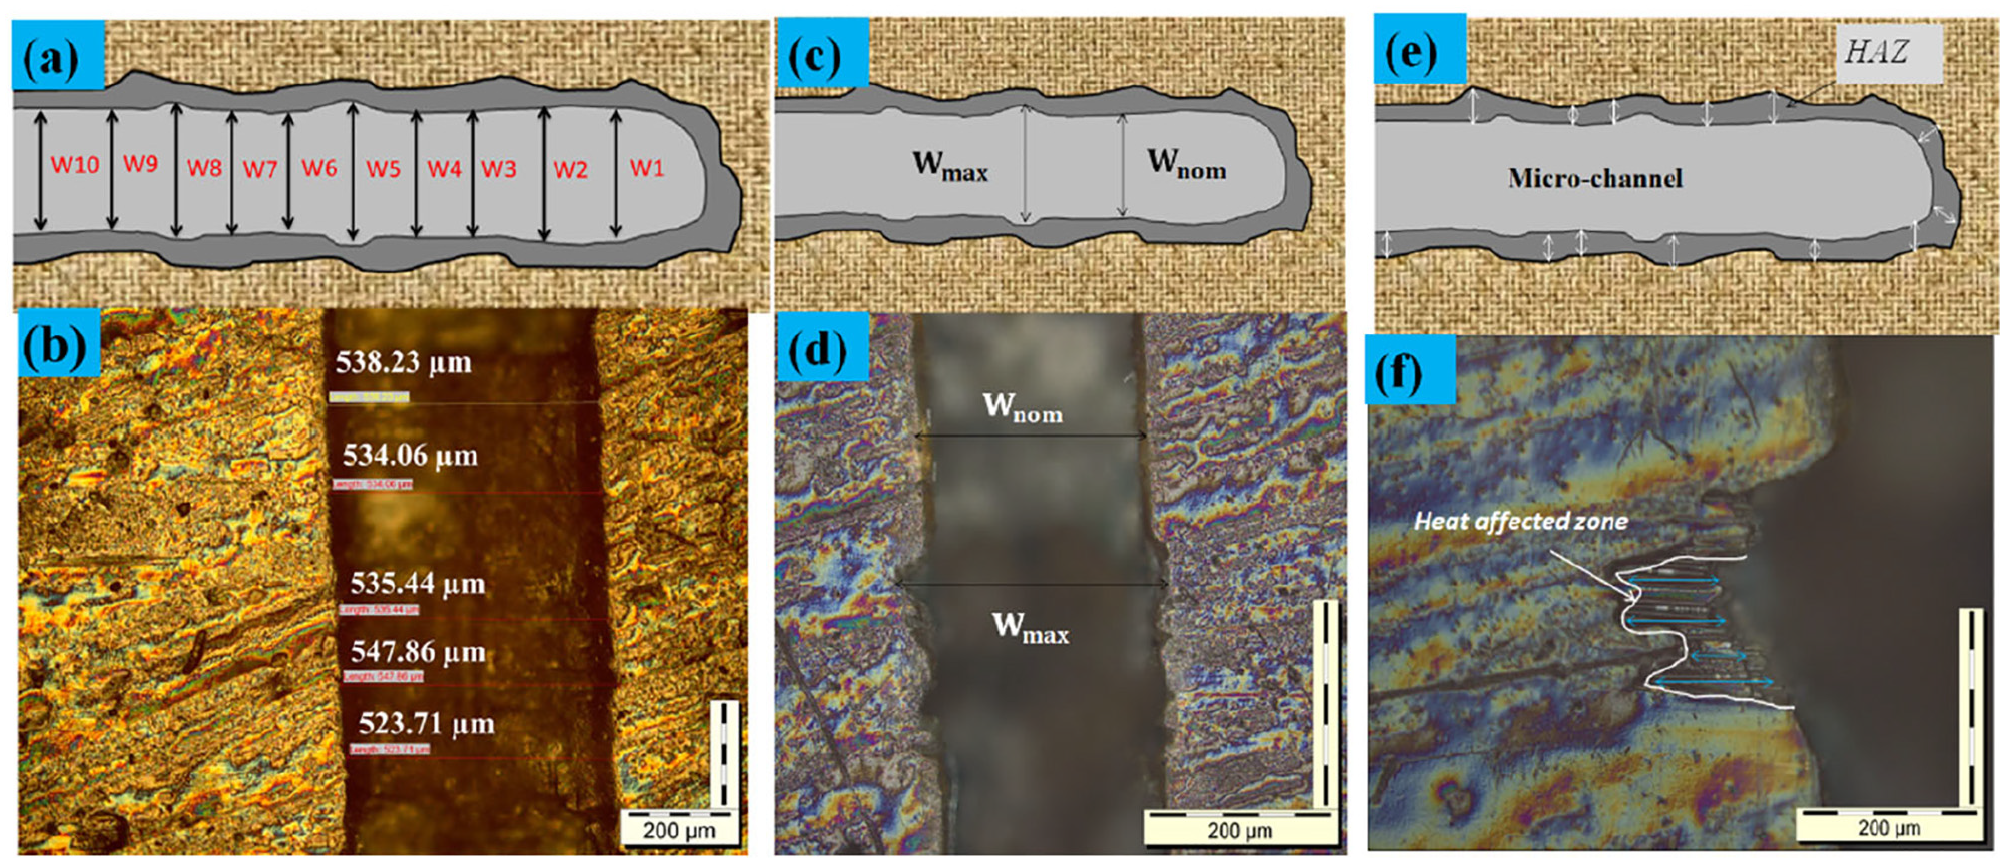
Width of micro-channel (WMC), Delamination extent (DE), and Heat affected zone (HAZ) measurements scheme (a, c, and e) Schematic measurement (b, d, and f) Actual measuring scheme in Optical microscope.
Delamination extent gives the extent of micro-channel width damage, and it is defined by
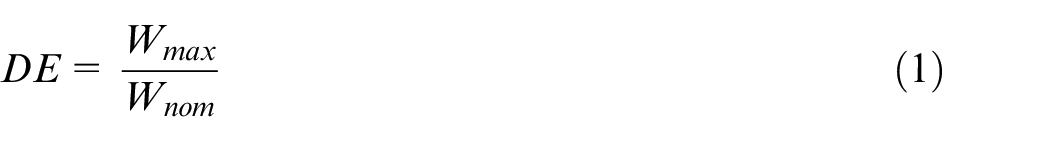
Where DE is delamination extent, Wmax is the width of maximum delamination damage of the micro-channel, and Wnom is the nominal channel width, as shown in Figure 5(c) and (d). The delamination damage has been most profound only at the top surface of the channel; hence top surface has been considered for the evaluation.
The thermal interactions of sparks with the workpiece affect its physical and chemical properties. These leads to developed distinct heat-affected zones near the vicinity of the micro-channel edge. 32 Materials do not melt in these areas by thermal interaction; however, the microstructure of the region changes, which can be easily observed through a microscope. The heat-induced damage has been quantified by measuring the heat-affected zone (HAZ) at various positions on both sides of the micro channel width, and the mean is considered for analysis. The schematic and actual measurement of the HAZ is presented in Figure 5(e) and (f). The obtained measured value of the width of micro-channel (WMC), delamination extent, and HAZ for all sets of experiments have been shown in Table 2.
Experimental layout and results.
Response surface methodology
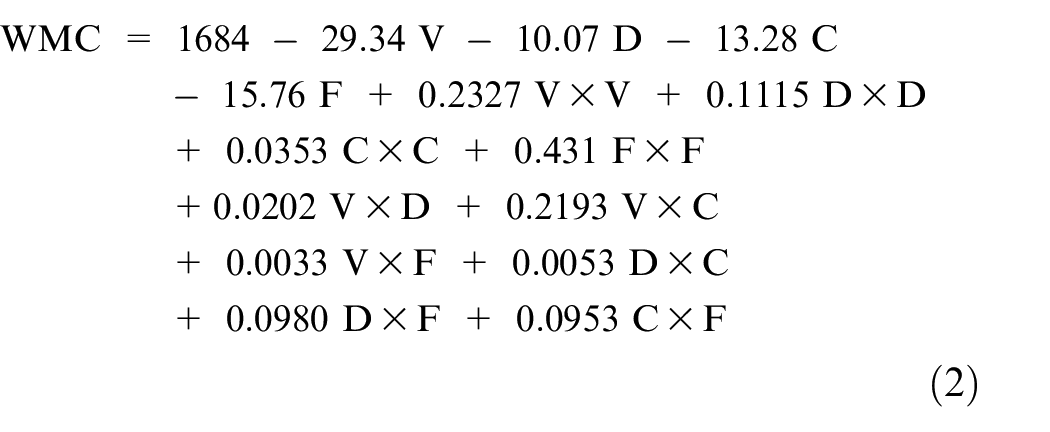
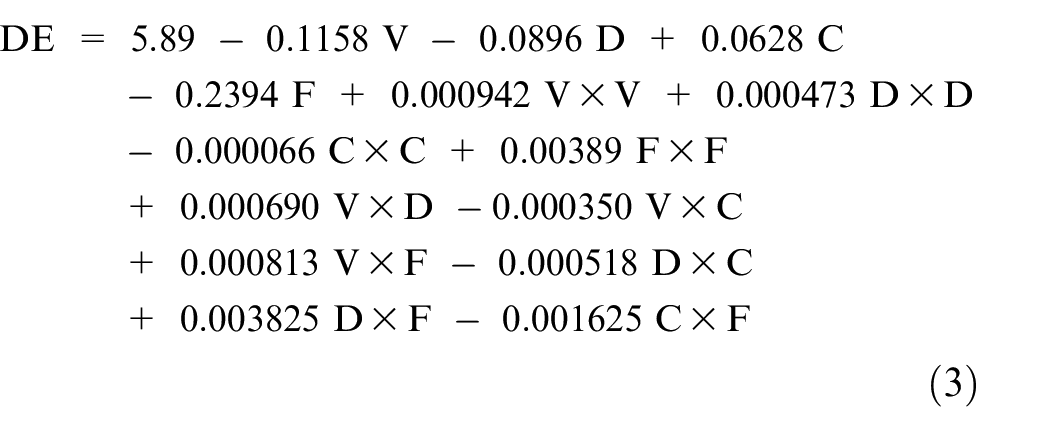
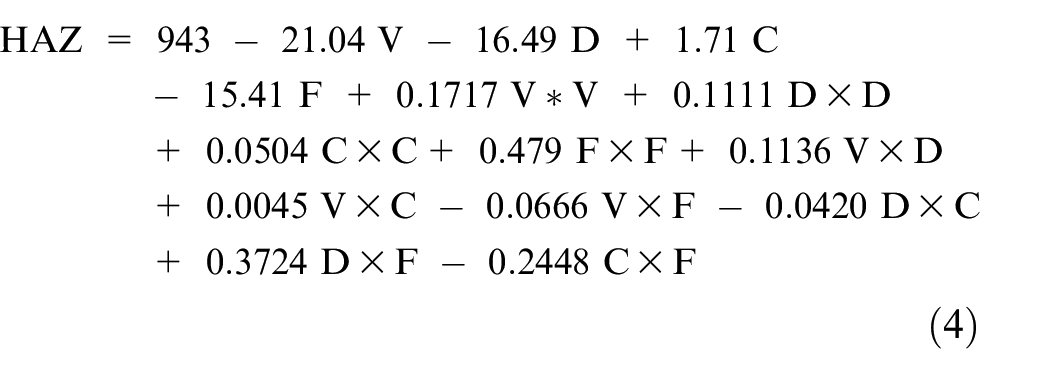
Response surface methodology is a collection of mathematical and statistical techniques extensively used for designing the experiment, developing the regression model, and optimization of response properties with least possible experiments. In order to evaluate the regression model and optimize a response (output properties) that is affected by many independent input variables, it uses quantitative data from the associated experiment.1,32,33,40,41 In the present work, MINITAB 17 statistical software is used to develop the regression model of WMC, DE, and HAZ. The developed model has been presented in equations (2)–(4).
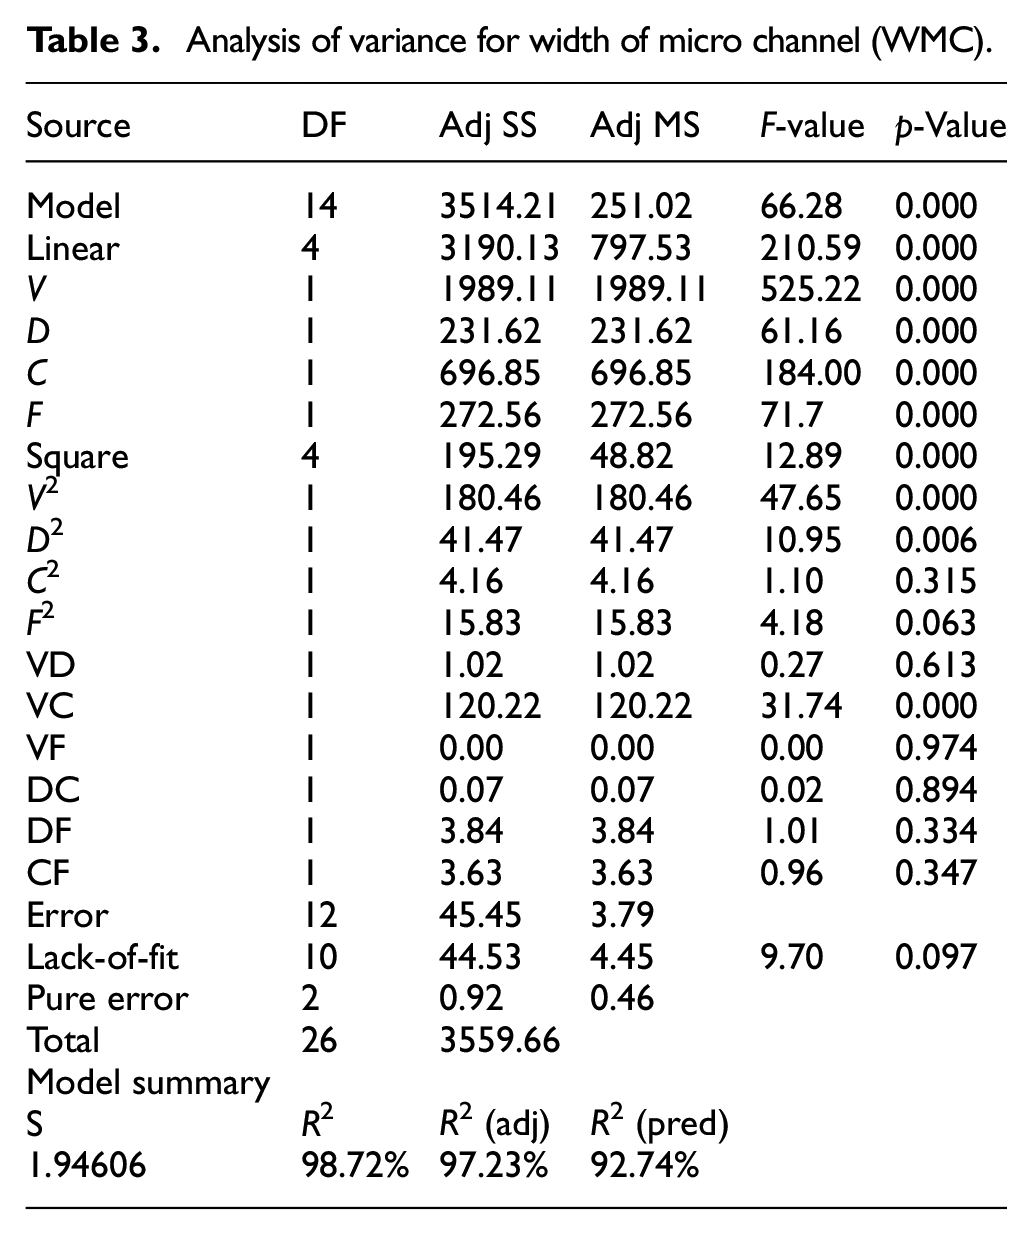
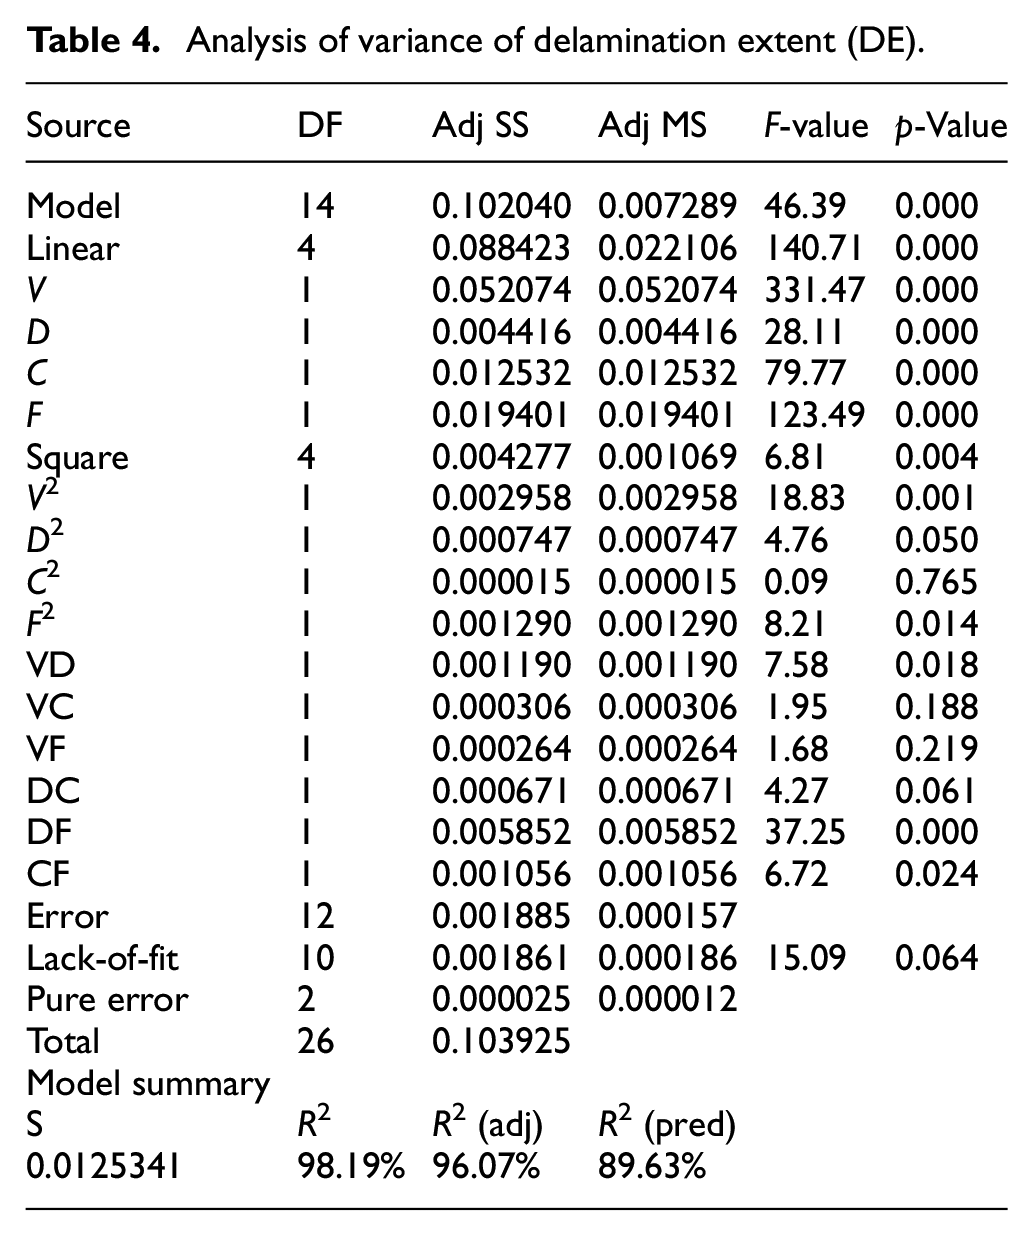
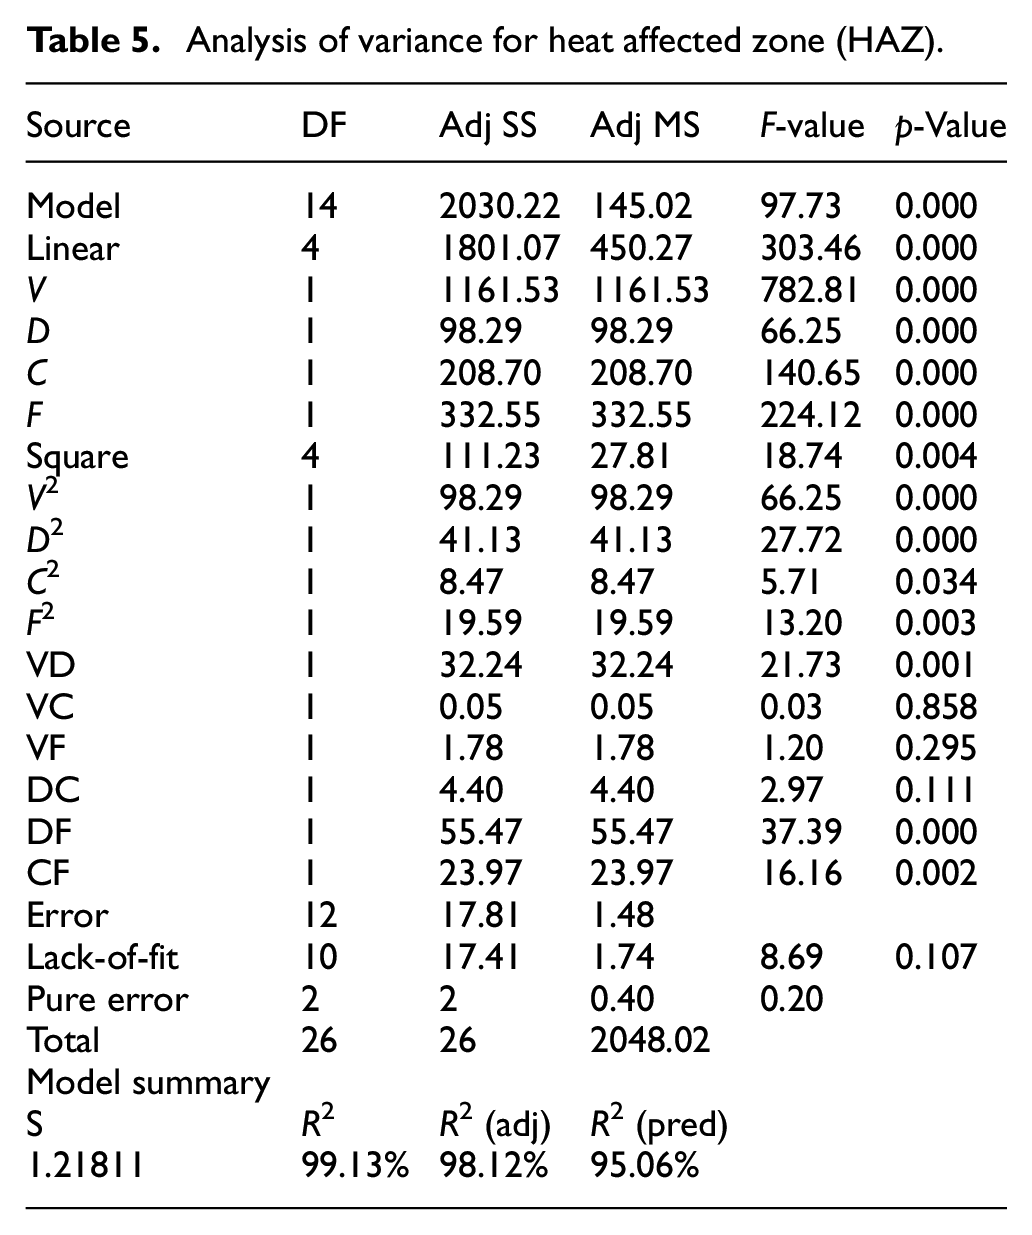
Further, to understand the impact of each input machining parameter on the experimental study, the analysis of variance (ANOVA) has been performed at a 95% confidence level. The ANOVA results for WMC, DE, and HAZ have been shown in Tables 3 to 5. The value of “p” for all the output parameters is less than 0.05, which is regarded as statistically important. The lack-of-fit in the ANOVA table for the performance parameters is insignificant, which is desirable. Nevertheless, the higher the “F” value indicates the significance of input parameters on the machining performance. In addition, the R-square (R2), adjusted R-square (R2 (adj)), and Predicted R-square (R2 (Pre)) value for WMC model is 98.72%, 97.23%, and 92.74%. For delamination extent, the value of R2, R2 (adj), and R2 (Pre) are 98.19%, 96.07%, and 89.63% respectively. Similarly, the value of R2, R2 (adj), and R2 (Pre) for HAZ are 99.13%, 98.12%, and 95.06%, respectively. Hence the model is significant. The various interaction graphs are plotted and presented in Figures 6 to 8.
Analysis of variance for width of micro channel (WMC).
Analysis of variance of delamination extent (DE).
Analysis of variance for heat affected zone (HAZ).
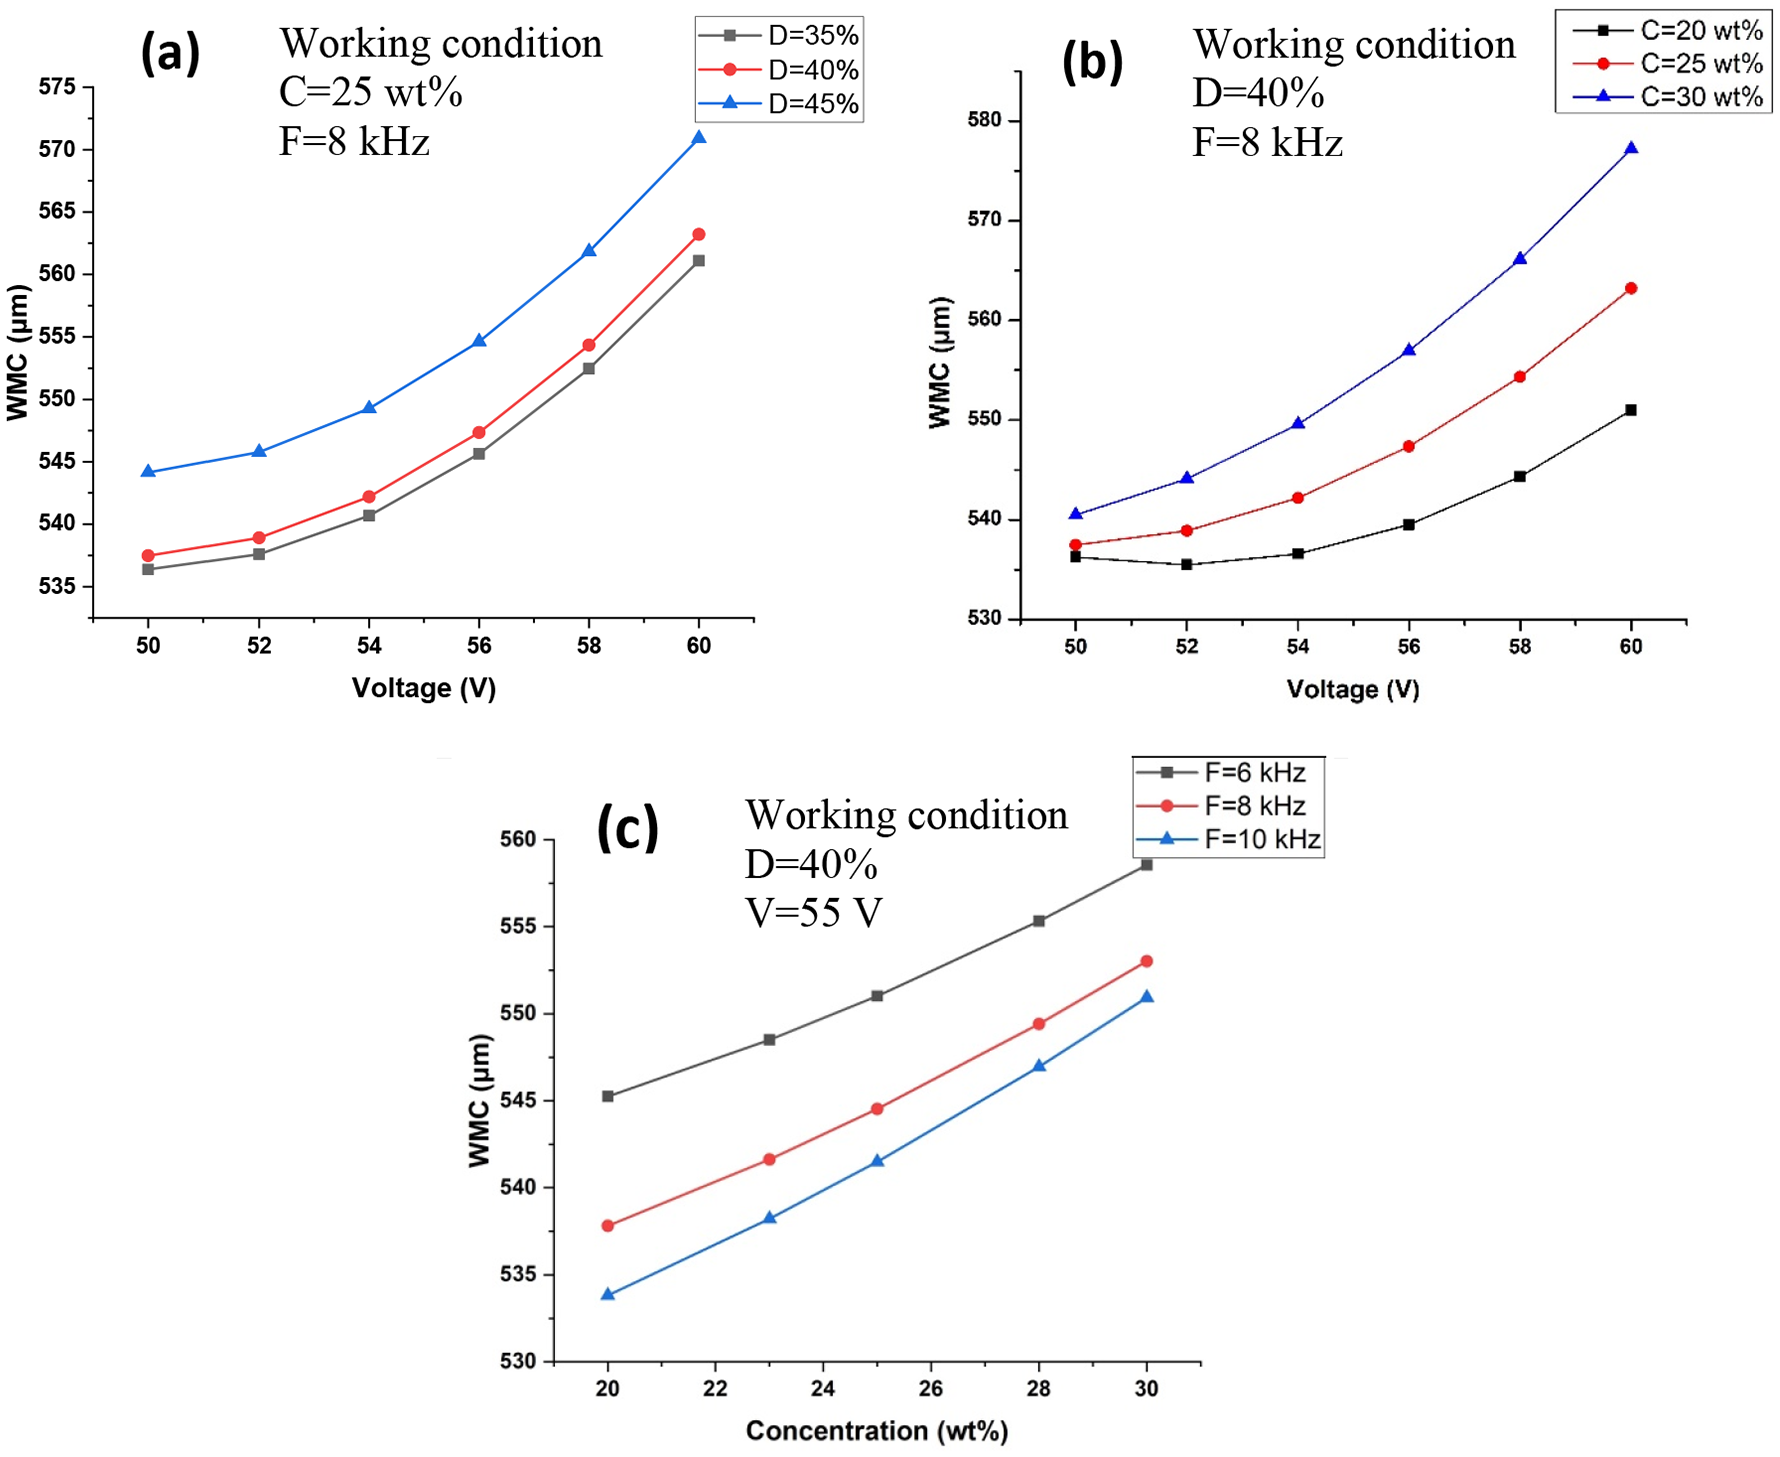
Effect of applied voltage on the WMC (a) at various duty factors and (b) at various concentration of electrolyte. Effect of concentrations on the WMC (c) at various frequency.
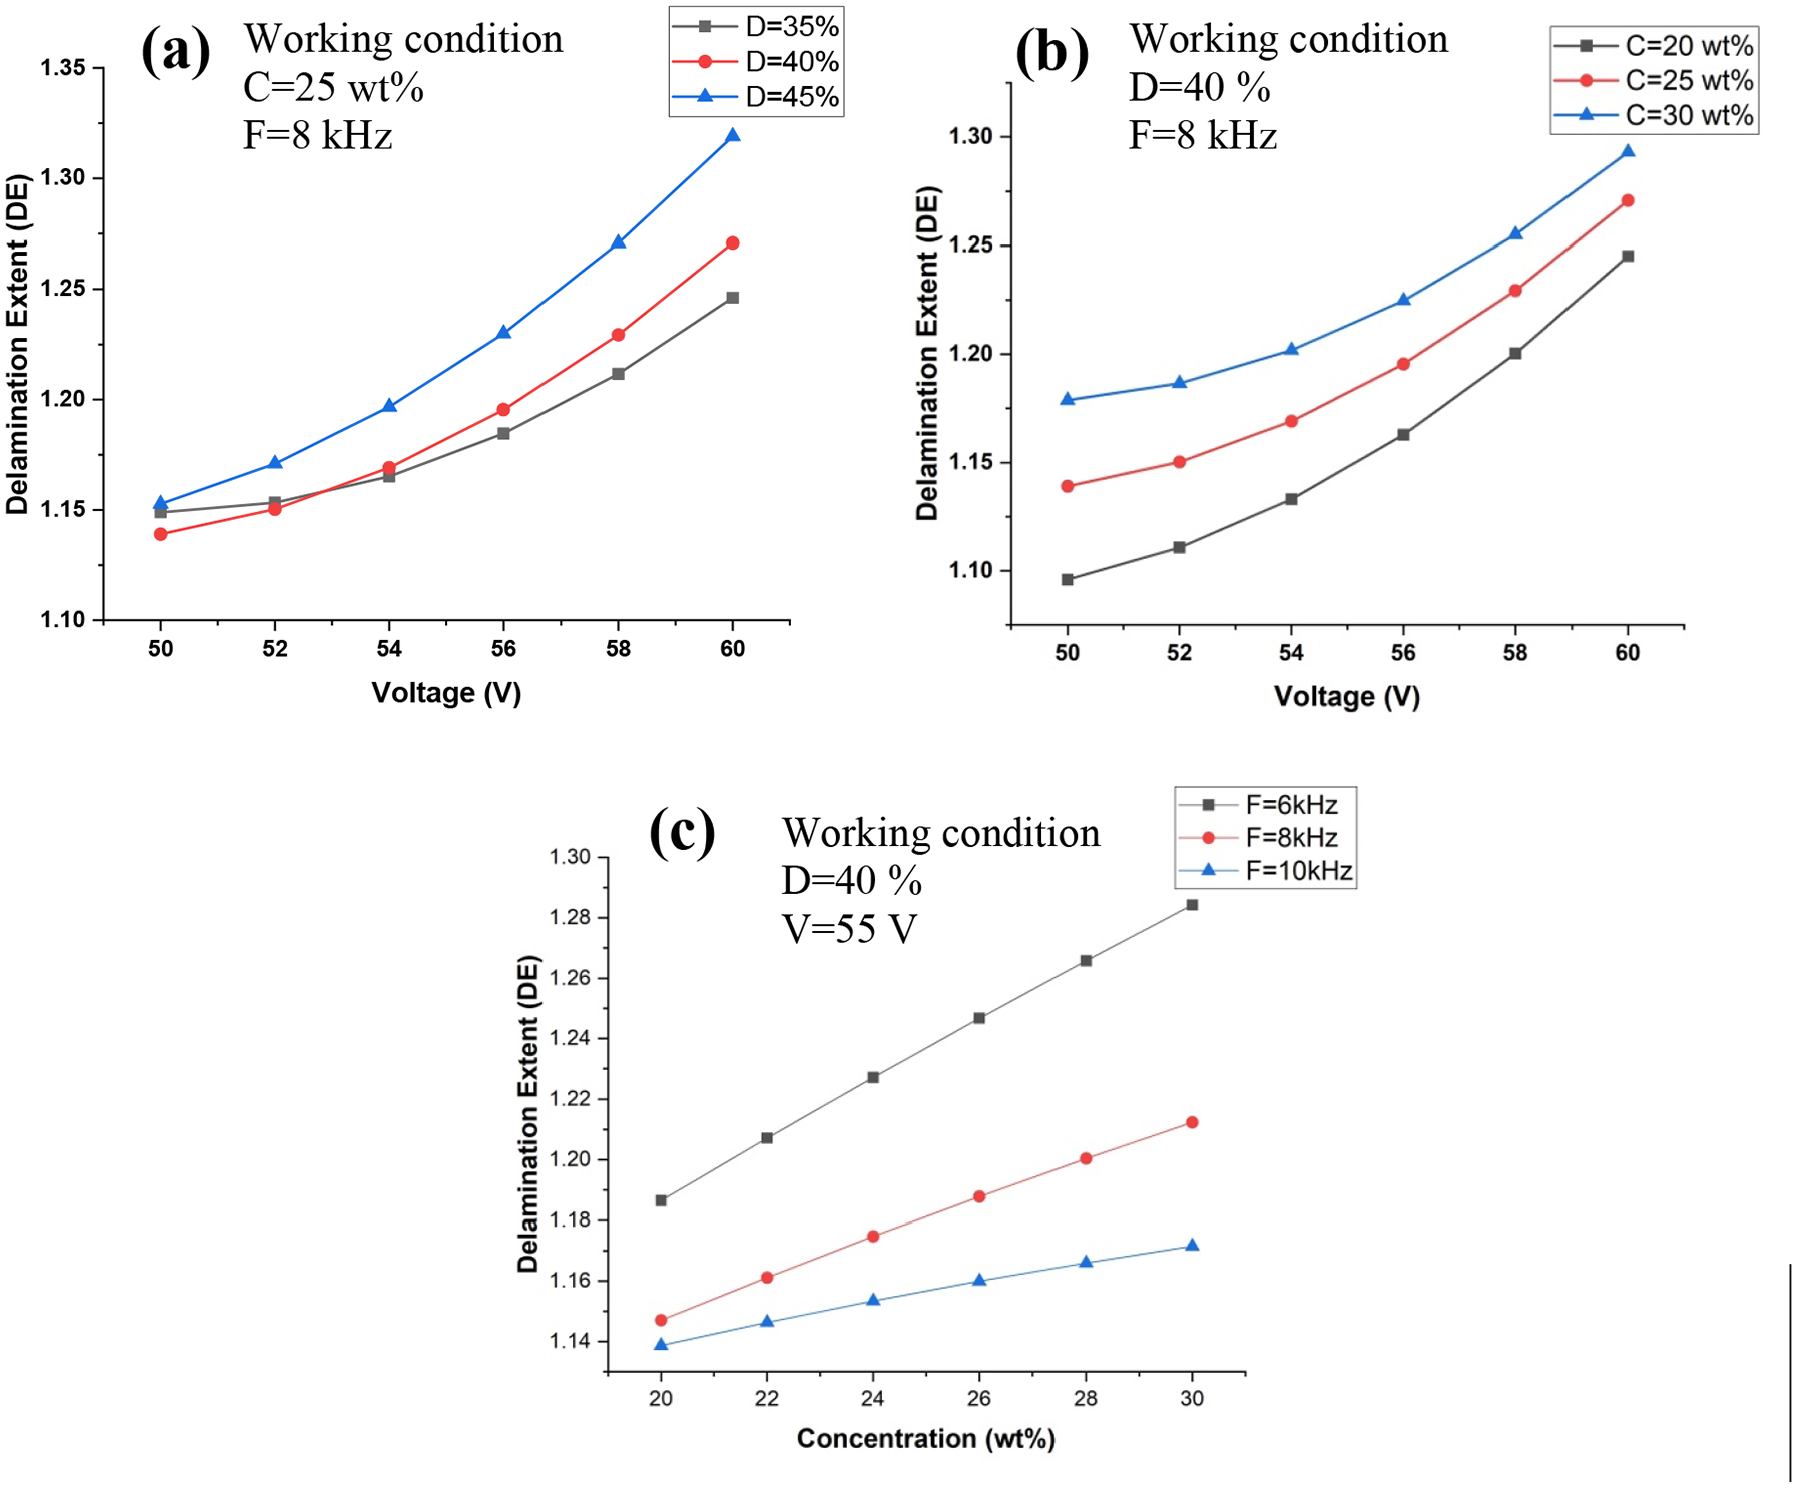
Effect of applied voltage on the DE (a) at various duty factors and (b) at various concentration of electrolyte. Effect of concentrations on the DE (c) at various frequency.
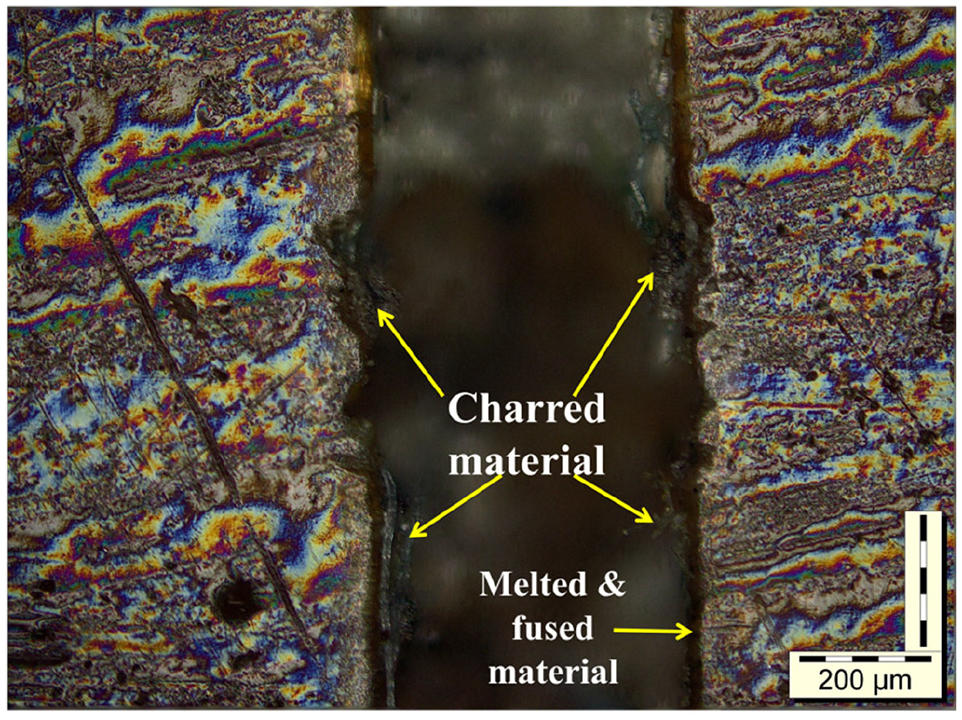
Optical microscope image of charred, melted, and fused material at the edge of the micro-channel.
Result and discussion
The influence of parameters on the machining efficiency of the micro-ECSM process has been studied. The RSM models that have been produced are used to obtain WMC, DE, and HAZ in variable process parameters combinations. In this regard, the equation developed by the MINITAB 17 software that is, equations (2)–(4) are used to generate a set of data. After that, the data is used to make graphs in order to investigate the effects of process parameters on WMC, DE, and HAZ, as shown in Figures 6 to 8 respectively.
Influence of process parameters on the width of micro channel (WMC)
Micro-channel width is the significant performance parameter that defines the machining quality. It has been varied along the sectional length of the workpiece. Various graphs (Figure 6(a)–(c)) are plotted using equation (2) to examine the impact of process parameters on average WMC. Figure 6(a) reveals the impact of voltage by considering the concentration of electrolyte and frequency constant. It is observed that WMC maximizes by increasing the voltage and duty factor. With an increase in applied voltage, the rate of bubble formation rises and accumulates over the tool electrode. Subsequently, small bubbles start coalescence to form a thick gas film around the tool electrode. The breakdown of thick gas film produces a high intensity of a spark. Hence at the higher voltage, the WMC is significantly increasing. 34 Similar trends were also reported by Cao et al. 24 during micro-milling of soda lime glass at voltage ranges from 23 to 27 V. At applied 60 V, the WMC is maximum, that is, 576.70 µm. On the other hand, with increase in duty factor from 35% to 45% leads to a rise in the duration of the spark in the machining zone and delivers more thermal energy, which produces wider WMC. Teicher et al. 14 noticed the comparable observation during machining of carbon fiber-reinforced plastics with micro-EDM process and concluded that at longer pulse duration, the lateral gap between the tool and workpiece rises to 34–44 µm. A increasing trend is also observed in Figure 6(b) and (c), where the influence of voltage, concentration, and frequency is investigated. With increase in concentrations of the electrolyte, the mobility of the ions in the solution increases. This resulted in the enhancement of bubble formation rate and intensity of the discharge. Hence, more thermal energy is generated at the discharge zone 15 caused by the wider WMC. In the case of increasing frequency from 6 to 10 kHz, the WMC is noticeably decreased. This is mainly due to an increase in the number of discharges, which caused the reduction in pulse width. Hence, less energy is delivering per spark, which leads to minimum WMC.
The F test-value in the ANOVA Table 3 depicts voltage as the most significant parameter followed by the concentration of the electrolyte, frequency, and duty factor. The interaction effects of voltage and concentration is observed to be significant whereas other interactions parameter has no significant effects on each other. The optimization of single parameters shows the minimum WMC to be 529.79 µm at voltage 52.02 V, duty factor 35.60%, electrolyte concentration 20 wt%, and frequency 10 kHz.
Influence of processes parameters delamination extent (DE)
Delamination extent defines the quality of the fabricated micro-channel. It should be minimum to maintain the straightness of the micro-channel along the length. Delamination mainly happens due to the occurrence of high intense spark, which melts and vaporized the glass fiber and resin matrix. Another possible reason is the sticks and jumps action of the micro tool. In this state, a bump of melted glass fiber and resin formed at the traveling path of the tool because of improper flushing action. These bumps stuck the micro tool and bend it. 35 Due to this duration of discharge increases at that point and resulted in higher delamination.
Figure 7(a) to (c) shows the effect of input parameters on the delamination extent. It observed that with a rise in voltage, duty factor, and electrolyte concentration, the average delamination extent significantly increases. On the other hand, for the frequency, it is vice versa. It can be explained as an increase in voltage lead to the formation of the thicker gas film around the tool electrode as discussed in the above section and hence, high intensity of the spark formed near the machining zone. Similarly, increasing the spark duration creates high thermal energy around the tool surface and workpiece, which melts and vaporized the fiber and resin and increases the delamination extent. A similar observation was reported by the Manna and Narang 17 while fabricating micro hole in e-glass fiber. In Figure 7(a), the delamination extent at voltage 50 V is more for 35% duty factor than 40%. This can be elaborated as at lower voltage and duty factor, the intensity of spark is less as well as for short duration. Due to this, more time is required for bubbles to coalesce and grow in size. This resulted in thicker and unstable gas film formation and produced a more significant dimensional deviation of micro-channel. 36
Similarly, rise in electrolyte concentration (Figure 7(c)), the delamination extent increases due increase in mobility of ions in the solution, which helps to enhance the intensity of the discharge. Also, the mean current rises, which improves the discharge energy. Nevertheless, delamination significantly decreases at 10 kHz frequency compared to 6 kHz due to a reduction in pulse width per discharge. This can be explained as by increasing the frequency rate, energy per discharge is declining due to a reduction in pulse width. The minimum delamination extent, that is, 1.09, has been obtained at voltage 50 V, 40% duty factor, and 20 wt% electrolyte concentration.
The ANOVA table’s F test-value (Table 4) depicts voltage as the most significant parameter followed by the frequency, concentration of electrolyte, and duty factor. The interaction effects of VD, CF, and DF are observed to be significant whereas other interactions parameter has no significant effects on each other. Using single parameters optimization shows optimal delamination extent to be 1.0408 µm at optimum condition voltage = 50 V, D = 35%, C = 20 wt%, and F = 10 kHz.
Influence of processes parameters on heat-affected zone (HAZ)
The heat-affected zone is the area around the micro-channel cut, whose microstructure is altered because of the peak temperature. The extent of the thermal damage in the HAZ is distinguished by the removal of the epoxy matrix from the glass fibers (Figure 5(f)). In contrast to epoxy reinforcement, the conduction of heat through the fibers has been quick because of variable thermal conductivity. Moreover, at the edge of the fabricated micro-channel, charred materials are observed under the optical microscope as black in color as shown in the Figure 8. In the presence of high thermal energy, the glass fiber ends are melted and fused with each other (Figure 8). The similar observation was reported by Rao et al. 1 while performing the experiments on GFRP and concluded that minimum HAZ obtained with Fiber Laser at their set machining parameters was 100.48 µm.
The influence of input machining parameters on HAZ has been presented in Figure 9(a) to (c). It observed that with increasing the voltage, duty factor, and concentration of the electrolyte, the HAZ is significantly increased. In the present investigation, the average HAZ varies from 50.52 to 83.42 µm. With a rise in voltage, more thermal energy is generated at the machining zone, which spreads in a wider range of the tool electrode of the micro-channel. 46 Similarly, the duration of the spark is increased as the duty factor increases. It causes a higher temperature at the processing region, which accelerates the charring of the epoxy and results in a larger area of thermal damage. 8 It is noticed that initially, at D = 35%, the HAZ is more as compare to D = 40% and then starts reducing after 55 V. It can be elaborated as at lower voltage and duty factor, an unstable gas film formed which causes higher discharge as explained in the above section.
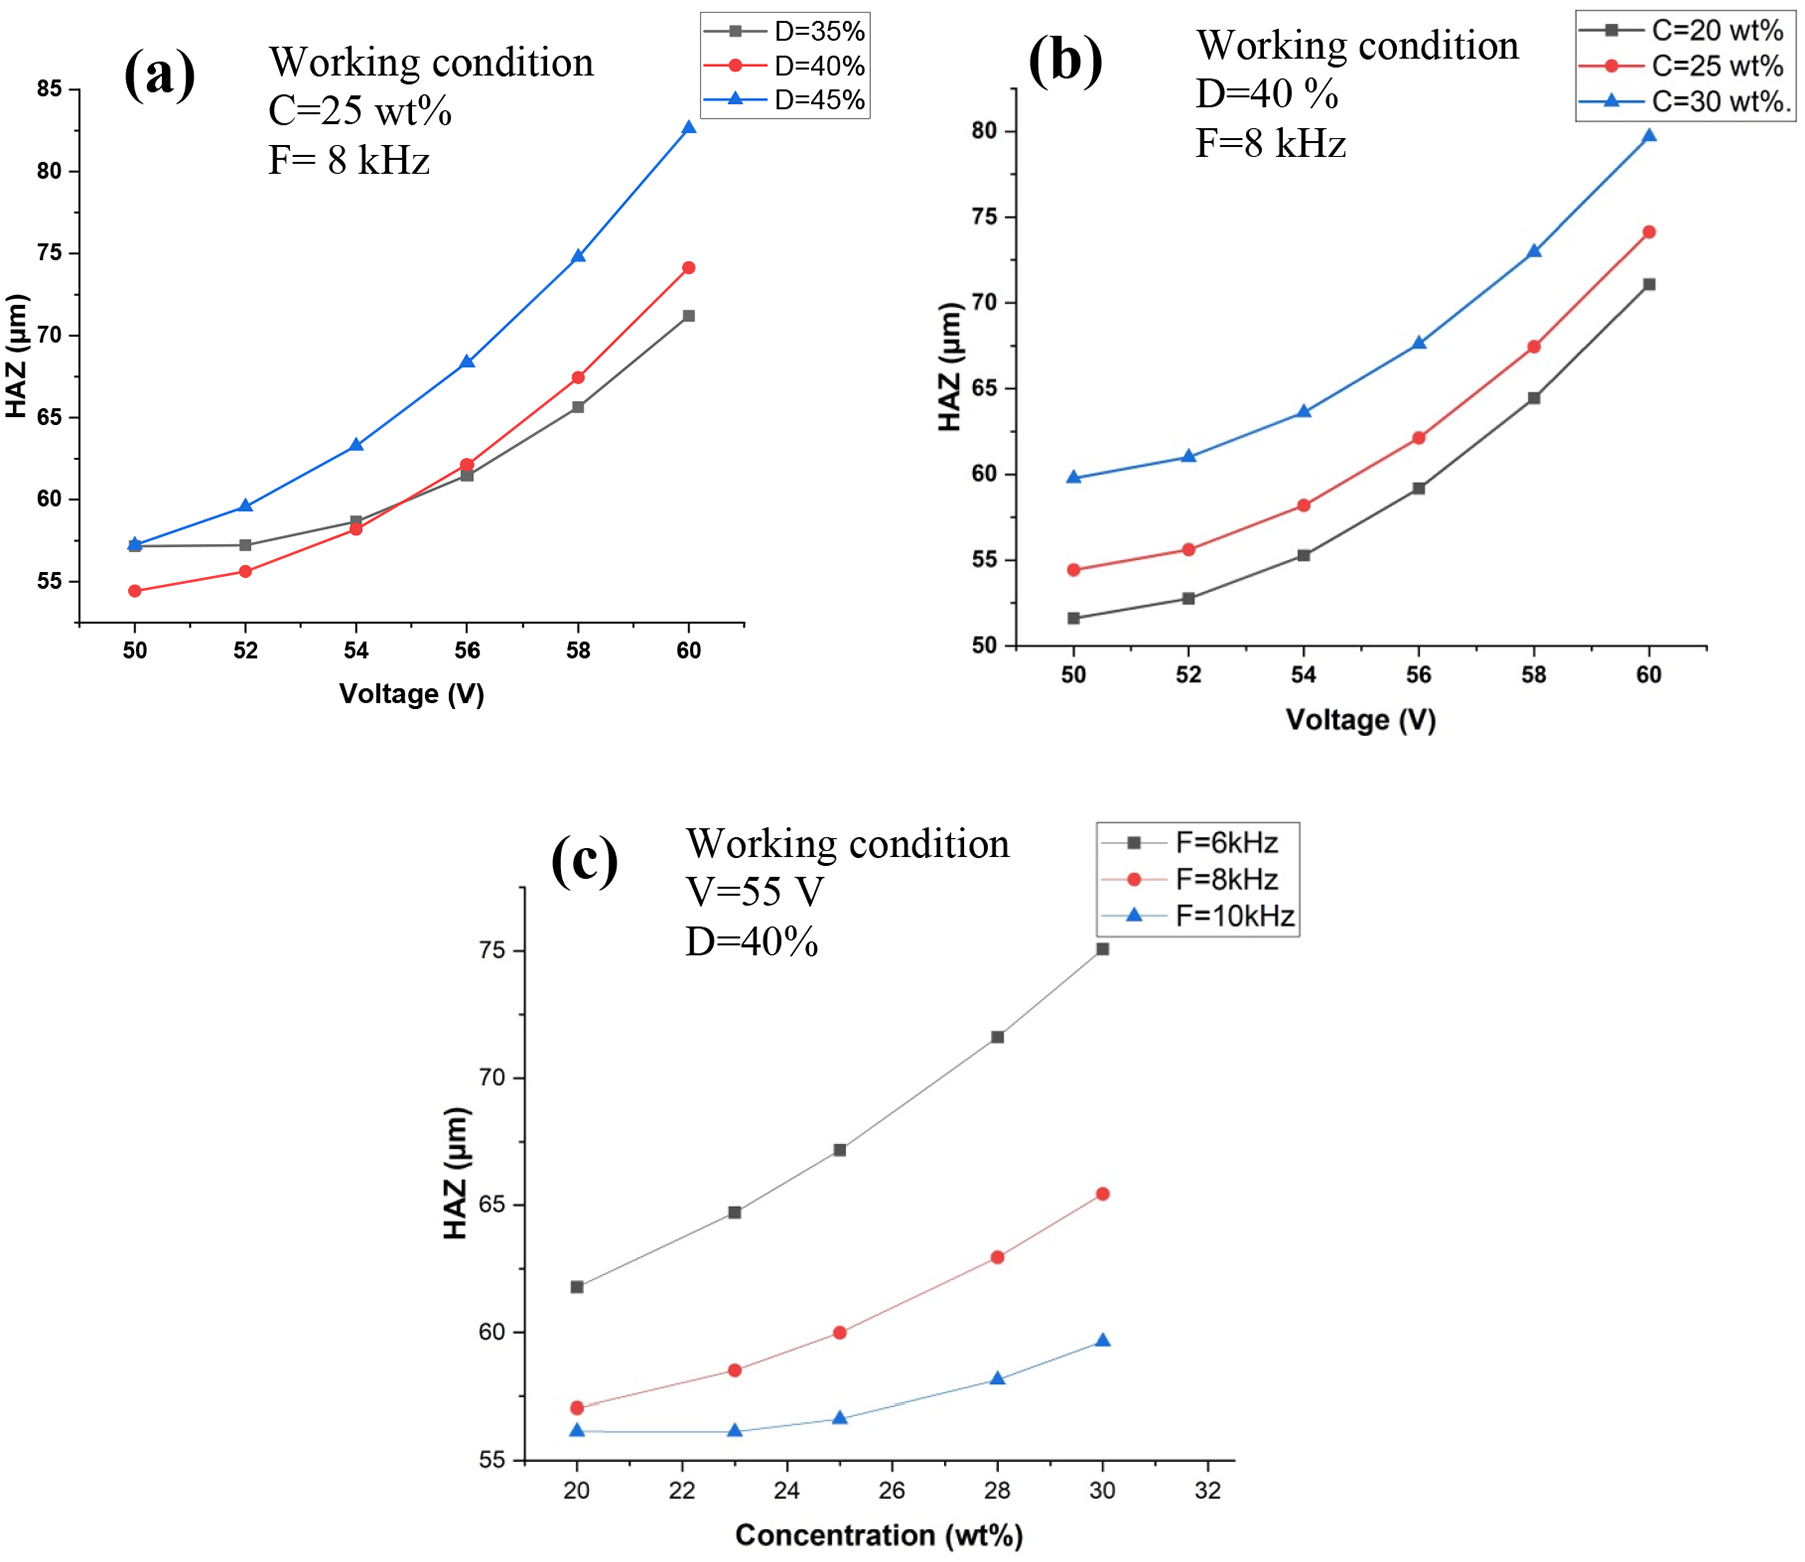
Effect of applied voltage on the HAZ (a) at various duty factors and (b) at various concentration of electrolyte. Effect of concentrations on the HAZ (c) at various frequency.
At higher concentration of electrolyte, more intense and tiny bubbles formed around the tool electrode. 37 This caused high thermal energy discharge near the machining zone and resulted in a larger thermal damage area. Similar observation were also reported by Verma et al. 15 while varying the concentration from 10% to 30% (w/v), leading to HAZ in the range of 11.8–35.2 µm. It also observed that with increasing the concentration, the chemical etching action enhanced and resulted in a smooth edge of the micro-channel. On the other hand, increasing the frequency, the pulse width significantly decreases, and hence more concentrated and less intense spark formed. Due to this, the machined surface shows less thermal damage region.
The F test-value and p-value in the ANOVA Table 5 depict all the machining parameters are significant in which voltage is the prominent factor followed by the frequency, concentration of electrolyte, and duty factor. In the case of effects of each interactions parameter, VD, CF, and DF presenting the significant effect whereas other interactions parameter has no significant effects on each other. Using single parameters optimization shows optimal heat affected zone to be 48.71 µm at optimum condition voltage = 51.41 V, D = 35%, C = 20 wt%, and F = 10 kHz.
Multi-objective optimization of process parameters
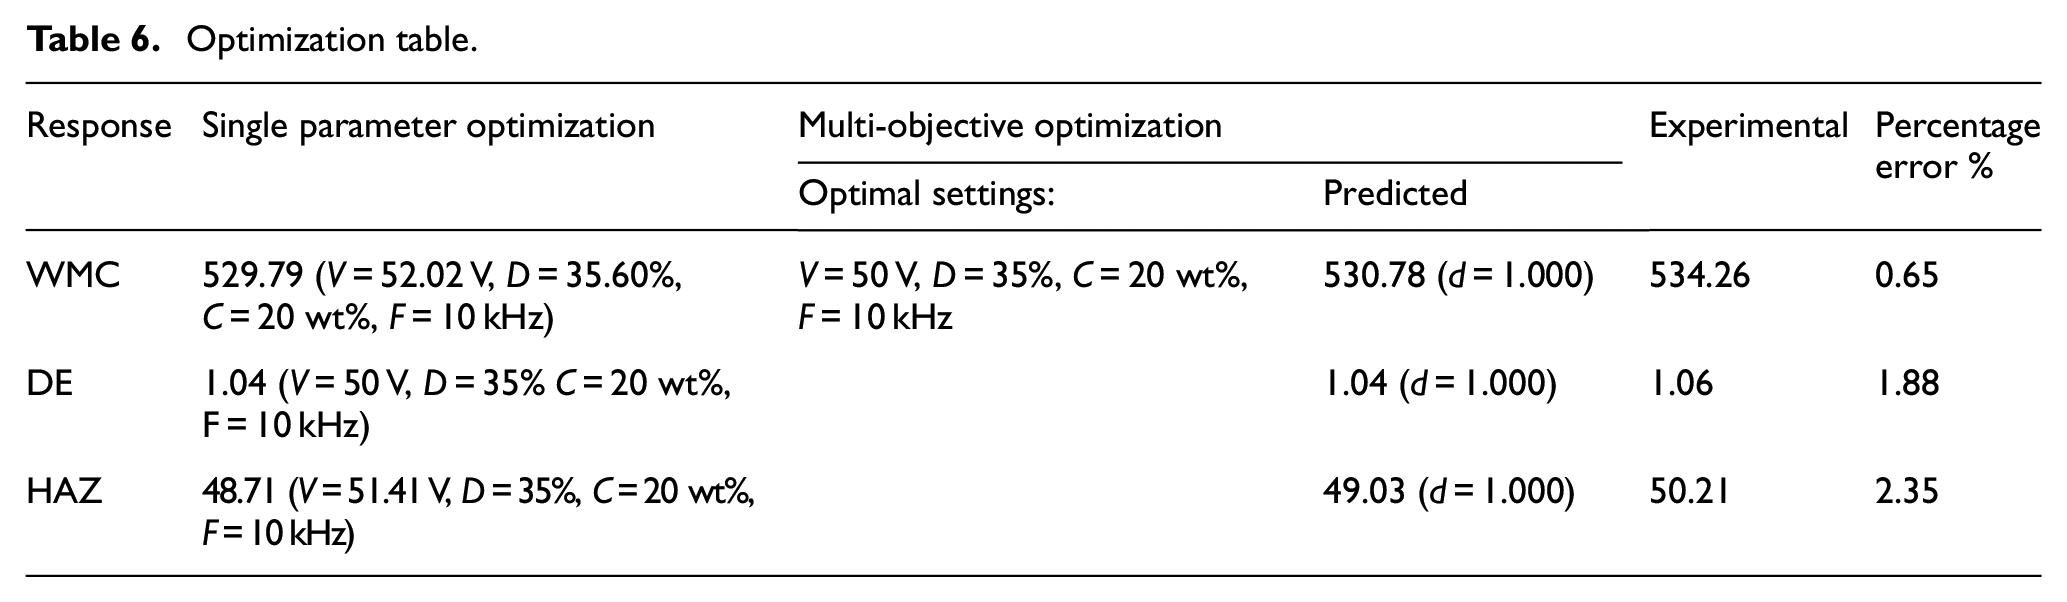
The output parameters viz. width of micro-channel (WMC), delamination extent (DE), and heat-affected zone (HAZ) are the vital response parameters consider in the current work which must be optimized. By using individual parameters optimization, only one parameter can be optimized at a time. Hence, to optimize all the responses simultaneously, multi-objective optimization is carried out by using the desirability function method. The response in this method has been changed into dimensionless quantity ranging from 0 (undesirable characteristic) to 1 (desirable characteristic). The composite desirability has been calculated by considering the geometric mean of all the individual desirability values.38,42,43 The optimization of output responses is carried out by considering the minimization of WMC, DE, and HAZ. The multi-objective optimum parameters for minimum WMC, Delamination extent, and HAZ is 530.78, 1.04, and 49.03 µm respectively at voltage = 50 V, duty factor = 35%, concentration = 20 wt%, and frequency = 10 kHz with the highest desirability of 1. Table 6 shows the optimum value of the responses with parameter settings. The confirmation test has been carried out at optimal parameters to validate the model. The measured result of the confirmation test, predicted value, and error is presented in the Table 6. The error for the width of micro-channel, delamination extent, and the heat-affected zone has been observed to be within 0.65%, 1.88%, and 2.35%, respectively. This shows that the produce results are very close to the predicted results.
Optimization table.
The edges of the micro-channel fabricated at optimum parameter (i.e. applied voltage = 50 V, duty factor = 35%, concentration = 20 wt%, and frequency = 10 kHz) is analyzed by using Field emission scanning electron microscope (FESEM) (Model: Supra 55, Make: Carl Zeiss, Germany) image. Figure 10(a) to (d) shows the quality of the micro-channel edge captured at different magnification for studying the wider or minute details simultaneously. The discharge phenomenon of micro-ECSM process causes the melting or charring of matrix which is adhere/re-deposited on the edge of the channel. 48 Fiber breakage is also noticed which is may be due to the stick and jump action of the micro tool (Figure 10(a) and (c)). The tip of the uncut fibers are observed as conical in shape (Figure 10(b) and (c)) which is mainly due to the electrochemical dissolution of the glass fiber 39 in the alkaline solution that is, NaOH electrolyte solution. Similar observation of uncut and burnt fibers were reported by the Mann et al. 17 Figure 10(d) shows the smooth edge which is due to the chemical etching of the edge in addition to proper melting and fused glass fiber matrix with each other. Harugade et al. 18 reported the similar observation during machining of Carbon Epoxy Composite with micro-ECSM process.
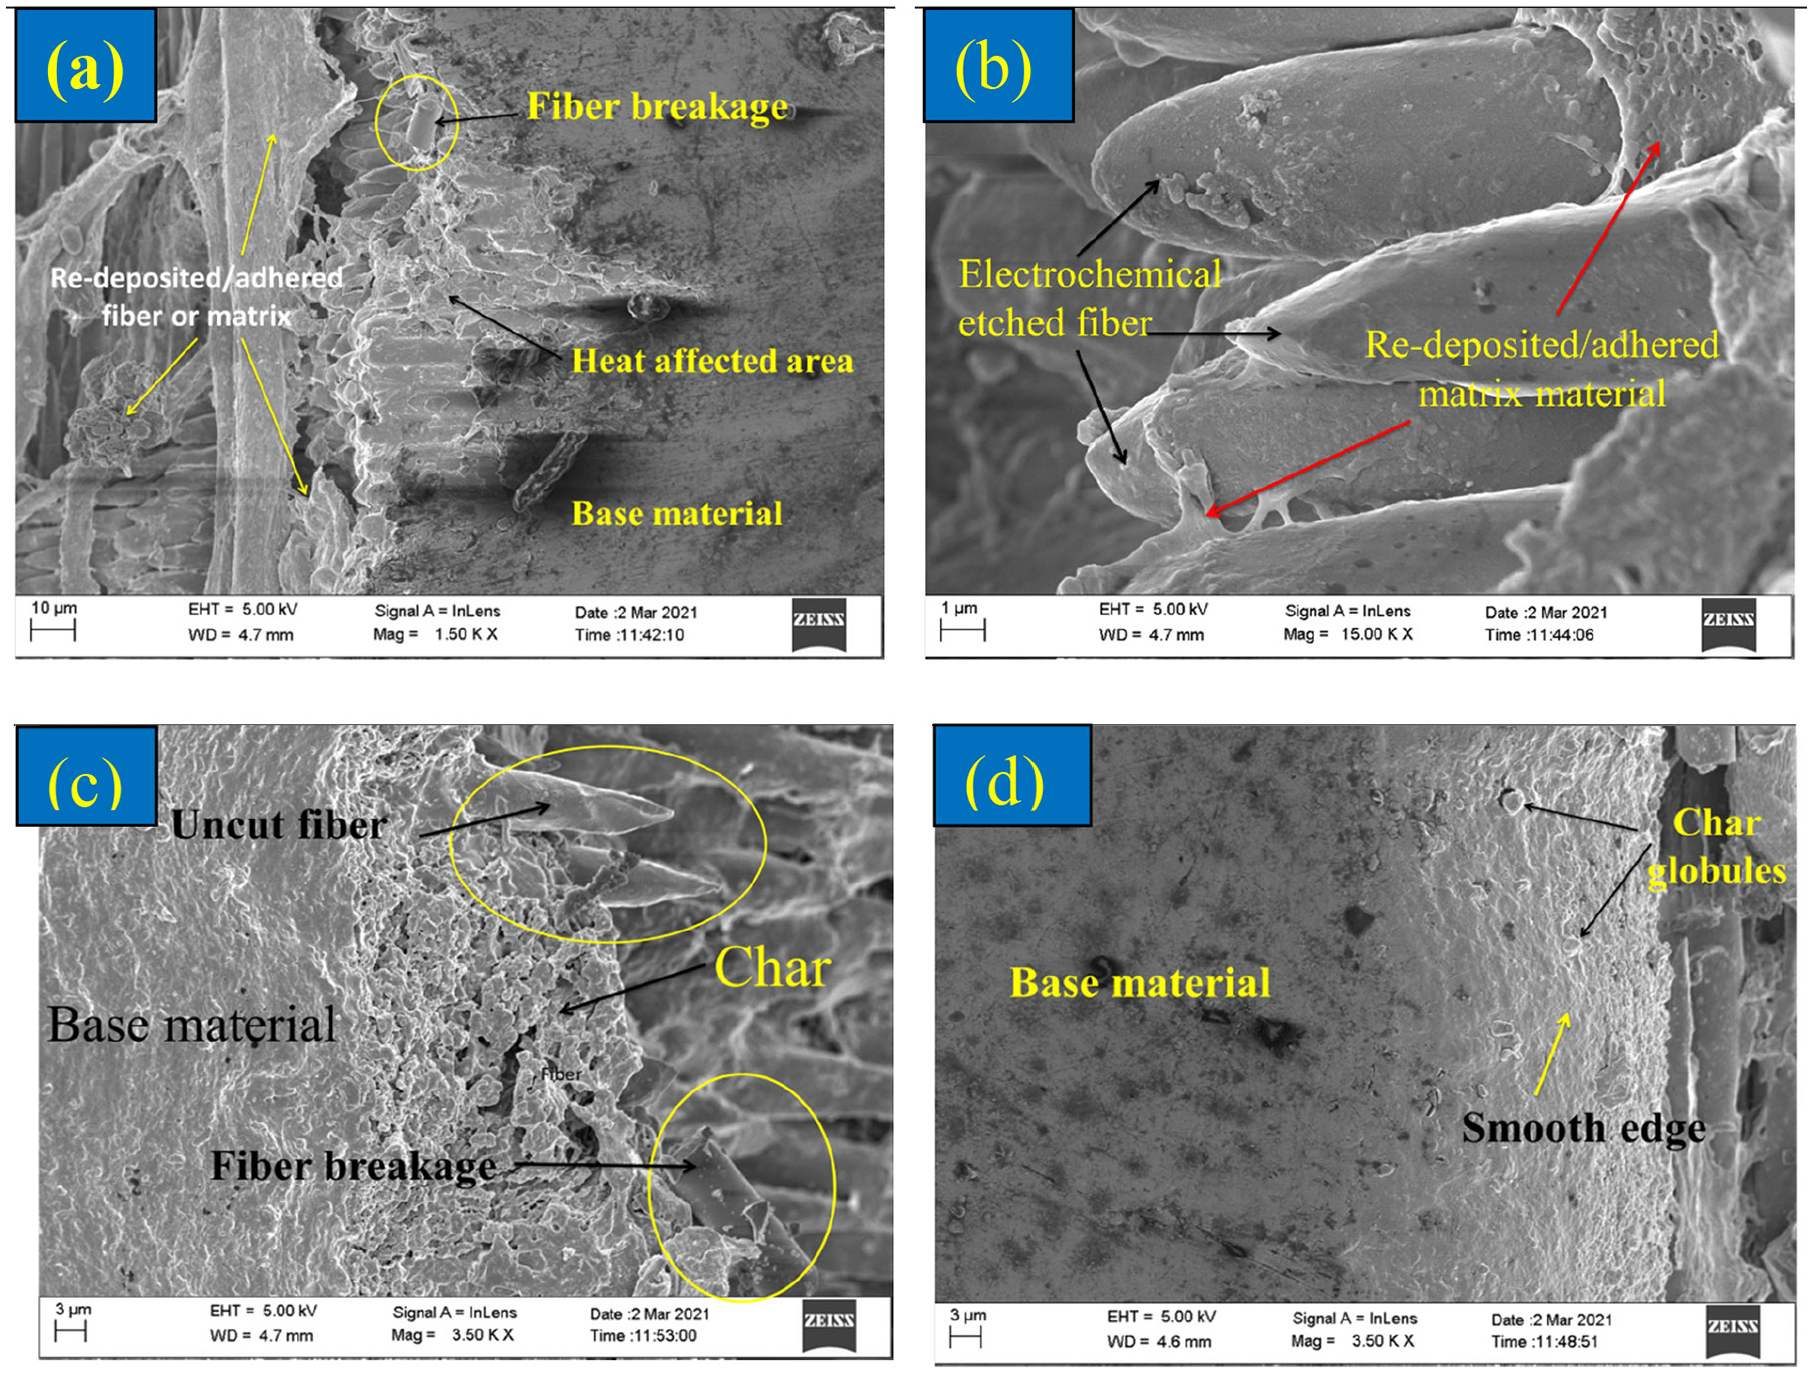
(a-d) FE-SEM image at different magnification of edge of the micro channel produced at optimum parameters (V = 50V, D = 35%, C = 20 wt%, F = 10 kHz).
Conclusions
The present study shows the feasibility of micro-ECSM process to machine GFRP at controlled dimensional accuracy and surface integrity. The quality of the fabricated micro-channel has been analyzed by measuring the output responses that is, width of the micro channel, delamination extent, and heat affected zone. The multi-objective optimization of the output response is performed and analysis of surface integrity of the micro-channel fabricated at optimized parameters is carried out using FE-SEM image. The major conclusions of current study are as follows:
The WMC, HAZ, and DE are significantly influenced by the applied voltage, duty factor, frequency, and concentration of electrolytes. With rise in voltage, duty factor and concentration of electrolyte leads to increase the WMC, HAZ, and DE. However, frequency shows vice versa effects for all the output responses.
The minimum width of micro channel, delamination extent, and heat affected zone observed in the present range of machining parameters are 532.81, 1.09, and 50.52 µm respectively.
Multi-objective optimization shows the optimal input machining parameters are applied voltage: 50 V, duty factor: 35%, concentration 20 wt%, and frequency 10 kHz and the corresponding responses are WMC: 530.78 µm, DE: 1.04 µm, and HAZ: 49.03 µm.
The edges of the fabricated micro channel show uncut or broken fibers, re-deposited or adhered fiber and matrix resins, charred material, and electrochemical dissolution of a fiber.
Footnotes
Declaration of conflicting interests
The author(s) declared no potential conflicts of interest with respect to the research, authorship, and/or publication of this article.
Funding
The author(s) disclosed receipt of the following financial support for the research, authorship, and/or publication of this article: This work was supported by the Defence Research and Development Organisation (DRDO), Gov. of India under Grant (DRDO(7)/2016-17/494/MECH ENGG).
Availability of data and material
The data and material used and/or analyzed during the current investigation are available from the corresponding author on reasonable request.