
Abstract
Tool wear monitoring techniques have been extensively applied in the modern manufacturing sectors to carry out predictive maintenance and to avoid the massive loss induced by sudden downtime. However, the online tool wear detection based on either the machining vibration or the variation of cutting power always encounters the interference caused by the excessive change of workpiece materials or even by the fluctuations of the coolant pressure. In the present work, a rapid half-online tool wear monitoring method based on the standard sample cutting and focus-variation scanning technique (FVST) was designed to quantify the tool wear extents. Invar alloy was used as the standard sample due to its low thermal expansion and ductile machinability. The results show that the texture of the machined surface is determined by the change of the cutting edge, and thus the surface morphologies can be regarded as the index of tool wear. Tool wear condition was revealed and quantified through the assessment models established based on the characteristic parameters including the width/depth of the texture and the surface roughness of the standard sample machined by new and worn tools under the identical cutting conditions. The results show that the tool wear can be revealed efficiently via the help of the surface morphological analysis, and the method is more none-destructive, rapid, and reliable compared with the conventional tool wear monitoring methods. In sum, the quantitative evaluation method of tool wear based on the morphological characteristics of the machined standard sample surfaces is confirmed capable of improving the accuracy and efficiency of tool wear monitoring.
Keywords
Introduction
In the modern industrial production, stable and reliable manufactory cells are the basis of a successful manufacturing system and cutting tools monitoring is one of the most important parts in the manufacturing chain. During the metal-cutting processes, the supervision of tools includes unintended collision between workpiece and machine tool, the abnormal tool failure caused by improper cutting parameters and the tool wear induced by abrasion or adhesion. Among these three conditions, tool wear monitoring can be studied and applied to carry out predictive maintenance and to avoid the production of waste. As discussed in the review article published by Jantunen, 1 the full lifetime of tools is not considered, and consequently valuable production time is lost because of the conservation estimation of tool life without tool condition monitoring. Because of the huge number of cutting tools changed in the manufacturing processes, the great economic advantages can be expected. Furthermore, as investigated by Vipindas and Mathew, 2 the tool wear monitoring can also be used to control the dimensional accuracy and quality of the machined surface.
Thus, tool wear monitoring techniques have been developed in the modern manufacturing sectors for the purpose of avoiding the massive loss induced by production of waste and sudden downtime. In principle, tool wear monitoring methods can be classified into offline and online modes based on ways of implementation. Observing the tool wear offline utilizing optical instruments such as CCD camera, scanning electron microscope, 3 confocal microscopy,4,5 and white-light interferometer6–8 which can also be defined as direct method is the most-used technique in actual production. Obviously, offline tool wear monitoring can provide the actual tool wear or even the surface texture but lacks real-time presentation. The main drawbacks of traditional offline tool wear detection are the challenges to clamp the tools especially for the drill and boring cutters for the complex tool geometry and the hidden cutting edge.
Compared with the offline detection, the online modes are more effective methods applied in the actual production which are carried out based on a continuous acquisition of signals with a multi-sensor system installed inside the machine center during production without removing the cutting tools. Ghani et al. 9 associated the strain gage signal of tool holder with estimated tool wear to develop an online tool wear measurement and monitoring system using a low-cost sensor. Other online tool wear detection systems also correlate appropriate sensor signals such as cutting forces,10,11 acoustic emission,12–14 vibration, and accelerations to tool wear status which can also be defined as indirect methods. Hou et al. 15 took advantage of machine vision and self-matching algorithm to fit and calculate the bottom wear value of the cutting edge online.
However, the online tool wear detection based on the machining vibration analysis or variation of cutting power always encounters interference caused by system fluctuations such as excessive change of workpiece materials and fluctuations of coolant pressure. It was observed by Raja et al. 16 that the change of cutting parameters and pressure levels can result in the change of the signal amplitude. As investigated by Seemuang et al., 17 the major limitation of using a sensor to record the cutting information is the background noise from the vibrations in the cutting zone, vibration caused by the machine tool driven system, external sources and, in particular, noise from the flowing coolant. Furthermore, the large-scale installation of sensors and bundled monitoring software monitoring will lead to increased cost.
In fact, the machined surface contains both qualitative and quantitative information of cutting tools described by Belin et al. 18 and Dos Santos et al. 19 as the triboscopic maps which can be used to reveal the tool wear. Kassim et al. 20 pointed out that the texture of a machined surface generated by a tool of well-defined cutting edges carries essential information regarding the extent of tool wear. Based on the analysis of scatter pattern of reflected laser light from the machined surface, Li and Yuan 21 studied the correlation between tool wear and vision-based optical parameters including the mean and standard deviation of the intensity distribution. Results show that there is a quite good correlation between the standard deviation parameter and the tool wear. Ni et al. 22 carried out three different machining methods to comparatively investigate the tool wear mechanism and characterize tool wear and machined surface features. Furthermore, as studied by Bradley and Wong, 23 three analytical indicators of the histogram, the spatial frequency domain and the surface texture obtained from magnified images of the generated surface could be used to indicate the progressive tool wear. The texture of the machined surface was determined by the change of cutting edges and the surface morphology can be regarded as the index of tool wear. Thus, combined with the indicators of machined surface morphologies and the tool wear conditions, the monitoring of tool wear can be achieved.
In the present case study, a rapidly half-online tool wear monitoring method based on standard sample cutting and focus-variation scanning technique (FVST) was designed and applied to qualitatively and quantitatively investigate the tool wear issue. Differing from the AISI steel used in the investigations, 24 Invar alloy was used as the standard sample for its low thermal expansion and ductile machinability. 25 Tool wear condition was revealed and quantified through the three-dimensional topographies of typical texture of the machined standard sample with respect to the change of new and used tools. Quantitative assessment models were established based on characteristic parameters including width, depth of the texture, and surface roughness of the standard sample machined by new tools and used tools under the same cutting condition.
It can be concluded that, in the previous investigations, the main drawbacks of traditional offline tool wear detection are the low efficiency and the challenges to observe the hidden cutting edge to evaluate the tool wear. The limitation of the online tool wear detection based on the machining vibration analysis or variation of cutting power is related to the interference caused by system fluctuations such as excessive change of workpiece materials and fluctuations of coolant pressure. Compared with the conventional tool wear monitoring methods, the method proposed in this paper is none-destructive, rapid, and reliable.
The present paper aims to improve the accuracy and efficiency of tool wear monitoring through correlating the surface characteristics of machined sample obtained by FVST with typical tool wear.
Experimental procedures
Invar alloy specimen and cutting tools
As mentioned above, the sample materials used to reflect the tool wear condition in this work are the Invar alloy block. The Invar alloy has a total size of 50 mm (length) × 20 mm (diameter) as depicted in Figure 1, and the physical properties are summarized in Table 1.
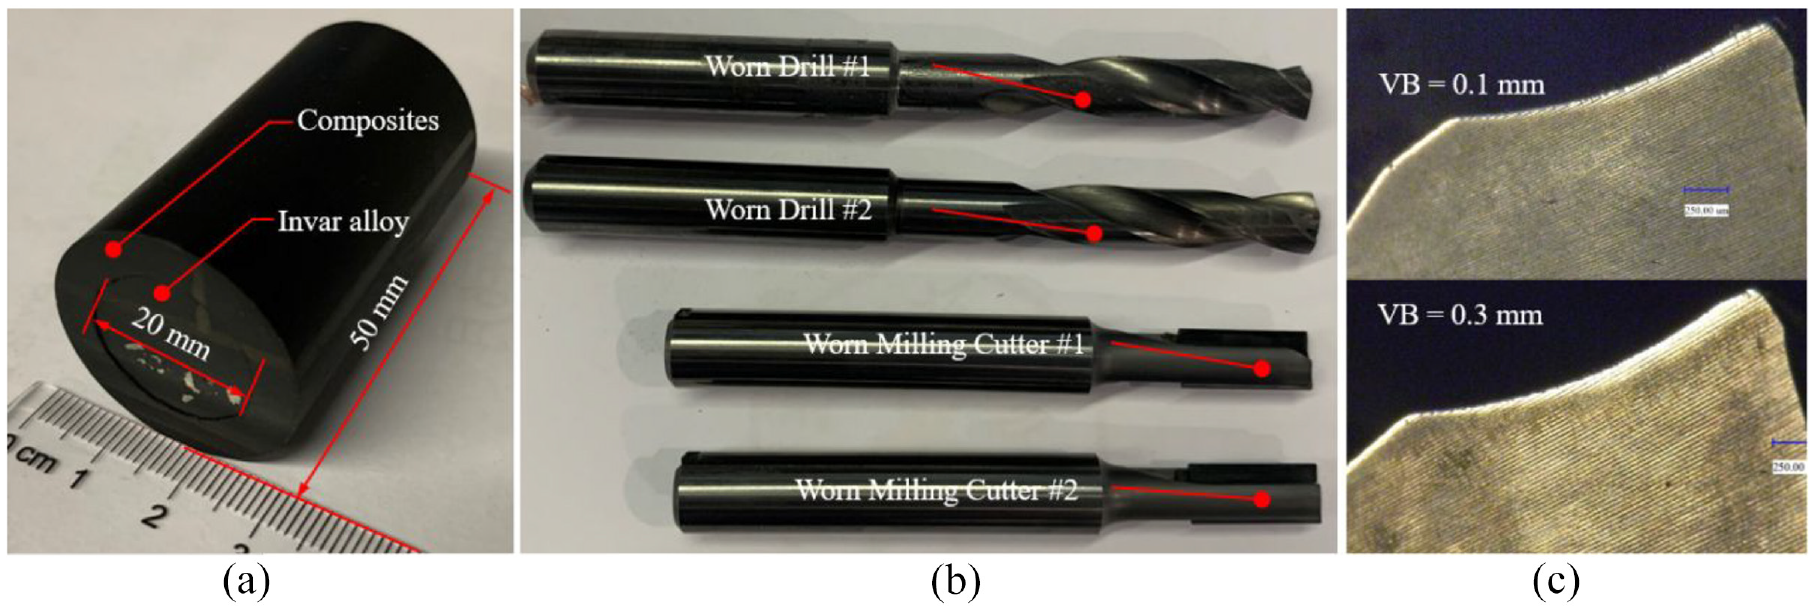
Photographs showing: (a) the Invar alloy specimen, (b) the worn drills and milling cutters, and (c) the tools with the flank wear of 0.1 and 0.3 mm.
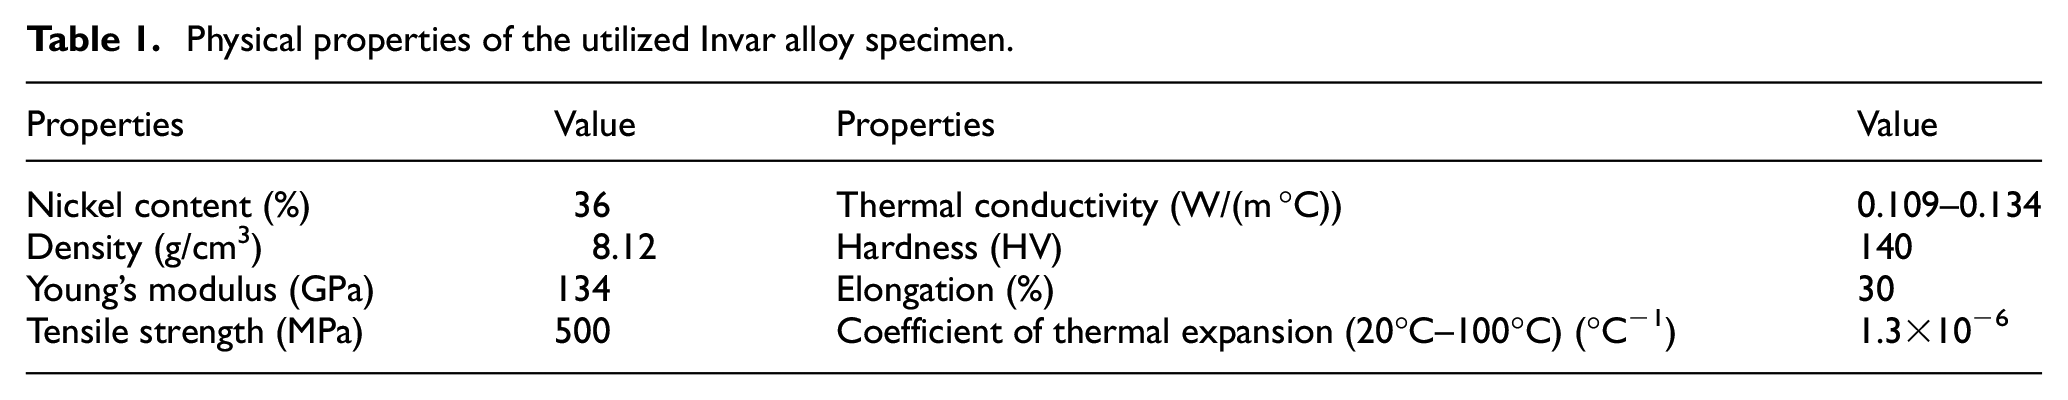
Physical properties of the utilized Invar alloy specimen.
To fit the special fixture designed inside the machine center, the cylindrical Invar alloy specimen was designed. Specifically, the Invar alloy block is covered by carbon/epoxy prepregs of 5 mm thick to restrain the vibration during cutting to reduce the error of machined surface topography. In the case study, two worn drills and two milling cutters which are complex to measure the wear utilizing conventional approach are selected as the cutting tools. As depicted in Figure 1, the uncoated carbide drill bits and uncoated carbide end mill both provided by Fengqi Machinery Technology Co., Ltd. were utilized. The main geometrical features of the used drills include a 6.35 mm diameter, a 140°-point angle, a 30° helix angle, and two cutting edges, and the end mill has a 6 mm diameter, a 0.5 mm r-angle, and two cutting edges.
Preparation of Invar alloy specimen
Due to the low thermal expansion of Invar alloy, the surface morphology suffers less effects of the heat generated during the cutting process. Then the texture of machined surface of Invar alloy specimen is dominated by the geometry of a cutting edge and carries the essential information regarding the extent of tool wear. As depicted in Figure 2, to perform the drilling and milling tests for the purpose of tool wear monitoring, the cylindrical Invar alloy specimen was machined to a specific shape. The top surface is the testing area for drilling while the side surface is the testing area for milling.
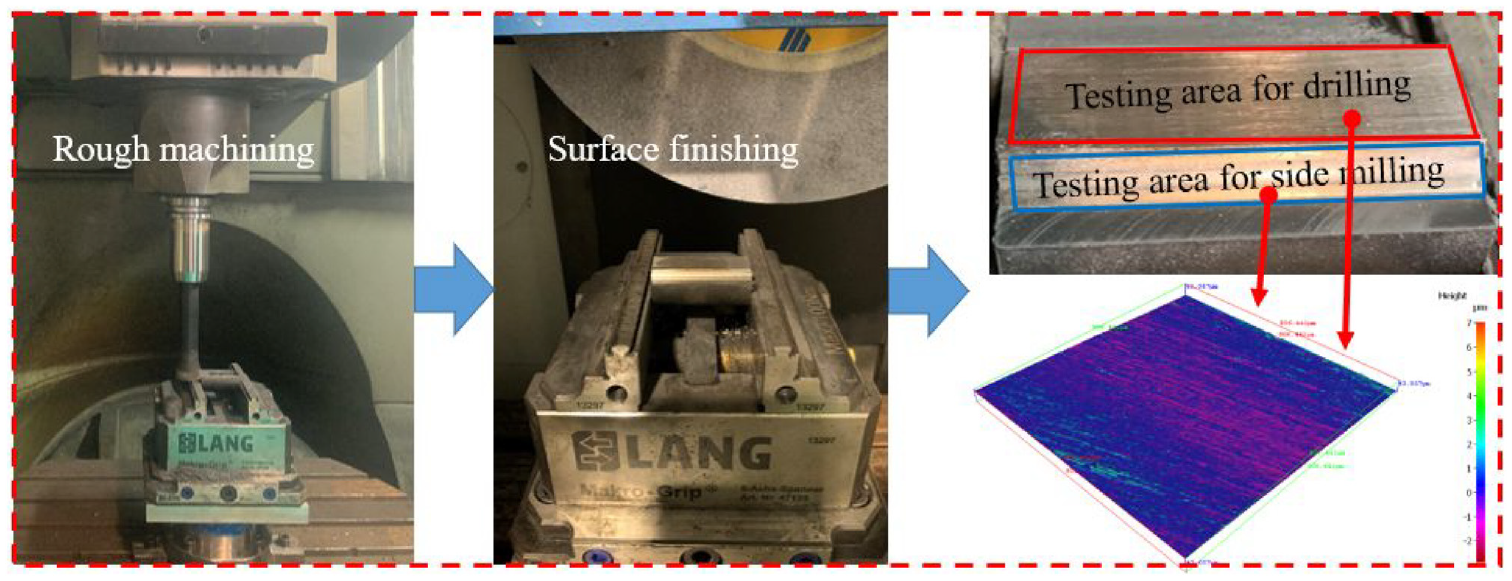
Photographs showing the preparation of the Invar alloy specimen.
The rough machining process of Invar alloy specimen was carried out on a DMU70V machining center with a maximum spindle speed of 12,000 rpm and a positioning accuracy of 0.01 mm. After the rough machining process, the surface finishing process were applied on a KENT surface grinder KGS-1020AH with a maximum spindle speed of 3450 rpm. All the drilling experiments were carried out under the dry machining environment. The final surface morphology was kept within Ra < 0.8 μm to ensure the stable surface generation during the cutting process of the tested tools.
Setup of the tool wear monitoring tests
As depicted in Figure 3, the machining process and cutting tests were carried out on a DMU70V machining center while the Invar alloy specimen was clamped besides the worktable with a specialized fixture. The rapid half-online tool wear monitoring was carried out following these steps:
The machine center runs normally in the machining process.
When the tool wear condition is needed to detect, a designed CNC program is executed to control the drill bits or milling cutters to cut the Invar alloy specimen on the specified location.
Take down the Invar alloy specimen and observe the machined surface with FVST.
Reveal the tool wear condition through the assessment models based on the characteristic texture of the machined surface.
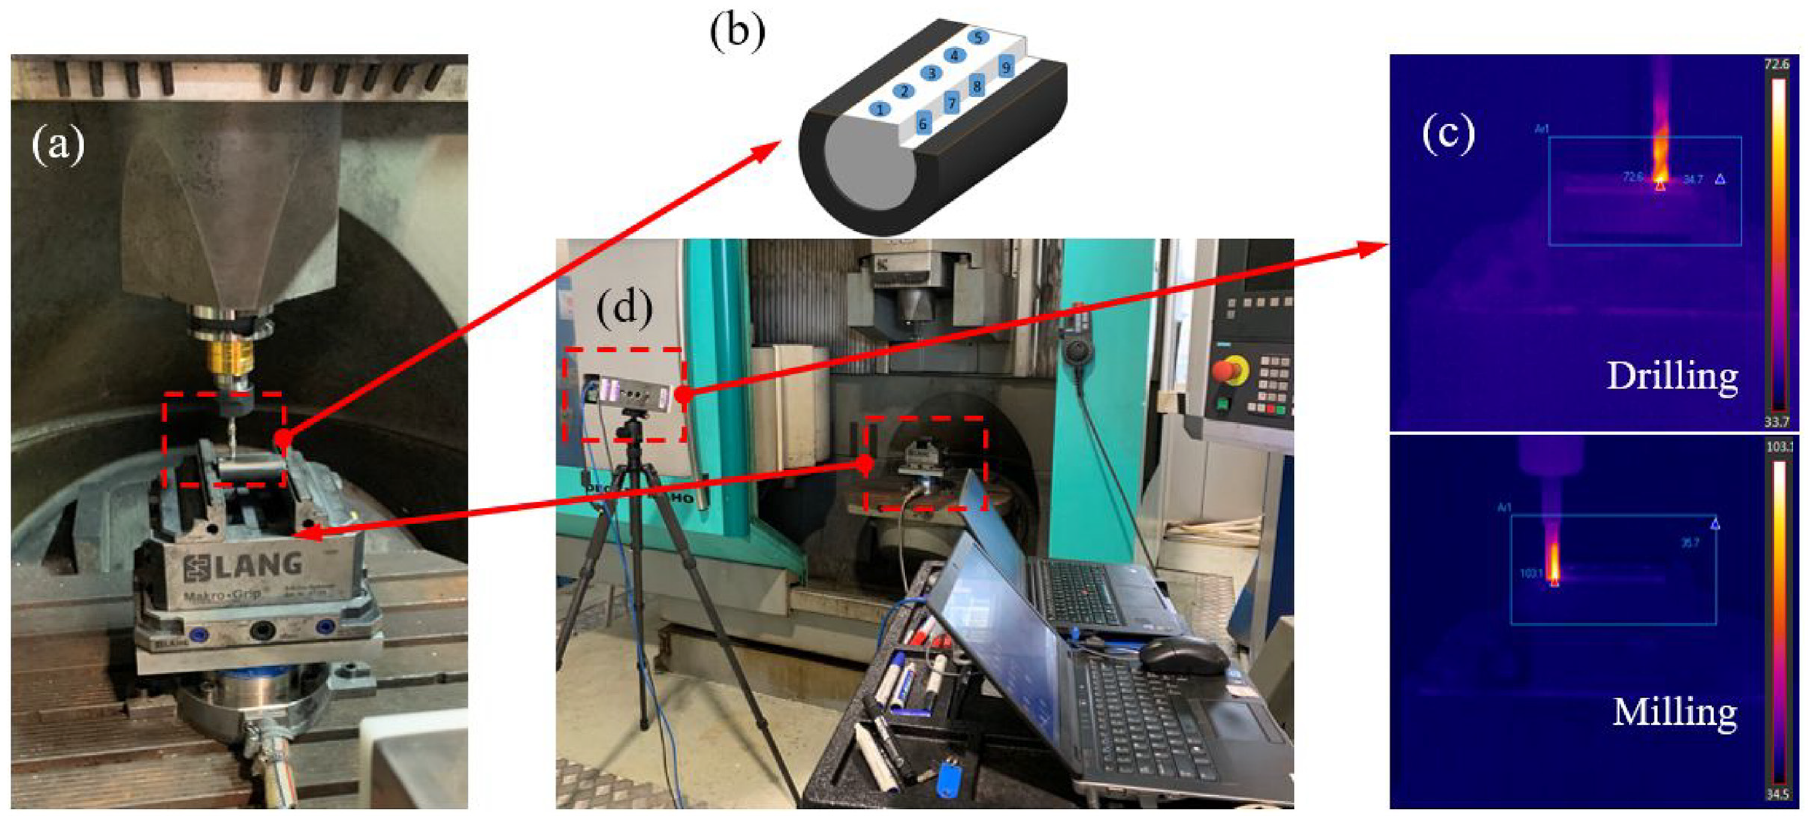
Schematic view showing the: (a) the cutting test for tool wear monitoring, (b) the specified testing location, (c) the in-situ measurement of cutting temperature by the infrared thermograph camera, and (d) the set-up for the cutting temperature measurement.
The method overcomes the difficulty of clamping the cutting tools especially for the drills and boring cutters to expose the complex tool geometry and the hidden cutting edge. Through correlating the surface characteristics of machined sample obtained by FVST with typical tool wear, the method is nearly none-destructive, rapid, and reliable compared with the conventional tool wear monitoring methods.
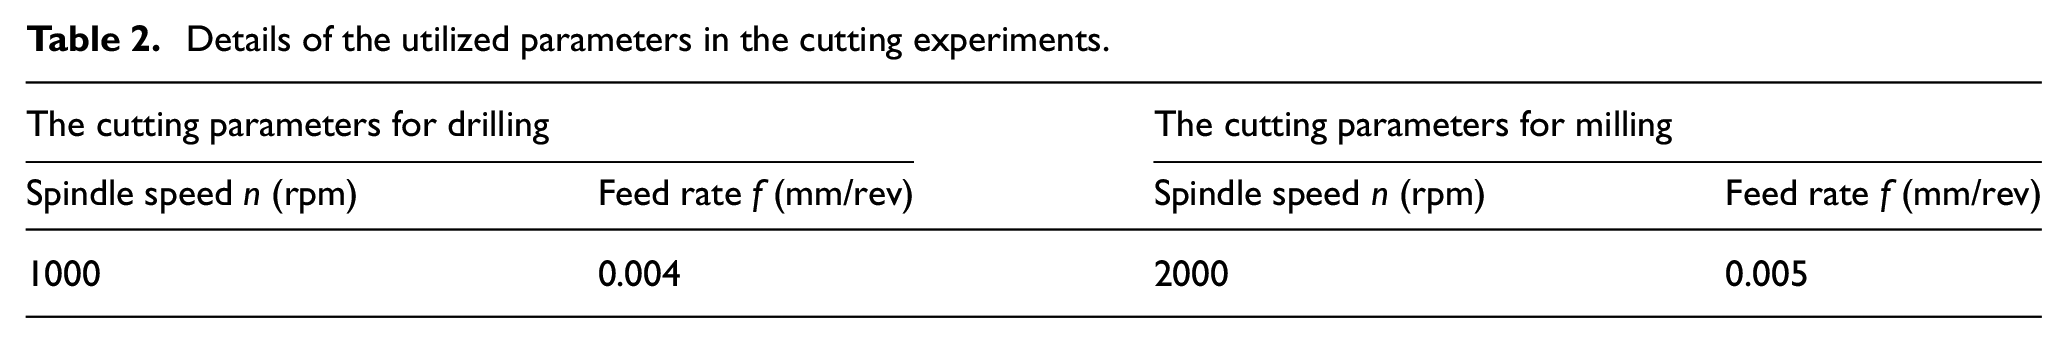
The standard depth of testing drill equals the height of drill point while the standard distance of testing mill equals the diameter of the mill cutter. The cutting parameters should be chosen carefully, based on our pre-experiments, the cutting parameters are summarized in Table 2. After accomplish the drilling or milling, the tool retracts immediately to protect the tested tools without reducing the life cycle.
Details of the utilized parameters in the cutting experiments.
We employed an infrared thermograph camera to achieve the in-situ measurement of the cutting temperature during tests. As shown in Figure 3, the highest cutting temperatures tend to be lower than 110°C, which ensures the low deformation of the machined Invar alloy surface caused by the cutting heat.
Tool wear assessment methods and quantification criteria
As depicted in Figure 4, the three-dimensional topographies of the machined surfaces were observed and measured by a focus-variation scanning microscope produced by Alicona InfiniteFocus-G5 and the typical patterns with different groove widths and depths were conducted. The InfiniteFocus-G5 is a non-destructive diagnostic system widely used for surface analysis, process and quality control applications, which possesses a scan field up to 0.81 mm × 0.81 mm under 20× zoom lens and a maximum scanning area of 10,000 mm2. Additionally, the optimum horizontal resolution is 0.88 μm under 20× zoom lens.
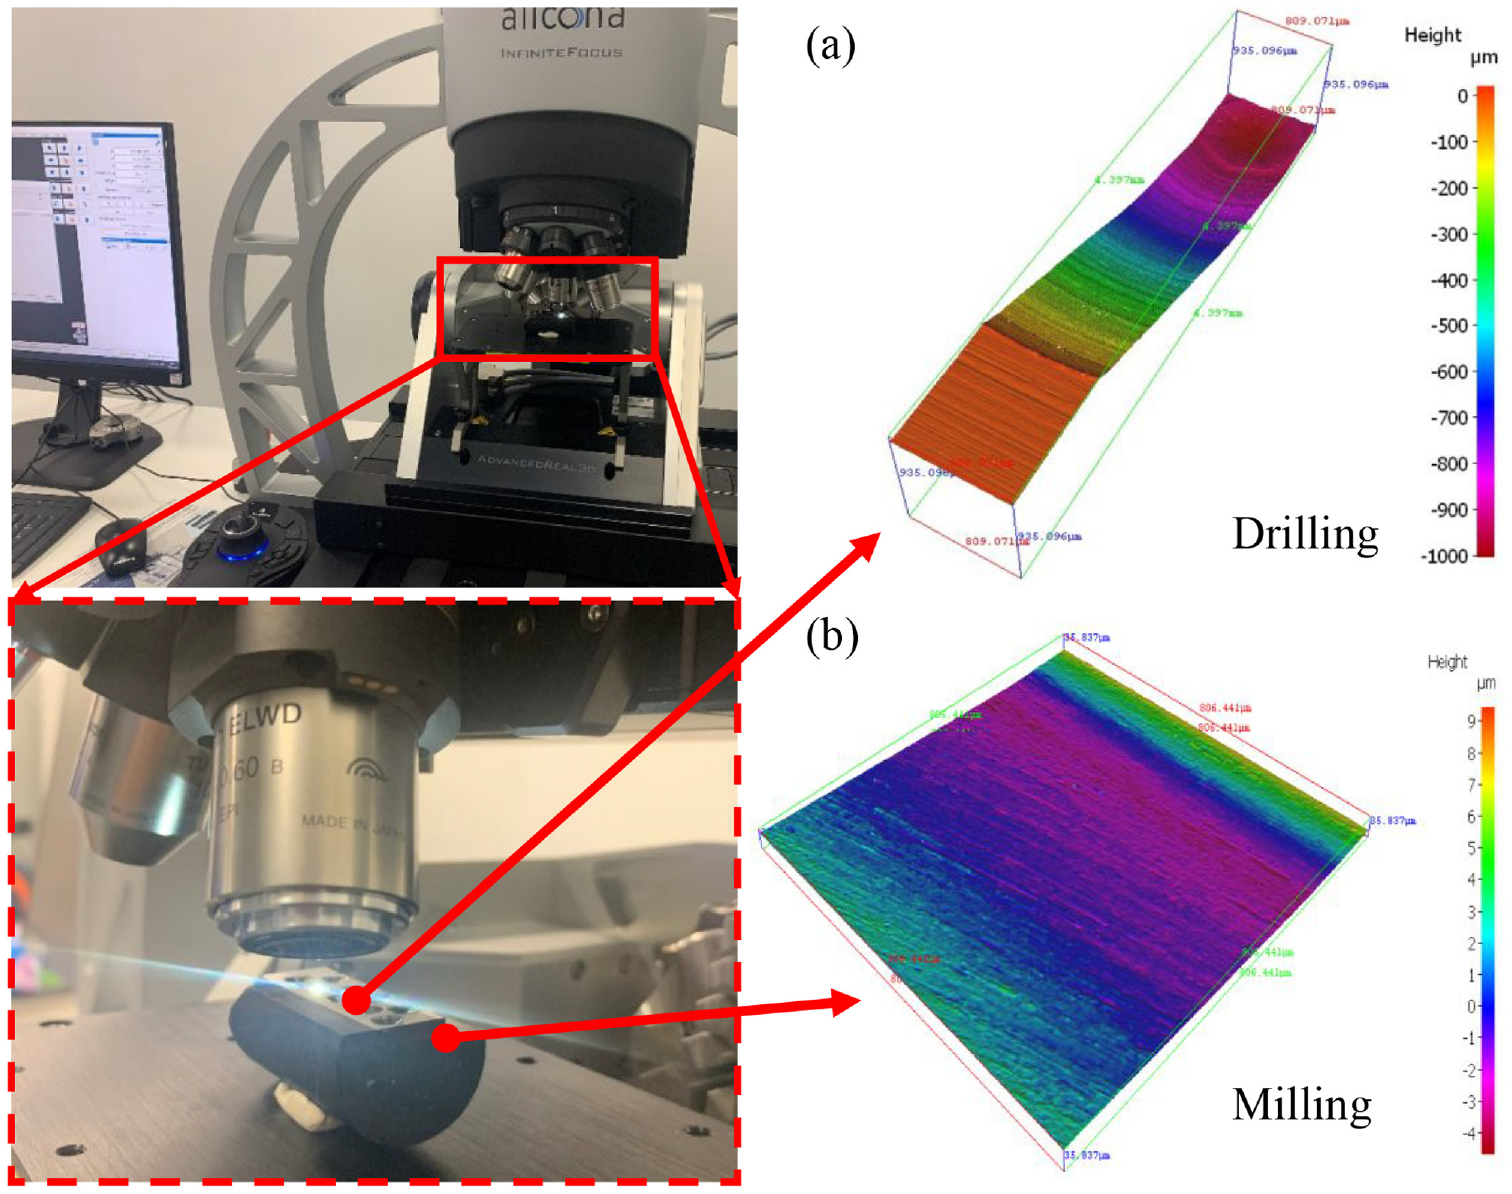
Schematic view showing the three-dimensional topographies of the machined surfaces by: (a) drilling and (b) milling.
In general, machine shops decide to replace the worn tools once the wear of flank surface exceeds a certain value. However, tipping of the cutting edge often exists as a hidden danger to the stable machining due to its crypticity and the difficulty to be quantified. To assess the flank wear and tipping of the tool, two key indicators are put forward depending on the obtained three-dimensional topographies of the machined surface. Since the roughness of machined surface has a great relation with the flank wear, the first indicator is the commonly used Rq which stands for the root mean square (RMS) roughness of the profile. Though the tipping of cutting edge cannot be revealed obviously in the whole ranges of Rq, the width-to-depth ratio can be changed remarkable at a local scope. Thus, the locally changed width-to-depth ratio is used to assess the tipping extent by defining an indicator of Vr which is characterized by the ratio of the material volume upon the datum plane of the machined surface to the material volume below the datum plane with the help of FVST and the identification of Alicona software. These two evaluation parameters are defined in equations (1) and (2) of Table 3.
Definition of the two evaluation parameters.
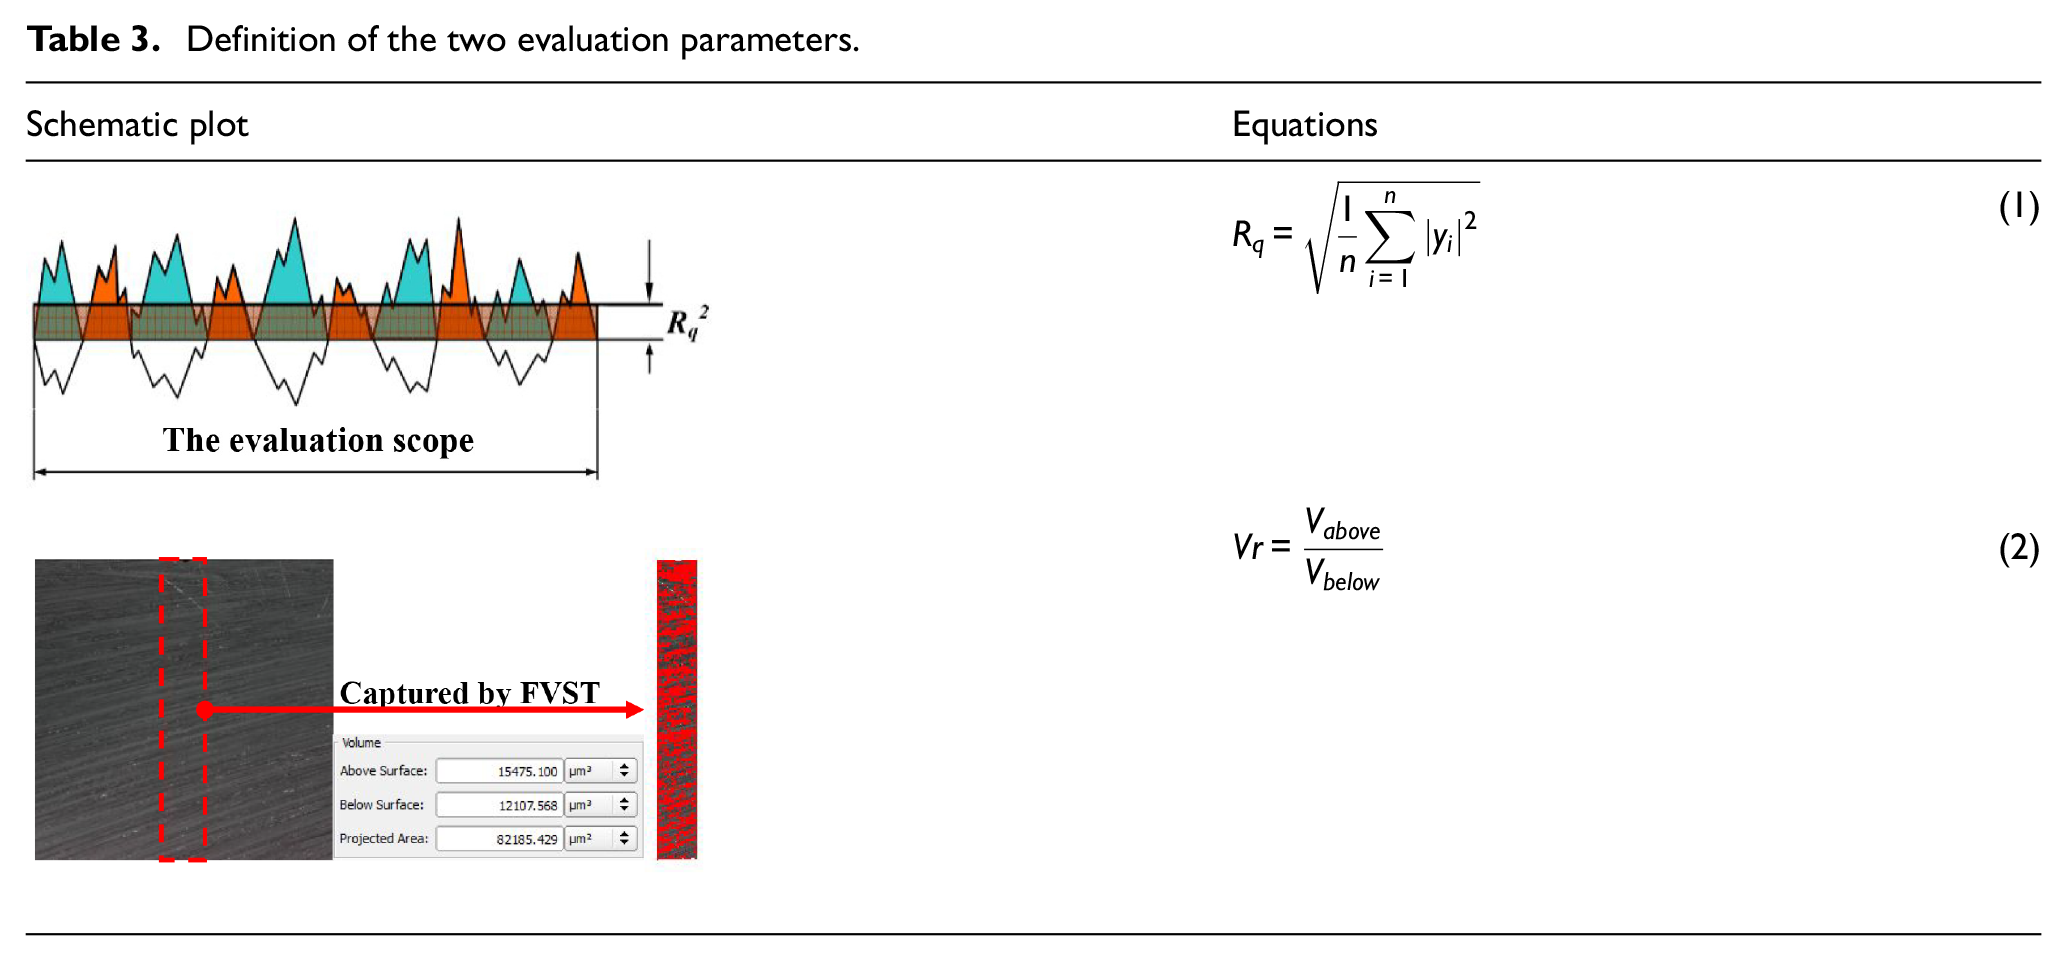
In this work, the two evaluation parameters are calculated depending on the grained Invar alloy specimen surface and set as Rq0 and Vr0. During the rapid half-online tool wear monitoring process, the solution of the below equation stands for the tool wear extent:
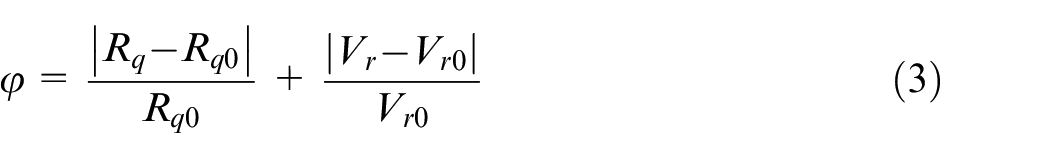
When the Rq and Vr are obtained at the end of tool life, the
Results and discussion
Tool wear indicator of milling tests
During the cutting process, material removal and new surface formation are dominated by the cutting tools and the inputted energy. The texture of the machined surface is the reflection of the change of cutting edge, and thus the surface morphologies can be regarded as the indicator of tool wear. Figure 5 presents the three-dimensional topographies of the machined surfaces with the grinding process, milling with flank wear of 0.1 mm and milling with flank wear of 0.3 mm respectively. The three observed surfaces share the same amplification factor and field of view of 806 μm × 806 μm.
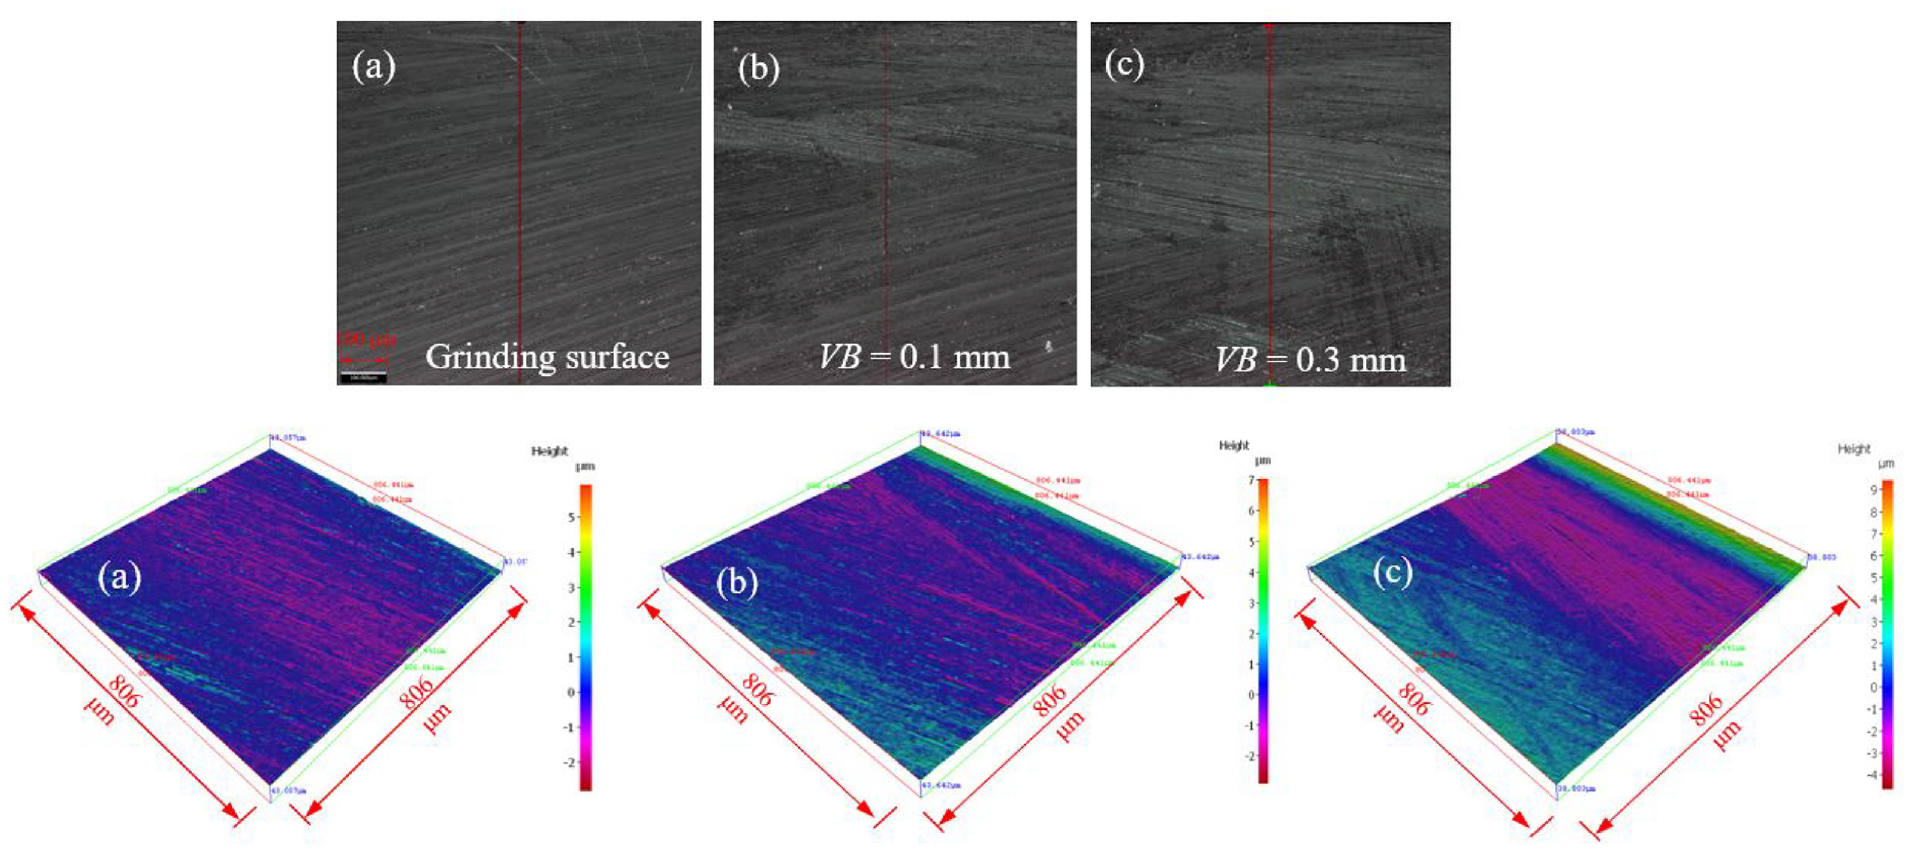
Three-dimensional topographies of the machined surfaces: (a) the ground surface, (b) machined by the mill cutter with the flank wear of 0.1 mm, and (c) machined by the mill cutter with the flank wear of 0.3 mm.
Apparently, through the grinding process, the machined surface gains better quality and consistency which can be evaluated by the regular surface texture. The surfaces generated by the worn tools exhibit a larger fluctuation range and tend to have a worse surface quality. In the cutting zone, the larger flank wear will lead to an extended area of friction between tool and material which causes a lower surface quality and tanglesome surface texture. Actually, to a large extent, the machine shops will replace the worn tools when an unqualified workpiece appears or/and the out-of-tolerance surface roughness is detected.
The graphs in Figure 6 show the actual profiles of three machined surfaces obtained by FVST directly without filtering process which guarantee an accurate reflection of the tool wear. It can be seen that although the ground surface exhibits excellent three-dimensional topographies in Figure 5, the actual surface profile shows no obvious regulation. The reason can be explained by the fact that the grinder can be regarded as a multi-point cutter.
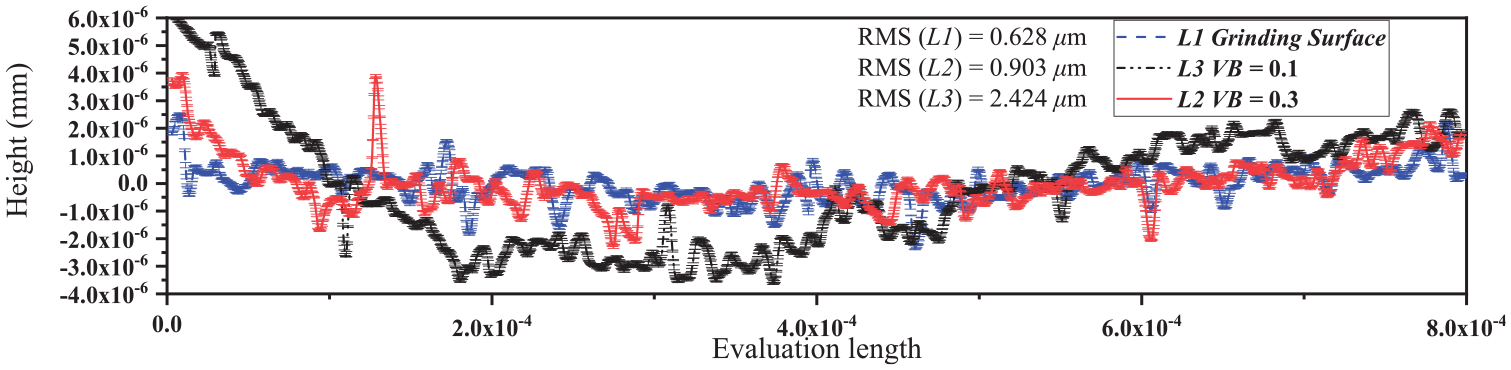
The results of profile of three machined surfaces.
According to equation (1), Rq0, Rq(VB0.1), and Rq(VB0.3) can be calculated which are 0.628, 0.903, and 2.424 μm respectively.
Table 4 presents the results of the material volume upon the datum plane of the machined surface and the material volume below the datum plane with the help of FVST. The indicator of Vr reflects the locally changed width-to-depth ratio and theoretically, the ratio should be equal to 1. The larger deviation between Vr and 1 stands for a rougher surface which is related to the increased tool wear.
Vr results of the machined surfaces: (a) the ground surface, (b) machined by the mill cutter with the flank wear of 0.1 mm, and (c) machined by the mill cutter with the flank wear of 0.3 mm.
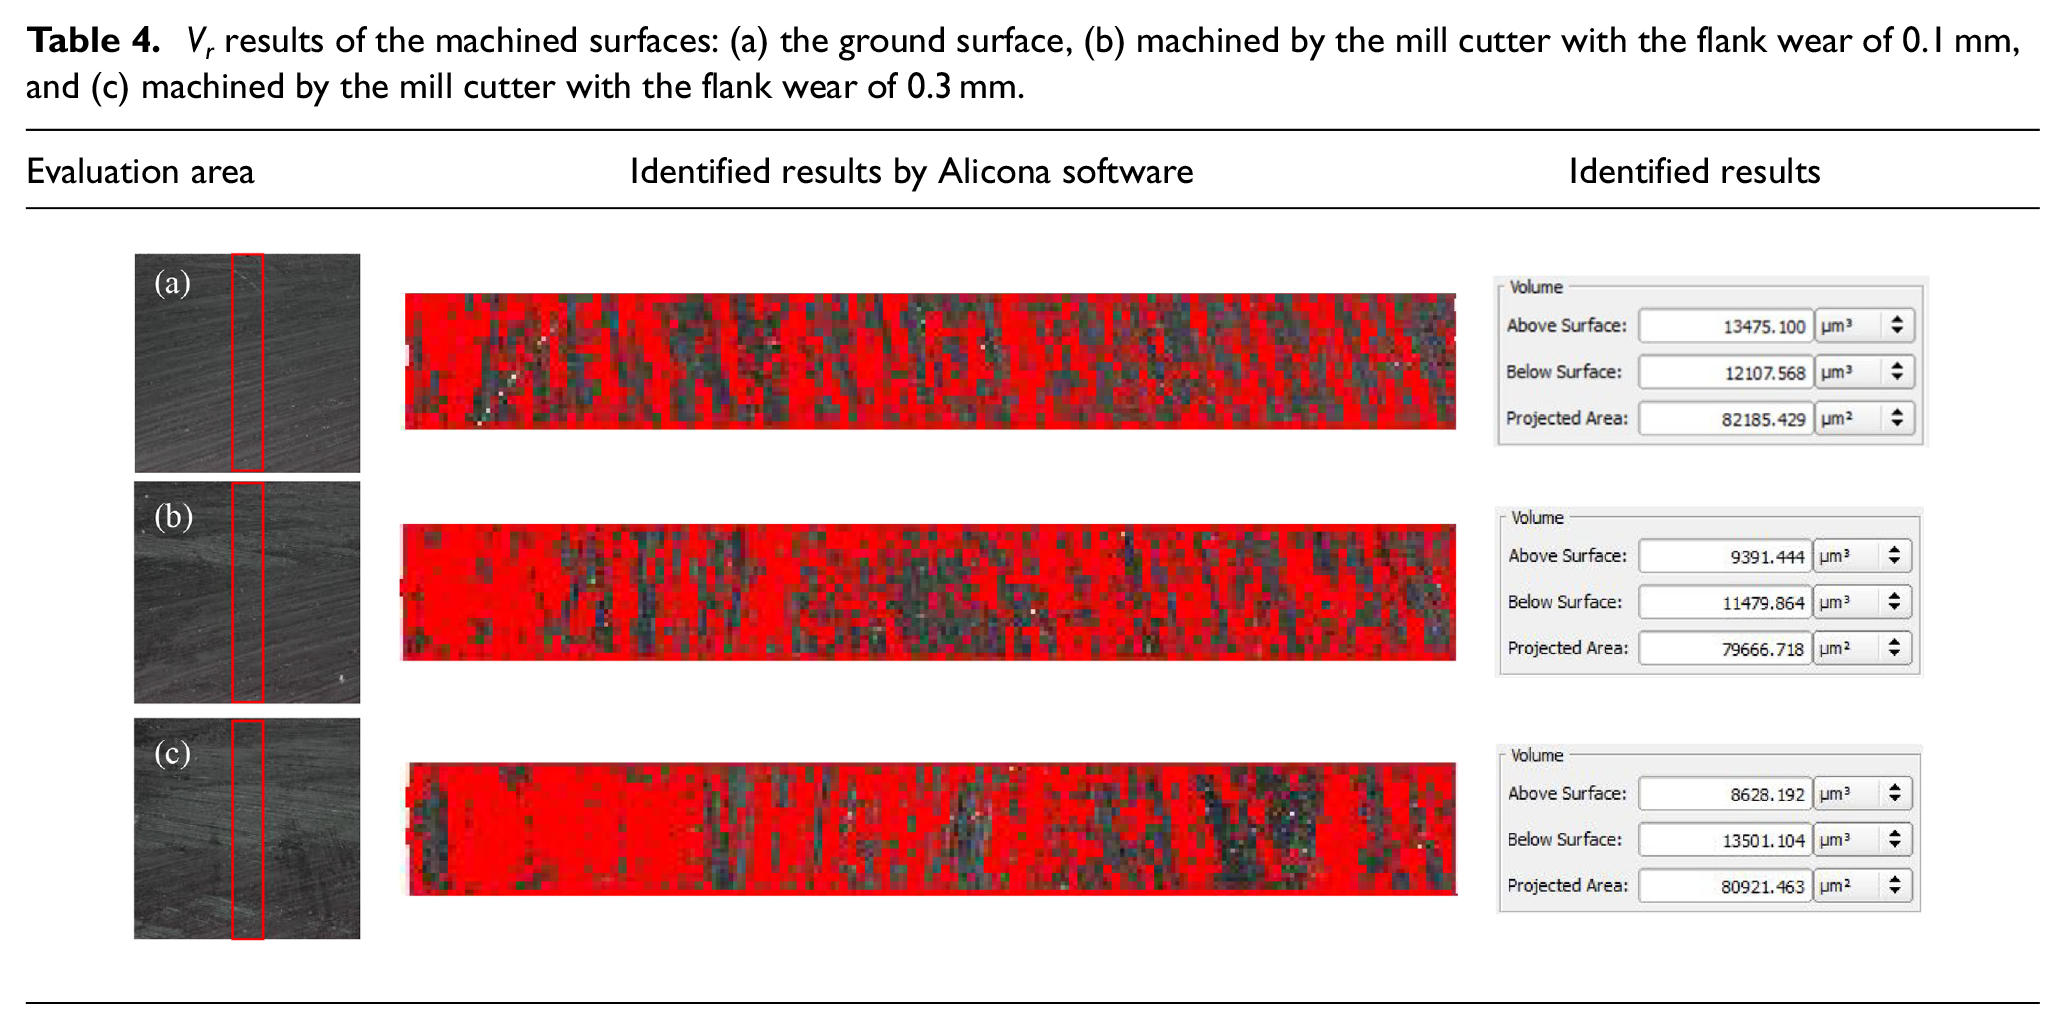
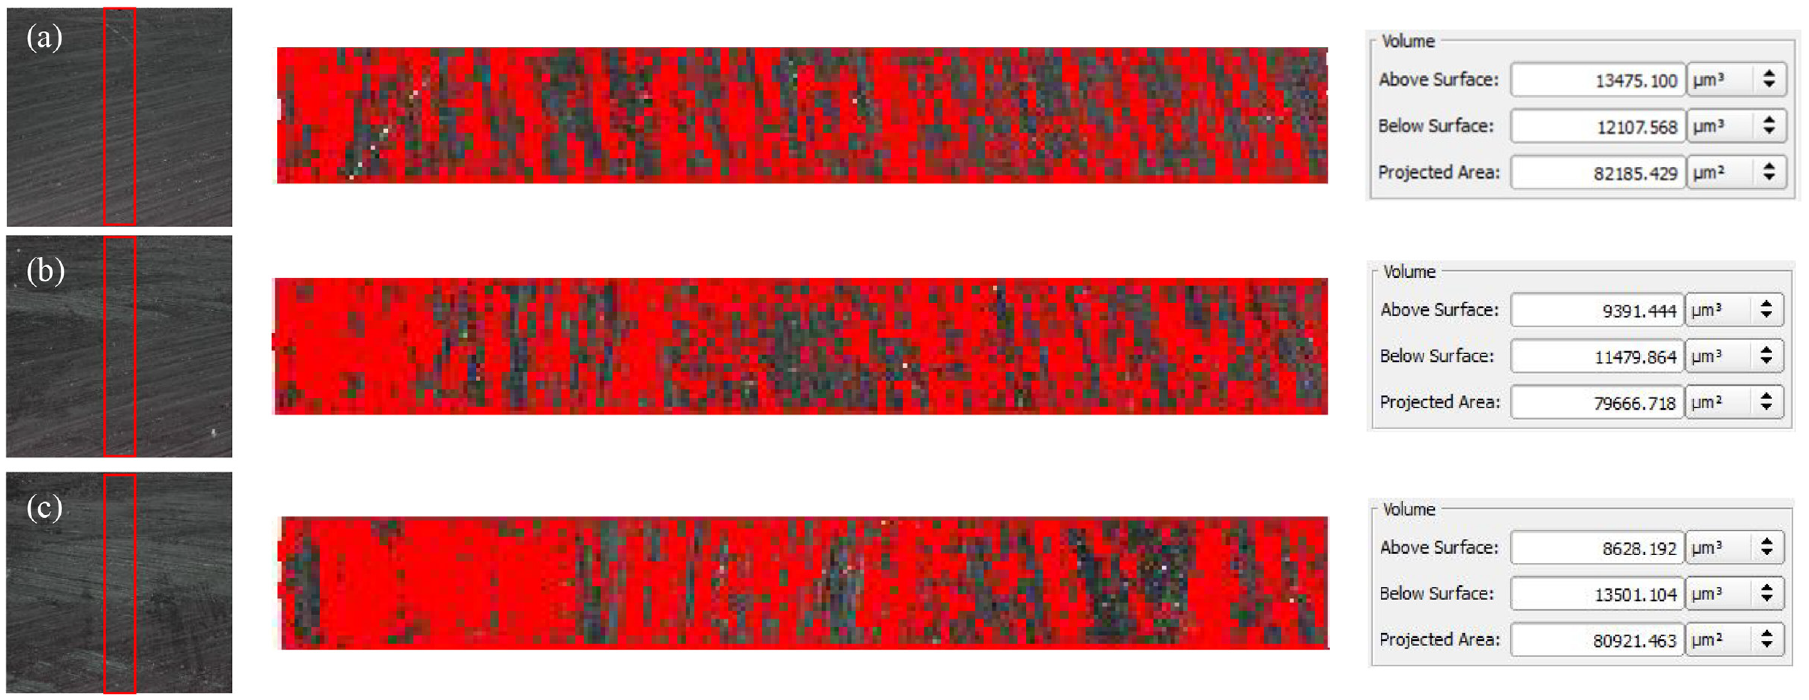
According to equation (2), Vr0, Vr(VB0.1), and Vr(VB0.3) can be calculated which are 1.113, 0.818, and 0.639 respectively. During the tool wear monitoring process in this study, we set the VB = 0.3 mm as the criteria of replacing the worn tools. Thus, the indicator (
Tool wear indicator of drilling tests
Compared with the surface texture analysis of milling discussed above, the tool wear assessment criteria are generally consistent. However, there exist some differences. On the one hand, in the drilling process, the generated metallic chips are likely to remain in the drilled holes and lead to excessive surface roughness which will change the surface texture. On the other hand, the cutting speed along the drill bit changes from 0 to the maximum which will change the rule of surface generation. Thus, the tool wear indicators of drilling discussed in this part are only suitable for a certain case.
Figure 7 presents the three-dimensional topographies of the drilled surfaces. The two utilized drill bits have different flank wear of 0.2 and 0.3 mm. Because of the conical drill tips, the observed surface is not flat which can bring measuring error. Nevertheless, we can choose the shortest distance perpendicular to the cutting edge as possible to observe the drilled surface.
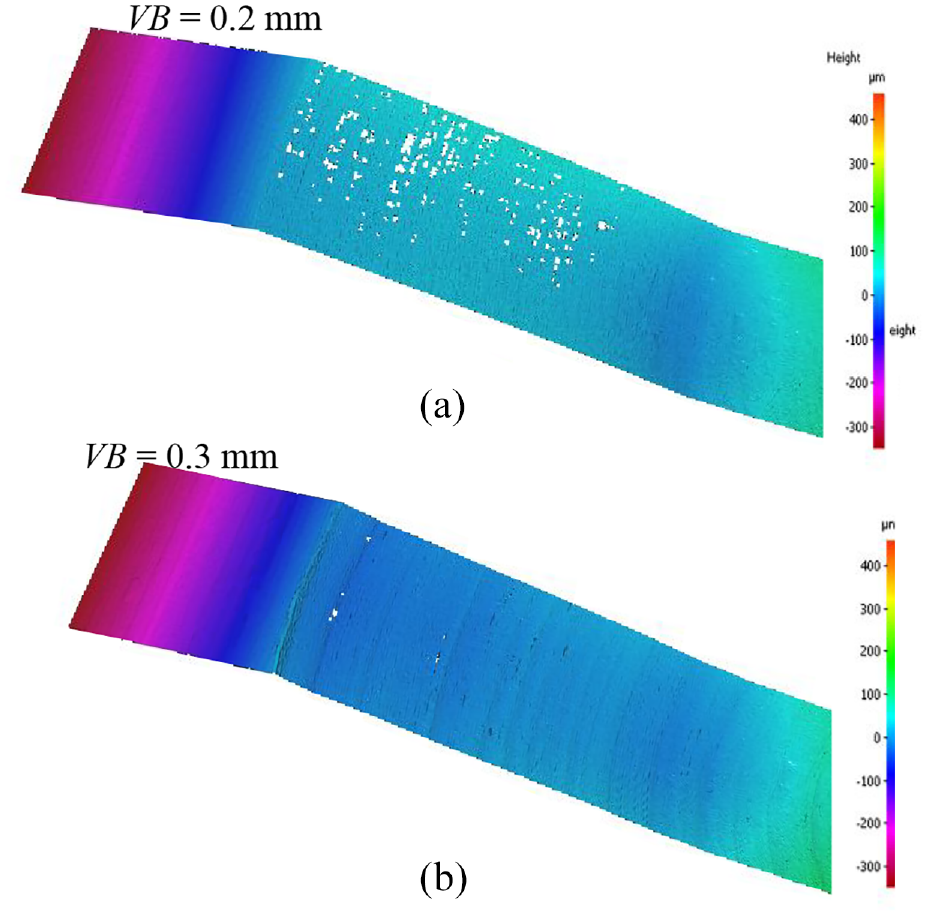
Three-dimensional topographies of the machined surfaces: (a) machined by the drill with the flank wear of 0.2 mm and (b) machined by the drill with the flank wear of 0.3 mm.
Based on the actual profiles of machined surface obtained by FVST directly without filtering process as showed in Figure 8 and according to equation (1), Rq(VB0.2) and Rq(VB0.3) can be calculated, which are 2.312 and 2.758 μm respectively.
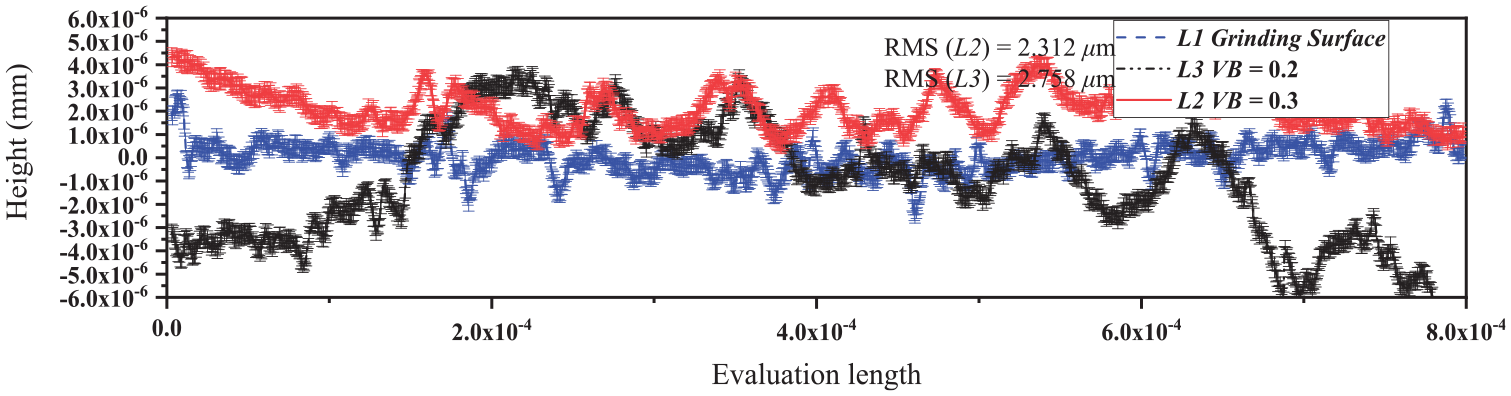
The surface profiles of the drilled surface.
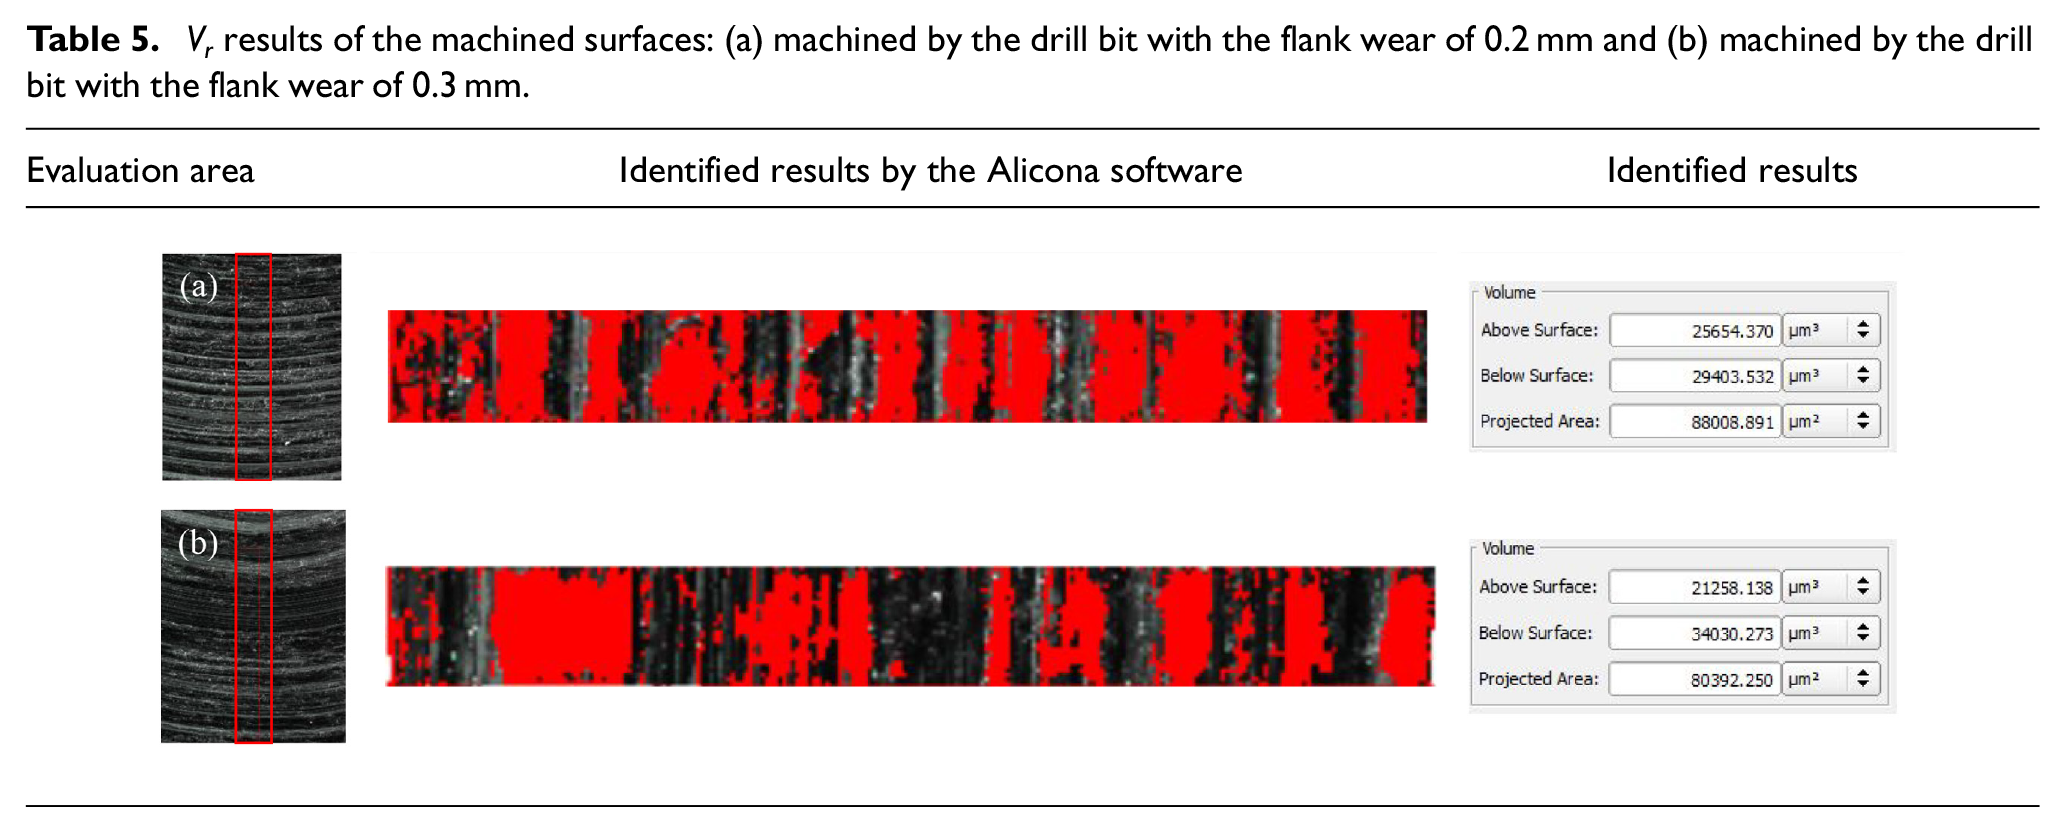
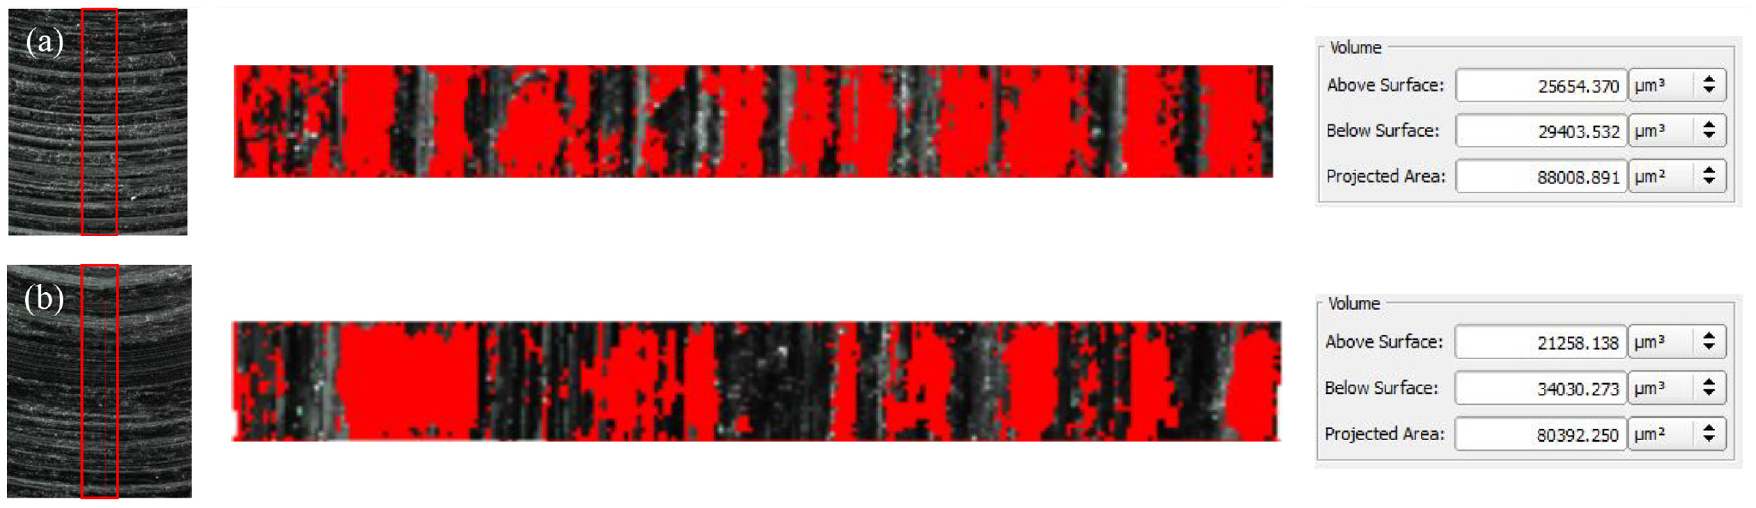
Through the identified results of the material volume upon the datum plane of the machined surface and the material volume below the datum plane with the help of FVST in Table 5, and according to equation (2), the indicator of Vr(VB0.2) and Vr (VB0.3) can be calculated, which are 0.872 and 0.625 respectively. the indicator (
Vr results of the machined surfaces: (a) machined by the drill bit with the flank wear of 0.2 mm and (b) machined by the drill bit with the flank wear of 0.3 mm.
Tool wear monitoring of milling cutter
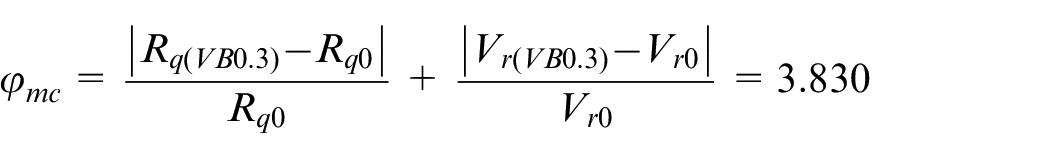
Applying the assessment model of tool wear monitoring established based on the characteristic parameters this part carries out the tool wear monitoring of a worn milling cutter. Following the test procedures, the mill cutter was programed to mill the pointed location on the Invar alloy specimen after the normal processing. Then, the three-dimensional topographies of the machined surfaces were obtained by FVST. Figure 9 presents the observed and identified results, in which, the material volume upon the datum plane is 17,233.600 while the material volume below the datum plane is 11,017.497. According to equation (2), Vr can be calculated:
(a) Three-dimensional topographies obtained by FVST of the surfaces machined by the tested tool, (b) the chosen area for identification, (c) identified results by the Alicona software, and (d) the SEM result of the worn mill cutter.
Based on the actual profiles of machined surfaces obtained by FVST shown in Figure 10, Rq can be calculated:
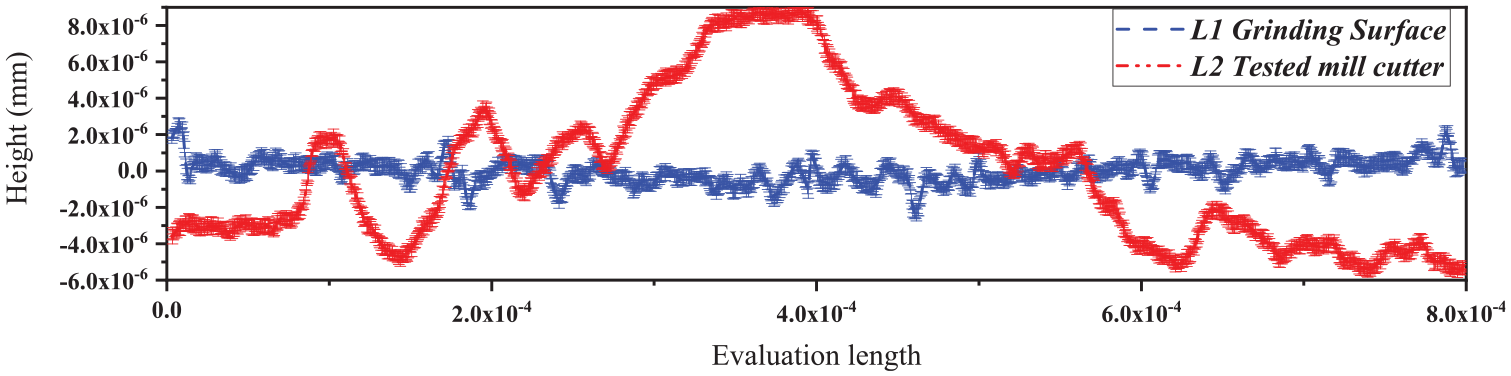
The profile of the machined surface by the tested tool.
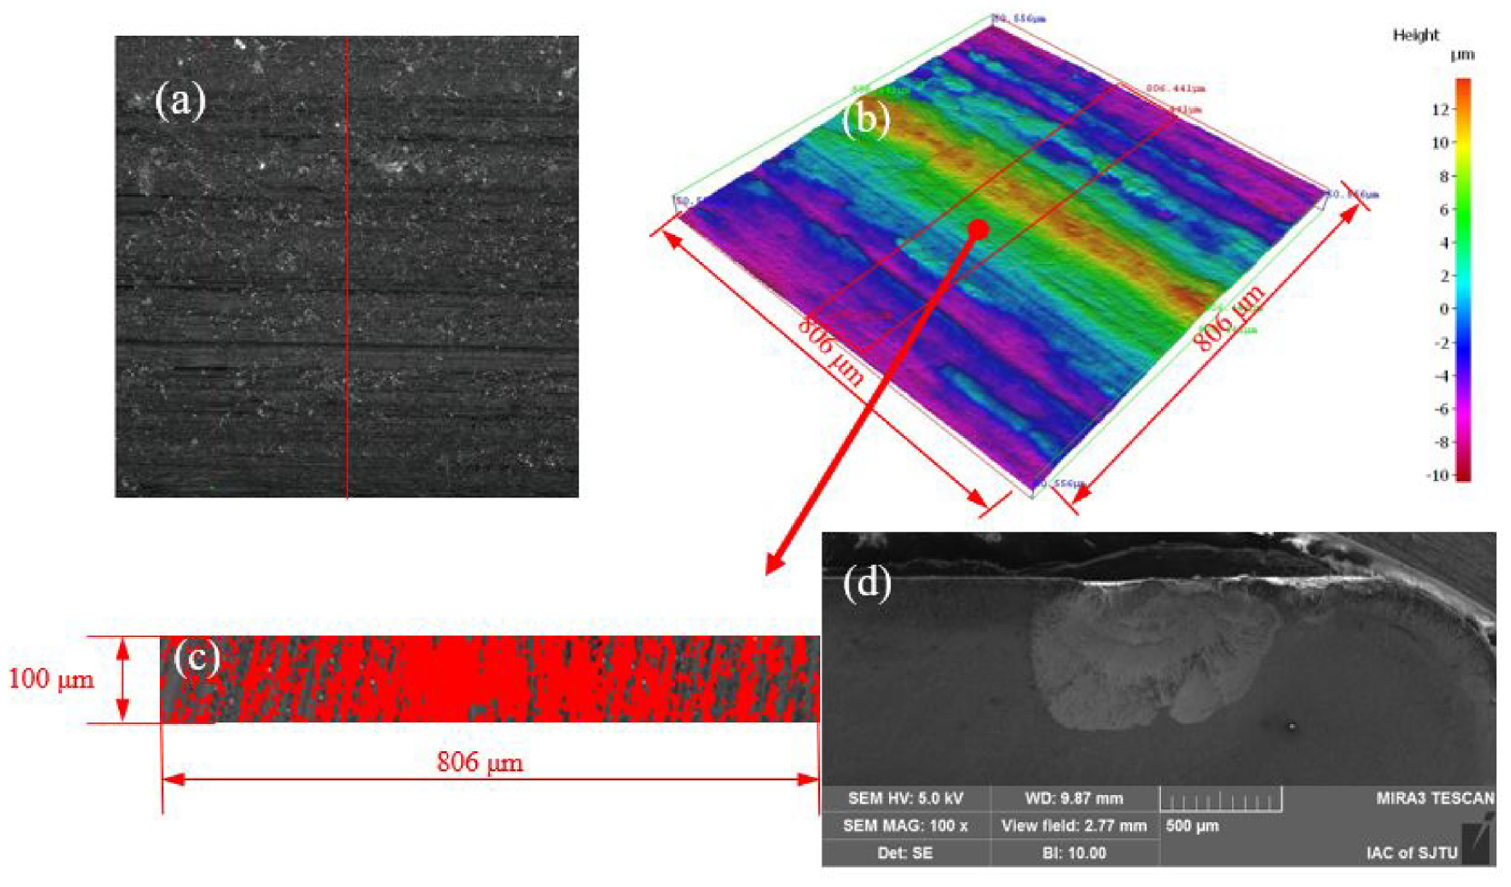
Thus, the indicator (

Apparently, through the analysis, the wear indicator
Conclusions
In this paper, a rapid half-online tool wear monitoring method based on the standard sample made of Invar alloy cutting and focus-variation scanning technique (FVST) was designed and applied to quantify the tool wear extents. The morphological analysis was carried out quantitively to reveal the tool wear based on the assessment models including the characteristic parameters of the machined surface texture. The verification gained in the current work confirms the ability of the method in monitoring the tool wear. However, there also remain several problems, and the main conclusions can be summarized as follows:
The tool wear monitoring can be carried out based on a quantitively assessment model which contains two key parameters of surface texture: Rq stands for the root mean square roughness of the profile mainly concerning the flank wear; Vr is characterized by the ratio of the material volume upon the datum plane of the machined surface to the material volume below the datum plane concerning the tipping of the cutting edge.
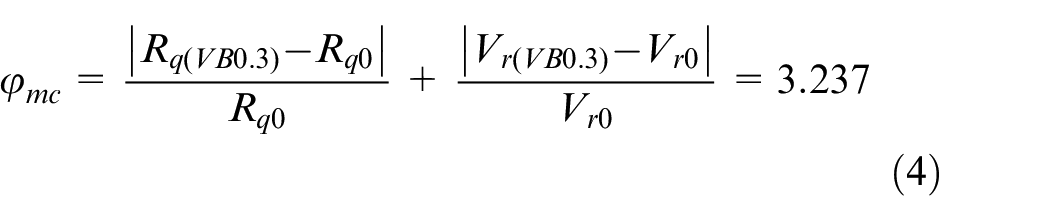
The focus-variation scanning technique (FVST) can be used to observe three-dimensional topographies of the machined surfaces and through the process of matched software, quantitative parameters such as the profiles of surface texture and the identification of material volume can be calculated to evaluate the tool wear. In this study, the indicator of replacing the mill cutter and replacing the drill bits can be calculated as: φ mc = 3.237 and φ mc = 3.830 respectively.
Compared with the conventional tool wear monitoring methods, this half-online tool wear monitoring method is none-destructive, rapid, and reliable. Through the verification test, the accuracy and efficiency of the tool wear monitoring is proved which is achieved through correlating the surface characteristics of machined sample obtained by FVST with typical tool wear.
However, due to the circular motion of tools with several blades such as drills with two cutting edges, the tool wear monitoring method developed in this work cannot accurately locate the wear extent on the blades. Nevertheless, the established assessment model can be used to reflect the machining quality, and once the processing quality deteriorates, the tool should be replaced.
Footnotes
Declaration of conflicting interests
The author(s) declared no potential conflicts of interest with respect to the research, authorship, and/or publication of this article.
Funding
This work was financially supported by the National Key Research and Development Program of China (2020YFB2010600).