
Abstract
Ultra-precision machining is widely used in the manufacturing of national defense and sophisticated civil products because of its high precision, nearly no surface damage and other advantages. The surface roughness of a workpiece is the key indicator of ultraprecision machining technology, which is affected by many factors in the process of machining. However, the existing surface roughness prediction model only considers a single error factor between the tool and workpiece, lacking comprehensive consideration of multisource error factors. Therefore, based on the research of the single error factor, multisource errors that affect the surface roughness of a workpiece in machining was investigated in this paper. A prediction model of workpiece surface roughness under multisource error affecting was established to improve the accuracy of prediction models. According to the vibration model, the sensitive direction of roughness can be determined. In the axial direction, the error of each point on the surface is superimposed with the theoretical surface shape to obtain the final surface profile. The three-dimensional morphology was established and the two-dimensional topography can be obtained by intercepting the three-dimensional topography. The roughness simulation value is obtained by extracting the peak value of each point of the two-dimensional topography. A single-point diamond turning experiment is performed to verify the simulation models. The result concluded from the experiment is compared with the simulation result, showing that the error between the simulation and the experiment is less than 4%, which is of great significance to optimizing machining process parameters and improving machining precision of workpiece surfaces for ultraprecision single point diamond turning.
Keywords
Introduction
Precision physics experiments need to eliminate the interference of manufacturing errors on the laws of physics. Aluminum is a vital simulation material in precision physical experiments. Because of the low hardness of aluminum and its strong plastic deformation ability, it is easy to generate lateral plastic flow and elastic recovery during ultraprecision machining of aluminum, which affects the surface roughness of the workpiece. The analysis and prediction of the surface roughness of aluminum alloys caused by many factors can provide excellent technical support for improving the precision of aluminum machining.
Prediction of the surface roughness value of workpieces is a hot topic worldwide.1,2 An effective 3D surface simulation model can be used to analyze the influence of various factors on the machined surface topography. The surface roughness can be calculated by extracting the peak value of each point on the surface topography, which lays a foundation for the optimization of machining parameters, machining systems and the analysis of related errors. It is of great significance to further improve the surface quality.3,4
Many influencing factors, such as cutting parameters, cutting forces, workpiece materials, tool parameters, and the vibration between the workpiece and tool, should be considered in the 3D surface topography prediction model.5,6 According to the research status of surface topography prediction, there are three methods: artificial intelligence,1,4,7–9 experimental methods,10–16 and theoretical analysis methods.17,18
The advantages and disadvantages of the three methods are apparent. The experimental method is executed by a large number of processing experiments and test results for regression analysis. The benefit is based on specific experimental data for data statistics, but the process is very complex. External factors can also interfere with the experimental results. Artificial intelligence is a method of morphological prediction that simulates experimental data. The advantage is that the forecast can be completed without the exact equation, but the reliability is insufficient, and the data integration processing is time consuming. The theoretical method is put out based on the machining mechanism. A rigorous mathematical model is established by the principle of geometric movement between the cutting tool and the workpiece. The visualization results are obtained by correlation simulations. The theoretical method can calculate all kinds of roughness numerically and generate a 2D tool path model. Since the theoretical method can obtain simulation results without cutting experiments and detection, it is also the most widely used method in scientific research at present. 19
When using the theoretical method, factors such as the material and geometric parameters of the tool and workpiece, the relative vibration between the workpiece and the tool, the lateral plastic flow and the elastic recovery should be considered. The material and geometric parameters of the tool and the workpiece are the basic components of the model. Addressing the problem that the surface morphology of a workpiece is affected by vibration, Cheung and Lee 20 established a dynamic surface topography estimation model. Melkote and Liu 21 proposed a model for predicting the surface roughness of aluminum alloys. Considering the influence of lateral plastic flow on roughness, the estimation of the flow stress of the material in the small deformation is more accurate. Sung 22 studied the influence of the contour error of the turning tool on the surface roughness of the workpiece. The improved 2D filter operator and invariant moment operator are combined to extract the cutter tip contour error by edge detection and then calculate the mapping rules between the tool and the workpiece surface quality.
The existing research mainly focuses on the influence of a single factor on the surface roughness, which is relatively extensive, 23 but the multifactor model needs to be further studied. Especially in the field of ultraprecision machining, as the roughness has reached the nanometer level, the influencing factor of a single variable cannot be ignored. Because of the deepening of the research, the difficulty of analyzing multiple factors increases significantly. In this paper, the prediction model of roughness is obtained by 3D shape simulations and by considering several error factors, which refines the existing model. The accuracy of the roughness prediction model is verified by cutting experiments and surface roughness measurements, which lays a foundation for analyzing the influence factors of machining parameters on machining accuracy.
The first section of this article presents the importance of the roughness prediction model and its research status, thus introducing the problem to be solved.
The second section introduces the establishment of a three-dimensional surface model. By modeling the three-dimensional topography of the ideal surface, the roughness predictive value of the ideal surface is obtained. On this basis, considering the influence of multisource errors, the roughness prediction model is obtained by the numerical extraction and calculation of each point of 3D topography.
The third section introduces the simulation process. By determining the relevant parameters and establishing the ideal surface morphology, the predicted value of the ideal surface roughness can be calculated. Taking error factors into account, the prediction results of surface roughness considering multisource errors are obtained.
The fourth section introduces the experimental verification process. By carrying out ultraprecision cutting experiments, the aluminum alloy was turned, and the surface roughness was measured. The accuracy of the roughness prediction model is verified by comparing it with the roughness prediction value.
The fifth section is the conclusion that the accuracy of the roughness prediction model is verified.
Establishment of the three-dimensional surface model
To accurately obtain the roughness of the machined surface, it is necessary to establish the 3D geometry of the machined surface. Considering the influence of lateral plastic flow, elastic recovery, cutting vibration and other errors, the final 3D geometric model is obtained, and the surface roughness is calculated.
Three-dimensional models of ideal machined surface
The machining surface can be regarded as a process of reflecting the tool path and tool profile to the surface of the workpiece. According to the geometrical relationship, when the rotational speed is constant, the theoretical path of the cutter is a two-dimensional helix. Therefore, the equation for calculating the profile and roughness of the theoretical machined surface is obtained as shown in equations (1) and (2). The theoretical machined surface contour can be represented as shown in Figure 1.
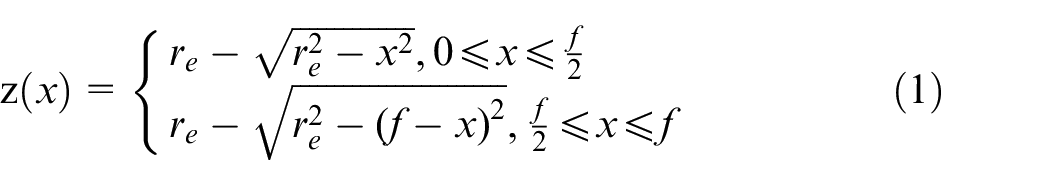
Theoretical surface topography.
Since
where
The above expression and the model of surface contour are both ideal, the actually machined surface roughness is usually higher than the theoretical value. In practice, the roughness is affected by the lateral plastic flow and elastic recovery. The former increases the surface roughness, and the latter decreases the surface roughness. In addition, the surface roughness of the workpiece is disturbed by vibration during the cutting process, which increases the roughness. Therefore, all these factors need to be considered in the actual simulation to obtain a more accurate roughness prediction model.
Effects of lateral plastic flow and elastic recovery on surface roughness
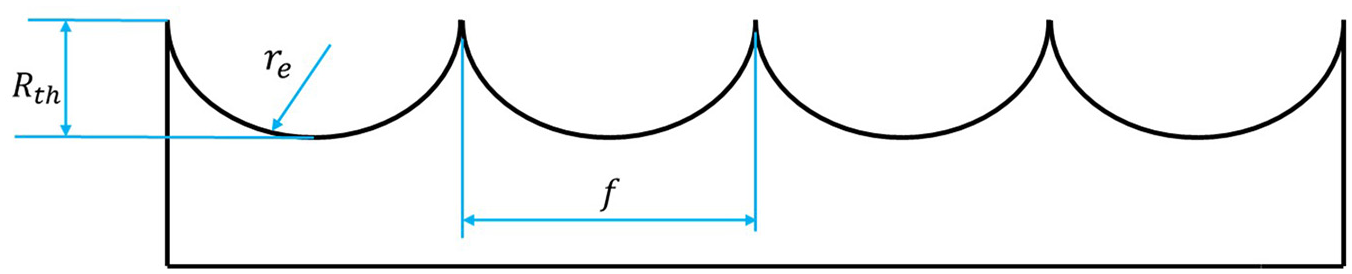
Due to the enormous contact stress between the tool and the workpiece, the contact will produce plastic deformation on the surface of the workpiece, which in this process can be regarded as a viscous fluid. However, after the tool is removed, to release the stress, the material flows back to the cutting edge, and this process can be seen as lateral plastic flow. In addition, a part of the machined surface where the tool has been extruded recovers to the machined surface. As shown in Figure 2, the cutting surface begins to separate at point O; the chip thickness is m, and n represents a lateral flow of plastic due to the deformation of the tool by squeezing friction, which increases the surface roughness. e is a part of the extrusion elastic deformation, and the machining surface is finally restored. The elastic recovery of e reduces the value of the surface roughness.
Cutting model.
Lateral plastic flow leads to material flow to both sides, which influences the surface topography height and further affects the surface roughness of the workpiece. Liu and Melkote established a lateral plastic flow calculation model by analyzing the scratch experimental principle and combining the tool angle and cutting force. The plastic and elastic deformations in scratch experiments can be obtained by (3) and (4), 22 and rheological properties x are based on the ratio of the two values.

where
The lateral plastic flow in cutting and scratching tests 22 considers the effect of the material on the strain gradient hardening on both sides of the tool. The equation (5) can be rewritten as:
where
Considering the lateral plastic flow as a function of the rheological coefficient x, 25 it can be assumed that the profile height is:

where
The average flow stress in (6) can be obtained from the parameters of cutting force and tool rake angle:
where
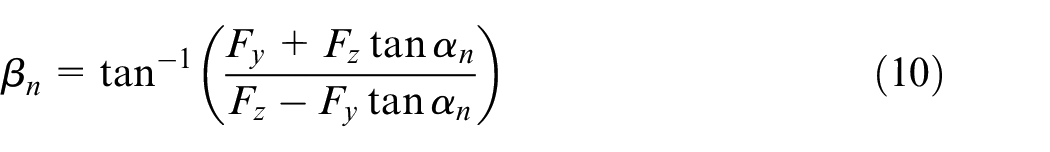
where
where
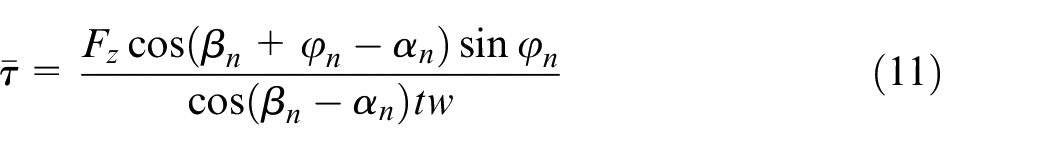
The average flow stress for metal cutting is:

From the above equation, the profile height of the lateral plastic flow is Rp:
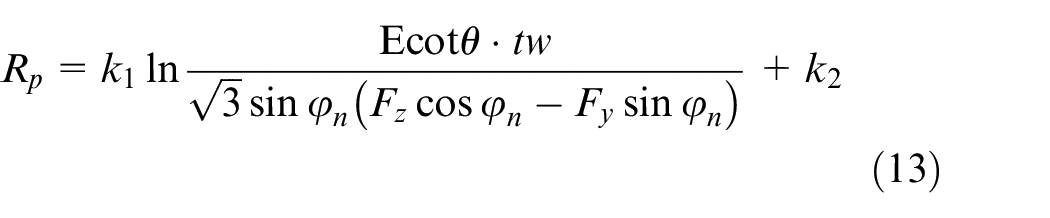
The derivation of equation (13) is shown in Appendix A. Considering the influence of elastic recovery, the elastic recovery of the surface of the workpiece is calculated by obtaining the material hardness of the workpiece, the elastic recovery coefficient related to the material properties of the workpiece, the elastic modulus of the workpiece and the sharpness of the cutting tools. The calculation equation is as follows:
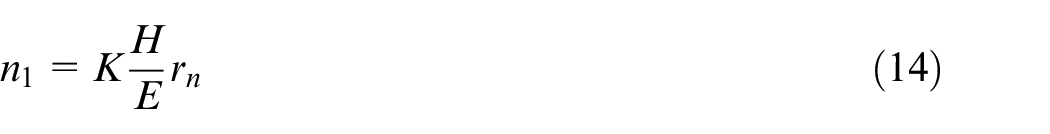
where n1 is the elastic recovery amount of the surface of the workpiece, H is the elastic recovery coefficient related to the material attribute of the workpiece, K represents the material hardness of the workpiece, rn is the sharpness of the cutting tool, and E is the elastic modulus of the workpiece.
Based on the research of Gao et al., 26 the morphology of the processed surface after plastic flow is similar to that of previous results, and combined with elastic recovery, as shown in Figure 3, the relationship between the actual profile and the theoretical profile is as follows:
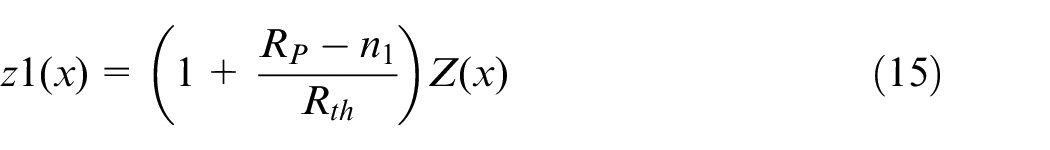
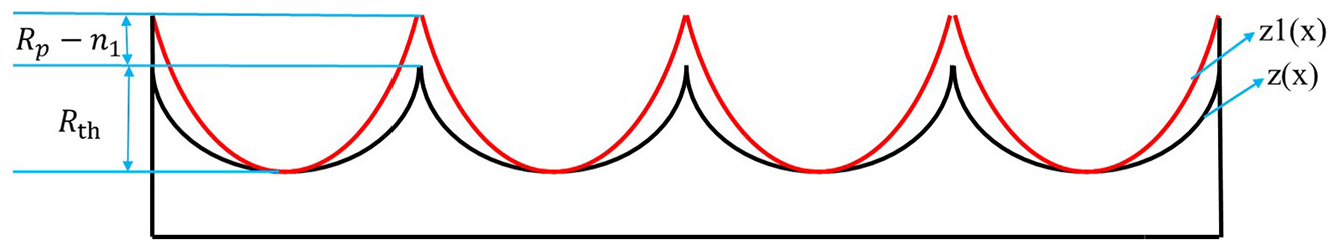
Contrast figure of contours considering elastic recovery and lateral plastic flow.
Influence of machining vibration on surface roughness
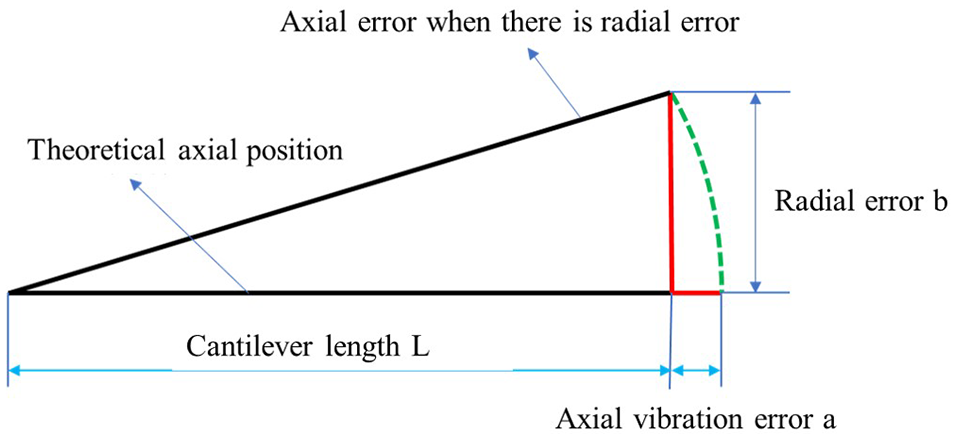
Vibration during processing is caused by a variety of factors, such as external vibration interference, spindle vibration, and tool vibration. To conveniently model and analyze the effect of vibration on surface roughness, vibration can be divided into two parts: axial vibration and radial vibration of the workpiece surface. 27 Only the relative vibration between the tool and the workpiece should be considered. When cutting the plane, the tool tip is perpendicular to the workpiece and placed along the axial direction, the surface roughness is caused by the axial direction of machining. The error caused by axial vibration can be directly mapped on the surface of the workpiece. It is necessary to analyze the axial vibration error of the workpiece surface caused by axial vibration and radial vibration. The error caused by radial vibration is shown in Figure 4. Both the tool and the spindle can be regarded as a cantilever structure. When radial vibration occurs, the position of the spindle is shifted along the green dashed line, resulting in the error indicated by the red line in Figure 4, which is the error in both the radial and axial directions.
Errors caused by radial vibration.
From the geometrical relationship shown in Figure 4, the axial error relationship caused by radial vibration can be obtained as follows:

The length of the cantilever beam L is micron because the radial error b is tens to several nanometers, so b << L, and the calculated a << 1 nm. Therefore, the calculated axial vibration error of the workpiece surface can be neglected, and the axial vibration direction is the sensitive direction of the error.
To facilitate the estimation of axial vibration, it is modeled as a sine function, which can be expressed as follows:

where
By superimposing it with equation (15), the value of the actually machined surface roughness can be obtained. According to the previous vibration test, the amplitude of vibration is at the nanometer level. The method of fitting random vibration by a sine function can add the influence of vibration to the prediction model.
Simulation and experiment
Ideal contour simulation model
Figure 3 shows that the machined profile with respect to the lowest symmetry can be considered a quadratic function

To be calculated easily, the lowest point of the topography is set as the origin of the coordinates, so b = 0. Taking b = 0 into the boundary conditions as follows:
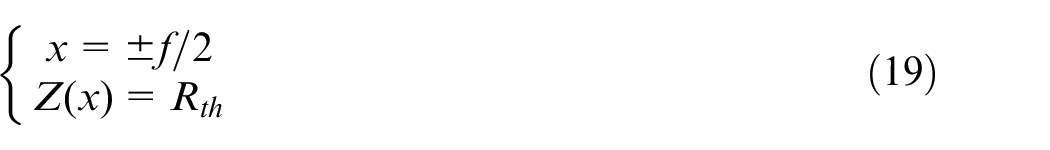
Calculated by
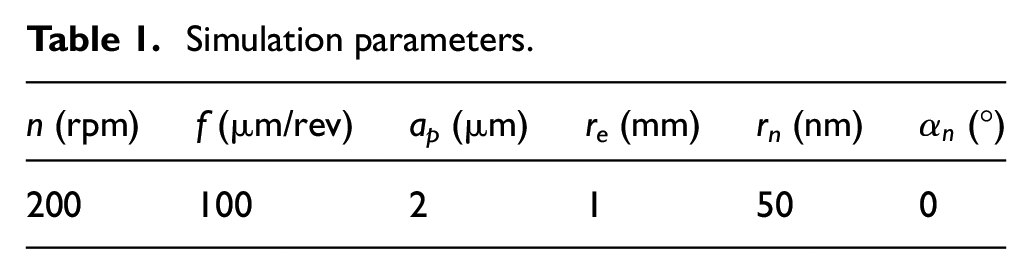
The simulation parameters are shown in Table 1:
Simulation parameters.
Taking the simulation parameters into account, the ideal 2-D tool motion and surface profiles can be obtained, as shown in Figures 5 and 6.
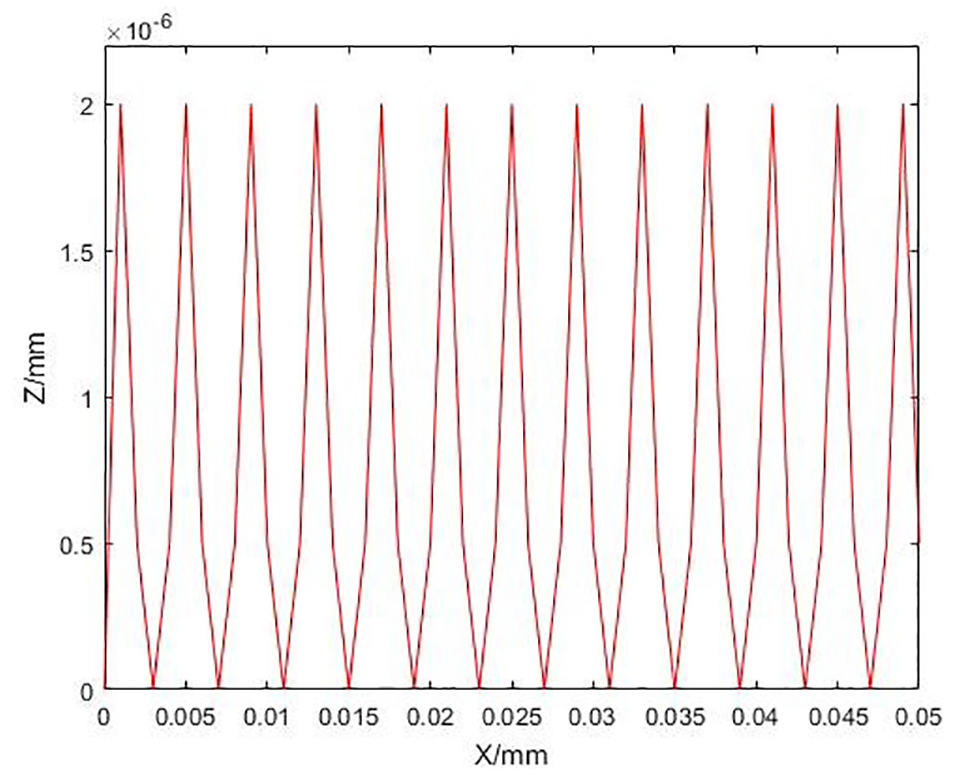
Theoretical diagram.
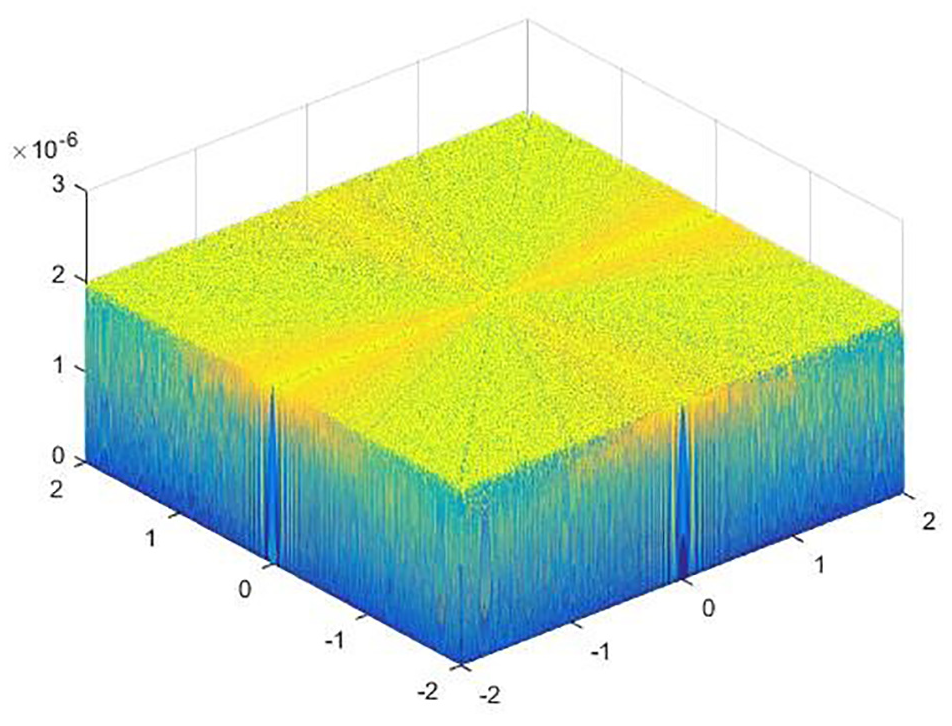
Theoretical three-dimensional topography.
Shape simulation considering errors
Determination of cutting force parameters
The chips formed by using diamond tools are intact and separated. For using the natural diamond tool with a sharp cutting edge, the influence of cutting force can’t be ignored. 28 The cutting force Fc of ultraprecision machining is very small, and related to the cutting area Sc and the cutting force coefficient, which can be expressed as equation (20) 29 :

where Fc is the cutting force,
Sc is the cutting area. It can be obtained from equation (21) 30 :
Since the plane is fed at a constant linear speed and the cutting area is constant, the cutting area can be obtained from the parameters in Table 1. The cutting area is calculated through the depth of cut at each point of the machined surface, and then the cutting force is calculated. Substituting the cutting force into the equation of lateral plastic flow, the value of lateral plastic flow is obtained.
Determination of vibration parameters
According to the vibration test and the analysis above, the Z-axis vibration of the diamond lathe holder is tested. The vibration experiment is shown in Figure 7. The laser vibrometer measures the amplitude of the motion and the static vibration. The results are shown in the following Figures 8 and 9.
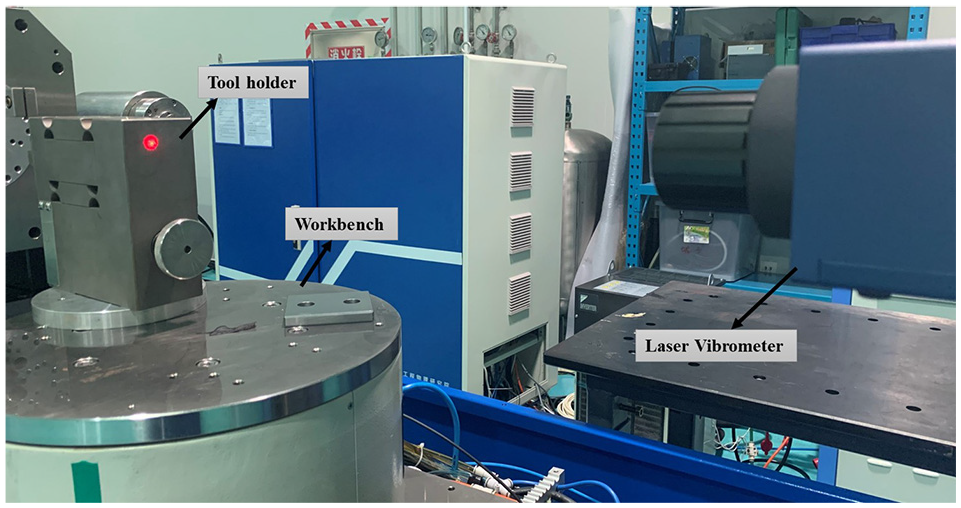
Vibration experiment.
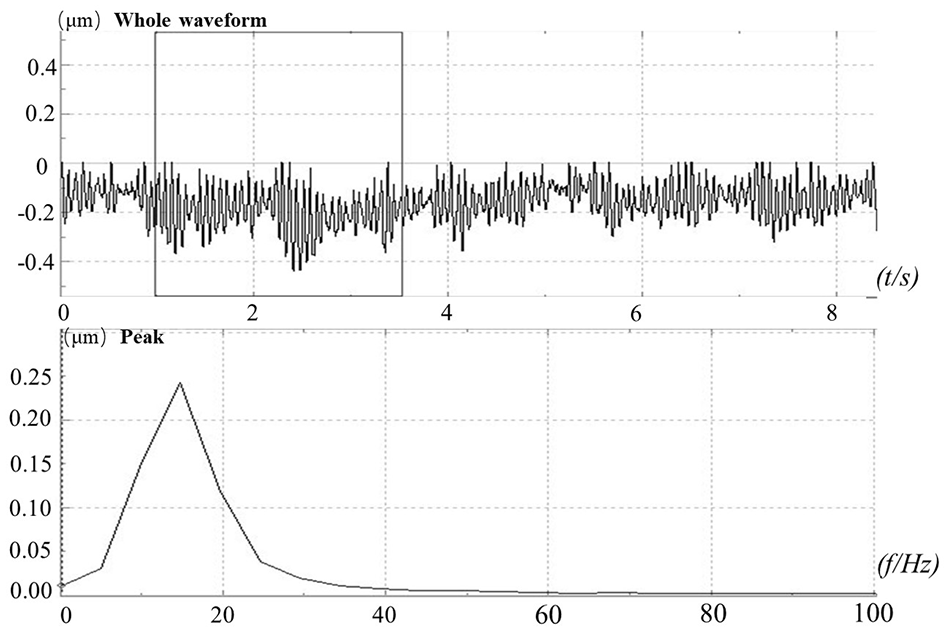
Vibration measurement results of the tool holder with no movement.
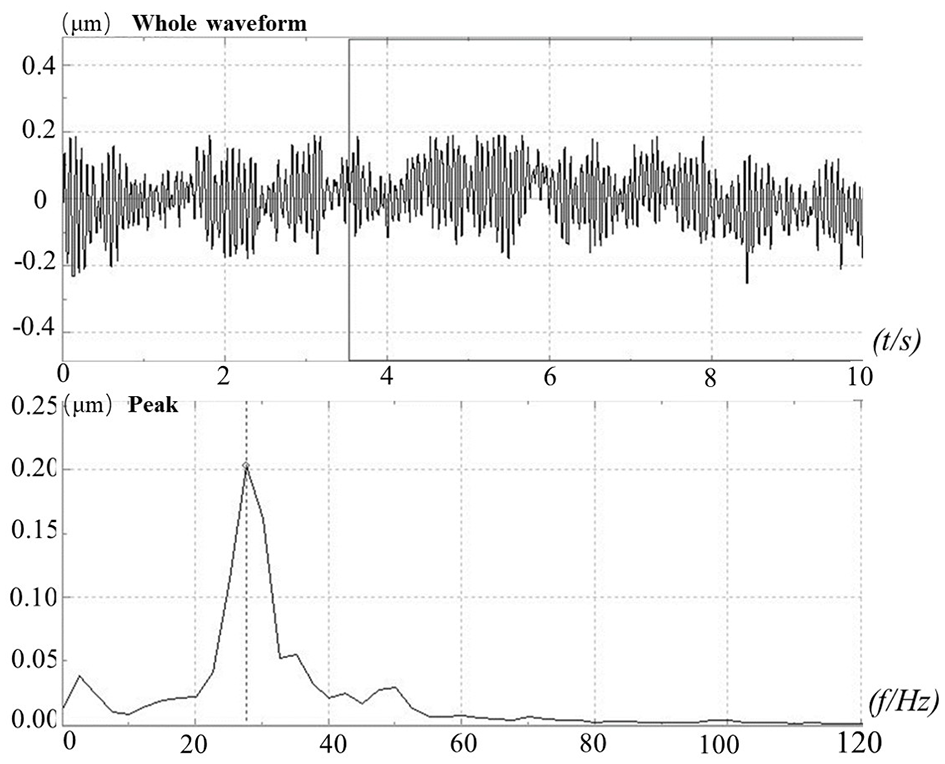
Measurement results of tool holder during movement.
Generally, measured vibration is low-frequency vibration because the machine tool has its own isolation spring and other vibration isolation devices. By comparing the average amplitude of vibration, the amplitude and frequency of vibration can be obtained. Adding the comparison results to equation (17), the interference model of vibration in machining can be obtained. The workpiece is made of an aluminum alloy, the elastic modulus E is 69.9 GPa, and the hardness G is 980 MPa. Taking the above parameters into account, the 3D shape and the 2D trajectory map can be obtained in Figures 10 and 11. Based on standardISO-25178, the arithmetical mean deviation of the assessed profile Ra, the root means square roughness Rq and the maximum height of profile Rz can be obtained through the calculation equation of each roughness.
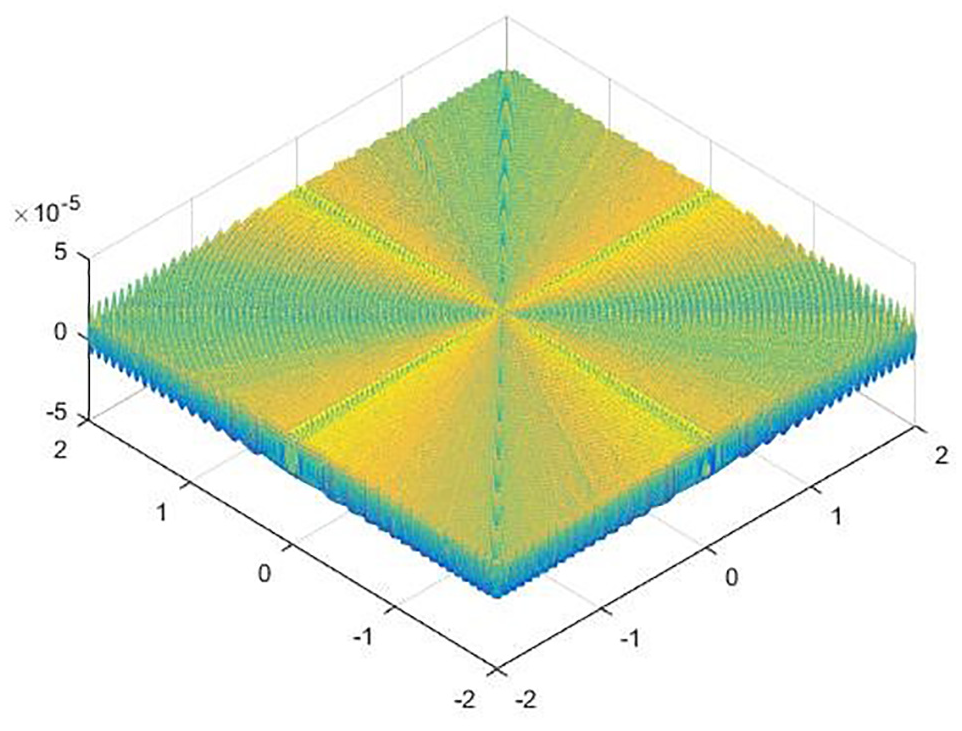
Three-dimensional topography with error added.
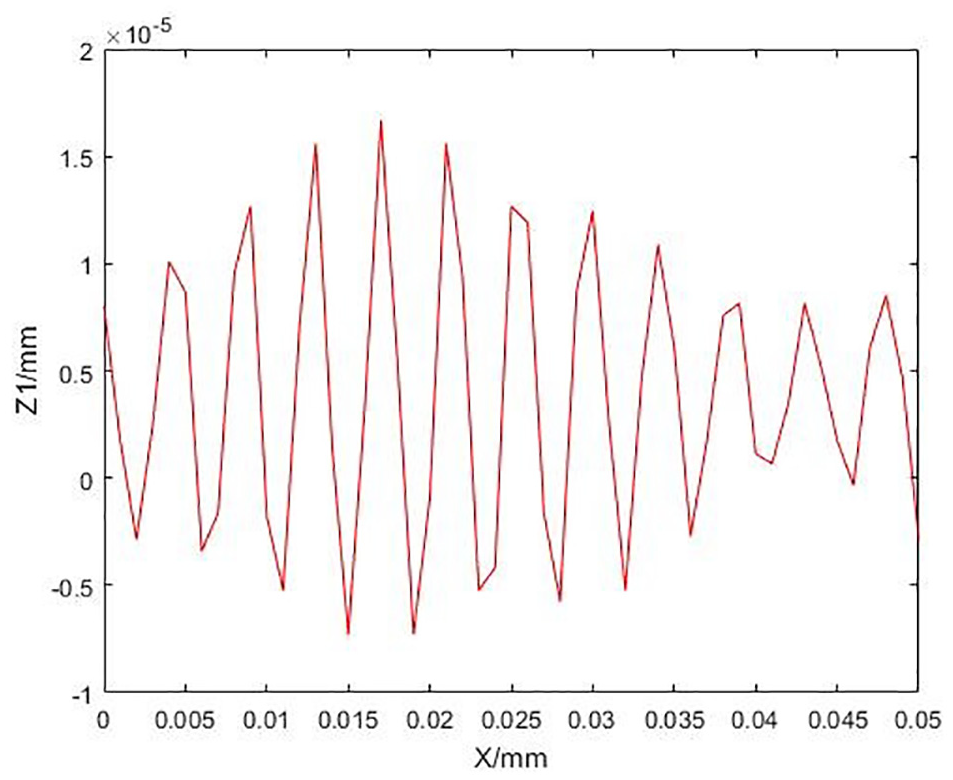
Two-dimensional tool path diagram with error added.
Experiment and analysis
To better analyze and verify the roughness estimation accuracy of the simulation model, the surface cutting experiment of aluminum alloy 6061 was performed by ultraprecision single point diamond turning, and the surface roughness of the workpiece was measured by a white light interferometer. The experimental results are compared with the simulation results, and finally, error analysis is performed.
Cutting and testing experiments
A single point diamond lathe is used to machine the Al 6061 plane. To ensure the accuracy of the experiment, the machining parameters and tool parameters were same as shown in Table 1. The experimental process is shown in Figure 12. The shape of the workpiece is a plane with a diameter of 80 mm and a thickness of 20 mm.
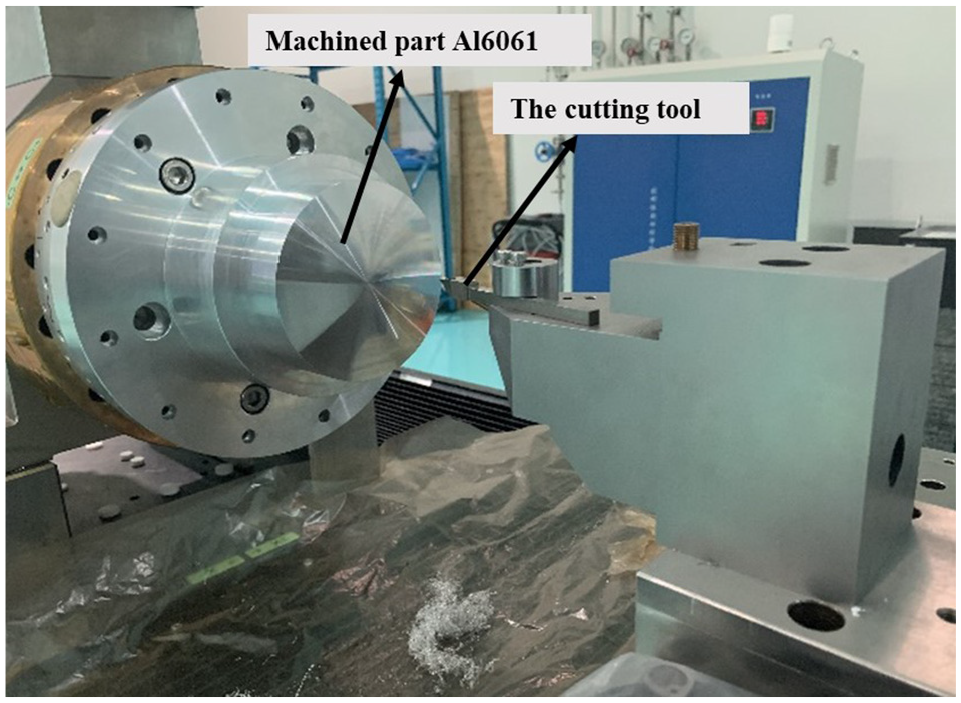
Experimental setup for single point diamond turning.
The surface roughness of the workpiece is detected by a white light interferometer, and the test results are shown in Figure 13. According to standard ISO-25178, the arithmetical mean deviation of the assessed profile (Ra) is 5.7492 nm, the root means square roughness (Rq) is 6.8553 nm, and the maximum height of profile (Rz) is 29.539 nm.
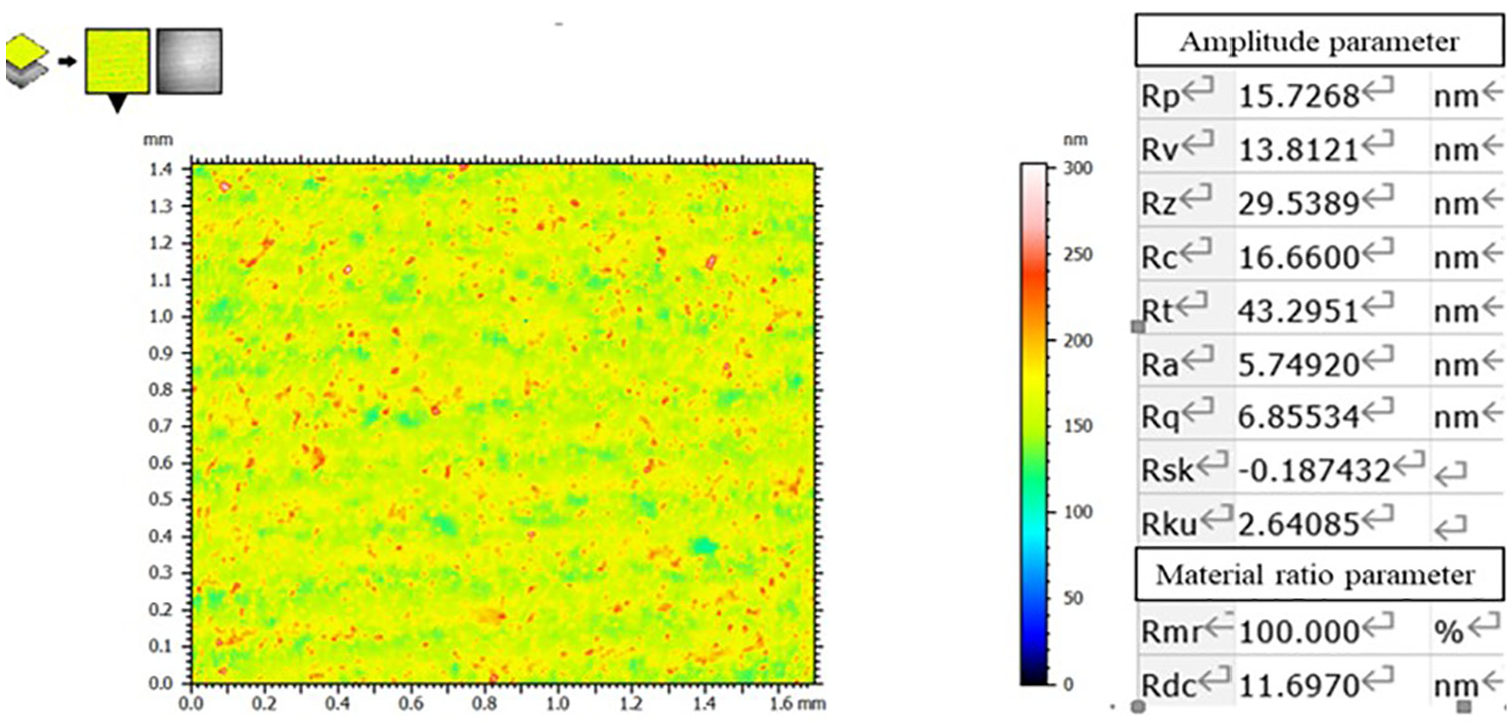
Machined surface topography and roughness values.
Error analysis
According to the simulation results, the roughness values of Ra, Rp, and Rz can be calculated by using the equation. The error value is shown in Table 2.
Comparison of simulation and experimental results.
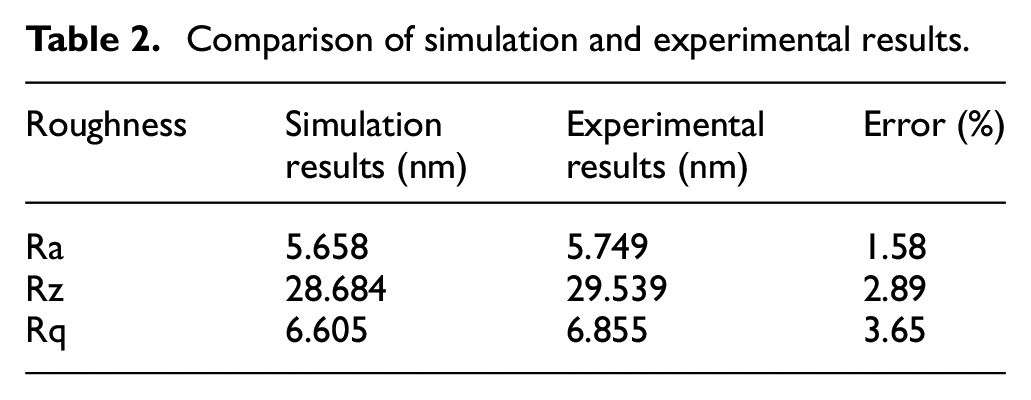
According to the abovementioned comparative analysis, this model can estimate multiple roughness values. It can be used to estimate the roughness of machined surfaces with different materials and different roughness requirements. Nevertheless, there are many reasons for the prediction error.
According to the above comparative analysis, the model can estimate the arithmetical mean deviation of the assessed profile Ra, the root means square roughness Rq, and the maximum height of profile Rz. Therefore, the roughness estimation of machined surfaces with different roughness requirements can be satisfied. The root mean square roughness of the contour represents the mean square of the mean number, which can reflect the roughness synthesis. The whole calculation error is guaranteed to be within 4%.
The prediction error is also caused by many other factors. The amplitude and frequency considered in the previous vibration test experiment are irregular. Adding a sine wave to the model to simplify the vibration analysis model also generates errors. In the vibration test, the measured vibration is low-frequency vibration. In practice, there are also high-frequency vibrations, but the vibration amplitude is very small, which also has a certain impact on the overall roughness.
Conclusion
In this paper, the influence of kinematics, tool geometry, lateral plastic flow, and elastic recovery on surface roughness prediction are comprehensively considered. Based on the vibration model of tool and workpiece, the sensitive direction of vibration is determined. Based on the Multi-source error cutting model, a 3D topography model is established. The lateral flow of plastic will increase the surface roughness, the elastic recovery will reduce the value of the surface roughness. On this basis, the coupling of vibration will increase or decrease the peak part of the surface of the workpiece, which is the result of the joint action of the model established in Section 2. In the axial direction, the error of each point on the surface is superimposed with the theoretical topography to obtain the final surface profile.
Finally, each point is extracted to calculate the surface roughness prediction value. By comparing the predicted and experimental values of Ra, Rp, and Rz, the accuracy of the roughness prediction model is verified. The coupling effect of multi-source error will increase the surface roughness value. The roughness prediction model established in this paper considers multi-source errors. The vibration sensitive direction is determined through modeling analysis, and the influence of vibration is added to the model. The prediction model can predict three different roughness values, which improves the practicability of the surface roughness prediction model and provides a new idea for establishing the roughness prediction model.
Footnotes
Appendix A
Substituting equation (11) into equation (12),
Bring in
Equation (10) can be simplified to:
According to the literature,
19
Declaration of conflicting interests
The author(s) declared no potential conflicts of interest with respect to the research, authorship, and/or publication of this article.
Funding
The author(s) disclosed receipt of the following financial support for the research, authorship, and/or publication of this article: The work is supported by President’s Fund of China Academy of Engineering Physics (No. YZJJLX2020006), Sichuan Science and Technology Program (No. 2021YJ0051, 2020YJ0031).