
Abstract
Friction stir welding (FSW) of high strength materials is challenging due to high tool cost and low tool life. To address this issue, the present investigation deals with an alternative of plasma-assisted friction stir welding (PFSW) of DH36 steel with WC-10%Co tool. Plasma preheating current (13 A, 15 A, and 17 A) was varied by keeping other FSW parameters as constant. During the FSW and PFSW process, force measurement and thermal history aided in a deep understanding of the process, tool degradation mechanisms, accompanied by the mechanical and microstructural characterization of the welded joints. The stir zone hardness was increased from 140 HV0.5 to about 267 HV0.5. The yield and tensile strength of weld increased from 385 MPa and 514 MPa to about 391 MPa and 539 MPa, respectively. Weld joint elongation (%) was increased from ~10% of weld 1 to ~13.89% of weld 4. During PFSW, the process temperature was increased, the cooling rate was lowered, and the weld bead was widened. The results also revealed that the plasma-assisted weld resulted in polygonal (
Highlights
Plasma assisted friction stir welding was carried out on DH36 shipbuilding steel.
Welded joints showed superior mechanical properties to the base material.
Process force was reduced significantly during the plunge stage in plasma-assisted friction stir welding.
Weld grain morphology was significantly affected by heat input and cooling rate.
Tool wear was reduced by 58% in plasma-assisted friction stir welding.
Introduction
The demand and market of welding and joining industries is increased swiftly after the development of advanced materials. The welding and joining of advanced materials requires efficient design and competent manufacturing process. High strength structural steels for the ship hull and superstructure imparts significant weight saving and improved mechanical properties. 1 The application of these high strength steel in shipbuilding industries also challenges the existing welding industries to innovate the welding processes and design.1,2
Due to the solid-state nature of the friction welding process (FSW), it results in less weld distortion and comparatively high strength than conventional fusion welding techniques.3–6 Additional benefits of the solid-state FSW process are:
Thermally assisted friction stir welding is a choice in which an additional heat source is utilized to preheat the workpiece material. The workpiece can be preheated by using resistance heating, induction heating, TIG heating, and laser source heating.
13
The assisted FSW process’s primary purpose is to soften the workpiece, reduce the welding forces, reduce tool wear, and increase productivity.
1
Álvarez et al.
15
reported that force was reduced by 33% and 40% during the plunge and welding stage, respectively, in Laser-assisted FSW (LFSW). LFSW resulted in higher tool life in the joining of high strength marine-grade steel. Song et al.
16
carried out laser-assisted FSW on Inconel 600 alloy. SZ hardness was increased from 185 HV of base material to 205–250 HV after welding. Transverse tensile specimens were fractured in the base material indicated good strength of the welded portion including the heat affected zone. Sun et al.
17
investigated the effect of laser preheat source (LFSW) on medium carbon S45 steel. Due to increased heat input and lower cooling rate in LFSW, martensite structure was prevented up to the welding speed as high as 600 mm/min. The heat input was increased when the laser was shifted from AS to RS. LFSW reduced the requirement large downward forces and increased the welding speed. However, their study was not focused on the optimized process parameters. Joo et al.
18
investigated the dissimilar joint of
The literature confirms that a high plunge force is required to generate sufficient frictional heat to produce the weld during the FSW of steel. Although PFSW has various advantages, like low-cost setup, highly focused and stable arc, and greater energy concentration, PFSW of steel is rarely published. The present work is aimed to develop the PFSW process and investigates its effect on the tool life and weld quality. The weld microstructure and mechanical properties are correlated with the heat input and cooling rate during the process. In the last, tool degradation is compared during FSW and PFSW of DH36 steel.
Methodology
Materials
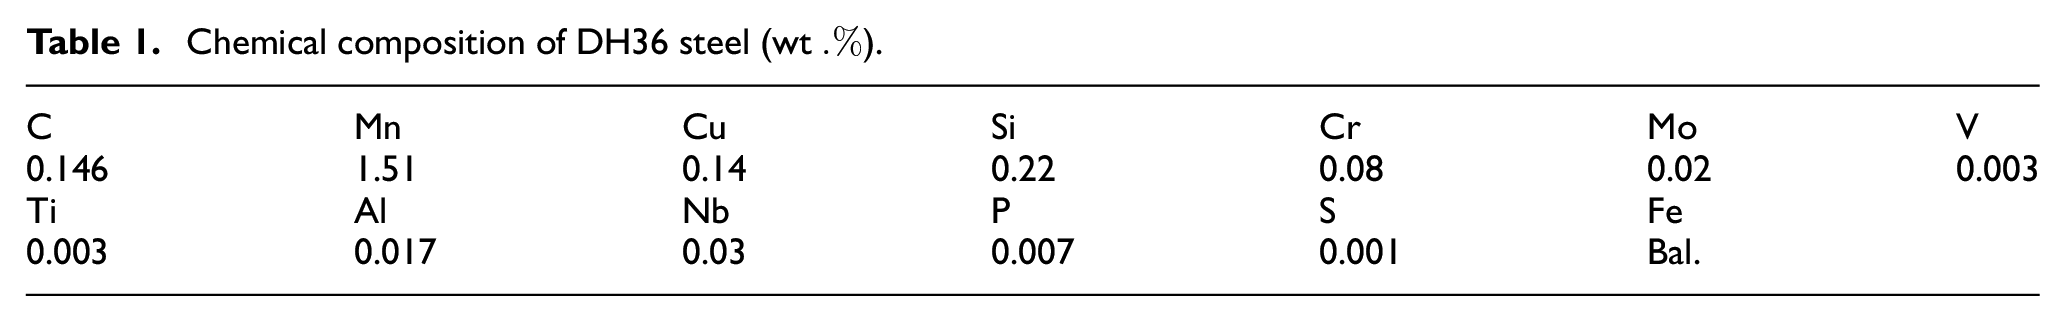
Friction stir welding (FSW) was performed on DH36 steel in butt joint configuration. The dimension of the DH36 plates was 240 mm × 100 mm × 4 mm. The chemical composition (in wt.%) of DH36 steel is given in Table 1. The tool material and tool design was selected based on trial experiments and the authors’ previous research.25–27 The tool shoulder diameter and tool pin length was 25 mm and 3.5 mm respectively. A tapered pin geometry, tapered from 7 mm-at the tool shoulder and 5 mm at the free end, was used in the study. The tool plunge depth was set to be 0.2 mm with a backward tool tilt angle of 2°. The transformation temperatures that is, A1 and A3 of DH36 steel were calculated to be 731 ± 24°C and 843 ± 33°C, respectively. 7
Chemical composition of DH36 steel (wt
Experimental setup
A schematic representation of the plasma preheating is depicted in Figure 1. A plasma arc welding machine is used to preheat the workpiece material during the plunge and traverse stages, as illustrated in Figure 1(a). The plasma-assisted FSW process is shown in Figure 1(b).
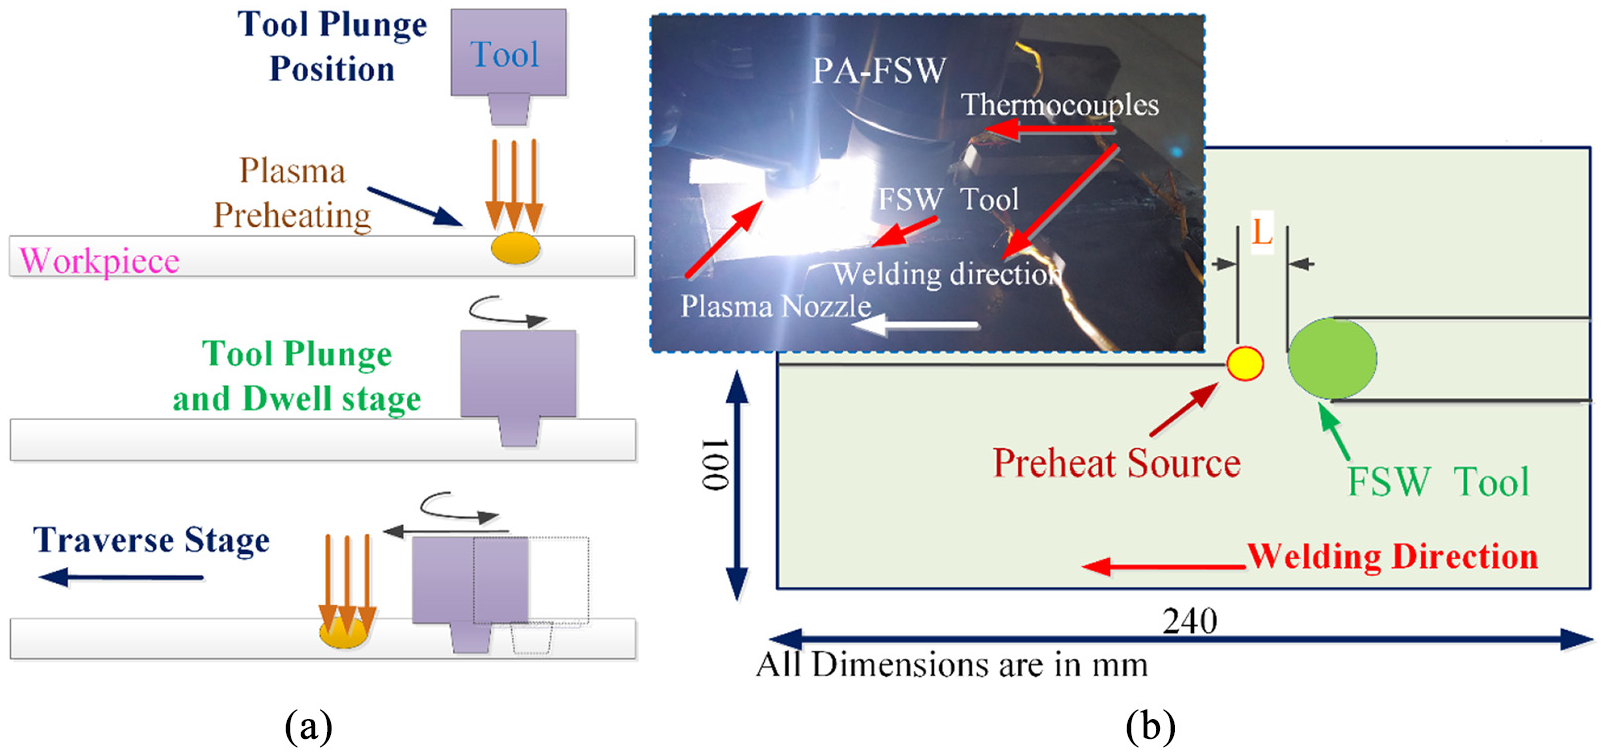
Plasma assisted friction stir welding (PFSW) process: (a) illustration of preheating stages of PFSW process, and (b) plasma heat source layout ahead of the FSW tool.
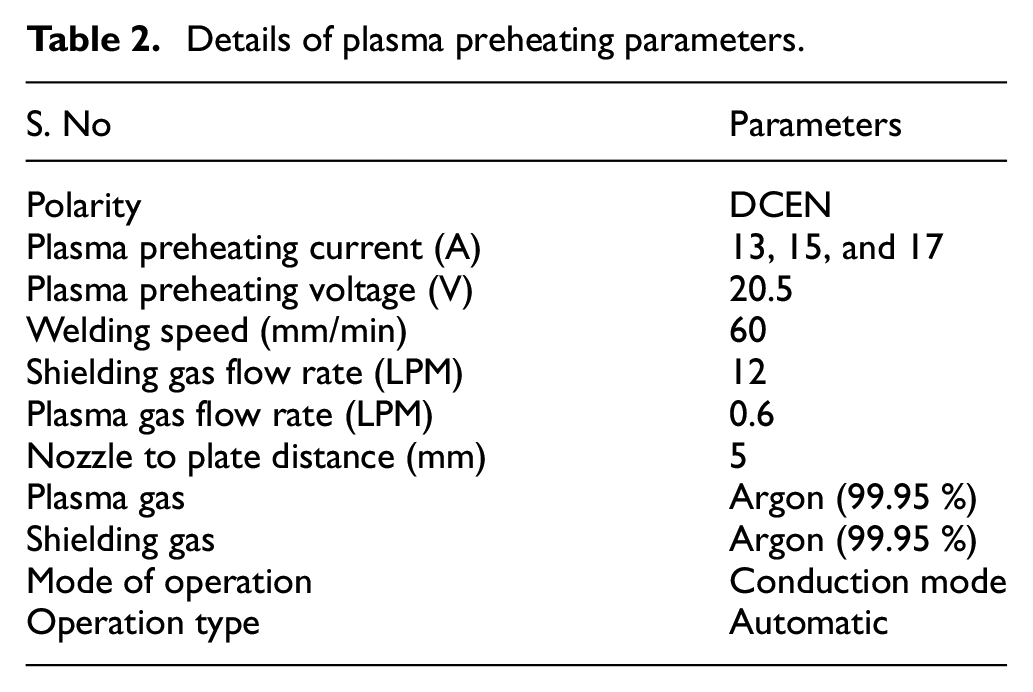
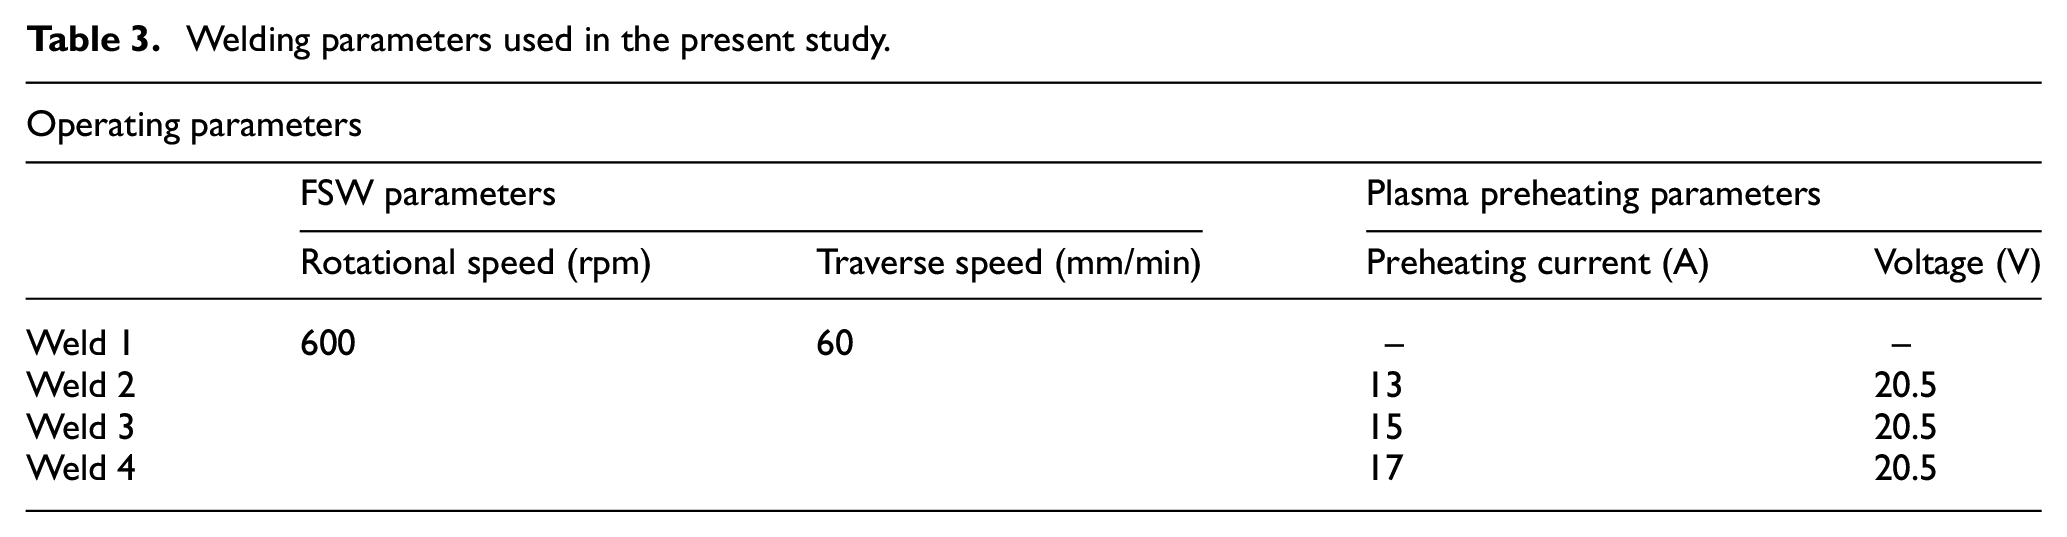
Plasma preheat parameters, used in this investigation, is provided in Table 2. Transferred arc mode (i.e. between the tungsten electrode and the workpiece plate) is employed with DCEN polarity in conduction mode. Welding is performed at different plasma preheating currents (i.e. 13 A, 15 A, and 17 A) to check the effect of preheating temperature on tool life and weld quality. The welding was performed at a constant rotational and traverse speed of 600 rpm and 60 mm/min, respectively. From previous research of Ahmad et al. 23 and Sun et al., 17 and experimental works carried out in the laboratory, the plasma arc is set at 20 mm ahead of the FSW tool. Process parameters investigated in the present study are summarized in Table 3.
Details of plasma preheating parameters.
Welding parameters used in the present study.
Transient temperature and force measurements
K-type thermocouples were inserted in the weld plates to measure the thermal history, as illustrated in Figure 2. On each plate, holes were drilled of 1 mm diameter, and thermocouples were inserted into these holes. The thermocouples (TC1 and TC2) are located in the mid-region (i.e. 2 mm from top and bottom both), and each 8 mm away from the weld centerline, as indicated in Figure 2. Thermocouples connected to channels 1–2 in the data acquisition system (DAQ) to record the transient temperature profiles.
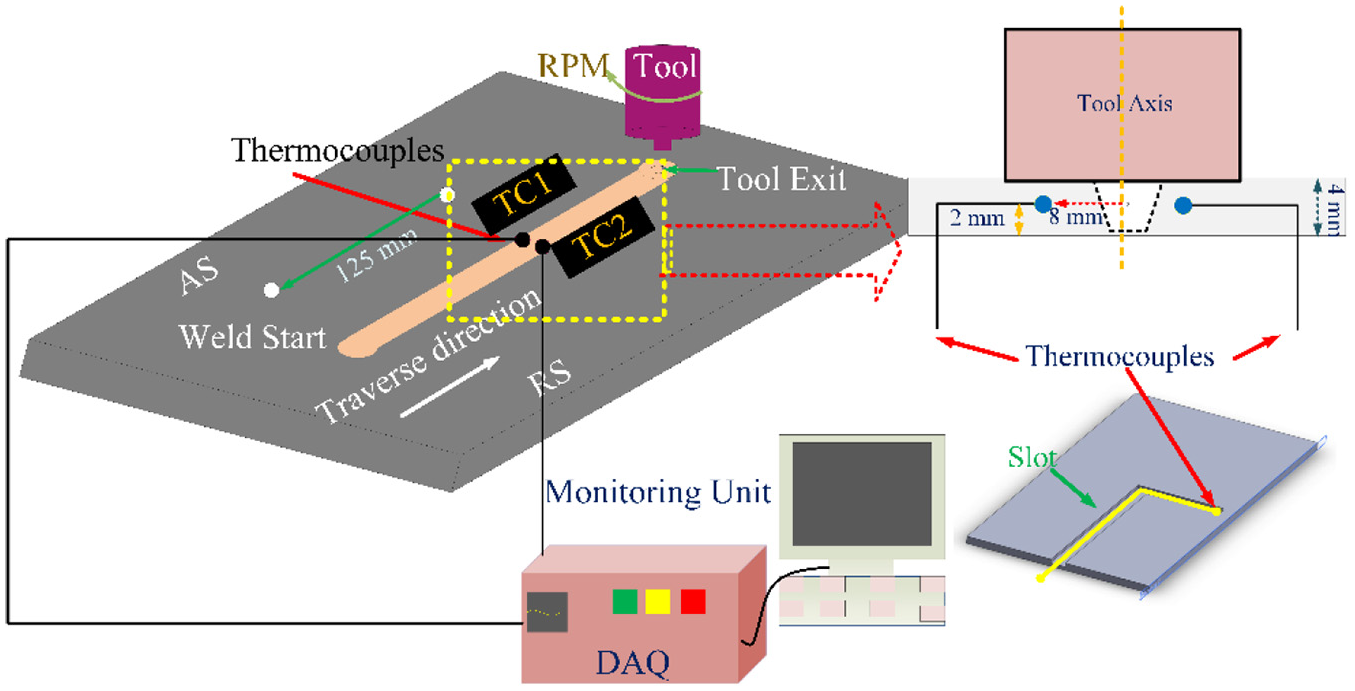
Schematic diagram of the thermocouple layout used to record transient thermal history during welding.
Strain gages type force sensors were used with a data acquisition system (DAQ) to record the transient force data during the plunge, dwell, and traverse stage. DAQ systems were used to record transient temperature and force data during welding. Welding force was recorded for all FSW stages (i.e. plunge, dwell, and traverse stage) for with and without preheating cases, as summarized in Table 3.
Metallographic and mechanical properties characterization
For metallographic study, samples were grinded and then polished to mirror-finish using alumina powder. Polished samples were etched with 2% Nital solution for 25 s. The etched specimen were investigated for microstructural study under optical microscope, field emission scanning electron microscope (FESEM), and energy-dispersive analyses (EDS). Microhardness was evaluated at three different layers using a Vickers micro-hardness tester, with a load of 4.9 N for a dwell time of 15 s. Tensile tests were performed at a crosshead speed of 1 mm/min as per ASTM-E8 standards. The Charpy impact test was performed on 4 mm thick specimens at room temperature as per ASTM-E23 standards.
Results and discussion
Surface appearance and force evaluation
Figure 3(a) shows the welded joints’ surface appearance for FSW and PFSW, as illustrated in Table 3. The surface appearance of the plasma-assisted welded joints is better than the conventional FSW joints on visual inspection. Surface flaws are absent in the PFSW joints except in weld 4 where excessive flash is generated. This excessive flash may be associated overheating that led to excessive plasticization of the material in weld 4. All the welds were free from visual volumetric defects. The better surface appearance in the energy-assisted FSW is in line with those reported in the literature.13,28,29
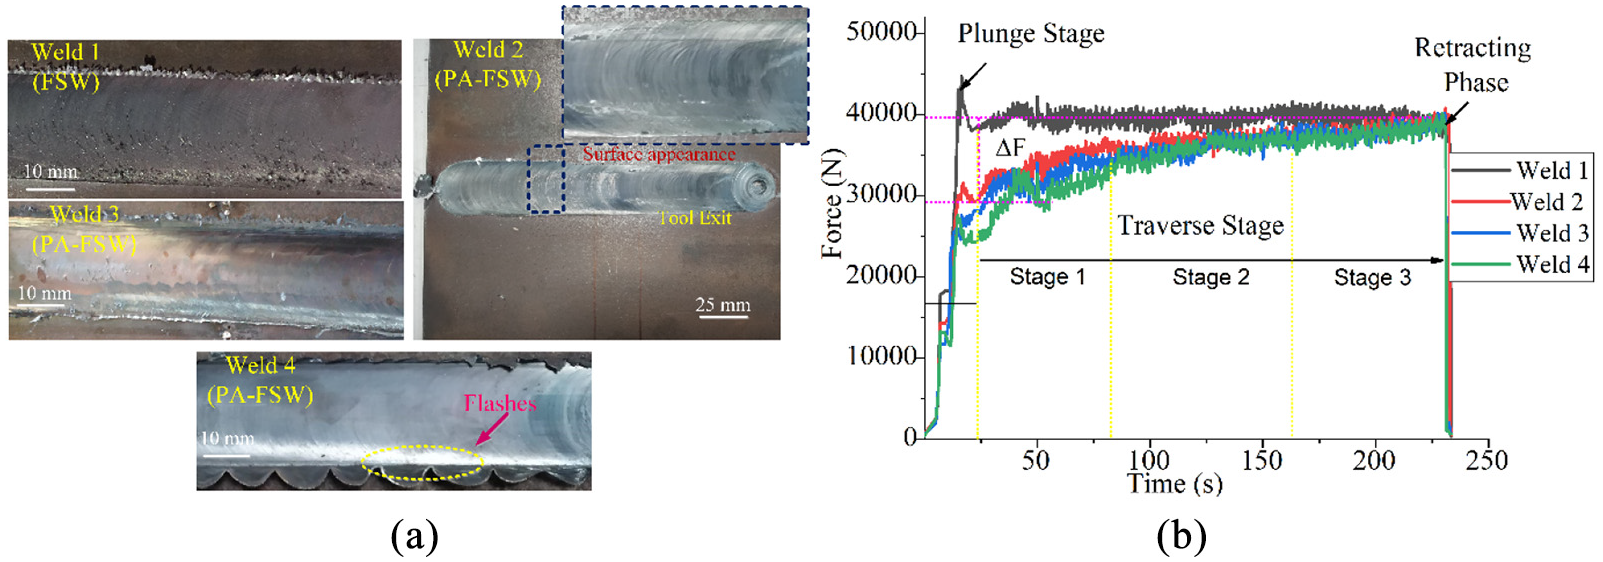
(a) Weld top surface appearance at different welding conditions and (b) the corresponding downward axial force during the welding.
Figure 3(b) shows the downward axial force corresponding to the welding conditions mentioned in Table 3. Three welds were performed for repetition, and experimental uncertainty in the measurement of force is predicted to ±8%.
In weld 1, the maximum force is observed at the plunge stage due to insufficient thermal softening of the material. The z force decreased during dwelling due to thermal softening of the workpiece material by a steady heat source. The total weld traverse stage is divided into three stages that is, stage 1, stage 2, and stage 3. At the traverse stage during weld 1, the downward force remains almost constant (i.e. 39.64 kN) during the total weld length (i.e. stage 1 to stage 3). For comparison of the z force for FSW and PFSW cases, change in force is calculated as
The downward force calculated by equation (1) indicates that the z force is reduced by 31.6% and 5.67% for the plunge stage and traverse stage, respectively, for weld 2. In weld 3 and weld 4, plunge force is reduced by 32.77% and 33.89%, respectively. Since the preheating energy had already softened the workpiece material, plunge force is reduced and huge fluctuations are observed during PFSW cases that is, weld 2, weld 3, and weld 4. As the tool started traversing, there was a steep increase in z force. In traverse stage 3, the welding force is almost numerically the same as the value recorded for weld 1. During the traverse stage of FSW and PFSW, z force difference is significantly less and this effect further diminished at the end of the weld. The impact of plasma preheating is reduced during the traverse stage due to huge heat loss to the FSW bed and fixtures by heat conduction. After stage 1, the effect of preheating diminished, and the downward z forces increased in stage
Figure 4 shows the macro classification at the weld top surface for the conventional FSW and PFSW.
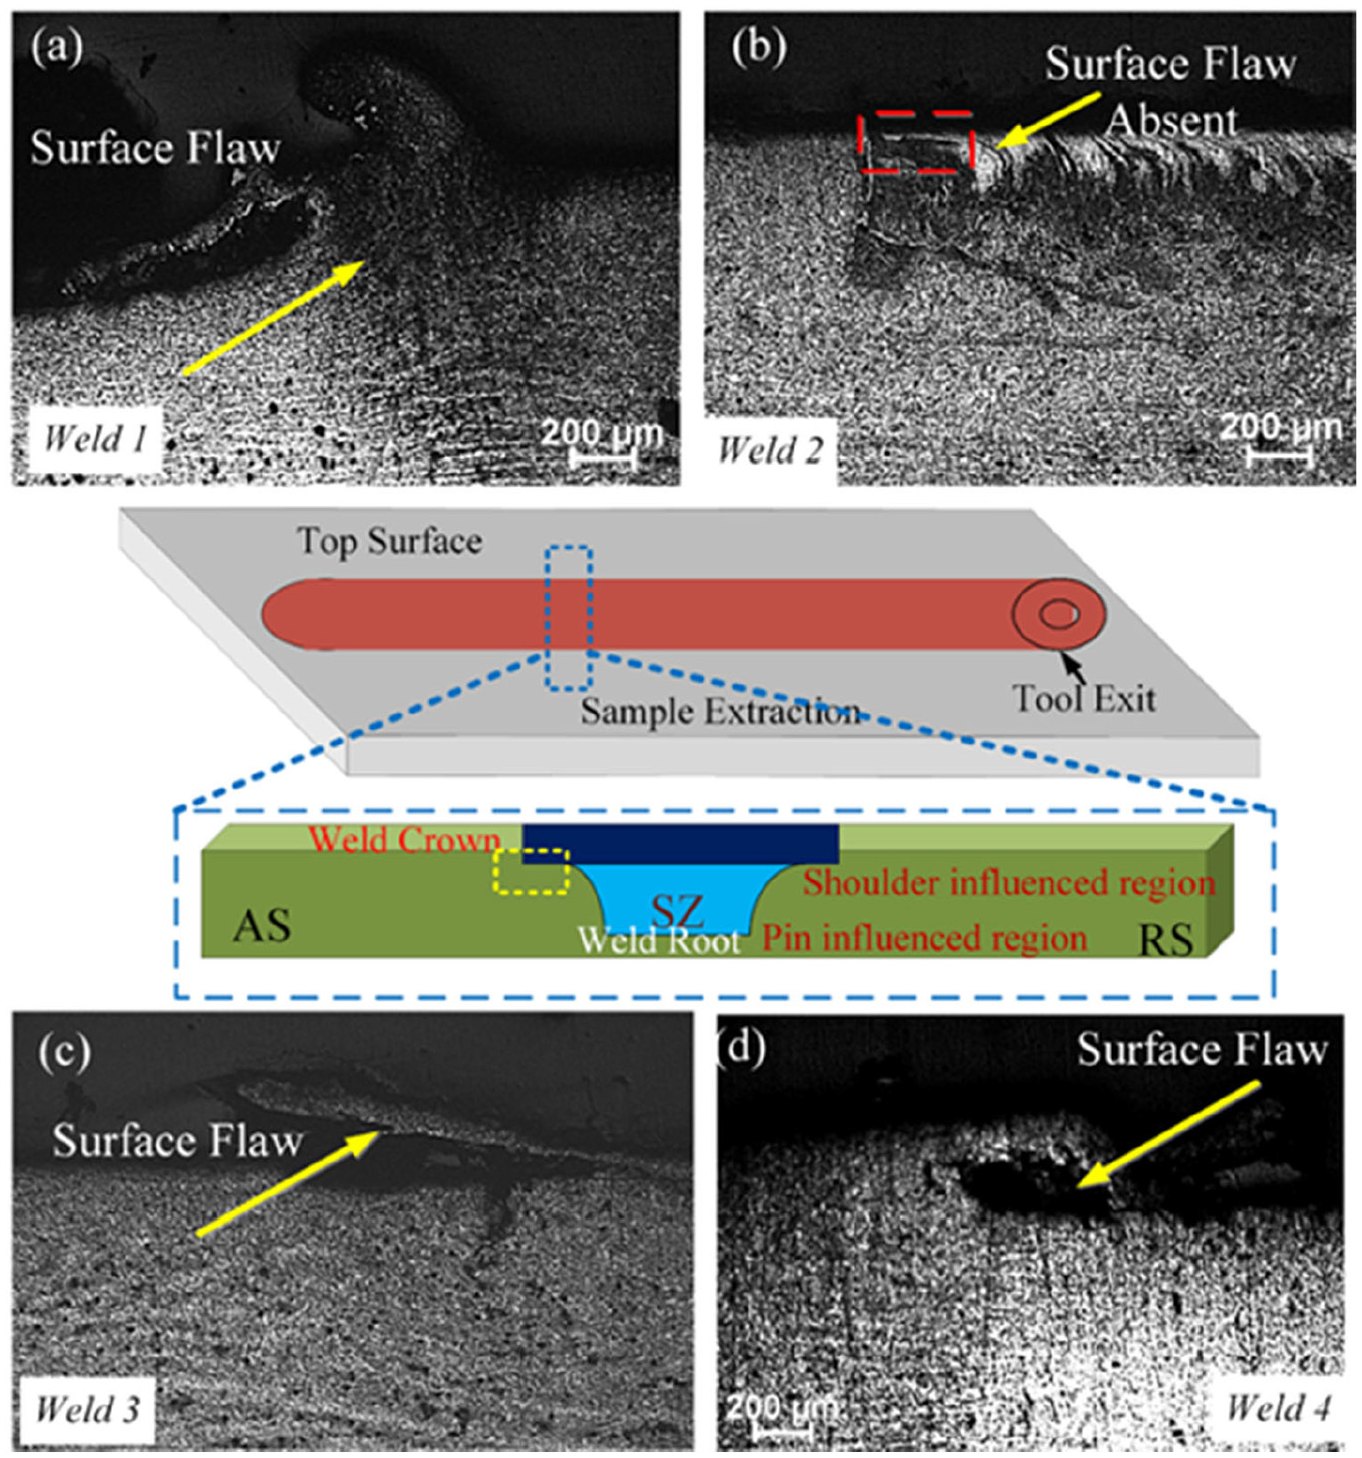
Micrograph appearance of weld joints at top surface: (a) weld 1, (b) weld 2, (c) weld 3, and (d) weld 4.
Surface flaw (flash generation) is observed on the top surface that is, (shoulder influenced region) in weld 1, which is absent in weld 2 as indicated in Figure 4(a) and (b). Surface flaws are highly detrimental for joint integrity, especially in case of impact and fatigue loading.1,7,13 PFSW resulted in high degree of plasticization and better surface quality as compared to FSW. Moreover, material splashing is observed on further increasing plasma preheating, as depicted in Figure 4(c) and (d).
Weld thermal history and the weld microstructures
Figure 5(a) represents the temperature profiles at 13A, 15A, and 17A by the application plasma preheating on the workpiece material. At 13 A preheating current, the peak temperature is 280°C, which is increased by 18.18% and 39.28% for 15 A and 17 A respectively. From Figure 5(b), it is observed that the peak values of thermocouples TC1 (i.e. AS) for weld 1 is 697.4°C. It is observed that the peak temperature increased by 1.14%, 5.65%, 5.81% for weld 2, weld 3, and weld 4, respectively. The heating stage of PFSW is comparatively faster due to the addition of plasma heat energy to the FSW heat energy. The degree of preheating is dependent on the intensity of the preheating current. The thermal history of PFSW exhibits two peaks, that is, the first peak from the plasma source and the second peak is the heat generated by the FSW tool as depicted in Figure 5(b). The maximum temperature reached at the measured location results from the combined effect from both the heat sources, that is, the plasma preheat source and the FSW tool. Yaduwanshi et al. 24 reported single peaks in PFSW and observed high process temperature than the conventional FSW of aluminum alloys. In the study of hybrid FSW of aluminum alloys, Amini and Amiri 32 also reported higher process temperature in the UFSW than conventional FSW.
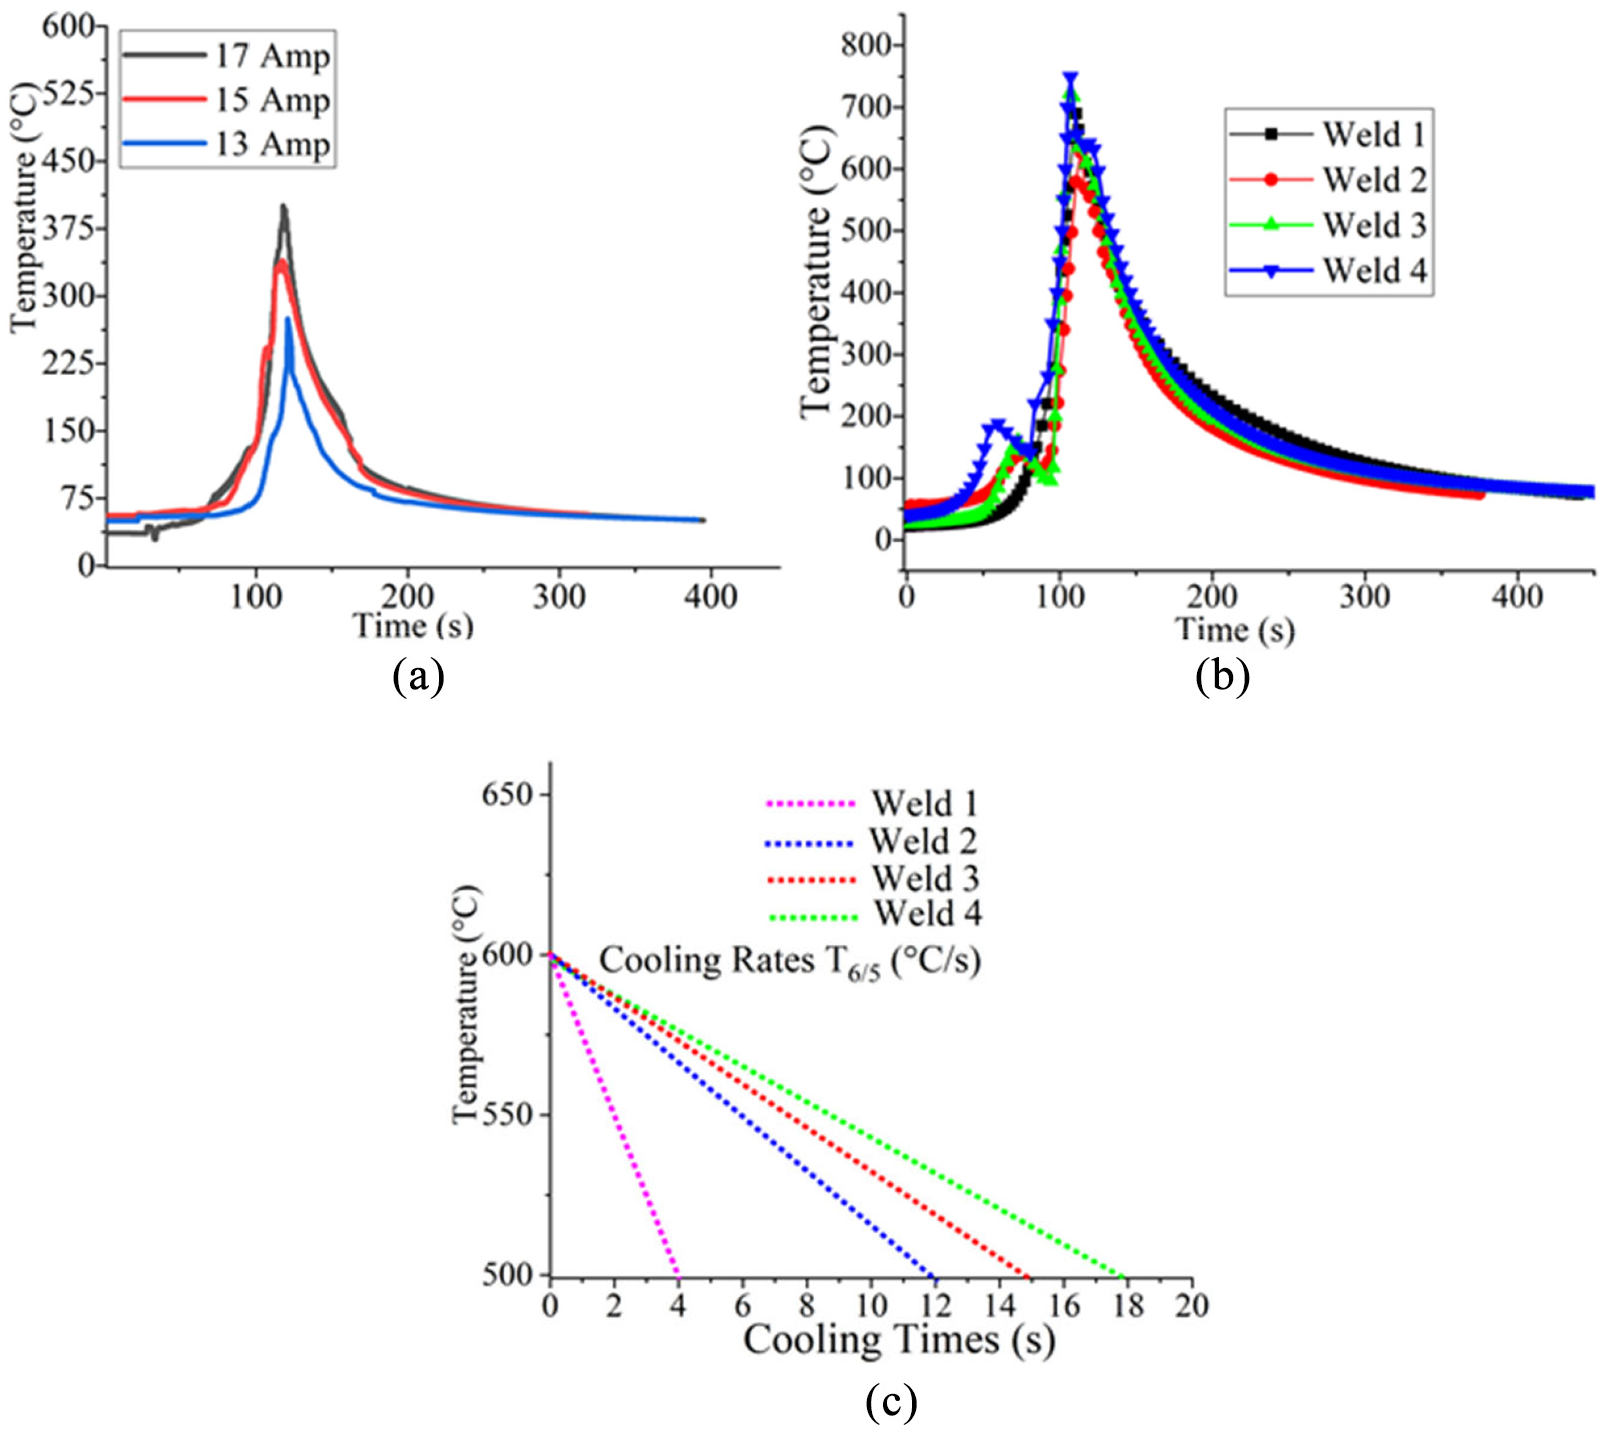
Thermal analysis: (a) effect of plasma preheating current, that is, 13 A, 15 A, and 17 A at a location of 5 mm from the weld line, (b) peak temperatures, and (c) weld cooling rate
The peak temperatures, cooling rates, and heating rate data determined the microstructural evolution during the FSW of steel. During FSW, heat input
7
per unit weld length
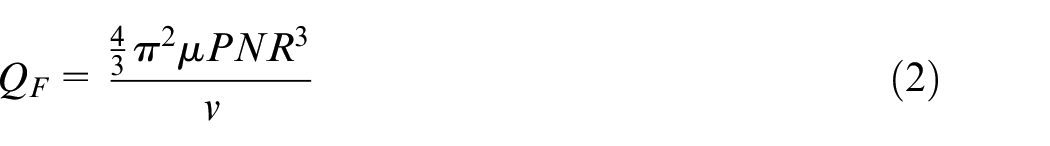
where
where v,
where
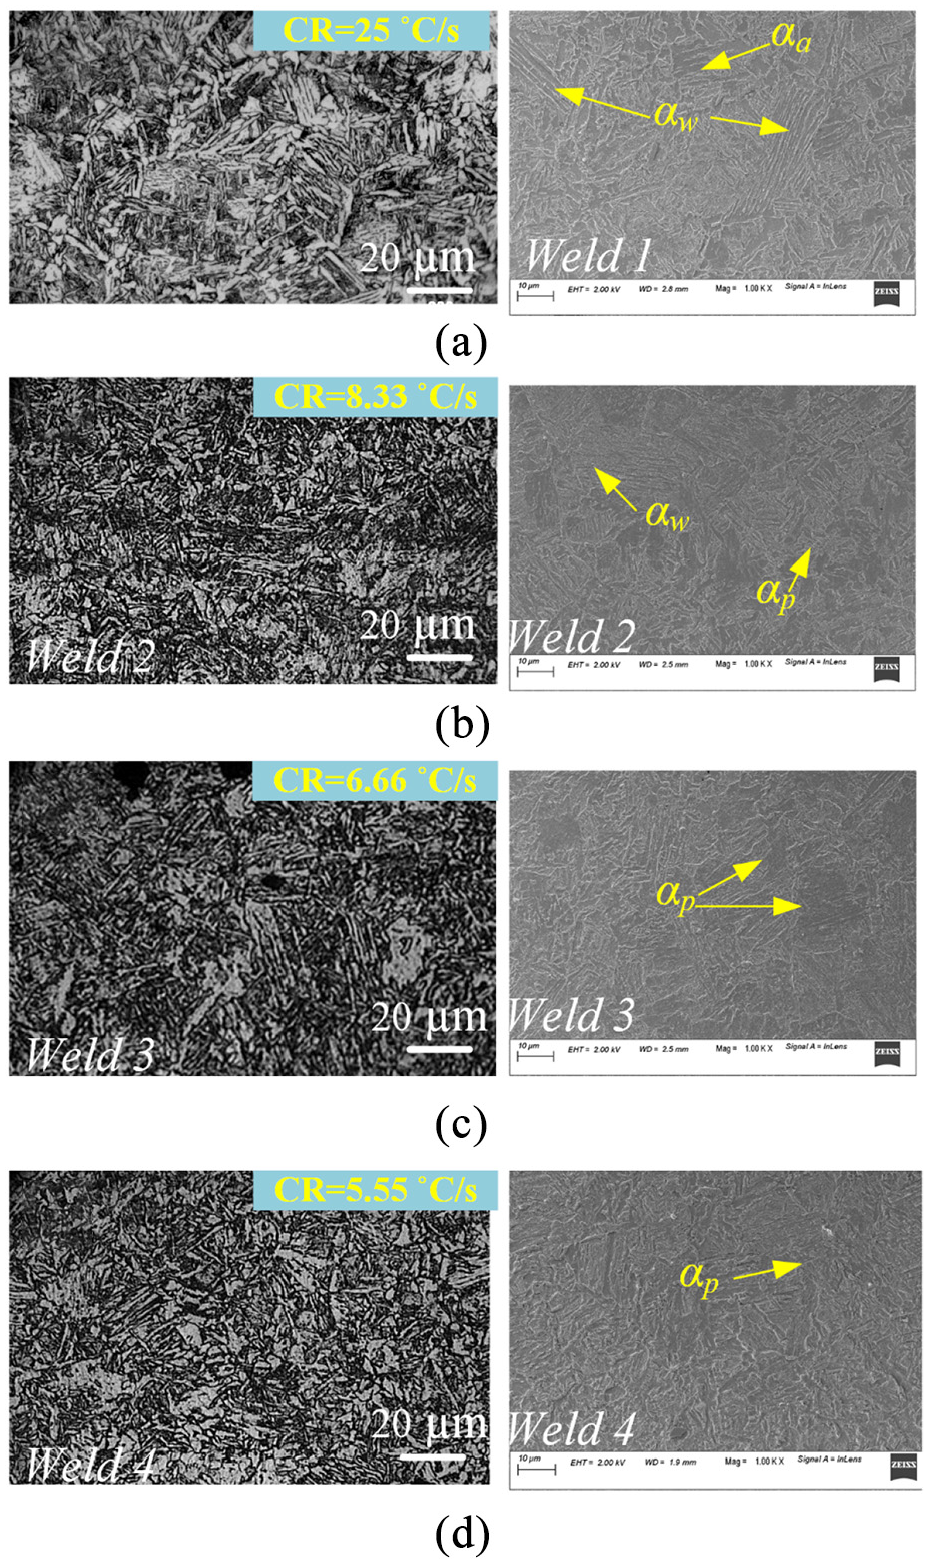
Microstructural comparison in the middle of the stir zone under PFSW and conventional FSW: (a) weld 1, (b) weld 2, (c) weld 3, and (d) weld 4.
Figure 6 shows the comparison of the stir zone micrograph at different heat input and cooling rate conditions. The faster cooling rate (~25°C/s) of weld 1 results in acicular ferrite (
Figure 7 illustrates the two existing zones within the heat-affected zone, one is intercritical heat affected zone (ICHAZ), and the other is subcritical heat affected zone (SCHAZ) (
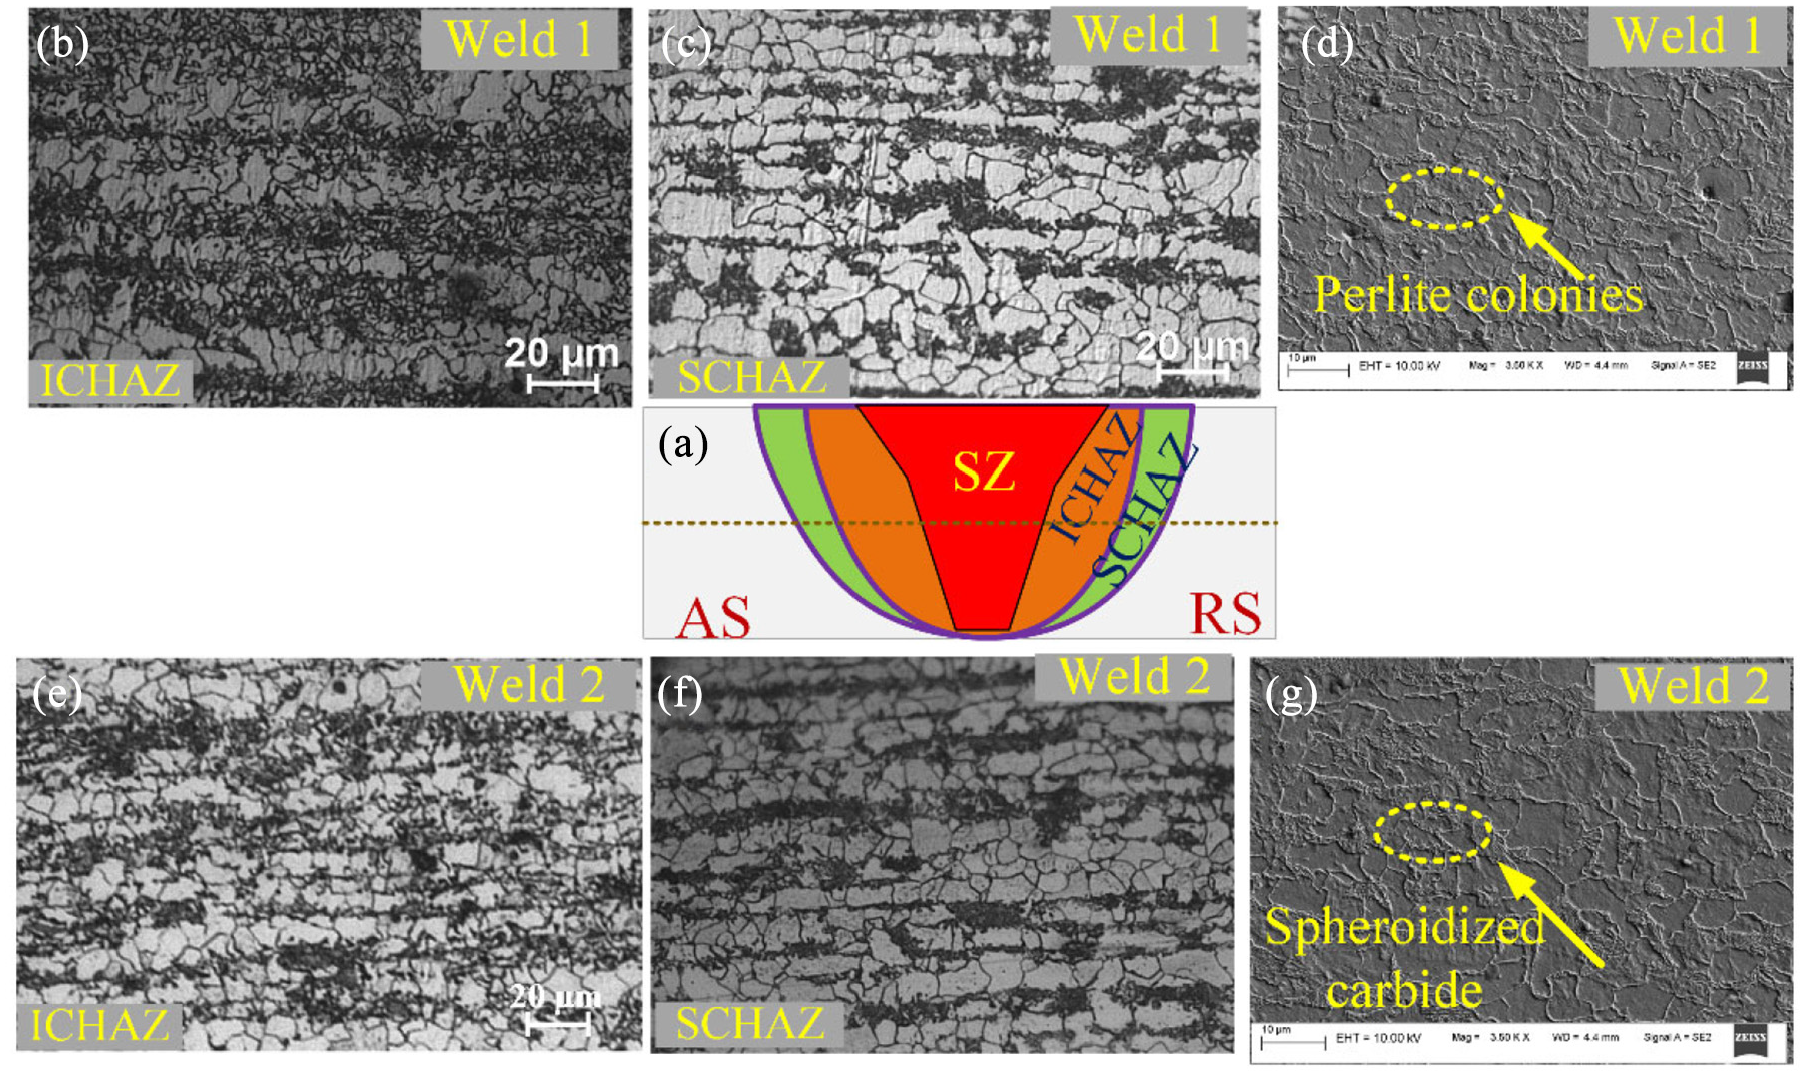
Comparison of optical and FESEM micrograph of FSW (i.e. weld 1) and PAFSW (i.e. weld 2): (a) schematic diagram for the heat-affected zone, (b) optical micrograph of intercritical HAZ indicating pearlite dissolution in HAZ region, (c) subcritical HAZ of weld 1 (
Figure 8 shows the FESEM micrographs and the elemental distribution of the inclusions in the SZ of weld joints. Due to the high temperature and high strain rates in stir zones,11,12,49 the presence of tool debris is more likely to occur in this zone. EDS point spectrum analysis suggests that it constitutes 4.5 wt.% W and 0.9 wt.% W in weld 1 and weld 2 as shown in Figure 8(a) and (b). EDS mapping in the SZ of weld 1 indicated traces of tungsten (W) particles as depicted in Figure 8(c)–(e). Results of earlier publications,45,49 reported W particles due to tool wear in the weld microstructure. EDS point spectrum indicates that the SZ of weld 3 and weld 4 consist of significantly low that is, 0.5 wt.% W and 0.1 wt.% W respectively. This can be correlated with preheat; the tool exerts a weaker shear force on DH36 due to the heat-assisted softening of materials.
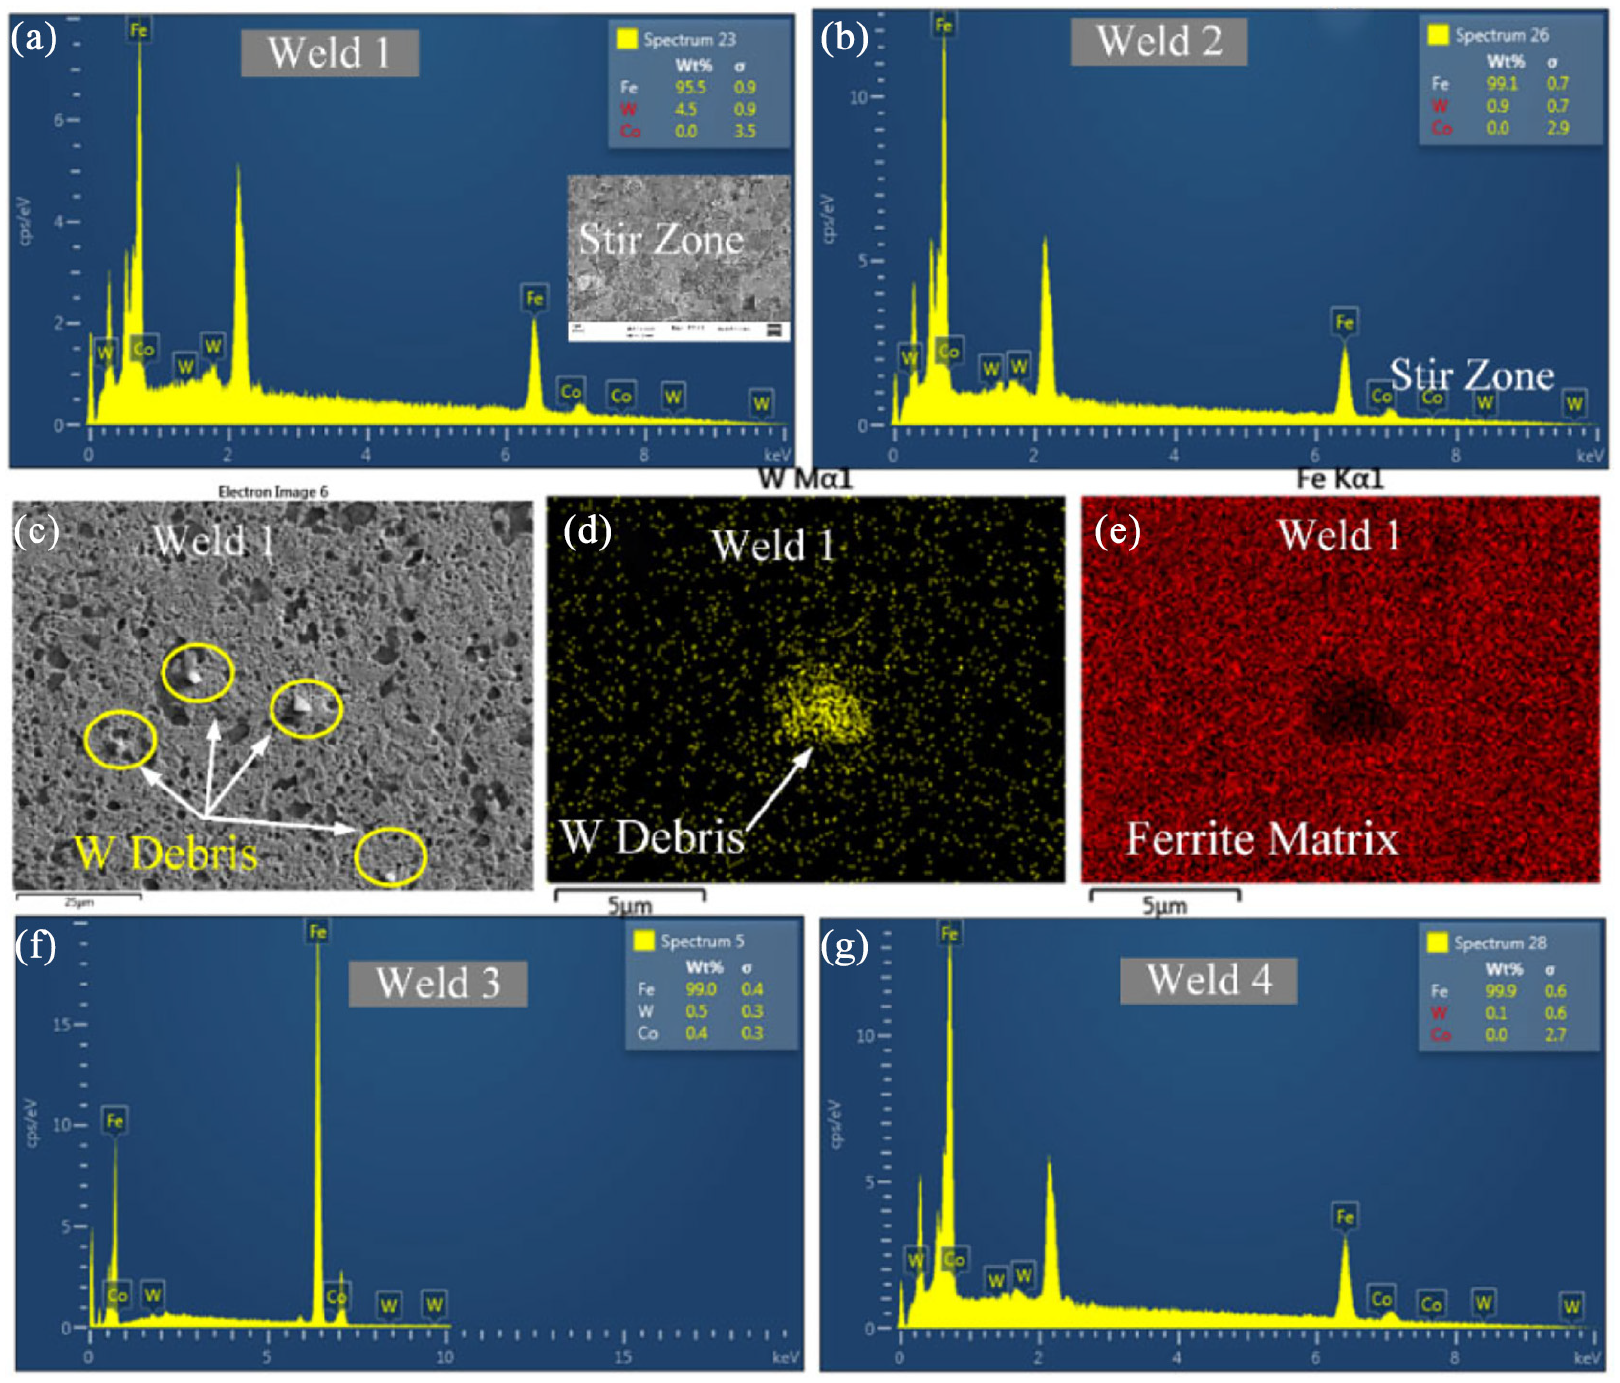
Energy dispersive spectrum analysis showing the tungsten (W) percentage in the SZ: (a) weld 1, (b) weld 2, (c–e) elemental mapping indicating tool debris in the SZ, (f) spectrum for weld 3, and (g) spectrum for weld 4.
Microhardness distribution
Figure 9 demonstrates the microhardness contours and weld macrostructure. The welding condition controlled the weld bead shape and weld zone size. Moreover, the PFSW resulted in the expansion of WZ.
The weld zone is wider than the tool shoulder’s diameter at the top surface. Moreover, the weld zone is expanded by 4.9%, 7.5%, and 7.6% for weld 2, weld 3, and weld 4, respectively. Furthermore, the microhardness contour is plotted from hardness data measured along the transverse cross-section for welded samples at three different layers. The upper layer, the middle layer, and the bottom layers are 0.75, 2, and 3.25 mm away from the joint’s top surface. SZ exhibits the highest hardness values, followed by the inner heat affected zone and subcritical heat-affected zone. Hardness is varied from (about 145 HV0.5) of base material to the stir zone 265.5 HV0.5 in the weld 1. The SZ hardness values for weld 2, weld 3, and weld 4 are 221.5, 220.6, and 219 HV0.5, respectively in agreement with the microstructures observed in these regions. Heat-affected softening is not observed in all-welded samples in line with the weld zone’s evolved microstructure. On increasing the heat input, the microhardness values are decreased due to the evolution of coarse-grained ferrite carbide aggregate. The above results are supported by the literature of Sun et al. 17 and Choi et al. 39 during FSW of steel alloys.
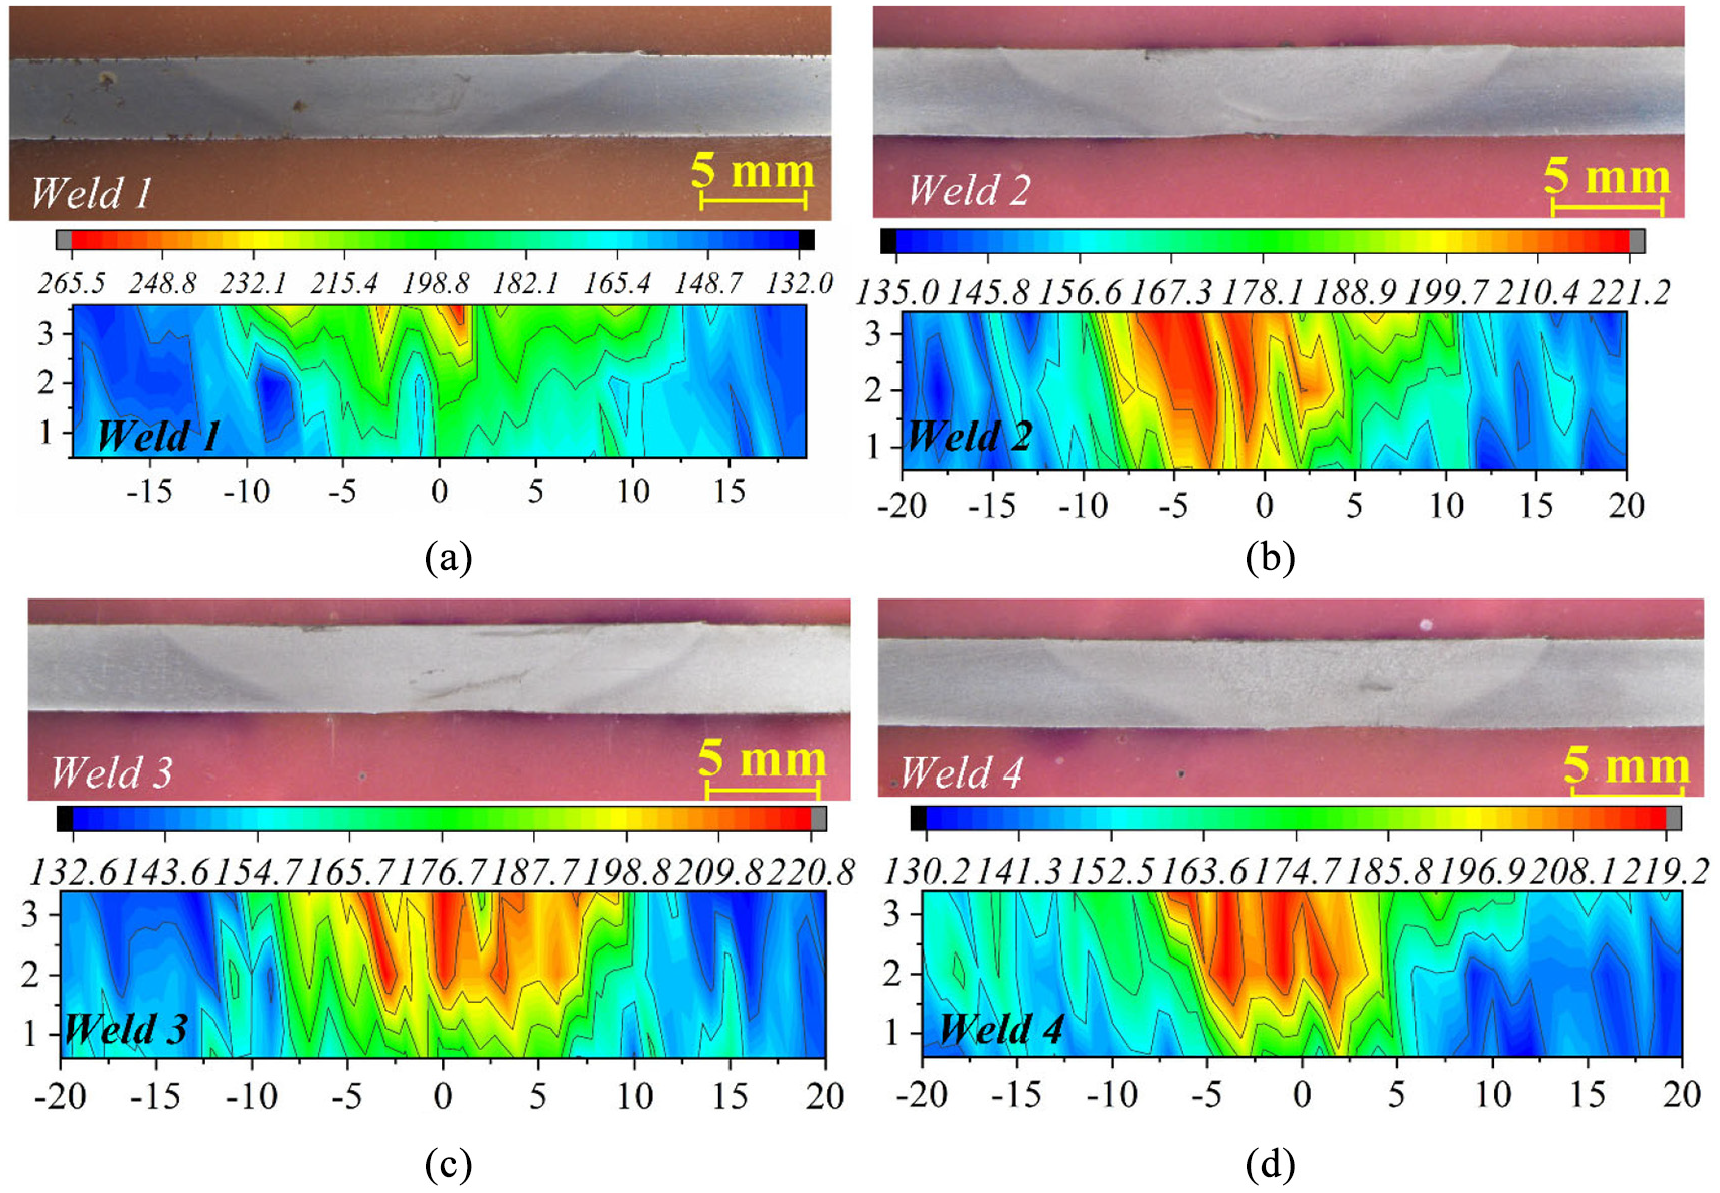
Comparison of microstructure and Vickers microhardness maps: (a) weld 1, (b) weld 2, (c) weld 3, and (d) weld 4.
Tensile properties
Figure 10(a) demonstrates that both the YS and UTS of the welded joints are superior to the base metal. Maximum and minimum tensile strengths are 104.9% and 102.3% of base material for weld 1 and weld 4 respectively. The higher strength of the FSW joint can be attributed to the substantial grain refinement (Hall-Petch effect), high dislocation density (i.e. strain hardening effect), and phases evolution in the SZ. 37 The base elements like Nb, Ti, V, etc., have limited solubility for ferrite and austenite phases, and dispersed precipitate contribute to high strength due to precipitation hardening. 50 The fracture of tensile specimens corresponds to the transition of the ferrite carbide aggregate region of subcritical HAZ and the base material, as shown in Figure 10(b). Figure 10(c) shows that the elongation of the welded samples is increasing with an increase in the intensity of plasma current. Elongation is increased from ~10% of weld 1 to ~13.8% of weld 4. Figure 10(d) shows clusters of dimples of different morphology at the fractured surfaces, which indicates that welded samples underwent sufficient plastic deformation before fracture. In dimple failures mode, it is believed that overload remains the principal cause of the fracture and the failure is governed by the coalescence of microvoids.
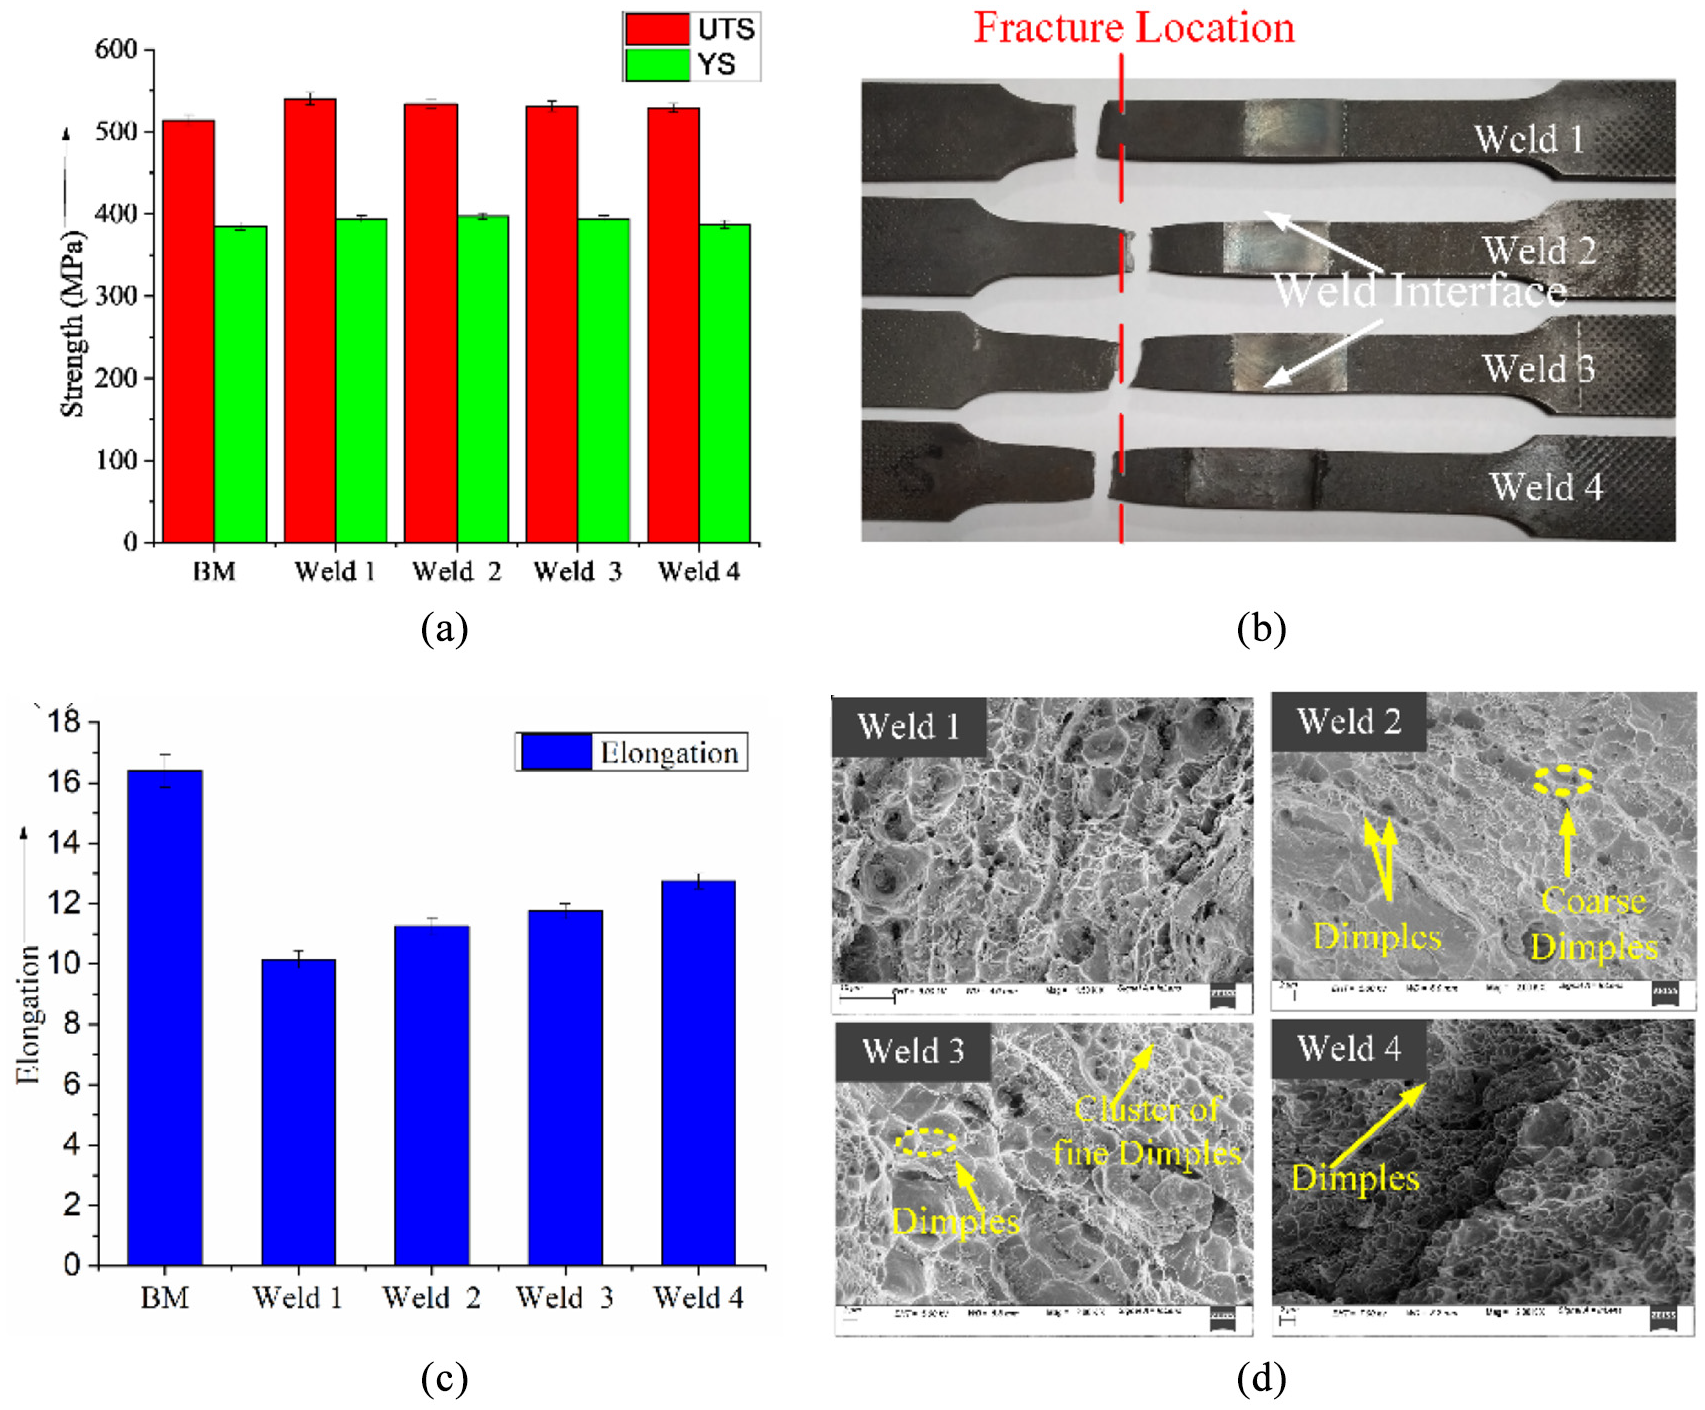
Tensile test results: (a) YS and UTS, (b) fracture location, (c) percentage elongation up to fracture point, and (d) FESEM images of fracture surfaces.
Figure 11 indicates the result of the impact toughness test performed at room temperature. Impact toughness is maximum for weld 4, as depicted in Figure 11(a). The impact toughness of the welded joints is increased by ~28.9% to ~49.5% from weld 1 to weld 4. This is consistent with the evolved microstructure, as described in section 3.2. Cao et al. 51 and Dongsheng et al. 52 also reported similar trends of increasing impact strength with the evolved microstructure. Figure 11(c) shows the comparison of fracture surface morphology of the impact test specimens. Dimples along with quasi cleavage mode of fracture is observed in the fractured impact specimens. Elongated and shallowed dimples are seen on the fractured specimen of weld 4. The cleavage facets appearance on the fractured surface is decreasing slightly from weld 1 to weld 4.
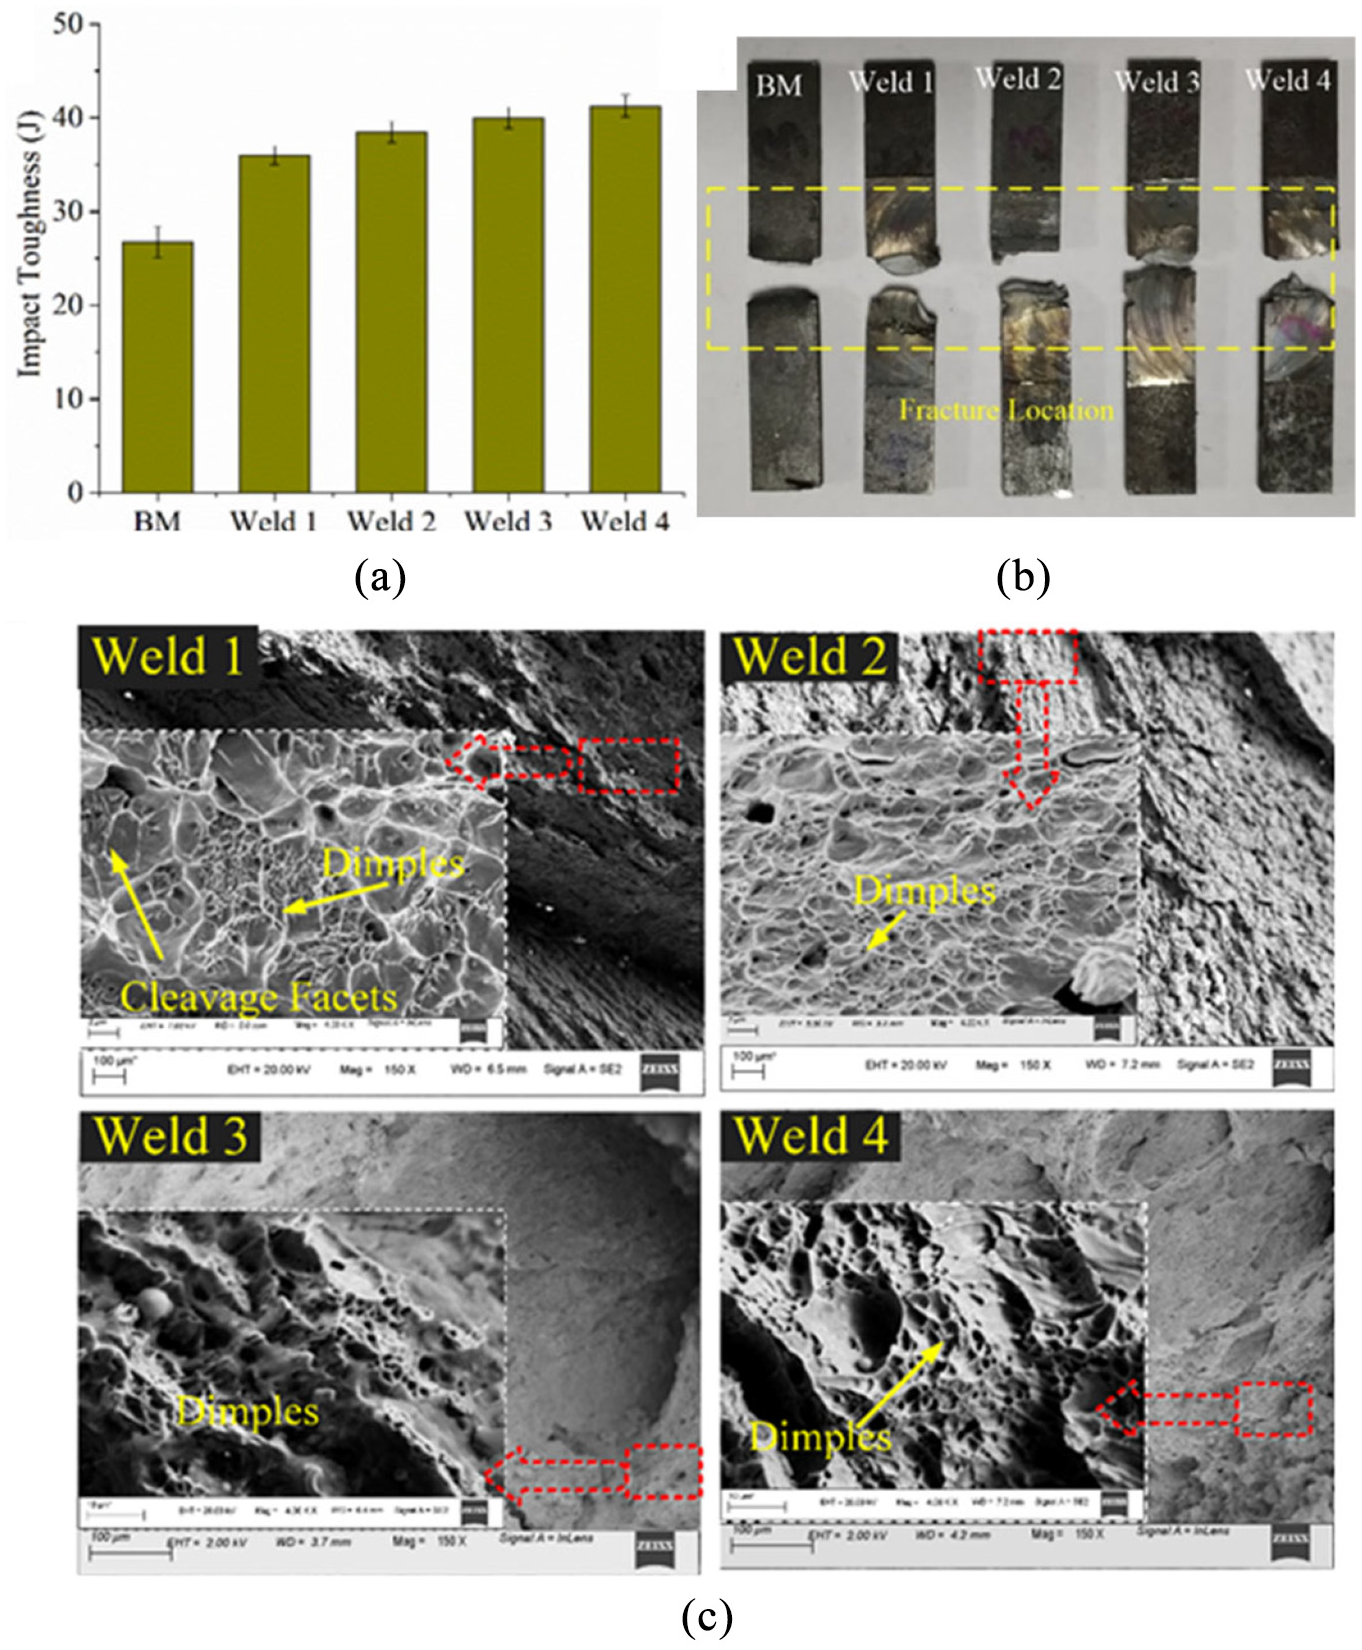
Impact test results: (a) comparison on impact toughness of welded specimen with the base material, (b) fracture location of impact specimens, and (c) fracture surface of impact specimens.
Tool performance evaluation
Figure 12 shows the quantitative and qualitative comparison of the W-Co tools during conventional FSW and PFSW. From Figure 12(a), it can be seen that tool wear is reduced by 58.6% in tool 2 as compared to tool 1. No significant reduction in weight loss is observed on further increasing the preheating current values as 15 A and 17 A. It is reported in the earlier studies that tool wear is significantly high during the plunge stage and can be considerably reduced by preheating the workpiece material.3,42,45 In conventional FSW, the tool is exposed to high stresses at elevated temperatures,
49
resulting in either premature tool failure,
53
severe tool wear and degradation,
49
and relatively low welding speed.
24
Figure 12(b) shows tool profiles measured for pin height and pin diameter using a profile projector. Although little variations are observed at the tool pin height, that is,, it is reduced by 2.7% more in tool 1 than tool 2. Unlike in PFSW, tool wear is considerably high in conventional FSW because tool pin contacts with a work plate at ambient temperature. Moreover, the tool pin bottom shows more wear than the tool pin root, since the effect of frictional heat by tool shoulder is comparatively less at the bottom region. This cooler part (i.e. bottom region) of the workpiece leads to substantial tool pin wear during the welding. It is found that the tool shoulder did not show any significant changes. The overall surface profile remains relatively flat, which indicates no plastic deformation is observed at the contact edge. Average surface roughness
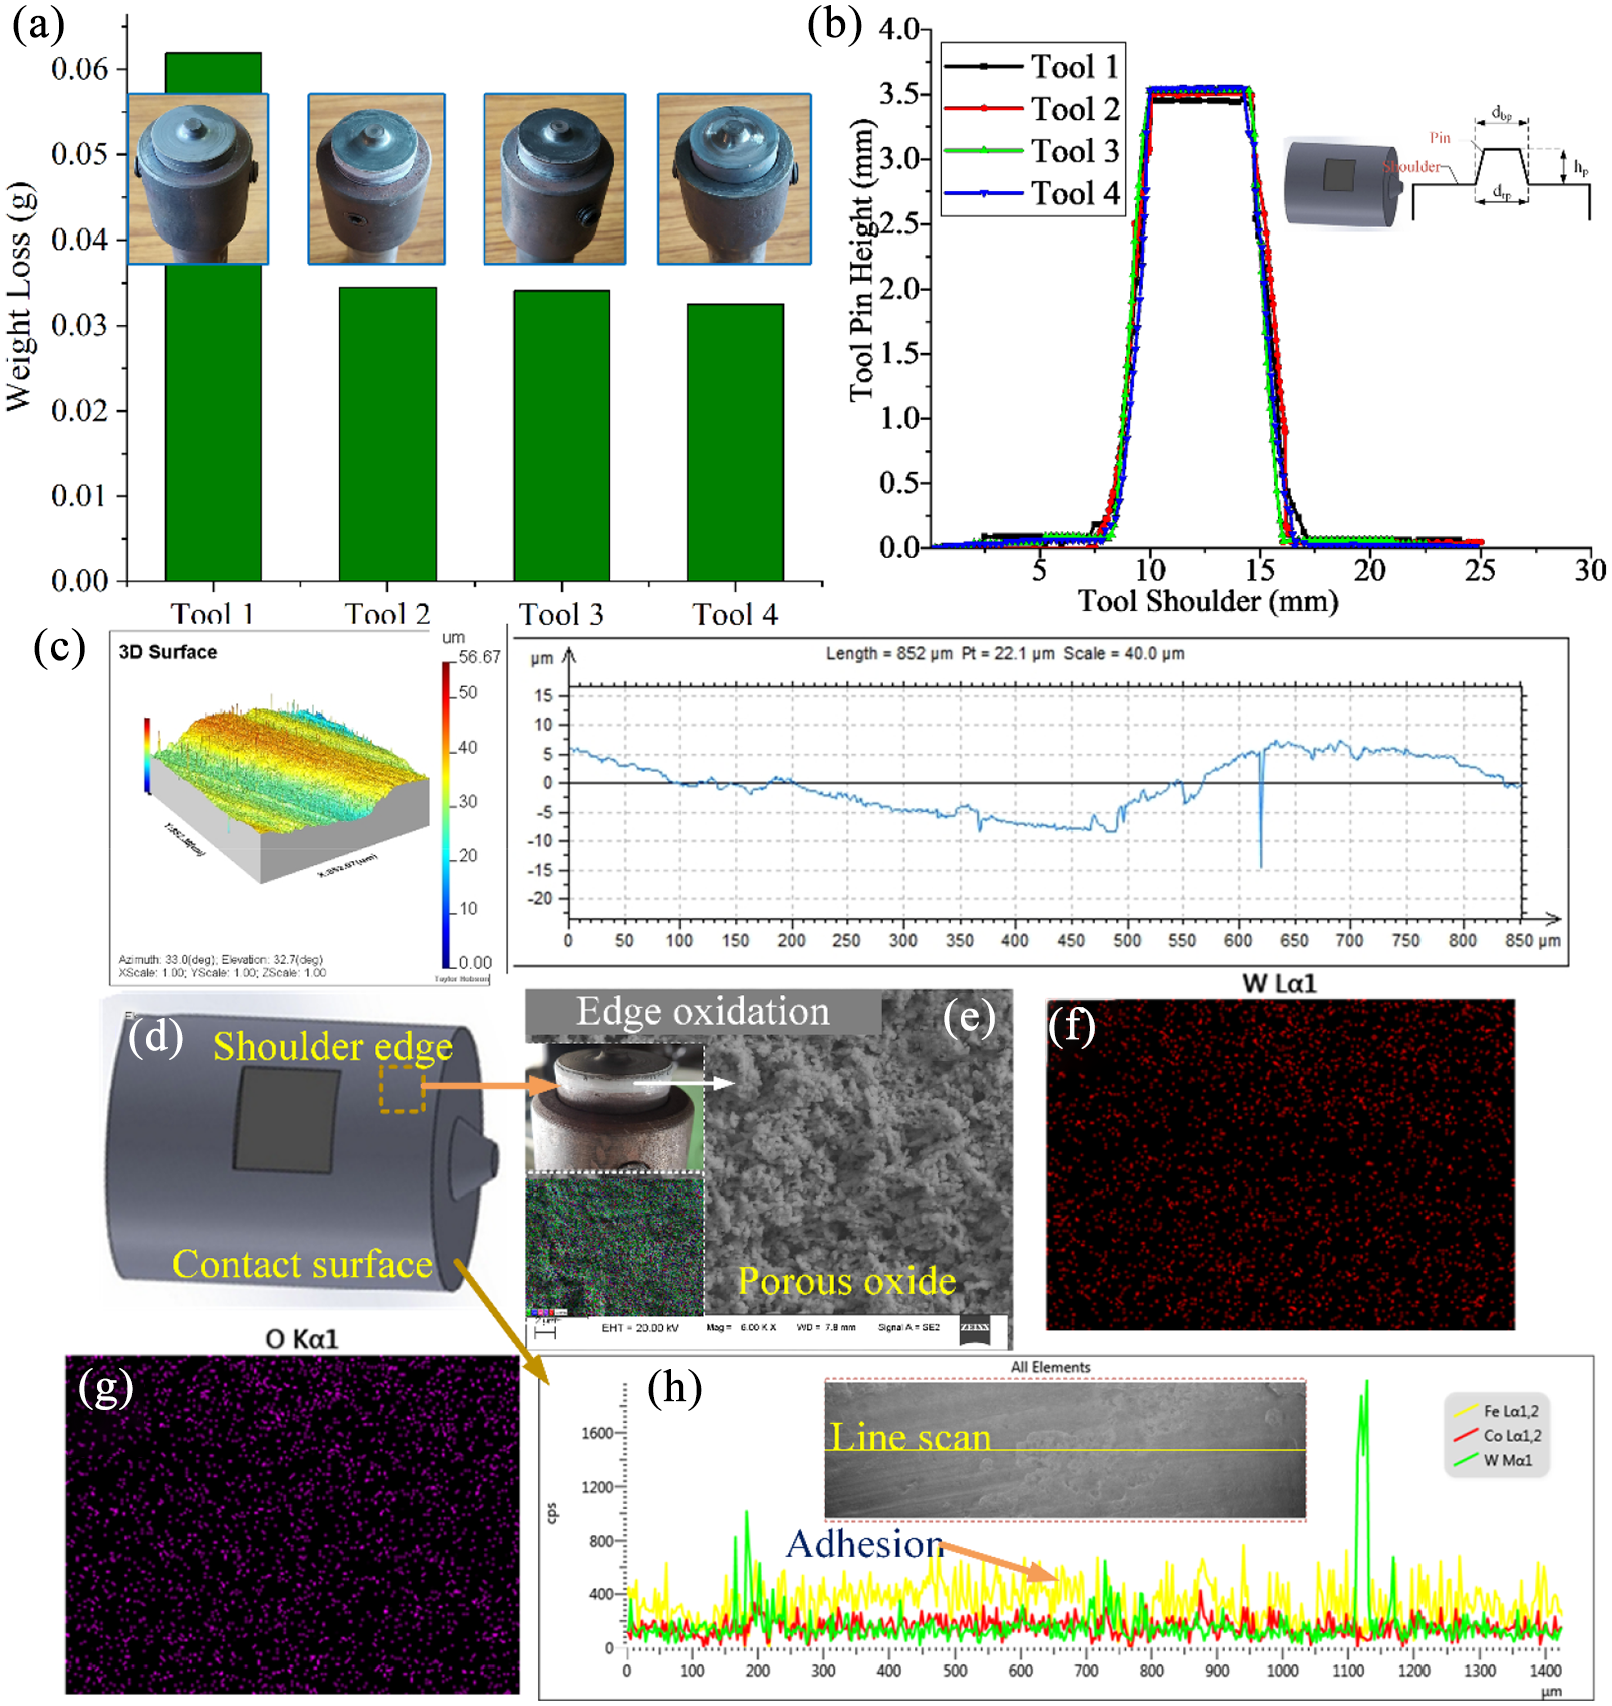
Macro characterization of tool: (a) comparison of weight loss, (b) FSW tool profiles, (c) 3D surface and surface roughness
Figure 12(d) shows the primary area of concern i.e shoulder edge and shoulder contact surface, regarding tool wear and degradation. The oxidation layer is visible at the shoulder edge as shown in Figure 12(e)–(g). Frequently heating and cooling the tool may influence the material’s oxidation behavior and fracture toughness. Tungsten tool material is susceptible to cracking induces due to differences of thermal cycles (i.e. heating and cooling rates) of tool pin and shoulder. 53 Besides, loss in ductile cobalt binder and abraded tool particles at the contact interface also triggers the abrasive wear mechanism at elevated temperatures. This abrasion wear agrees with the microstructural studies of the tungsten carbide tool by Tiwari et al. 53 From previous literature,49,53 it is also confirmed that the high process temperatures are more detrimental to the tool life rather than high stresses. The cobalt extrusion followed by carbide removal or carbide fracture may be the dominant wear mechanism at the tool contact surface. The EDS line scan, shown in Figure 12(h), indicates a more in-depth on W tools’ adhesion behavior where Fe element from workpiece sticks on the parent W and Co elements.
Conclusion
The FSW and PFSW of DH36 steel were performed using WC-10wt.% Co tool. PFSW had a significant effect on weld quality and tool life. From the study, following conclusions are drawn
The welded joints produced by PFSW had shown a good surface appearance as compared to the conventional FSW. Faying defects at the top surface were minimum in the PFSW. PFSW resulted in good quality weld due to thermal softening of the material and the high degree of plasticization.
The flash was generated at high axial force and high preheating currents, as this increased the heat input and resulted in excessive plasticization of material.
The downward force was reduced by 31.6% and 6.25% during the plunge and traverse stage, respectively for weld 2. During PFSW, the temperature was increased by 1.14%, 5.65%, and 5.81% for weld 2, weld 3, and weld 4, respectively.
Weld zone microstructure revealed grain refinement and ferrite phase evolution during FSW and PFSW. The microstructural analysis in PFSW illustrated significant changes in the grains’ structural morphology, controlled by the cooling rate and heat input.
The plasma preheating source’s additional heat input delayed the cooling rate, which affected the phase evolution in the SZ of the PFSW joints. It was observed that a high cooling rate promoted the formation of less tempered morphology in the weld microstructure.
The maximum hardness value in the SZ was reduced by 16% in weld 2 as compared to the weld 1. Further increase in plasma current from that is, weld 3 and weld 4 had shown no significant reduction in the SZ hardness.
The YS and UTS of all-welded joints were higher than the base material. The mechanical properties like strength and hardness were increased due to the grain size strengthening (Hall-Petch effect), moderately acicular/widmanstatten ferrite formation, and slightly attributed to the increased dislocation density (strain hardening effect).
The tensile strength decreased with an increase in plasma preheating, which was consistent with the welded joints’ lower hardness values.
Tool wear was reflected by tool profile, surface characteristics, abrasion, and adhesion wear mechanisms. Plasma preheating reduced the tool force by 31% and tool wear by 58% due to the material softening.
Footnotes
Appendix I
Acknowledgements
The authors are thankful for the IIT Guwahati, Guwahati, India for providing the research facilities.
Declaration of conflicting interests
The author(s) declared no potential conflicts of interest with respect to the research, authorship, and/or publication of this article.
Funding
The author(s) disclosed receipt of the following financial support for the research, authorship, and/or publication of this article: Authors acknowledge the financial support provided by Naval Research Board (NRB), India, sanctioned under