
Abstract
The critical working condition of nuclear power plant equipment necessitates meticulous determination of the welding process and parameters. In this work, some major influential factors of welding were investigated to observe their effects on the through-thickness residual stress distribution in multipass pressure vessel steel welds. In this regard, experiments were conducted to find the characteristics of residual stresses dispersed in SA516 Grade 70 steel welds of different groove geometries with distinct welding conditions. Three-dimensional finite element models of the weldments were developed considering a moving heat source with temperature-dependent material properties to simulate the welding thermal cycles and corresponding residual stress fields. Effects of weld groove geometry, number of weld passes, external constraints, and preheating on the through-thickness residual stress fields were studied. Additional attention was given to the evaluation of the heterogeneous microstructure and microhardness across the weld cross-section associated with their weld thermal history. Finally, the evolution of the through-thickness residual stresses attributed to subsequent weld passes was elaborated.
Keywords
Introduction
The safety aspect of pressure vessels in power generation industries requires a detailed quality inspection to avoid disastrous failure under high pressure and critical operating environment. The deterioration mechanism of powerplant machinery gets expedited with weld-induced residual stresses. 1 The tensile nature of residual stresses at the weld and heat-affected zone (HAZ) can accelerate the propagation of fatigue cracks under service conditions. Determination of residual stresses induced in welded joints of pressure vessels has been prioritized to enhance the durability of the structures. Difficulties arise in measuring the through-thickness residual stress magnitudes in significantly thicker components like reactors, steam pipes in boilers, etc., where the evaluation of residual stresses using non-destructive approaches are not always feasible. Application of destructive and semi-destructive techniques of residual stress measurement leads to repair welding or complete rejection of the component after evaluation. Finite element (FE) modeling of welded joints is trending now to overcome this problem.2–5 The generalization of the factor of safety in pressure vessel design codes to account for the effect of residual stresses may not always be sufficient to maximize the load-bearing efficiency. Modifications in the weld groove geometries and process guidelines can revamp the existing data of residual stress distributions in the standardized pressure vessels and piping designs.
Residual stress fields strongly depend upon a few influential welding conditions, which can alter the distribution of stresses across the welded joints.6–9 Leggatt 10 mentioned influential factors affecting the residual stress profiles, which include material properties, residual stresses present prior to the welding operation due to the fabrication processes, weld geometries, restraint conditions, welding process being applied, and post welding employed thermal or mechanical operations. Mousavi and Miresmaeili 11 investigated the intensity of residual stresses present in different weld groove geometries. It was found that the welded joint of U-groove geometry exhibited a lower magnitude of both longitudinal and transverse residual stresses compared to the V-groove welds. Moreover, in a study of groove angles, the 50° angle of the V-groove exhibited the minimum amount of residual stresses. Sattari-Far and Farahani 12 developed a FE model of the pipe weld and validated it with the results obtained experimentally using the blind hole drilling method. The FE model was further used to investigate the effects of weld groove geometries and the number of weld beads on the residual stresses. It was observed that the axial tensile residual stress increased on the inner surface of thick pipe welds with an increasing number of weld passes. Chen et al. 13 investigated the effect of the weld bead sequence on the welding residual stresses and distortion of stiffened plates. Six welding sequences were analyzed, and significant differences in welding residual stress distributions and distortions were observed. Javadi 14 studied the effects of clamping on the welded joints of a nickel-based alloy and employed both numerical and experimental approaches to study the residual stress distribution. Longitudinal residual stress was observed to be higher with comparatively lower values of shrinkage in the clamped plate compared to the plate welded without clamping. Teng and Lin 15 predicted the residual stress distribution in a single-pass butt-joint steel plate using ANSYS FE software. It was observed that the preheating temperature can effectively decrease the residual stress magnitudes in the weldment. Mitra et al. 16 analyzed the effect of post-weld heat treatment (PWHT) on the residual stress distribution in a narrow gap weld of ASTM A516 Grade 70 steel plates. Egea et al. 17 investigated the application of ball-burnishing process to induce in-depth compressive residual stresses in friction stir welded specimens of 2050 aluminium alloy. The kind of welding process is applied to a particular joint also influences the magnitude and distribution of residual stresses. Colegrove et al. 18 performed six different welding procedures on 4-mm-thick ASTM A131 steel plates to find the effect of welding processes on the resultant residual stress and distortion. The pulsed gas metal arc welding (GMAW) process and hybrid laser process exhibited the best outcomes. Balasubramanian and Guha 19 compared the shielded metal arc welding (SMAW) process and flux-cored arc welding (FCAW) process on the fatigue performance of welded joints. It was found that the fatigue crack growth rate is significantly less in welded joints produced by the SMAW process. Prajapati et al.20,21 investigated the hybridization of weld filler wire in the course of gas metal arc welding of SA516 Grade 70 welds. The application of hybrid fillers exhibited enhanced mechanical properties and significantly reduced the angular distortion.
Most of the past works of the literature illustrating the influential factors affecting the welding residual stresses largely comprise only the surface residual stress evaluation. However, the magnitude and trend of weld-induced residual stresses may vary through the thickness of the specimen in thick multipass weld joints. In the present investigation, thick plates of SA516 Grade 70 steel were welded under different welding conditions to study the effects of weld groove geometry and the number of weld passes on the through-thickness residual stress distribution and angular distortion. Three-dimensional FE models were prepared and compared with the experimental results for better accuracy. One of the validated FE models was then used to study the effects of external constraints and preheating on the trend of residual stresses. Characteristics of inhomogeneous microstructure and microhardness dispersed across the weldments were studied with their corresponding thermal cycle. Lastly, the evolution of through-thickness residual stress fields was explored using the FE model.
Numerical modeling
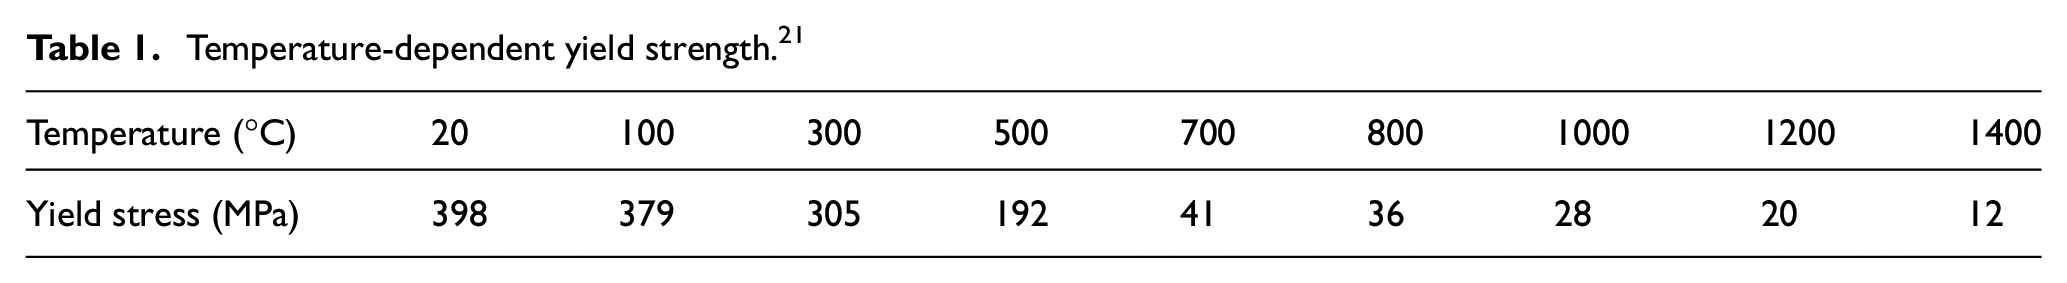
In this present investigation, the thermal elastic-plastic FE analysis was performed using Abaqus code and Fortran User Subroutine linked together to predict the welding thermal cycles and corresponding residual stresses and distortion. In these numerical models, temperature-dependent material properties, along with material hardening model, moving welding heat source, and boundary conditions were defined. The temperature-dependent material properties are represented in Figure 1 and Table 1. 22 The density of the material was kept constant as 7850 kg/m3. 23
Temperature-dependent yield strength. 21
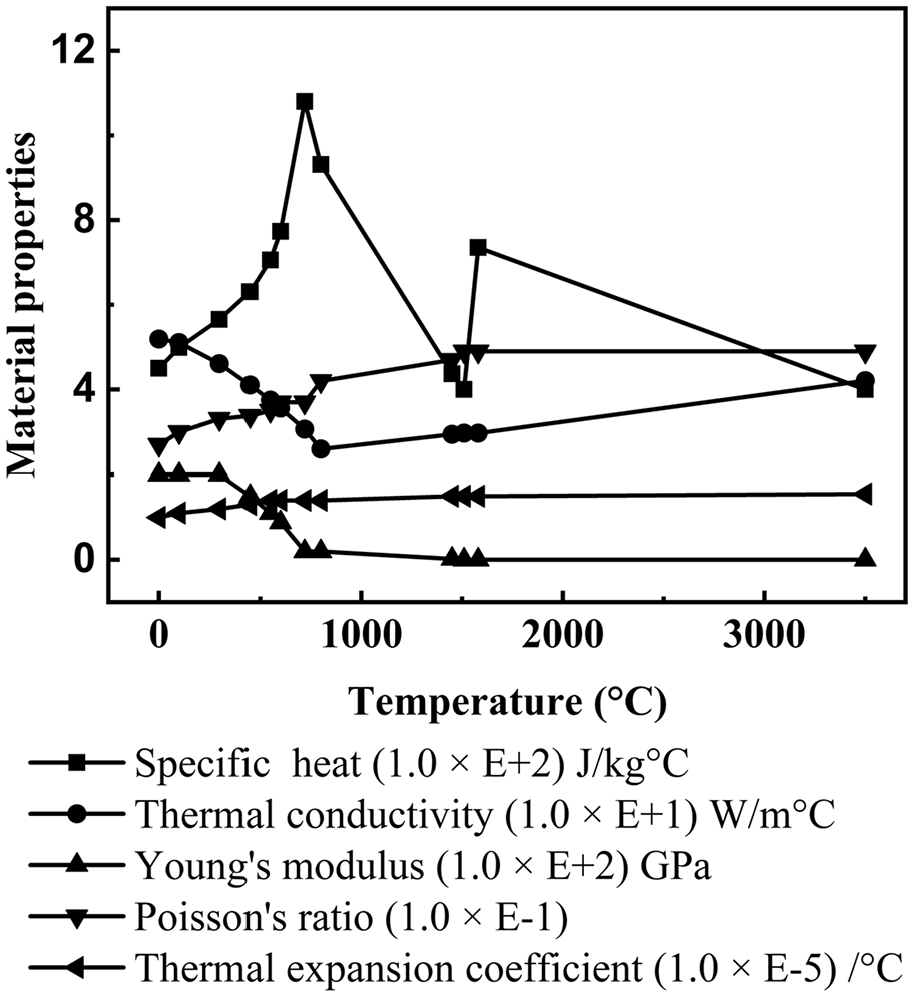
Temperature-dependent material properties. 21
Coupled temperature displacement analysis
Three FE weld models were prepared, and the dimensions were kept same as of the experimental specimens. The sequence of each weld bead and its dimensions was in accordance with the macrograph of the weld cross-section, as shown in Figure 2. Fine meshing order was defined in the weld zone, and a biased meshing scheme was employed for the region away from the fusion boundary to reduce the total computational time and maintain a steep temperature gradient towards the weld centerline. Weld filler material deposition was simulated following the element birth and death technique to activate and deactivate the weld beads according to the respective deposition sequence. During the first weld bead deposition, all other subsequent weld passes were kept deactivated, and only the selective elements of the first pass were activated. After the activation of elements, the moving heat source was traversed from one end to another following the actual weld speed. The continuation of weld metal deposition followed by heating and cooling was divided into three steps. Cooling time after every successful application of heat flux was introduced to maintain the inter-pass temperature around 100°C–180°C.24,25 C3D8T: 8-node thermally coupled brick, trilinear displacement and temperature elements were opted for the present FE modeling. 26 It satisfies the mechanical and thermal equilibrium equations simultaneously. The mechanical and thermal equilibrium conditions are given in equations (1) and (2), respectively. 27
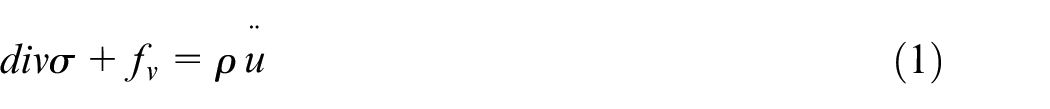

where
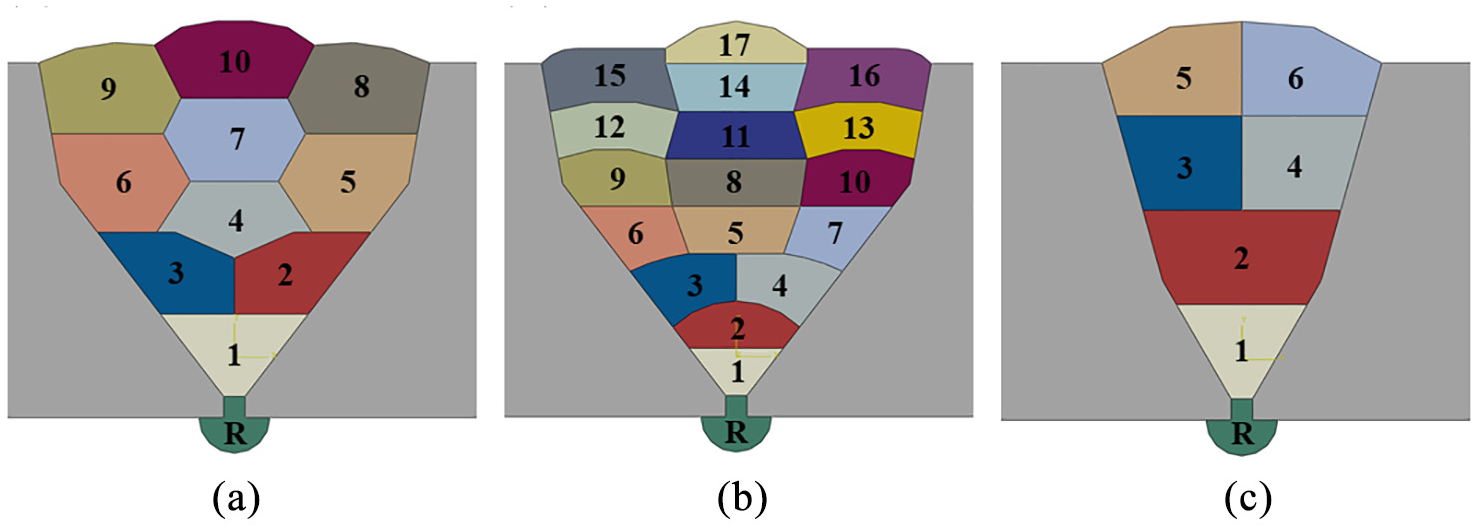
Weld bead sequence: (a) conventional groove (10 passes), (b) conventional groove (17 passes), and (c) narrow groove (6 passes).
The present FE model is composed of complex nonlinear interactions between the temperature-dependent material properties and welding process variables. So, the following assumptions were made during the modeling.
The workpiece was considered to be isotropic and homogenous in nature.
The effect of fluid flow due to melting was neglected.
The materials follow von Mises yield criterion and flow rule.
The welded specimens were considered to be stress-free at the initial stage.
The applied heat energy of the moving heat source was much higher compared to the heat dissipated due to plastic deformation. So, the latter one was neglected in the modeling steps.
Thermal analysis
The following equation gives the balanced relation of heat flow in a volume enclosed by an arbitrary surface:
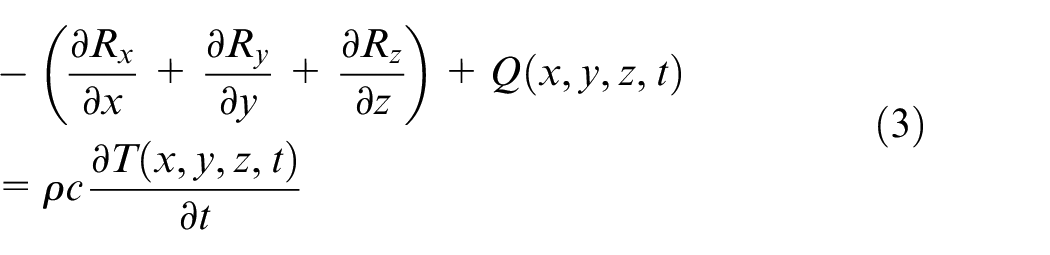
where
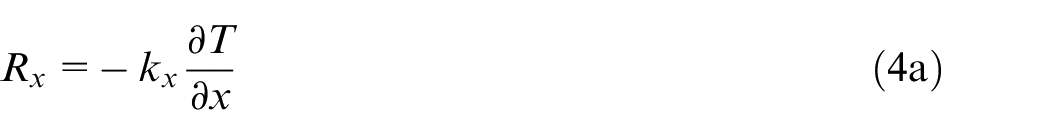
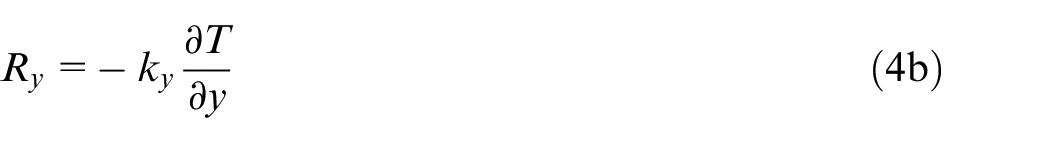
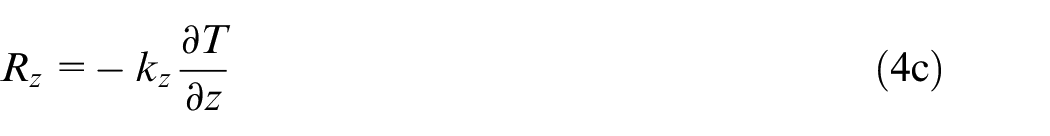
where the thermal conductivities in the
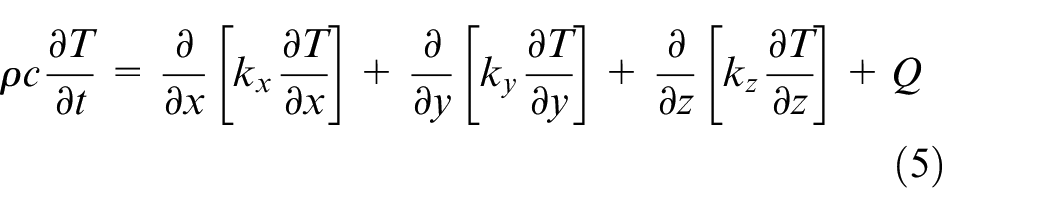
Equation (5) is the governing differential heat transfer equation of the present analysis.
The volumetric heat source of uniform density was employed by applying heat flux (

where
The predefined temperature of the base materials was assumed to be the same as room temperature (21°C), and it got modified computationally with the increasing welding steps simultaneously. Convection and radiation were considered for the heat loss where radiation was employed for the elevated temperature fields limited to the weld zone, and convection was assumed for the base material away from the fusion boundary. Linear Newtonian convective cooling can be expressed as:

where
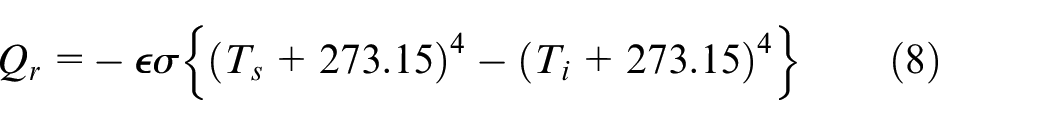
where
Mechanical analysis
In the mechanical analysis, the temperature history acquired from the multiple thermal cycles induces thermal stresses in the model. The rigid body motion of the model was restrained in terms of displacement. The total strain and strain rate can be broken down into three factors: elastic, plastic, and thermal strain. The sum of total strain rate can be expressed as below:
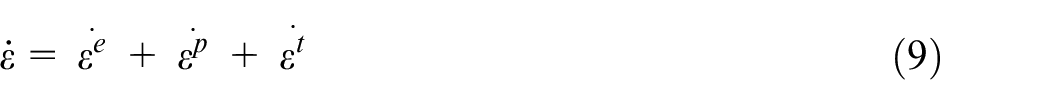
The influence of creep and solid-state phase transformation was ignored due to the short heating time. The elastic strains were evaluated following the isotropic Hook’s law with the temperature-dependent modulus of elasticity and Poisson’s ratio. The plastic strains were calculated considering a rate-independent plastic model that comprises Von Mises yield surface criterion, temperature-dependent mechanical properties, and isotropic hardening model. The thermal strains were calculated based on temperature-dependent thermal expansion coefficients.
Experimental procedures
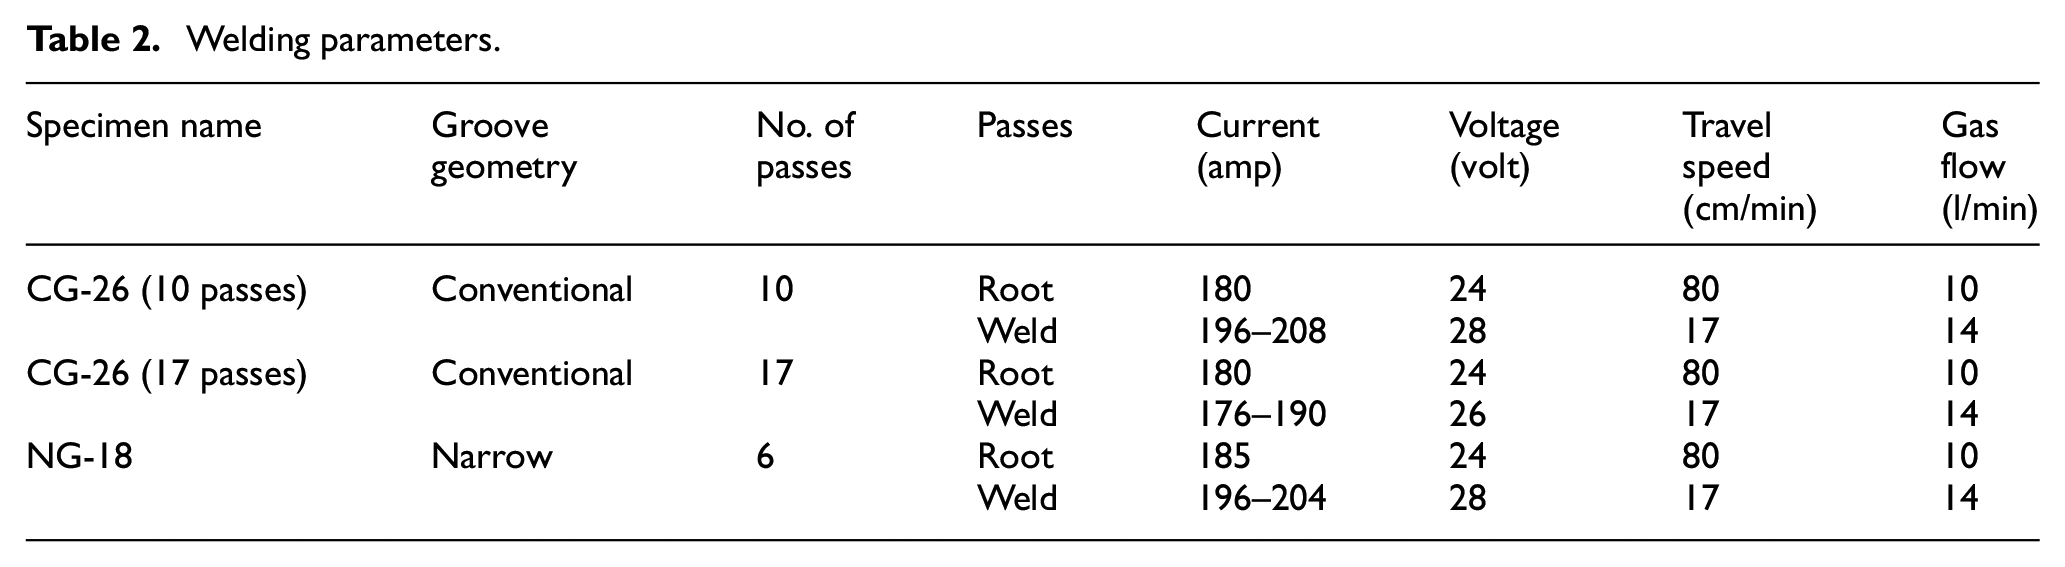
The material used for the present investigation is ASME SA516 Grade 70 steel plates with a length of 300 mm, a width of 110 mm, and a thickness of 25 mm. Both conventional and narrow weld groove configurations are represented in Figure 3. Two welds of conventional groove configuration having different number of weld passes and a single weld of narrow groove geometry were prepared. The GMAW process with direct current electrode positive (DCEP) polarity was employed with a root gap of 1.5 mm using ER70S6 as filler material of 1.2 mm diameter. The welding process was executed as per the instructions provided in the American Society of Mechanical Engineers (ASME) Section IX. Initially, bead-on-plate trials were carried out following the parameters of previous literature. 32 Suitable welding process parameters were obtained from the trial runs and then were applied to the prepared samples. The welding parameters are given in Table 2. The specimens have been named according to their geometry and the total number of weld passes for ease. CG-26 (10 passes), CG-26 (17 passes), and NG-18 denote the conventional groove joint of 10 passes, conventional groove joint of 17 passes, and narrow groove joint, respectively. A digital dial gauge of 0.01 mm least count was used to measure the angular distortion.
Welding parameters.

Groove geometries: (a) conventional groove and (b) narrow groove (all measurements are in mm).
Residual stress measurement using deep hole drilling technique
Evaluation of residual stress through mechanical strain relaxation involves the measurement of strains or displacement as a result of elastic unloading due to precisely controlled material removal.33,34 Residual stress measurement techniques can be classified as non-destructive, semi-destructive, and entirely destructive techniques. All these techniques have their own advantages and limitations. The deep hole drilling (DHD) technique belongs to semi destructive category, and it is utilized to measure through-thickness residual stress fields. After the initial studies were done by Zhdanov and Gonchar 35 and Beaney, 36 efforts have been made by investigators to improve the accuracy of the conventional DHD technique; such as, increased the number of angles of measurement of the reference hole diameter and avoiding plastic yielding of the core hole. 37 DHD technique is notably appropriate for thicker components. Figure 4 shows the steps involved in the DHD technique. In step one, a small reference hole is made at the location of interest. In the present investigation, a reference hole of 5 mm diameter was made. In the second step, the internal diameter of the reference hole is measured through certain depth intervals at specific angles. An air plug gauge was used for the purpose of hole diameter measurement. The diametral measurements were performed at three different angles (0°, 45°, and 90°). In the third step, the core hole is trepanned coaxially up to a certain depth using an electro-discharge machining process. Later on, in the final step, the internal diameter of the reference hole is remeasured at the same previous locations. The change in diameter of the reference hole indicates the deformation caused under the influence of in-plane biaxial residual stresses.
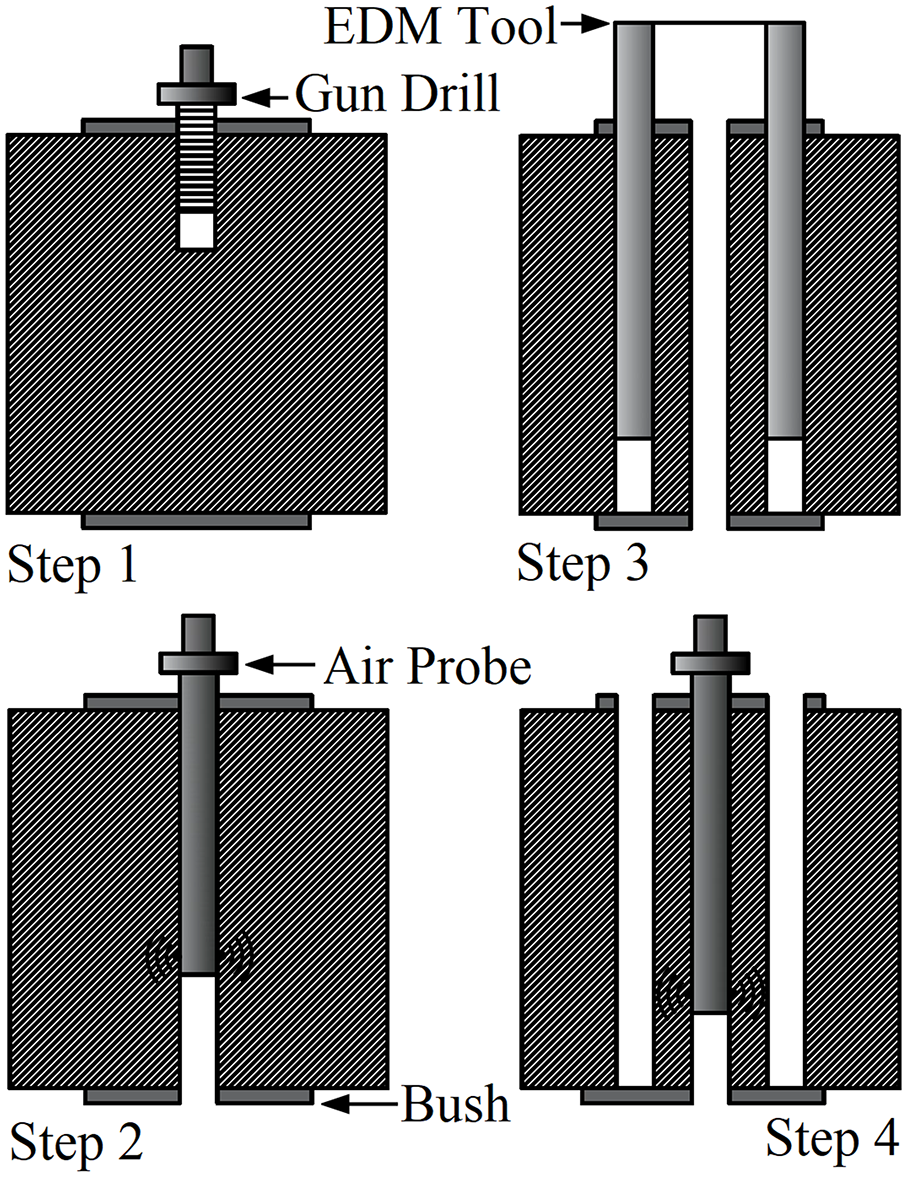
Schematic representation of steps involved in the DHD technique.
Plane stress condition is followed in the calculation of the DHD technique. The measurement of the radial deformation is carried out at N number of angular directions
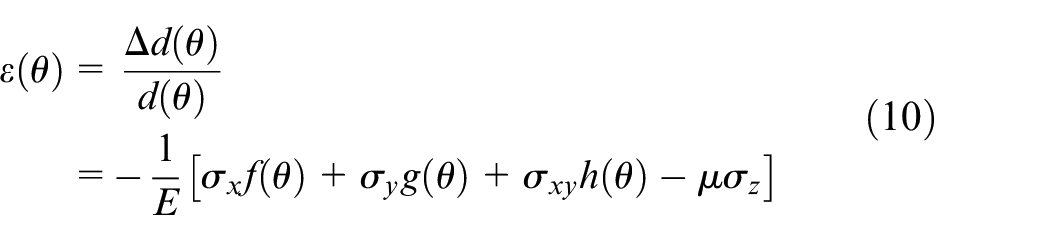
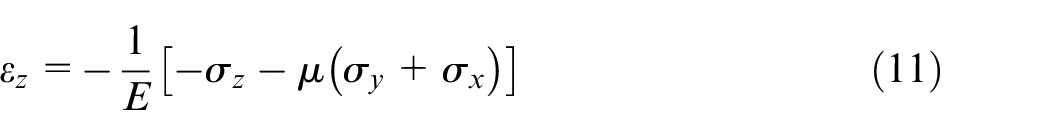
where
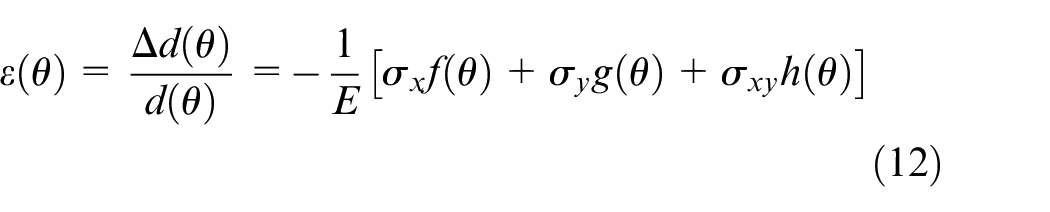
Here, the
where
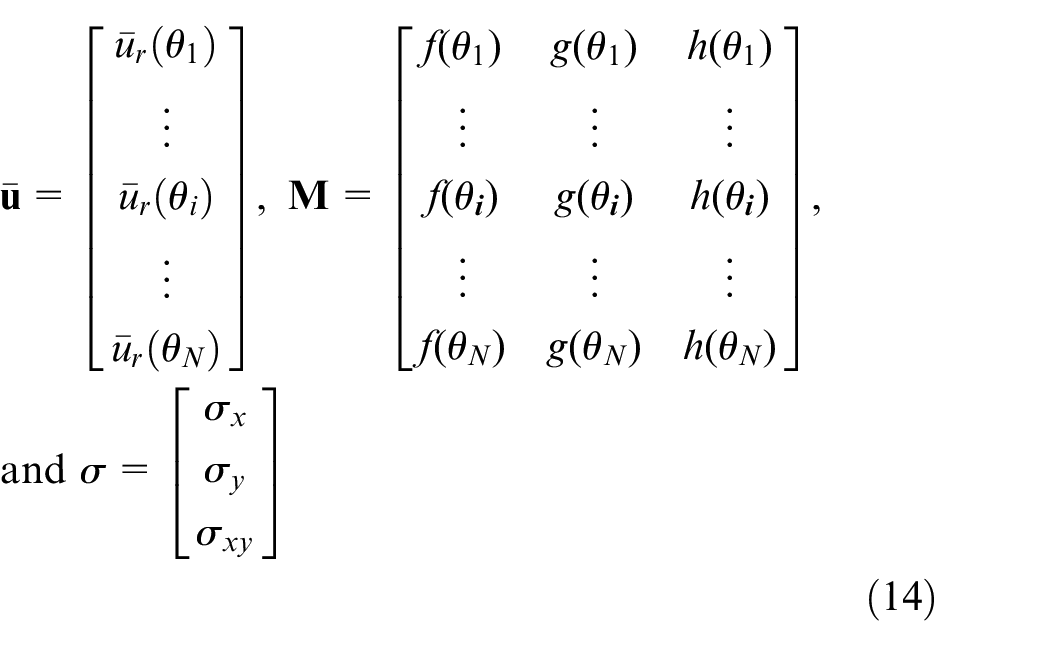
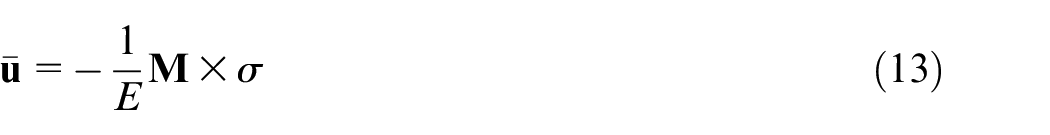
Finally, the unknown magnitude of residual stresses can be found using the below equation:

where,

Here,
Results and discussion
Microstructure
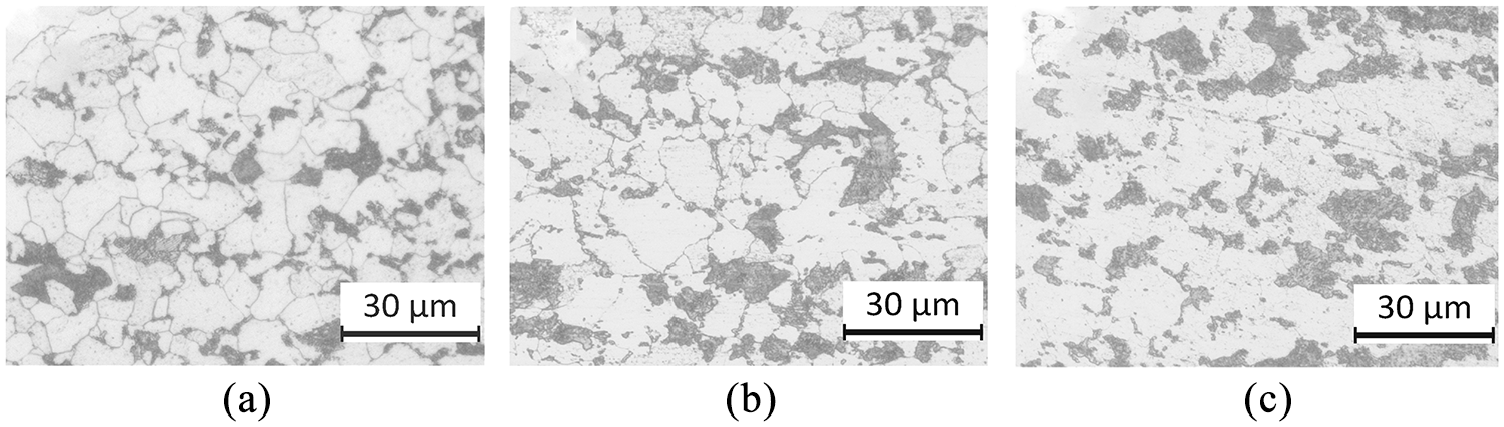
Figure 5 represents the macrographs and microstructure of the three weld samples. The weld samples were polished, followed by etching using nital solution (5% concentrated nitric acid in ethanol), and the microstructure of the different zones were acquired, as shown in Figures 5 to 7. The microstructure of the weld zones were obtained from the final weld passes, as shown in Figure 5. In the weld zone of CG-26 (10 passes) (see Table 2 for the specimen names), columnar elongated ferrite grains were seen along with acicular ferrite (AF) and Widmanstätten ferrite (WF) grains. 39 Fine proeutectic grain boundary ferrite (PGBF) and acicular ferrite grains were seen in CG-26 (17 passes) and NG-18. Precipitation of carbides were observed between the ferrite grains in the weld zone of all the weld samples.
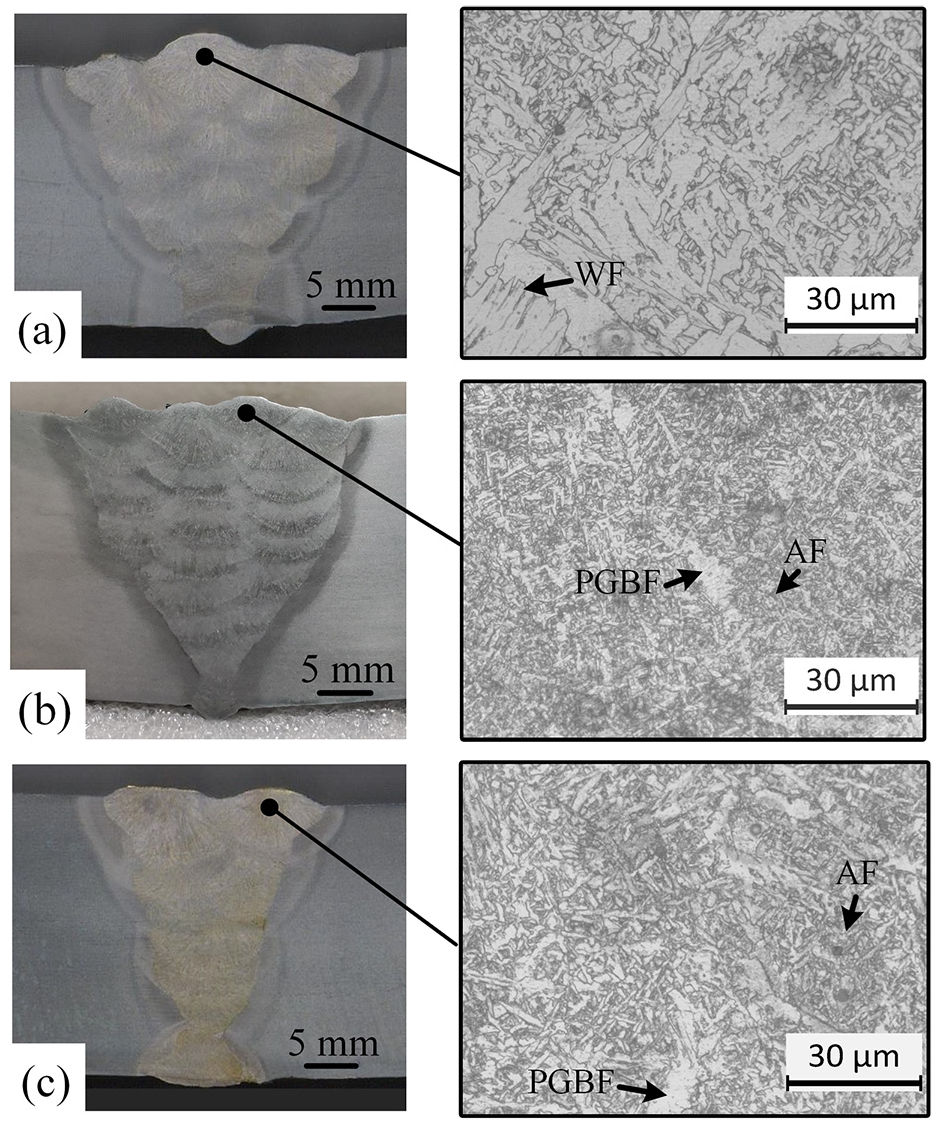
Macrographs and microstructure of the welded samples: (a) conventional groove joint (10 passes), (b) conventional groove joint (17 passes), and (c) narrow groove joint.
The comparison of different microstructures observed at the HAZs of the three weld samples is shown in Figure 6. The HAZ mainly consists of three different microstructural regions, viz., coarse-grained HAZ (CGHAZ), fine-grained HAZ (FGHAZ), and intercritical HAZ (ICHAZ). These subdivisions can be associated with specific temperature brackets. The CGHAZ nearly ranges from 1500°C−1100°C, whereas the FGHAZ and ICHAZ are associated with 1100°C to
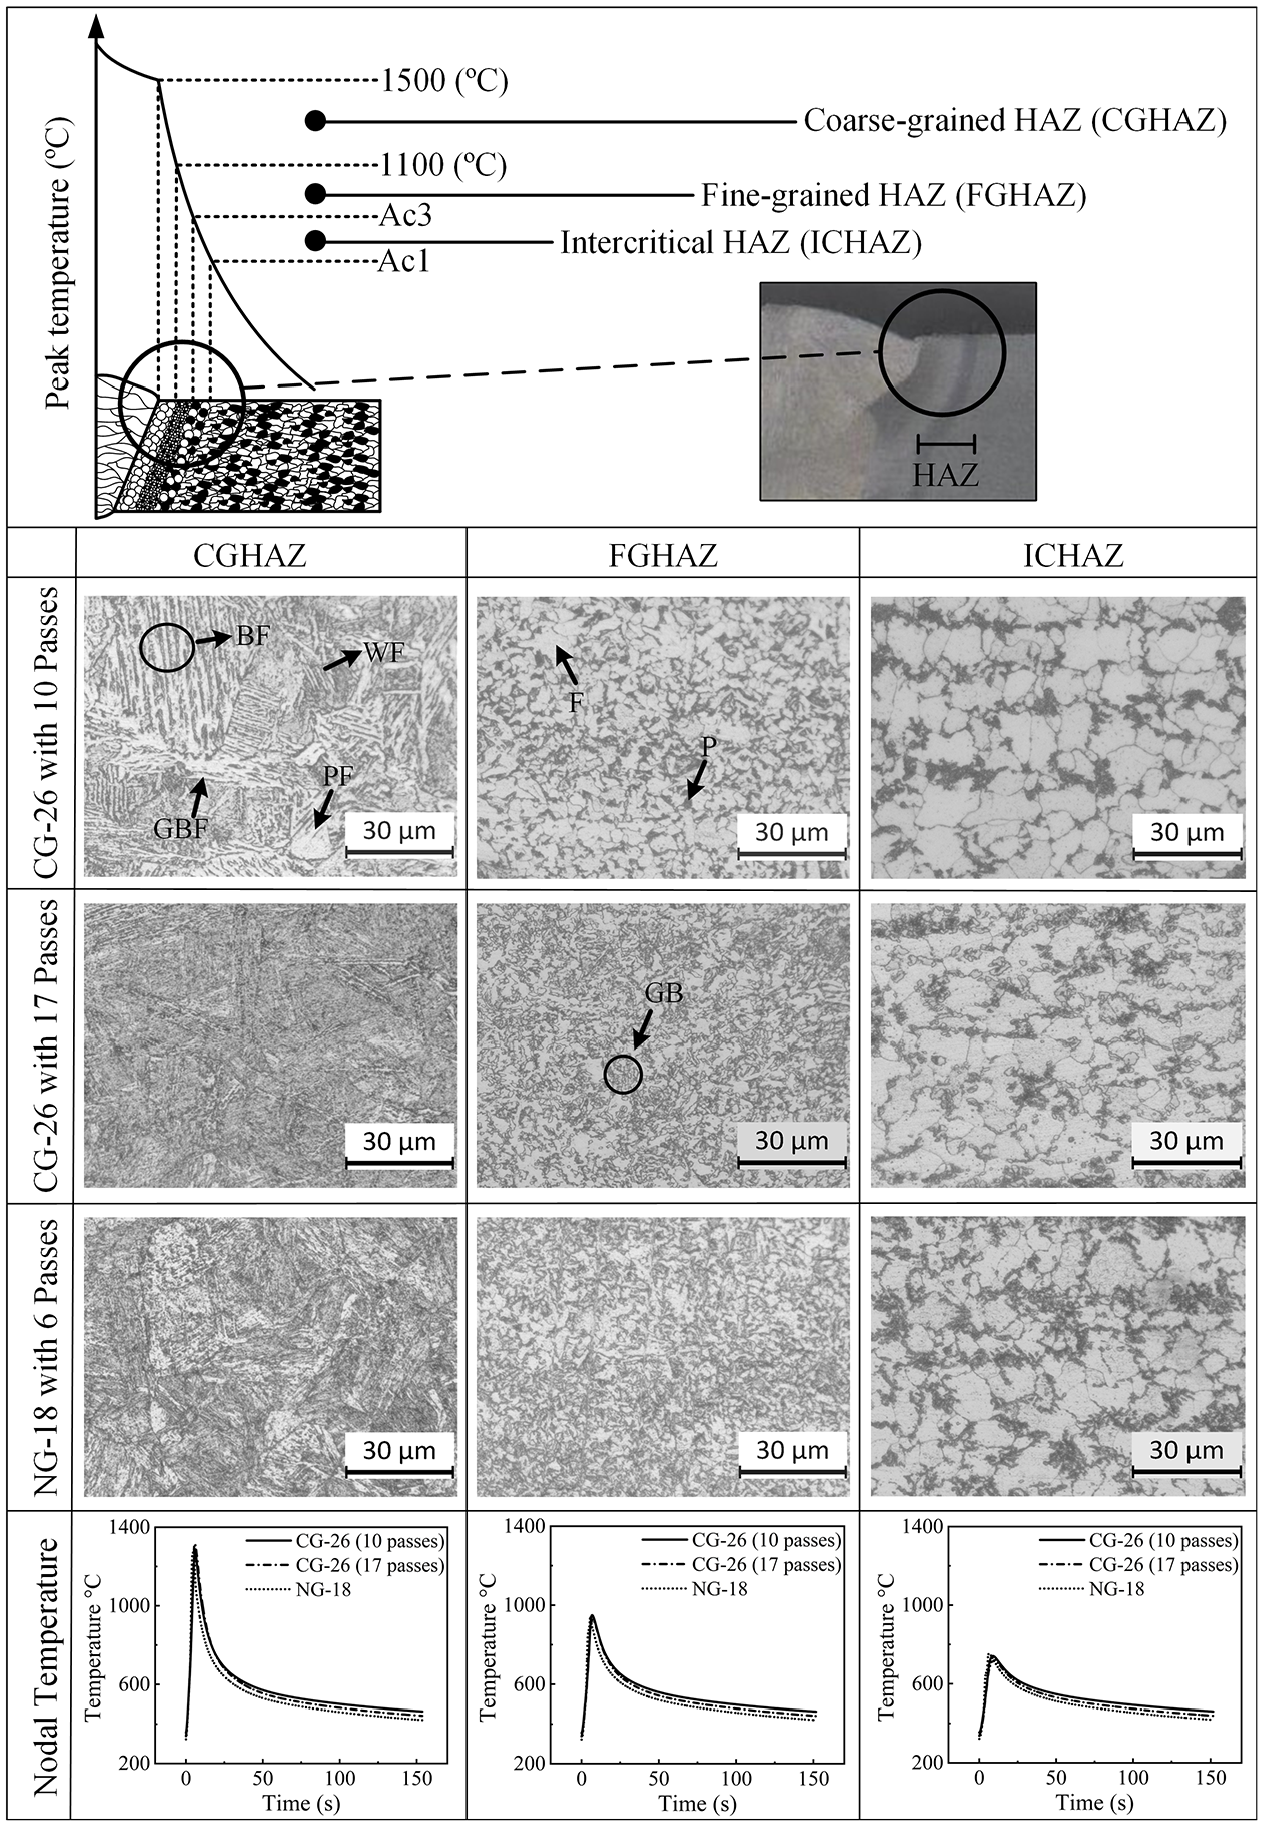
Microstructure of different sub-zones of the HAZs with their corresponding predicted nodal thermal cycles.
The final appearance of microstructures at the HAZ depends upon the chemical composition of the parent material, peak temperature, and cooling rate. The peak temperature determines austenitization, whereas the size of the grains is dependent upon the cooling rate. The microstructure of the CGHAZ of CG-26 (10 passes) was an accumulation of bainitic ferrite (BF), grain boundary ferrite (GBF), polygonal ferrite (PF), and Widmanstätten ferrite (WF) grains. The CGHAZ of CG-26 (17 passes) and NG-18 shared identical microstructures consisting of bainite, fewer martensite, and prior austenite grain (PAG) boundaries. The FGHAZ endured a peak temperature well above the upper critical temperature
No significant differences were observed in the microstructures of the parent material, as shown in Figure 7. Coarse ferrite and pearlite grains were seen in all the base region of the weldments.
Microstructure of the parent material: (a) conventional groove joint (10 passes), (b) conventional groove joint (17 passes), and (c) narrow groove joint.
Microhardness
The maximum hardness was observed at the CGHAZs of all the weld specimens except CG-26 (10 passes). The variations in hardness values confirmed the inhomogeneous microstructural evaluation, as shown in Figure 8. Among the three weld specimens, the weld zone and CGHAZ of the narrow groove joint exhibited the highest hardness values. The higher hardness value at the weld zone of NG-18 can be attributed to the presence of a comparatively finer grain structure (Figure 5). The CGHAZs revealed the highest hardness region in CG-26 (17 passes) and NG-18 due to the presence of bainite and martensite. In the case of CG-26 (10 passes), the hardness value at the CGHAZ was relatively low; here, the CGHAZ endured re-austenitization, and the microstructure transformed into bainitic ferrite (BF) along with a few grain boundary ferrite (GBF), polygonal ferrite (PF) and Widmanstätten ferrite (WF) grains (Figure 6).
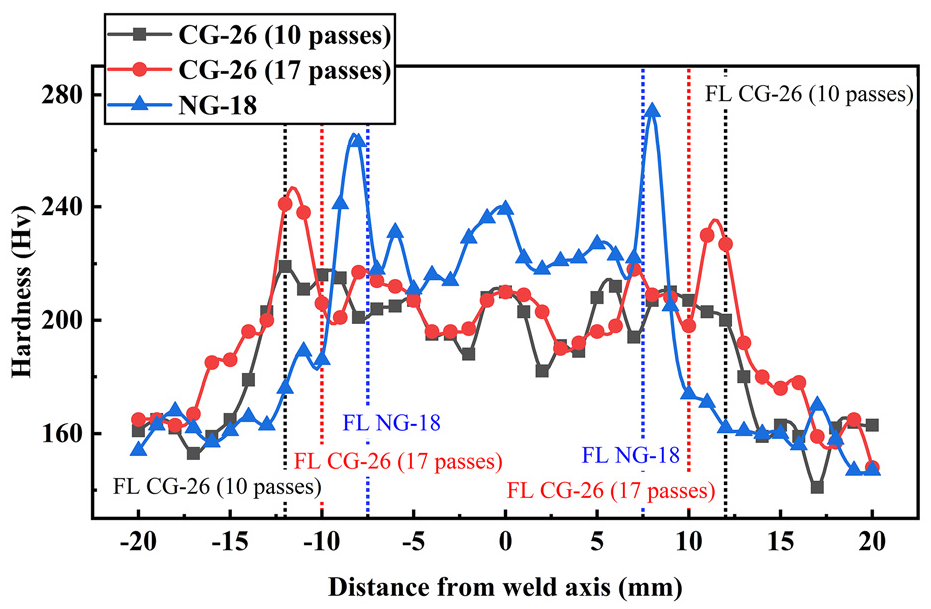
Comparison of microhardness across the weld cross-sections at the middle of the thickness (FL is fusion line).
Temperature contours
The accuracy of any FE numerical model for the prediction of welding residual stresses and distortion is subjected to the accurate evaluation of the welding thermal history numerically. Technically, the main aim is to establish an appropriate fusion zone which comprises the weld zone and fusion boundary within the melting temperature. Figure 9 shows the weld cross-section of conventional and narrow groove weld pools at peak temperature. The peak temperatures obtained in these three models were observed to be reasonably similar to each other. It can be observed from Figure 9 that the weld pool reached above the melting temperature, and the fusion boundary also attained melting temperature.
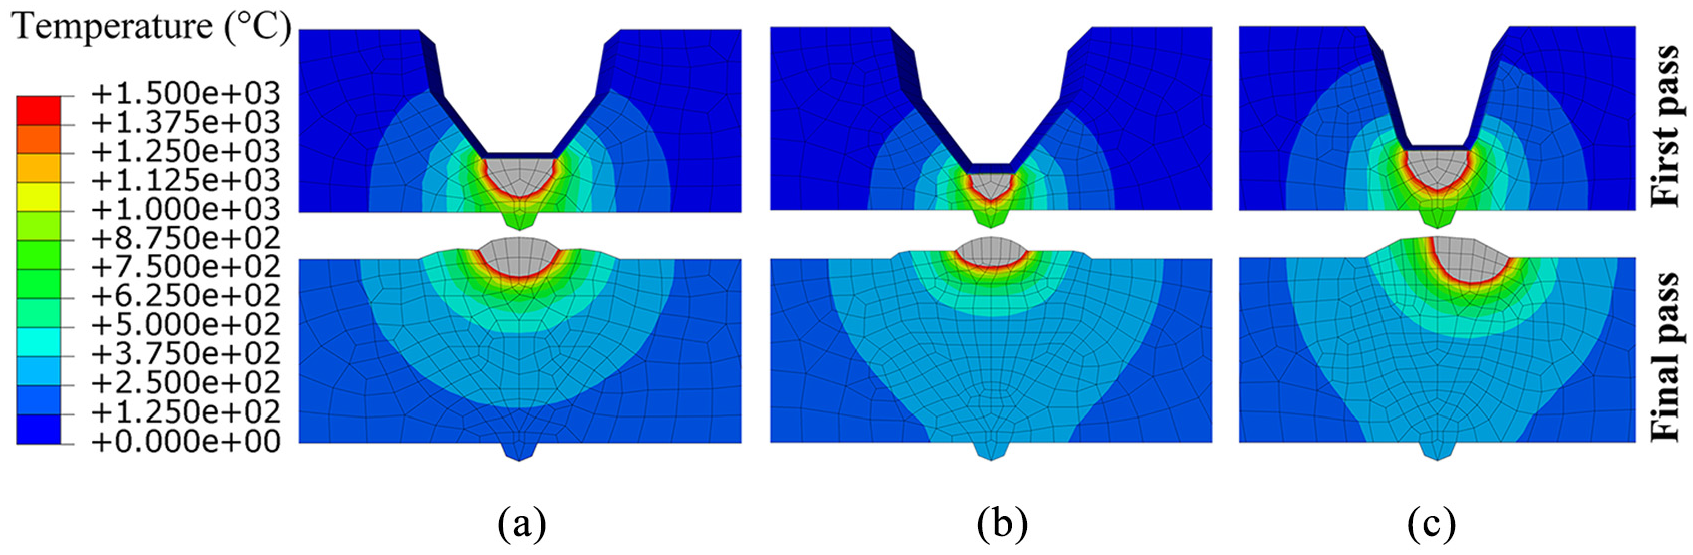
Temperature contours: (a) conventional groove weld (10 passes), (b) conventional groove weld (17 passes), and (c) narrow groove weld.
Residual stress contours
The longitudinal (S33) and transverse (S11) residual stress contour profiles of the three weld samples are represented in Figure 10. It can be observed from the figures that the zones of maximum tensile residual stresses were at the top layers of the weldments. The width of this zone is shorter in the narrow groove weld joint compared to the conventional groove weld (10 passes), as shown in Figure 10(a) and (c). It may happen because the opening section of the conventional V groove geometry at the top surface is larger compared to the narrow groove. So, the top portion of conventional groove weld is subjected to a higher magnitude of heat input to accommodate more number of weld passes and experiences more cycles of thermal stresses. On the other hand, among the conventional groove welds, that zone of tensile residual stresses is wider in the one with a higher number of weld passes, as observed in Figure 10(a) and (b).
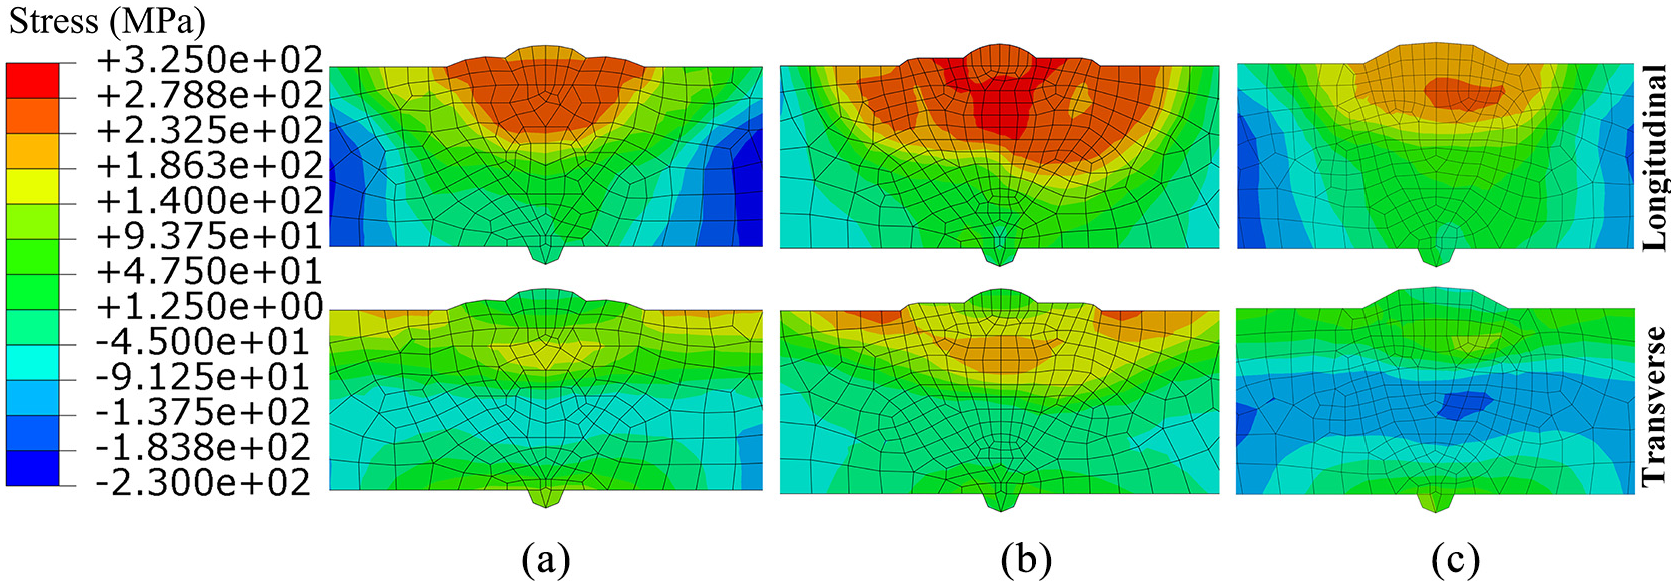
Stress contours: (a) conventional groove weld (10 passes), (b) conventional groove weld (17 passes), and (c) narrow groove weld.
As an example, for verification, the comparison of experimental and corresponding numerical results of through-thickness residual stress patterns observed in the conventional groove joint with 10 number of passes is shown in Figure 11. Notably, the numerical simulation results matched well with the experimental results except in a few regions where the experimental results seem overestimated. It may happen as a result of the presence of initial residual stresses in the base plates due to the application of other fabrication processes like machining, rolling, etc., before the welding operation.41,42 These initial stresses influence the equilibrium state of residual stresses in the weld zone and can lead to intensified welding induced stresses. The regions away from the weld zone do not endure much higher temperature during welding, which could lead to stress relaxation. As the numerical models do not comprise the presence of initial stresses, so the results produced from the simulations exhibited only the welding induced residual stress fields. This might be the reason behind the mismatch of numerical and experimental results.
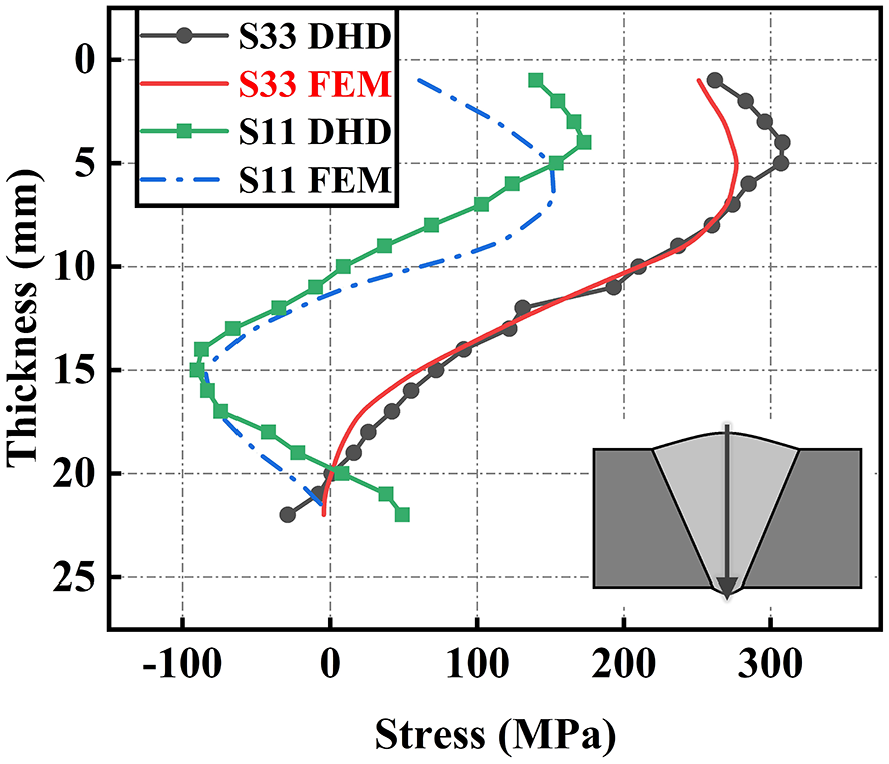
Comparison of experimental and numerical results obtained in conventional weld (10 passes) specimen (S33 = longitudinal residual stress, S11 = transverse residual stress).
Effect of groove geometry
The through-thickness residual stress patterns obtained in CG-26 (10 passes) and NG-18 welds were further compared to understand better the effect of weld groove configuration on the residual stress distributions in terms of both magnitude and direction. It can be observed from Figure 12 that the conventional V groove weld exhibited a comparatively higher magnitude of residual stresses in both the longitudinal and transverse directions. The peak tensile residual stress obtained in conventional V groove weld was 308 MPa in the longitudinal direction, whereas narrow groove weld exhibited around 25% reduction in that peak tensile residual stress. The conventional V groove volume is comparatively higher, and it necessitates a more considerable amount of weld filler material to be deposited. It causes increased driving force employed by the base material against the excessive amount of shrinkages caused by the higher number of weld thermal cycles and finally leads to a larger amount of locked-in strains. In the transverse direction, both the residual stress patterns in different groove geometries followed the same trend, but the peak tensile residual stress in narrow V groove was 40% lower than that of the conventional V groove. In both the groove welds, the transverse residual stress in the middle of the cross-section was found to be compressive in nature with almost identical magnitudes. The magnitude of residual stresses in conventional and narrow V groove welds significantly differed at the upper half of the weld cross-section. In contrast, at the bottom portion, nearly similar magnitudes were observed.
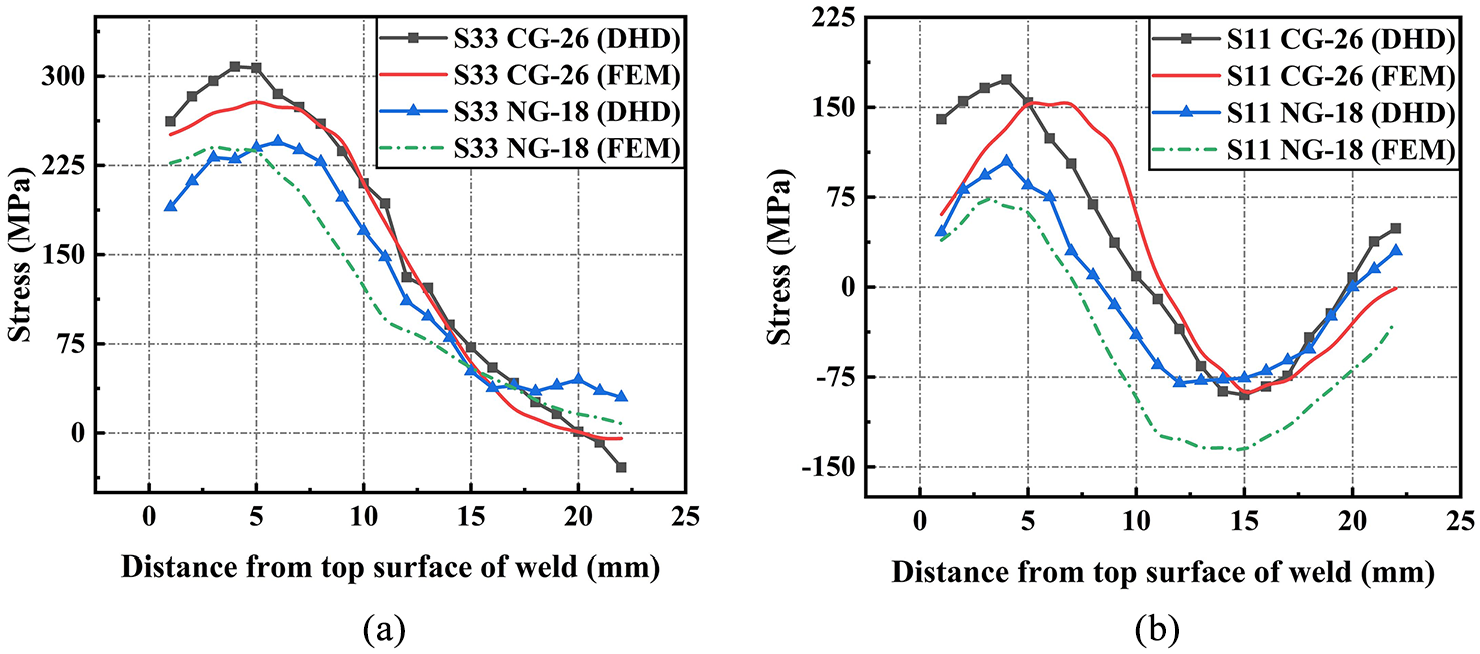
The effect of groove geometry on the through-thickness residual stress distribution at the weld zone: (a) longitudinal residual stress (S33) and (b) transverse residual stress (S11).
When the residual stresses at the HAZ of different weld groove geometries were compared (Figure 13), the obtained results were quite different compared to the trends of the weld fusion zone. At the HAZ, the peak magnitude of tensile longitudinal residual stress acquired in the narrow groove weld specimen was higher than the conventional groove weld. However, the transverse residual stress at the HAZ of the narrow groove weld was significantly low compared to the conventional groove weld.
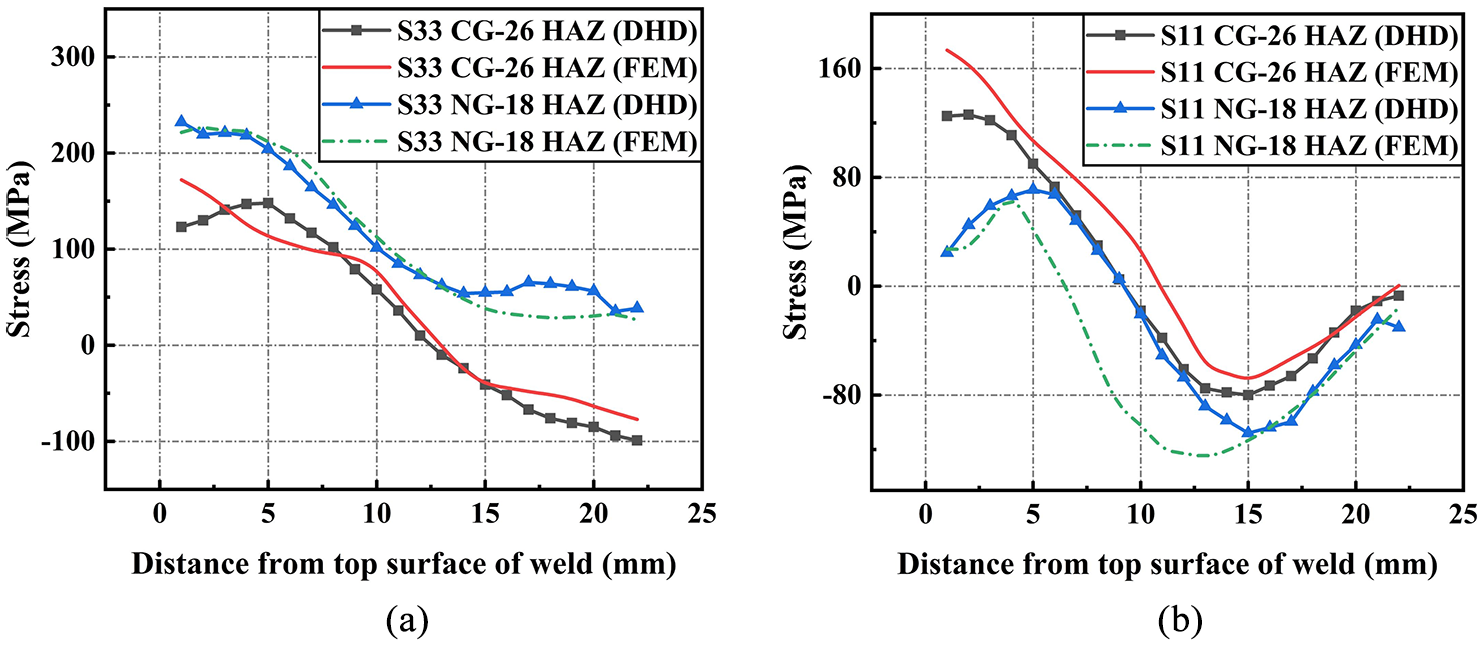
The effect of groove geometry on the through-thickness residual stress distribution at the HAZ: (a) longitudinal residual stress (S33) and (b) transverse residual stress (S11).
Effect of number of weld passes
Figure 14 compares the through-thickness residual stress distribution in conventional groove welds having a different number of weld passes (10 and 17 passes). It was observed that in both the longitudinal and transverse directions, the magnitudes of residual stresses were almost equal at the top surface of the weld zone in both the welds. But, the peak longitudinal stress significantly increased in the CG-26 (17 passes) at a depth of 5mm from the top surface. CG-26 (17 passes) weld encountered a 17% hike in peak longitudinal residual stress compared to CG-26 (10 passes) weld. However, both the samples experienced an almost similar trend of longitudinal residual stress in the middle section. At the bottom of the weld samples, the peak compressive longitudinal residual stress increased in CG-26 (17 passes). In the transverse direction, it was observed that the number of weld passes has a minor effect on the through-thickness residual stress distribution. Although the weld sample with an increased number of weld passes encountered a slightly higher magnitude of transverse residual stresses of both the tensile and compressive nature.
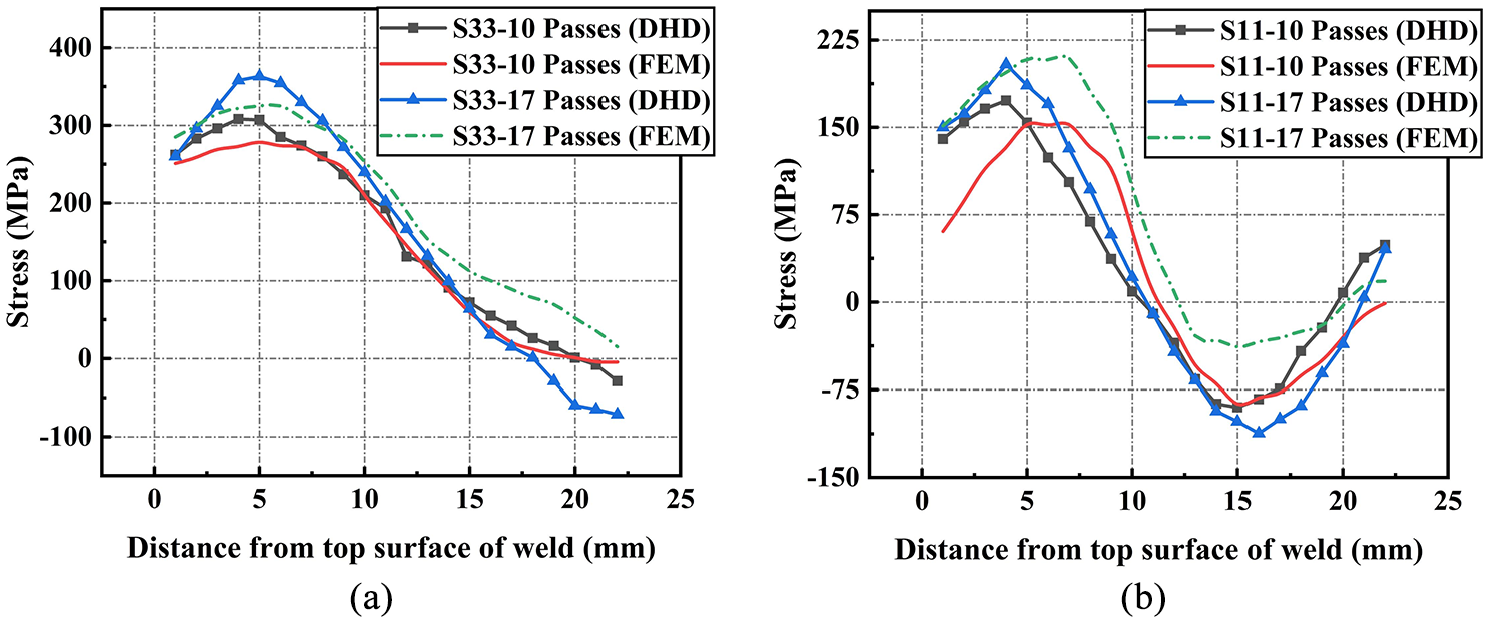
The effect of the number of weld passes on the through-thickness residual stress distribution at the weld zone: (a) longitudinal residual stress (S33) and (b) transverse residual stress (S11).
In the HAZ of CG-26 (17 passes), due to a higher number of weld beads, the peak magnitude of longitudinal and transverse residual stress significantly increased around 70% compared to the CG-26 (10 passes) weld sample, as shown in Figure 15.
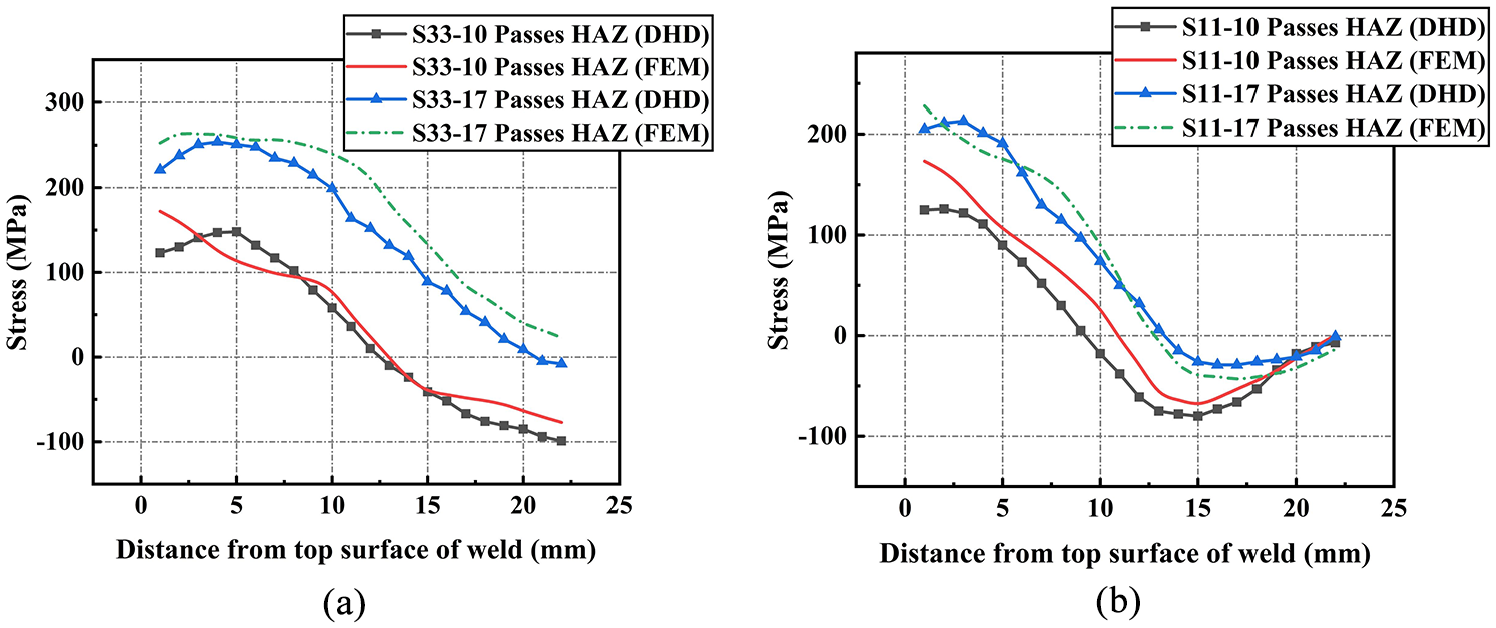
The effect of the number of weld passes on the through-thickness residual stress distribution at the HAZ: (a) longitudinal residual stress (S33) and (b) transverse residual stress (S11).
Effect of constraints
The FE model of CG-26 (10 passes) was used to study the effect of constraints on the distribution of through-thickness residual stresses. The displacement and rotation against lateral shrinkage were made zero to replicate the probable restrained behavior under clamped condition. Figure 16 depicts the longitudinal and transverse through-thickness residual stress fields under both the restraining conditions. It was observed that under the influence of external constraints, the magnitude of residual stresses in both the longitudinal and transverse directions significantly increased at the top surface of the weld. At the bottom portion of the weld, residual stresses were near to the same magnitude. Jones et al. 43 also investigated the same for surface residual stress distribution using the analytical and blind hole drilling method and concluded that transverse residual stress increased with imposed restraint on the weld joint.
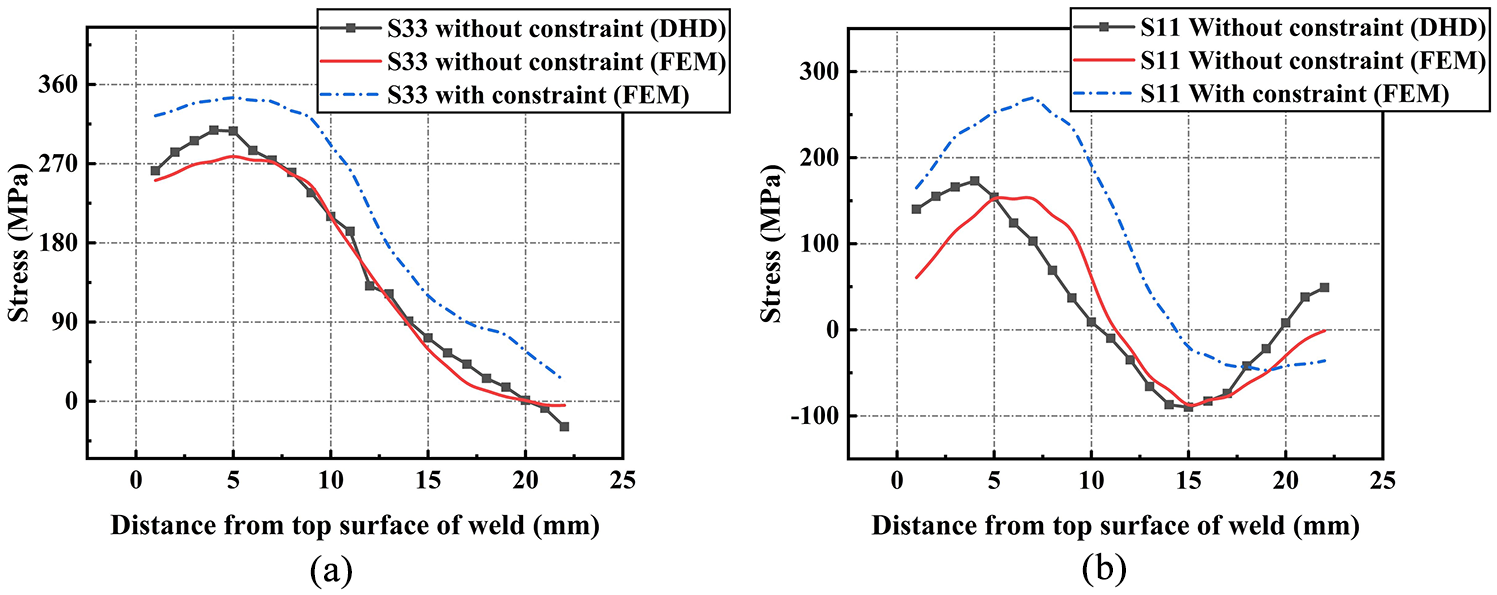
The effect of external constraints on the through-thickness residual stress distribution at the weld zone: (a) longitudinal residual stress (S33) and (b) transverse residual stress (S11).
The effect of constraints was also significant on the residual stress trends at the HAZ. At the HAZ, due to the constrained condition, around 26% and 72 % hike in the magnitudes of longitudinal and transverse residual stresses were observed, respectively, as shown in Figure 17.
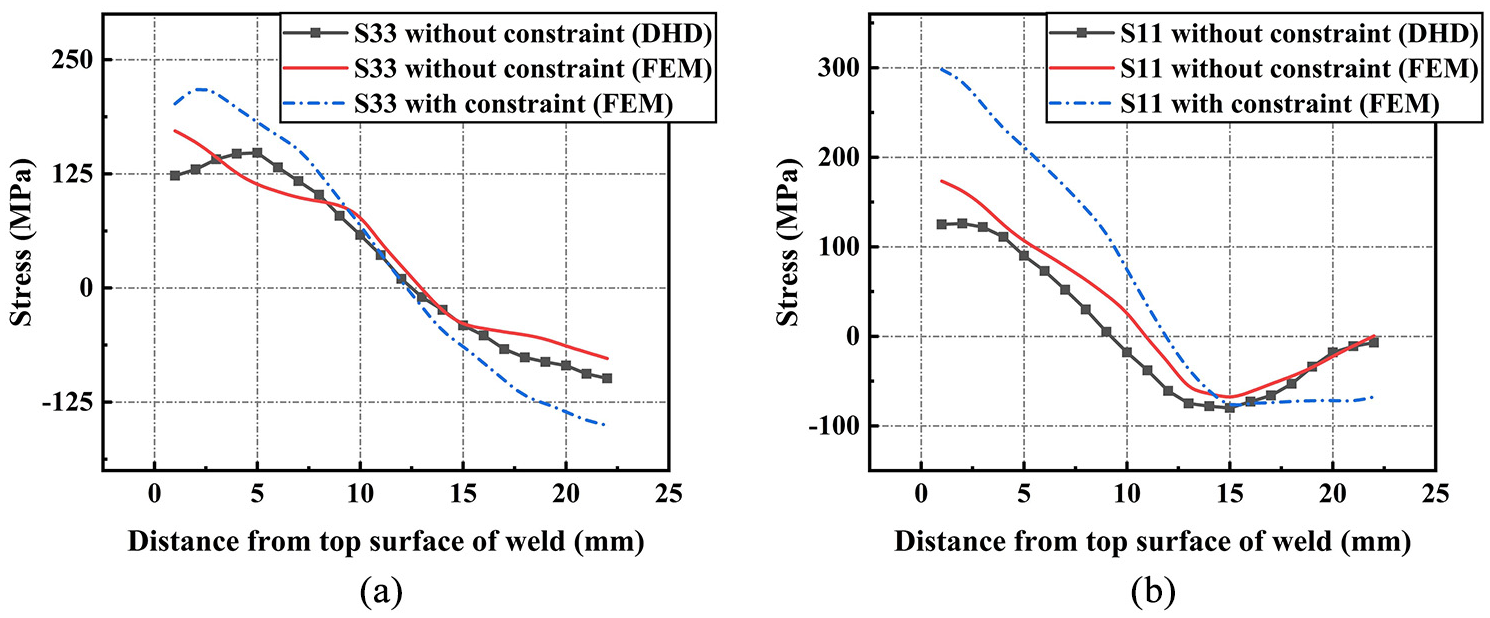
The effect of external constraints on the through-thickness residual stress distribution at the HAZ: (a) longitudinal residual stress (S33) and (b) transverse residual stress (S11).
Effect of preheat
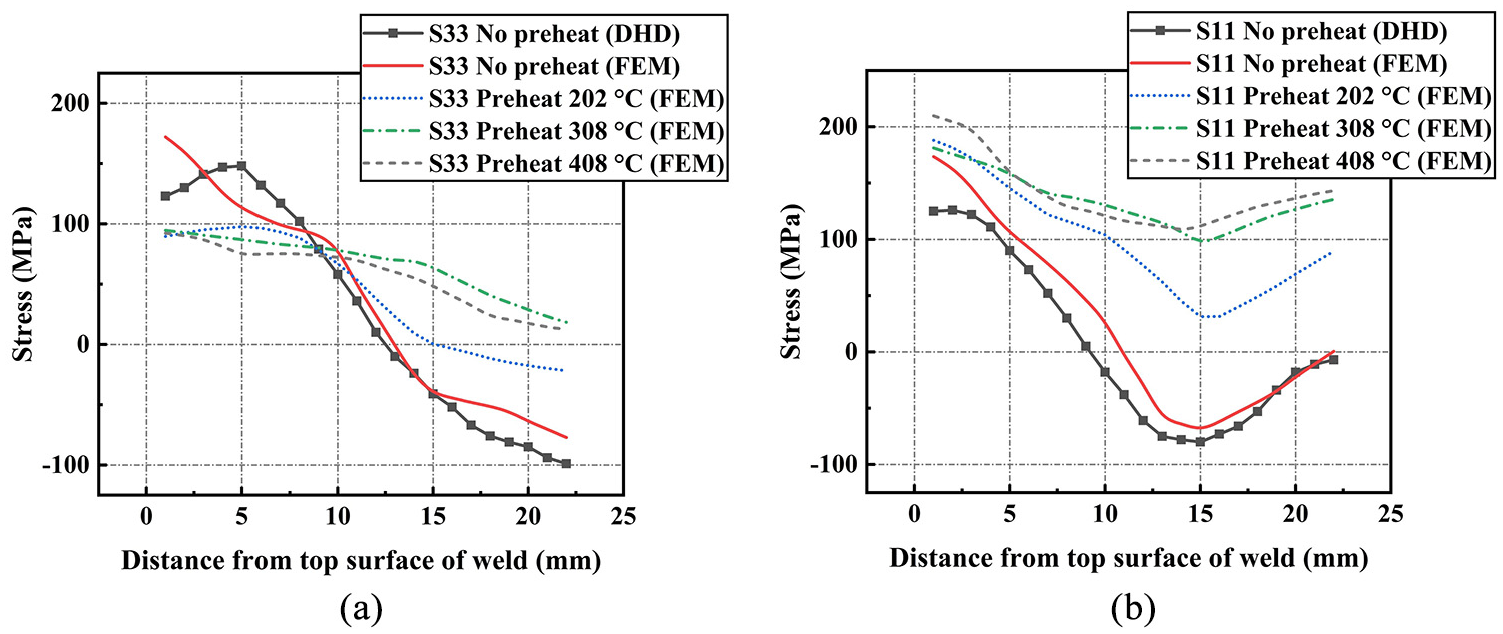
Residual stress occurs due to localized heating during welding, which causes nonuniform expansion of the weld zone and the adjacent region under thermal loads followed by different cooling rates. The yielding of weld material occurs after solidification to account for the local strain gradients caused by thermal contraction against relatively cooler base material. The cooling rate of the weld zone and its adjacent region can be altered by introducing a preheat temperature to minimize the induced residual stresses. Adedayo and Adeyemi 44 observed around 65% reduction in residual stress magnitudes at the surface of the weld zone by the application of 200°C preheat temperature. For the present investigation, three different homogeneous preheat temperatures (202°C, 308°C, and 408°C) were obtained in the FE model of CG-26 (10 passes) at the initial modeling step. Figures 18 and 19 show the variation in longitudinal and transverse residual stress patterns under the influence of preheat temperatures at the weld zone and HAZ, respectively. It was observed that an increase in preheating temperature substantially reduced the longitudinal residual stress magnitude. At the preheat temperature of 408°C, the longitudinal residual stress got decreased around 30%. However, on the other hand, considerable rise or fall in peak transverse residual stress was not observed with the change in preheat temperature at the top surface of the weldment, but the through-thickness transverse residual stress distribution got altered significantly with increasing preheat temperature. The compressive transverse residual stress fields present in the middle of the plate thickness transformed into tensile in nature and kept intensifying with increasing preheat temperature. The increasing preheat temperature influences the equilibrium state of temperature dispersed across the weldment and the total amount of heat input. So, their cumulative effect may have suppressed the effect of preheating on the reduction of transverse residual stress distribution. Lin and Lee found preheating increased the residual stress magnitude in SS304 weldment. It was suggested that the application of preheat temperature may lead to a broader HAZ and reduce the strength of the base material. 45
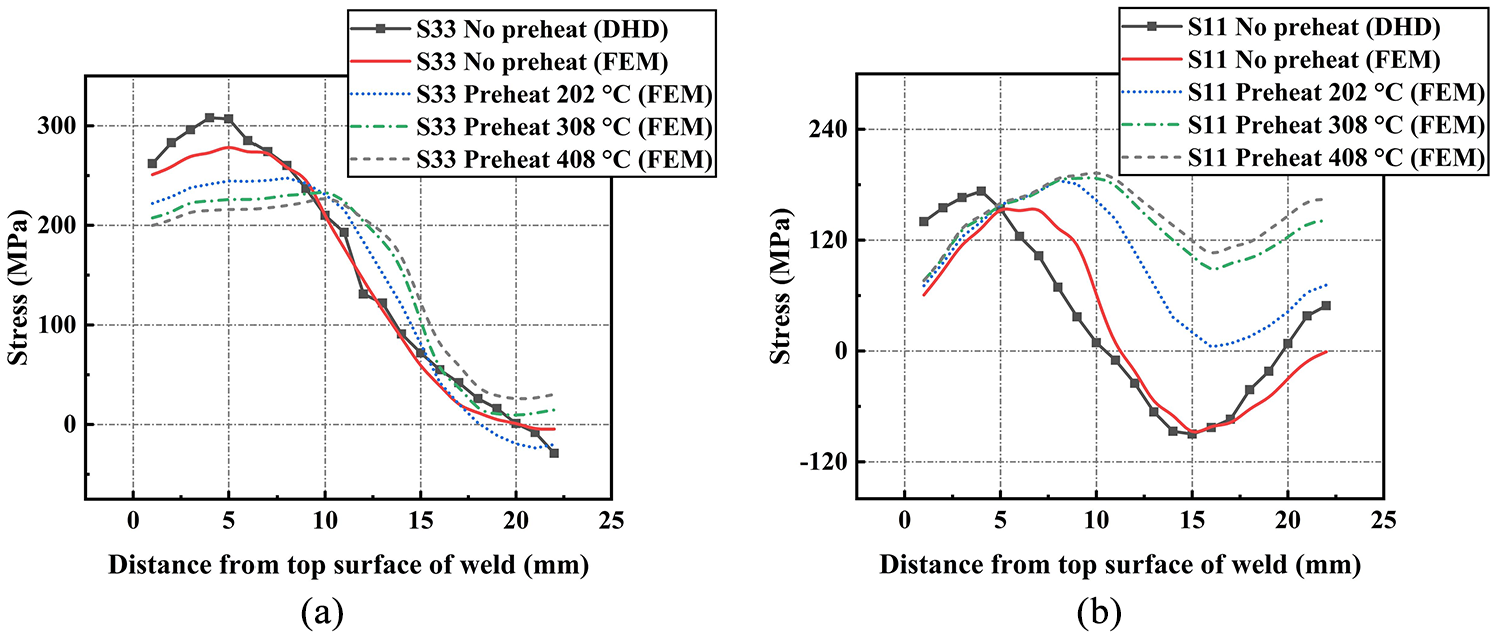
The effect of preheating temperature on the through-thickness residual stress distribution at the weld zone: (a) longitudinal residual stress (S33) and (b) transverse residual stress (S11).
The effect of preheating temperature on the through-thickness residual stress distribution at the HAZ: (a) longitudinal residual stress (S33) and (b) transverse residual stress (S11).
As of the weld zone, a similar phenomenon was also observed at the HAZ under the influence of preheat temperature (Figure 19).
Effect of welding conditions on distortion
Figure 20 shows the comparison of angular distortion between the weld samples of two conventional groove joints having different number of weld passes and one narrow groove joint. Both the experimental measurement of deflection and the numerical prediction was done at the center of the plate and in a plane normal to the weld axis, starting at a point 10 mm away from the plate edge. From Figure 20, the effects of the number of weld passes and different groove geometries on the angular distortion can be distinguished. It was observed that the major angular distortion occurred in the case of the conventional weld sample with a higher number of weld passes. In contrast, the conventional groove weld with 10 number of passes got distorted comparatively less. Murugan and Gunaraj 46 made the same conclusion in a study of gas metal arc welded structural steel welded plates. On the other hand, in a comparison between conventional and narrow groove welds, it was observed that the narrow groove weld joint exhibited significantly lower angular deflection.
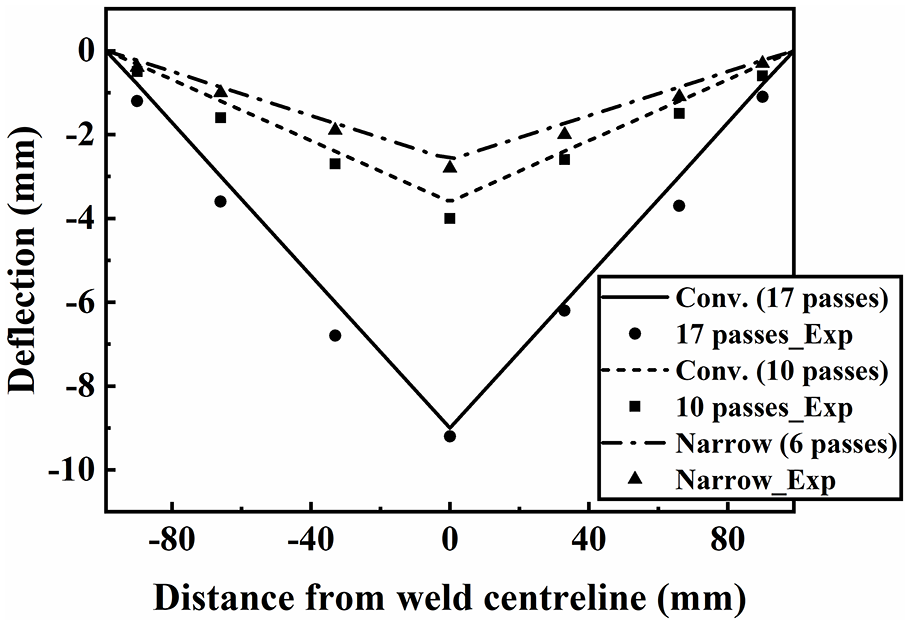
Effect of welding conditions on angular distortion.
Evolution of through-thickness residual stresses
The weld induced residual stresses develop due to nonuniform volumetric expansion of the weld zone and the HAZ. 47 Consequently, locked up strains increase due to plastic deformation caused by thermal softening and phase transformation. In order to understand the final residual stress distribution across the weld zone, the evolution of through-thickness residual stress fields with corresponding subsequent weld passes has been represented in Figure 21. At the initial stage of weld deposition, it was observed that due to a higher temperature gradient at the weld center, volumetric expansion of the weld zone was accommodated in terms of plastic flow by the thermally softened HAZ. So, upon cooling, the HAZ endured higher tensile residual stresses in the longitudinal direction. In the transverse direction, the weld metal endured resistance against lateral shrinkage exerted by the parent material leading to higher tensile residual stresses at the weld zone. It can be observed from the pass no. 4th and 7th that with subsequent deposition of weld passes, the severe effect of the last active weld pass on the residual stress distribution got distributed among the previously deposited weld passes and the HAZ. Consequently, volumetric expansion and contraction on the HAZs significantly got reduced with succeeding weld passes. Along with that, when the solid-state phase transformation of the HAZ occurs from austenite, the strains associated with the phase transformation opposes the volumetric contraction and reduces tension at the HAZ. 48 Thus finally, the concentration of a higher magnitude of tensile residual stresses was developed at the weld center, and gradually it decreased and transformed into compressive stresses across the weld cross-section to maintain the self-equilibrium state.
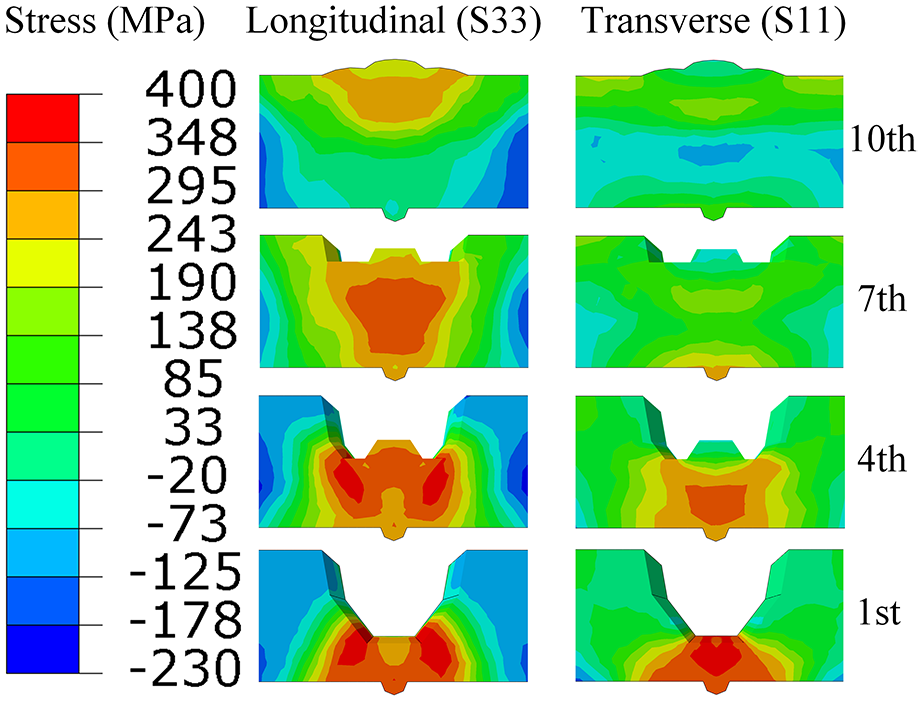
Evolution of through-thickness residual stresses in CG-26 (10 passes).
Conclusion
Both the FE numerical modeling and experimental approach were employed to investigate the residual stress fields distributed through the thickness of butt-welded SA516 Grade 70 pressure vessel steel welded joints. Using the deep hole drilling technique and with the help of numerical models, the effect of welding groove design, external mechanical constraints, number of weld passes, and preheating of base plates on the trend of through-thickness residual stresses and distortion were studied. The outcomes of the present investigation can be concluded as below:
(1) Heterogeneous microstructural appearance was observed across the weldments with corresponding variations in the microhardness values. The CGHAZ appeared to be the hardest region across the weld cross-section.
(2) The peak magnitude of residual stresses was found around 5 mm below the top layer instead of at the surface.
(3) The narrow groove weld joint exhibited reductions in the longitudinal and transverse peak residual stress magnitudes by 25% and 40%, respectively, compared to the conventional groove weld of 10 passes.
(4) The peak magnitude of tensile residual stresses increased in both the longitudinal and transverse directions by 17% with the increase in the number of weld passes.
(5) According to the results drawn from the numerical analysis, the peak longitudinal and transverse residual stresses comparatively increased by 18% and 43%, respectively, by the influence of external constraints on the conventional groove weld of 10 passes.
(6) The addition of a preheating temperature (408°C) before welding effectively reduced the peak longitudinal residual stress by 30% and significantly altered the through-thickness trend of transverse residual stress.
(7) A substantial difference in angular distortion was noticed due to the influence of the number of weld passes and weld groove geometry.
(8) Previously deposited weld passes had a significant influence on the final residual stress distribution across the weldments.
Footnotes
Acknowledgements
The authors are highly thankful to BRNS, BARC-India, and IIT Bhubaneswar for providing experimental facilities along with financial assistance for the present research work.
Declaration of conflicting interests
The author(s) declared no potential conflicts of interest with respect to the research, authorship, and/or publication of this article.
Funding
The author(s) disclosed receipt of the following financial support for the research, authorship, and/or publication of this article: This study received financial support for the present research work from BRNS, BARC India.