
Abstract
The wire electric discharge machining (WEDM) is a potential alternative over the conventional machining methods, in terms of accuracy and ease in producing intricate shapes. However, the WEDM process parameters are exposed to unavoidable and unknown sources of uncertainties, following their inevitable influence over the process performance features. Thus, in the present work, we quantified the role of parametric uncertainty on the performance of the WEDM process. To this end, we used the practically relevant noisy experimental dataset to construct the four different machine learning (ML) models (linear regression, regression trees, support vector machines, and Gaussian process regression) and compared their goodness of fit based on the corresponding R2 and RMSE values. We further validated the prediction capability of the tested models by performing the error analysis. The model with the highest computational efficiency among the tested models is then used to perform data-driven uncertainty quantification and sensitivity analysis. The findings of the present article suggest that the pulse on time (Ton) and peak current (IP) are the most sensitive parameters that influence the performance measures of the WEDM process. In this way, the current study achieves two goals: first, it proposes a predictive framework for determining the performance features of WEDM for unknown design points, and second, it reports data-driven uncertainty analysis in the light of parametric perturbations. The observations reported in the present article provide comprehensive computational insights into the performance characteristics of the WEDM process.
Keywords
Introduction
Wire electric discharge machining (WEDM) claims to be the most promising technology in the processing of tools, dies, fixtures, gauges, aircraft components, and medical devices, etc.1–3 because it is an electro-thermal based machining process wherein the machining occurs without any contact between the tool (wire) and the workpiece. Thus, WEDM doesn’t result in abrupt failure of the cutting tool, generation of residual stresses on the machined surfaces, and formation of burrs, etc. These issues are common and inevitable while working with conventional machining processes. Besides, WEDM is highly capable of making complex contours with appreciable accuracy and precision which gives it an edge over conventional machining processes.
WEDM process is referred to as a complex process due to its inherent nature and involvement of multiple process variables. As a result, the necessity to comprehend the underlying process mechanism has consistently intrigued the research community’s interest. To this end, an extensive amount of research has been carried out on modeling the WEDM process to comprehend the process mechanism. Moreover, a good amount of studies reported the optimization of WEDM process performance by regulating the process parameters.4–10 For instance, Puri and Bhattacharyya 11 reported the influence of parametric variations associated with the large set of input parameters on three important process outcomes namely, cutting speed, geometrical inaccuracy, and surface features. Similarly, Tosun and Pihtili 12 investigated the impact of pulse duration, wire-speed, dielectric flushing pressure, and open-circuit voltage on wire crater size. It is inferred that the crater dimension escalates with the rise in the pulse duration, wire speed, and open-circuit voltage while the increase in the dielectric fluid pressure curtails the crater dimension. While Newton et al. 13 reported the impact of process parameters on the recast layer in WEDM of Inconel 718. In another study, Mahdieh 14 investigated the microstructural changes in the specimen processed by the electrical discharge machining, he concluded that the processing of coarse grain samples resulted in a relatively thicker recast layer, whereas the ultra-fine grain samples depicted the heat-affected zone. Whereas, Sharma et al. 15 reported the effect of process parameters on the process efficiency and dimensional shift for WEDM operation of porous nickel-titanium (Ni40Ti60) alloy. Another research group probed the process parametric effect on cutting velocity and surface roughness in dry WEDM of Al/SiC metal matrix composite. 16 Whereas Jia et al. 17 analyzed the effect of spark cycle and spark duration on the material removal rate and surface roughness in near-dry WEDM of polycrystalline diamond-coated tungsten carbide cutting tool material. The fatigue performance of WEDM finished TiNi shape memory alloy was reported by Beck et al., 18 wherein they observed the decreasing trend in the fatigue strength of WEDM processed specimen when compared with the simple ground specimen. Likewise, Hosseini et al. 19 investigated the surface integrity and fatigue life of WEDM processed Inconel 718. They observed that the peak current has a major influence on the fatigue life and residual stress of the specimen.
Due to their inherent ability to model high dimensional data with non-linearity, machine learning approaches have been highly successful in matching WEDM process outputs with input attributes. As a result, various research groups have successfully applied machine learning approaches to WEDM modeling.20–22 For instance, Sarkar et al. 23 exploited the neural network to correlate cutting speed, wire offset, and surface roughness with six important process parameters including four electrical parameters and two mechanical parameters. Another research group incorporated a second-order regression model and neural network to assess the machining rate and the surface roughness of the WEDM processed tungsten carbide-cobalt composite. They further looked over the effect of parametric variation on the responses. 24 Recently, different kernel-based support vector regression models are exploited to map material removal rate and surface roughness with six process variables. Sensitivity analysis has been deployed based on the best model to apprehend the influence of input variables. 25 In another recent work, the researchers proposed a model by integrating Gaussian process regression and wolf pack algorithm for forecasting and optimization of MRR and 3D surface characteristics in WEDM of SiCp/Al composite. The role of different process parameters on the performances has been highlighted. 26 Whereas Ulas et al. 27 employed four different machine learning models (ELM, W-ELM, SVM, and Q-SVR) to assess the surface roughness values in WEDM of AL7075. It is clear from the foregoing brief literature analysis that previous Wire EDM research has focused solely on examining the impact of process parameters on performance criteria in a deterministic framework. However, in actual practice, the process parameters in WEDM undergo fluctuations due to unavoidable sources of uncertainties. The fluctuations of pulse on time, peak current, pulse off time, and servo voltage are inevitable due to the uncertain gap state, control actions, and power fluctuation by the pulse generator. Wire feed rate and wire tension also remain practically uncertain due to the uncertain frictional forces between the wire electrode and the rollers of the wire transport system, uncertain disturbance forces experienced by the wire electrode during machining. The fluctuations in the process parameters generally result in the fluctuation of the process outcomes which is not desirable. This can also explain the error associated with the reproducibility in the WEDM process. To avoid irregularities in the process outcomes, the first and foremost step is to have a realization of the fluctuations in the process outcomes due to the uncertainty in process parameters. The collection of such realizations on a wide scale (e.g. 10,000 samples) experimentally, is prohibitive considering the associated expense of time and cost. Hence, the integration of the ML approach with the conventional WEDM process mitigates the inherent challenges and reveals the performance of the process on the minuscule level, which would otherwise remain un-investigated. The present analysis intends to explore the influence of random control features (pulse on time, peak current, pulse off time, wire feed rate, spark gap voltage, and wire tension) on the two important WEDM process outcomes namely surface roughness and cutting rate.
The present study aims to assess the influence of parametric uncertainty on the performance measures of the WEDM process; in this regard, the ML-based probabilistic framework is proposed (refer to Figures 1 and 2) to map the statistical distribution of the parametric perturbation with the probabilistic occurrence of performance features of the WEDM process. The computational capability of four different ML models is compared on the basis of the error analysis. Furthermore, the sound generalization prowess of the GPR based ML model is utilized to reveal the deep computational insights of the WEDM process outcomes. The findings of machine learning predictions are utilized to carry out the variance based data driven sensitivity analysis to identify the relative significance of considered control parameters on the performance of WEDM. The idea of relative significance is further extended to reveal the dependence of the performance measures of the process on the parametric uncertainties associated with the determined most significant parameters. In the present study, we demonstrated the capability of the GPR based ML model to reveal the deep computational insights of WEDM performance measures for Inconel 718. When the complex nonlinear relationship between the predictor and response variables is present, the GPR-based ML model has been shown to produce the best possible smooth responses.26,28 Hence, irrespective of adopting different workpiece material, the spatial material anisotropy would not be a constraint in forming the efficient GPR based ML model.
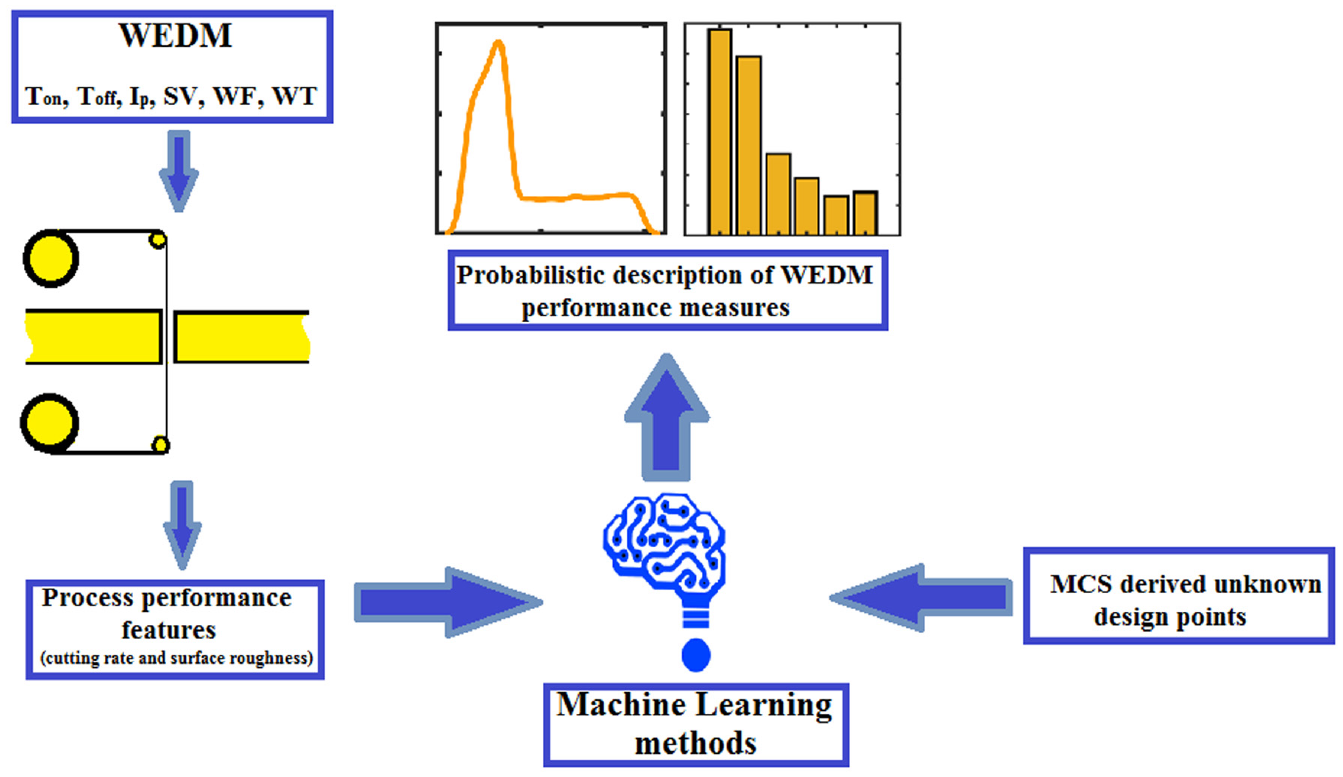
Stochastic investigation of WEDM performance measures.
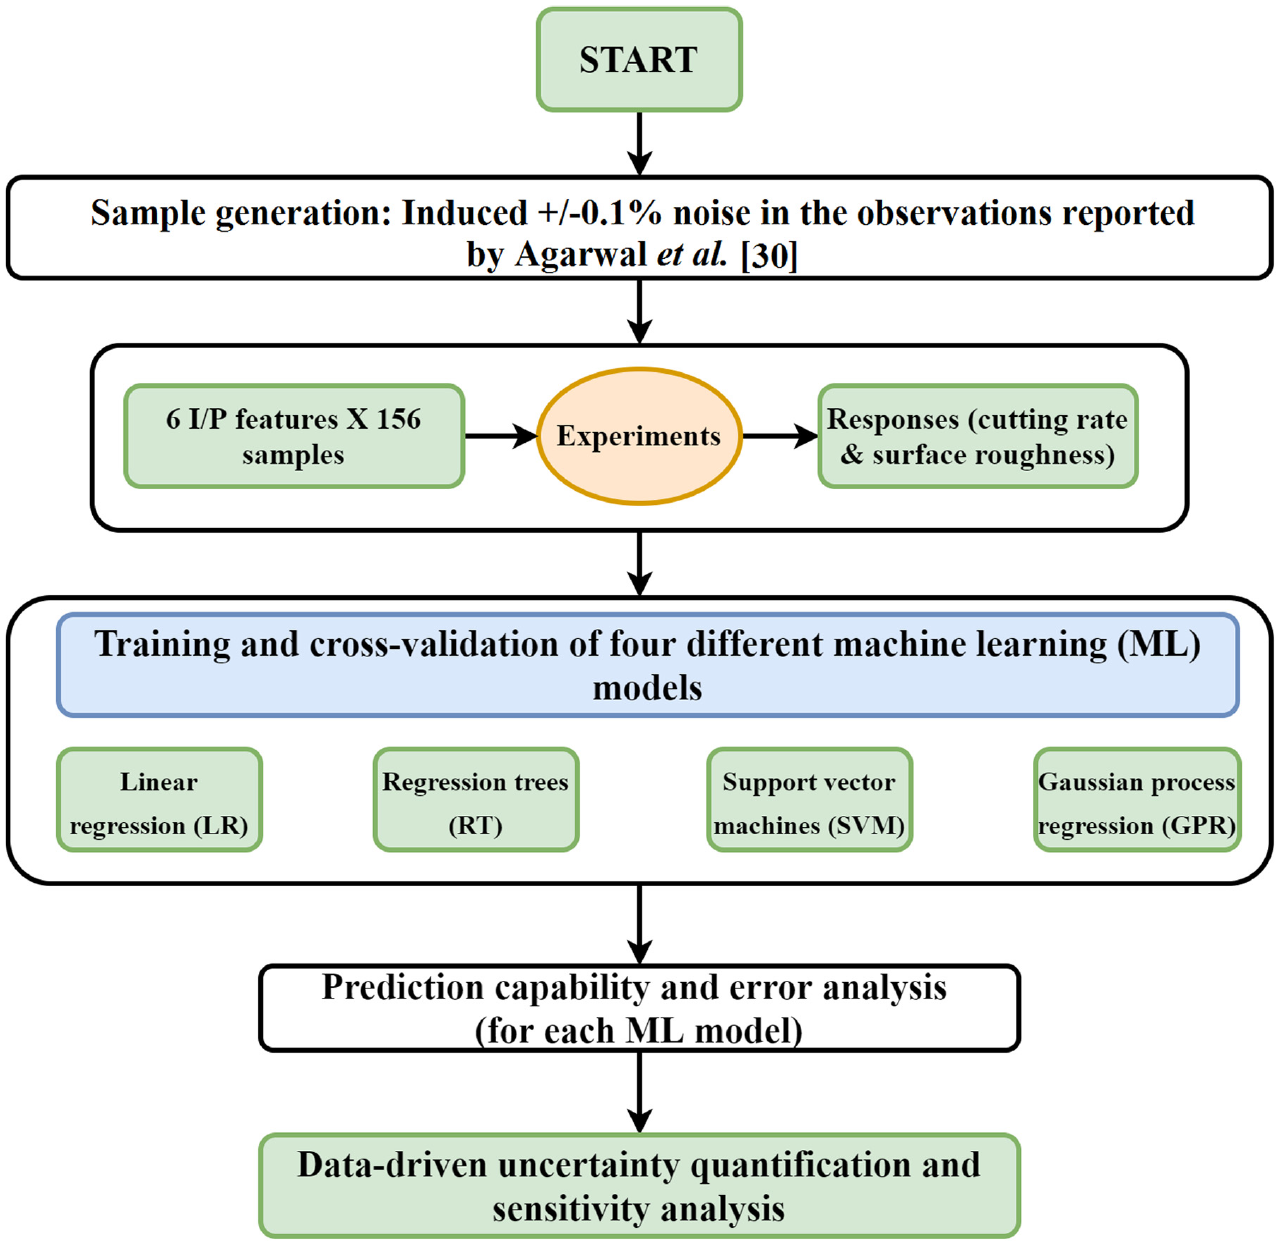
Flowchart for machine learning based uncertainty quantification in the WEDM process.
Machine learning approaches
In this section, we described the mathematical formulation of different ML models used in the present study. The ML models namely, linear regression (LR), regression trees (RT), support vector machines (SVM), and Gaussian process regression (GPR) are compared based on their computational efficiencies. In the next paragraph, we provide a brief description of the four ML models.
Linear regression (LR)
The LR approach is a method of supervised learning and defines the mapping between the output quantity and multiple predictors. The model is based on the assumption that a linear relationship exists between the predictor and response variables. Mathematically, the equation for linear regression can be given as

Where, y refers to the response quantity, x1, x2, and x3 denotes the multiple predictor variables, and β0, β1, β2, and β3 are the model coefficients which define the relationship between predictors and response quantities. The LR approach is advantageous in the sense of its simplicity and ease of fitting. 29
Regression trees (RT)
Regression Trees (RT) are efficient algorithms put forth by Wittkowski 30 for classification and regression problems. These models are trained usually by a two-stage training procedure that is, formation of the tree structure and tree pruning.
Regression trees fit the data by the binary recursive partitioning process. For the formation of the tree, training data is iteratively split into two partitions or branches. The algorithm selects the split wherein the sum of the squared deviations from the mean is minimum. This splitting rule is followed by each of the new partitions or branches. The process repeats until each node becomes a terminal node. A terminal node is a node when it reaches a user-specified minimum node size or if the sum of squared deviations from the mean in a node is zero. Since the tree is formed from the training set, a large tree structure ends up in poor generalization capability of the model to unseen samples. Therefore, the tree should be pruned back using the validation set.
Support vector machines (SVM)
SVM was developed as a method for linear classification, generalized later as a non-linear classifier and, at last extended to regression problems. SVR seeks to minimize the upper limit of the generalization error by minimizing structural risk. The input space is mapped into a high dimensional feature space by SVR exploiting different kernel functions to generate and solve a regression problem in the feature space. In SVR, the training dataset comprises
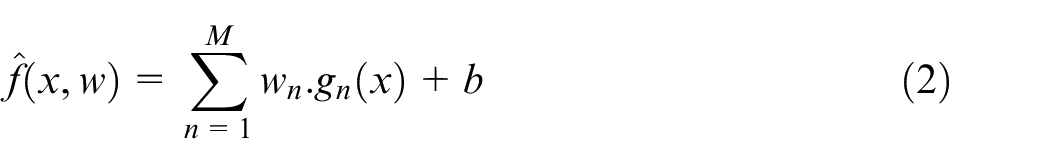
The small value of w ensures maximum flatness, which can be obtained by minimizing

The above problem for optimization is feasible when there exists a flat function that approximates the sample points with errors less than
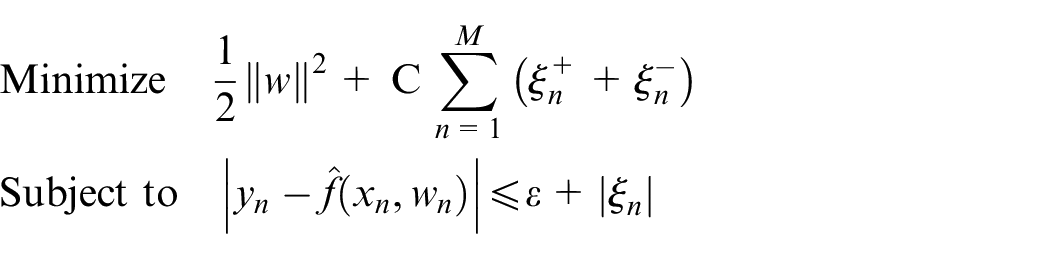
Where slack variables
Gaussian process regression (GPR)
GPR is a non-parametric kernel-based Bayesian modeling technique that doesn’t provide a specific form to the relationship between the input variables and the target.
32
Based on the available data, GPR identifies the relationship between input variables and target variables. This method has advantages over many ML algorithms due to its integration of several ML tasks that is, estimation of hyperparameters, model training, and uncertainty estimation. GPR aims to relate the observed responses to an arbitrary regression function

Where y refers to the response values and x refers to the predictor variables. A Gaussian process

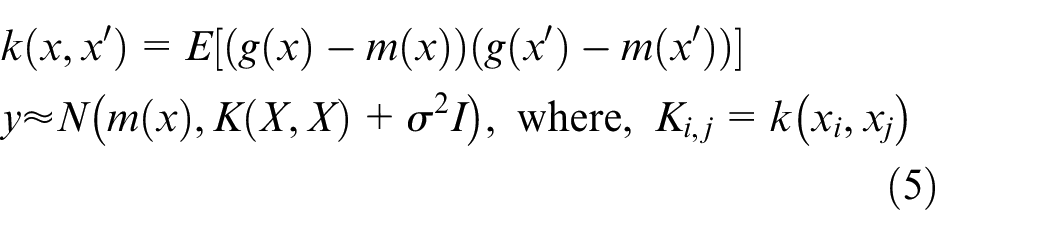
Based on the nature of the noise
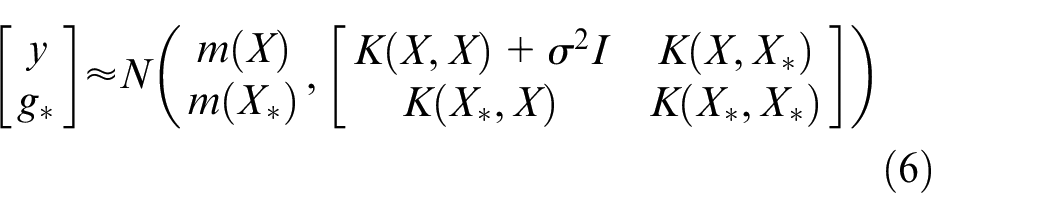
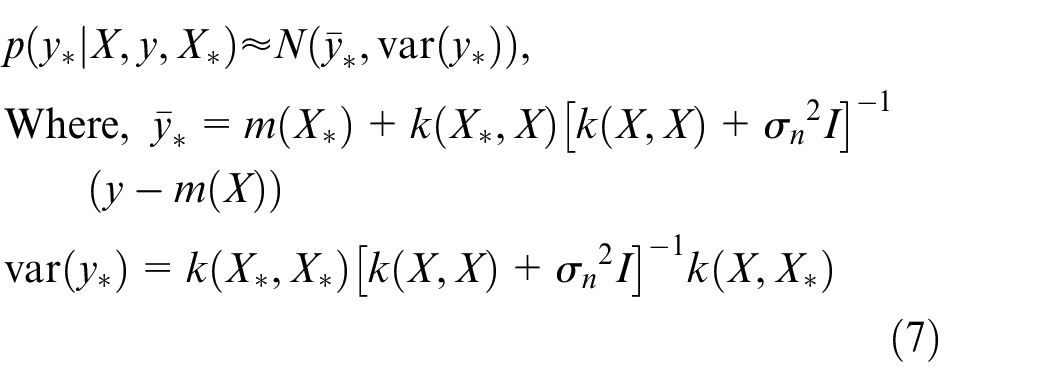
As y follows the Gaussian distribution and the joint prior distribution is obtained using equation (6), the posterior distribution of
To accommodate the reproducibility errors associated with the WEDM process the experimental observations were introduced with the pseudo-random Gaussian white noise.33,34 The Gaussian white noise may be defined as

Where, n stands for the experimental observation with the subscript i and j as frequency number and sample number in the sample space, respectively.
Results and discussion
The reproducibility errors associated with the WEDM process has been observed by many researchers in the past. For instance, Aggarwal et al. 35 reported the reproducibility noise or error in the observed responses within ±5%, when the same experiment is conducted eight times. Similarly, Hegab et al. 28 also experienced reproducibility errors while investigating the MRR, wear electrode ratio and surface roughness of WEDM machined Al-CNT composite. In this regard we used the experimental results reported by Aggarwal et al. 35 (52 samples) and induced the noise of level ±0.1% in the experimental observations by following equation (8) provided in the preceding section, the input process settings were kept unaltered.
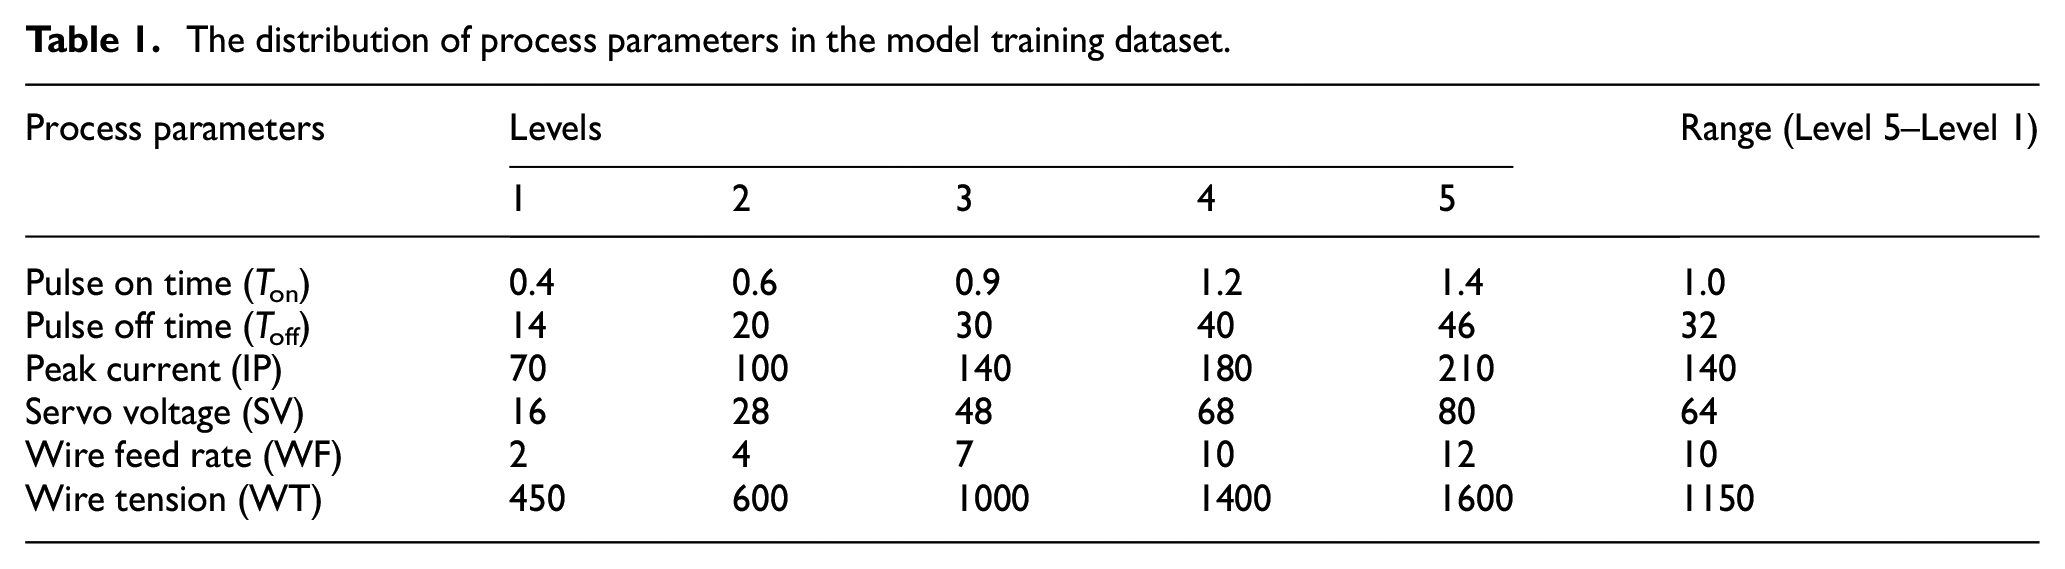
Such setting of a noisy dataset (with 156 samples) was further used to train and test the four different machine learning models (refer to Figure 2). This also accommodates the practically relevant random noise associated with the experimental observations into account while training the machine learning models. Further, the framework proposed in Figure 2 is followed to test and validate the different considered ML models. The input process settings in the data sets were distributed as shown in the Table 1.
The distribution of process parameters in the model training dataset.
Construction and comparison of ML models
In the present analysis, four different machine learning (ML) models (linear regression: LR, regression trees: RT, support vector machine: SVM, and Gaussian process regression: GPR) were constructed.
The comparison of these models is carried out on the basis of scatter plots between true and predicted responses, and the associated model parameters (RMSE and R2 values). To ensure predictive efficiency and prevent overfitting, a k-fold (k = 5) cross-validation scheme is implemented. In k-fold cross-validation, the sample space is split into “k” disjoint sets, wherein one set is exploited in validating the model and the rest k-1 sets are used to train the model. The cross-validation scheme enforces simultaneous training and testing while constructing the model, which results in acquiring the global optimal solution of the problem instead of exploring the solution locally. Figures 3 and 4 illustrates the scatter plots drawn from the different machine learning models corresponding to the cutting rate and surface roughness, respectively. It is revealed from the scatter plots that, besides all the considered models demonstrate satisfactory predictive capability, the GPR based machine learning model is found most efficient in terms of RMSE and R2 values. However, to have a better understanding of the generalization capability of the considered models we further performed the error analysis which is presented in Figure 5. The Pdf plots illustrated in Figure 5 indicates the distribution of percentage error in the predicted responses retrieved from each model. It is evident from the plots that the GPR based ML model results in the least percentage error in the predictions, regardless of the responses (CR or SR). The computational superiority of GPR (when compared with the other considered models) can be explained by its inherent nature of acquiring smoothness in response.36,37 Hence the GPR based ML model is further used to perform the comprehensive analysis to reveal the probabilistic descriptions of performance measures of the WEDM process.
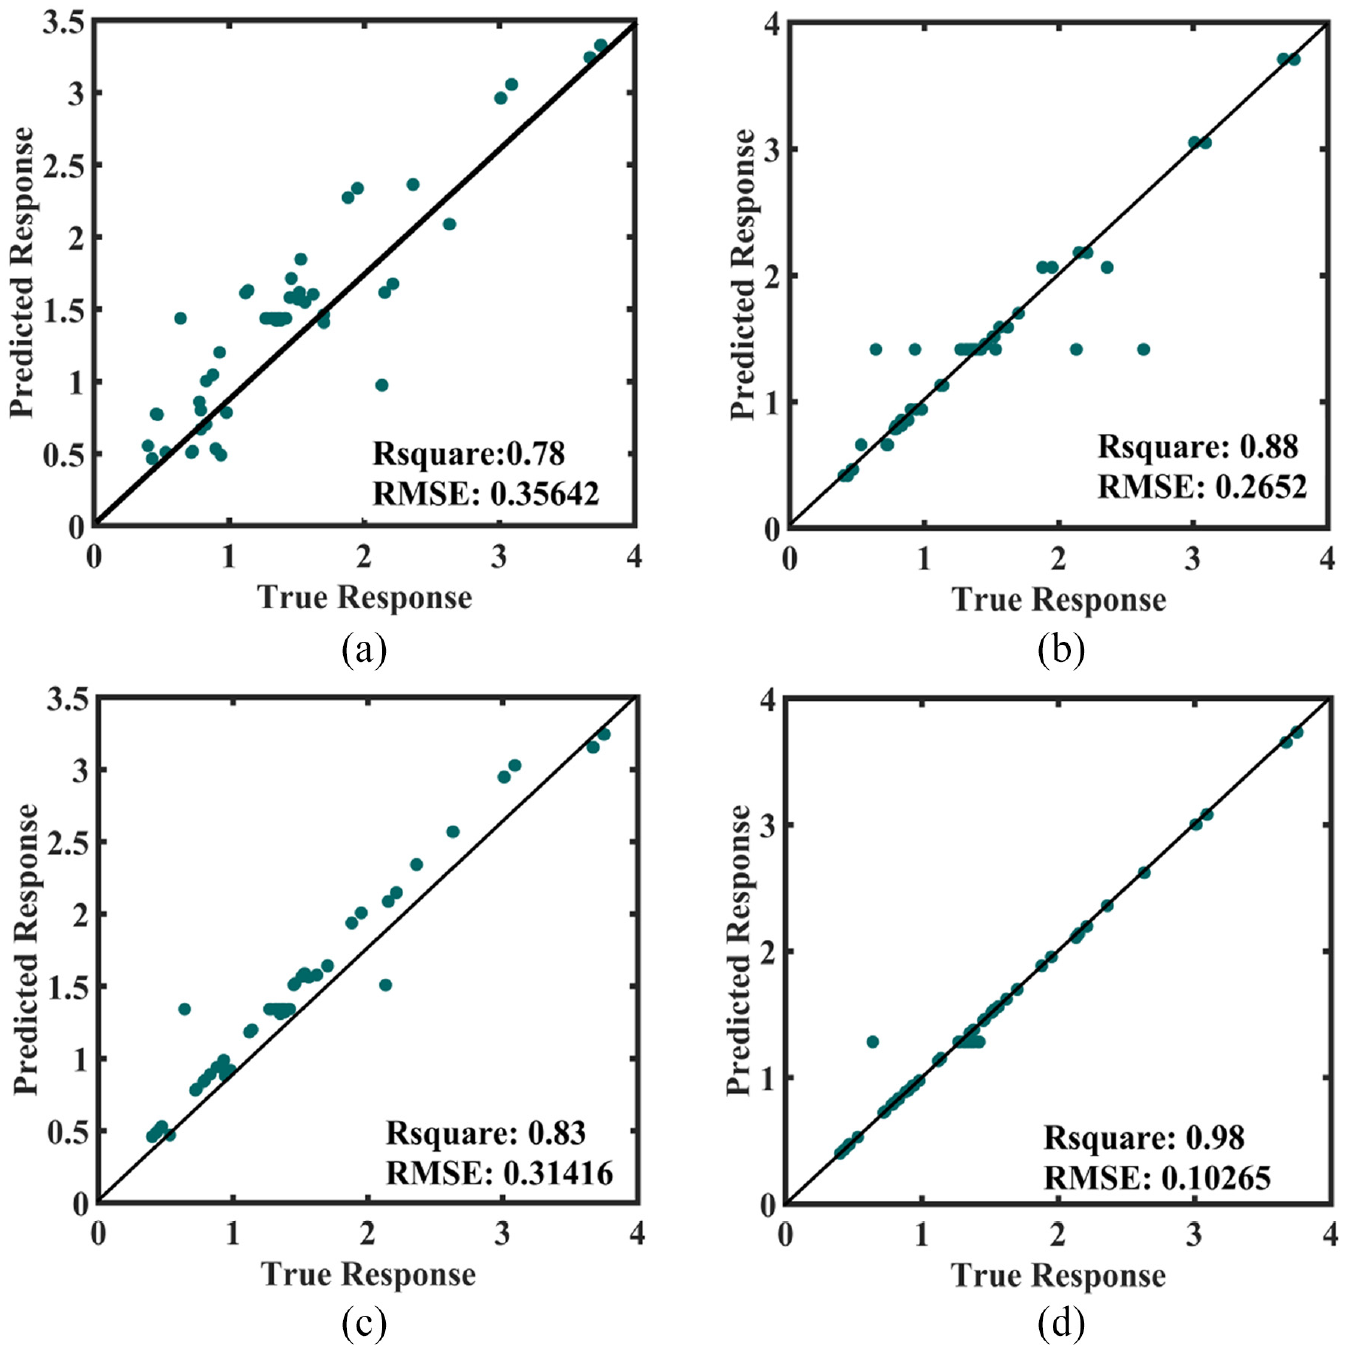
Scatter plots corresponding to the cutting rate drawn by using: (a) LR, (b) RT, (c) SVM, and (d) GPR.
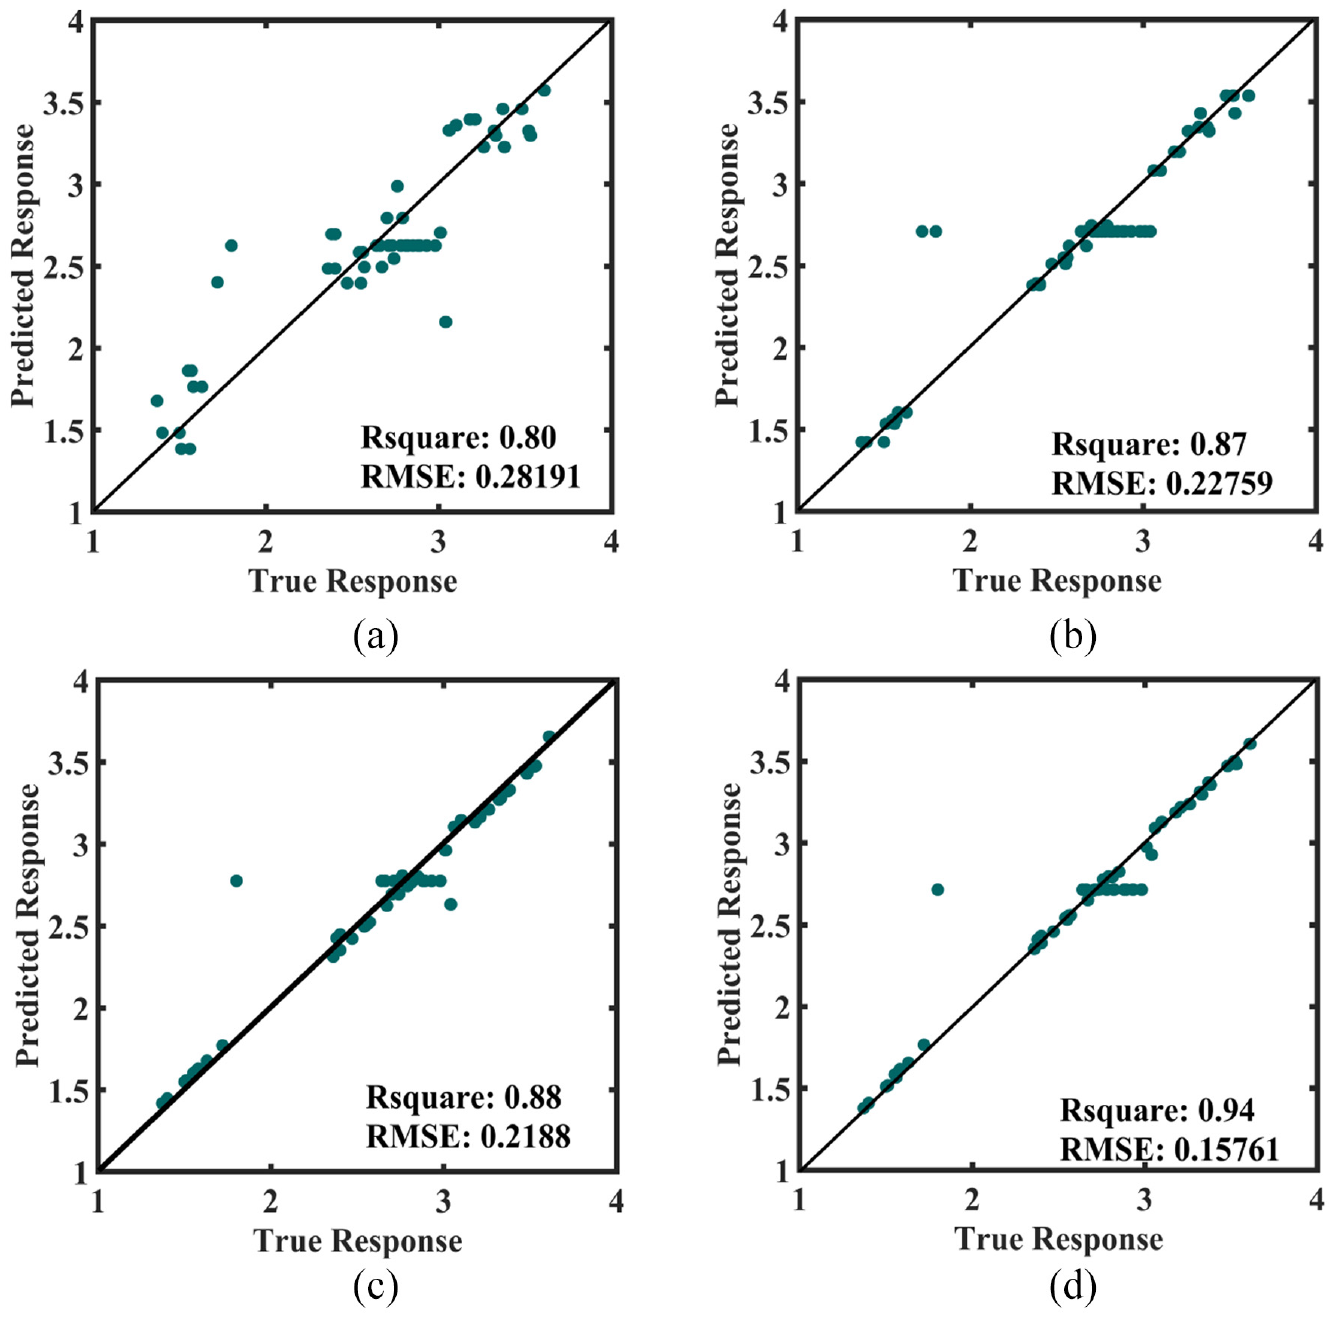
Scatter plots corresponding to the surface roughness drawn by using: (a) LR, (b) RT, (c) SVM, and (d) GPR.
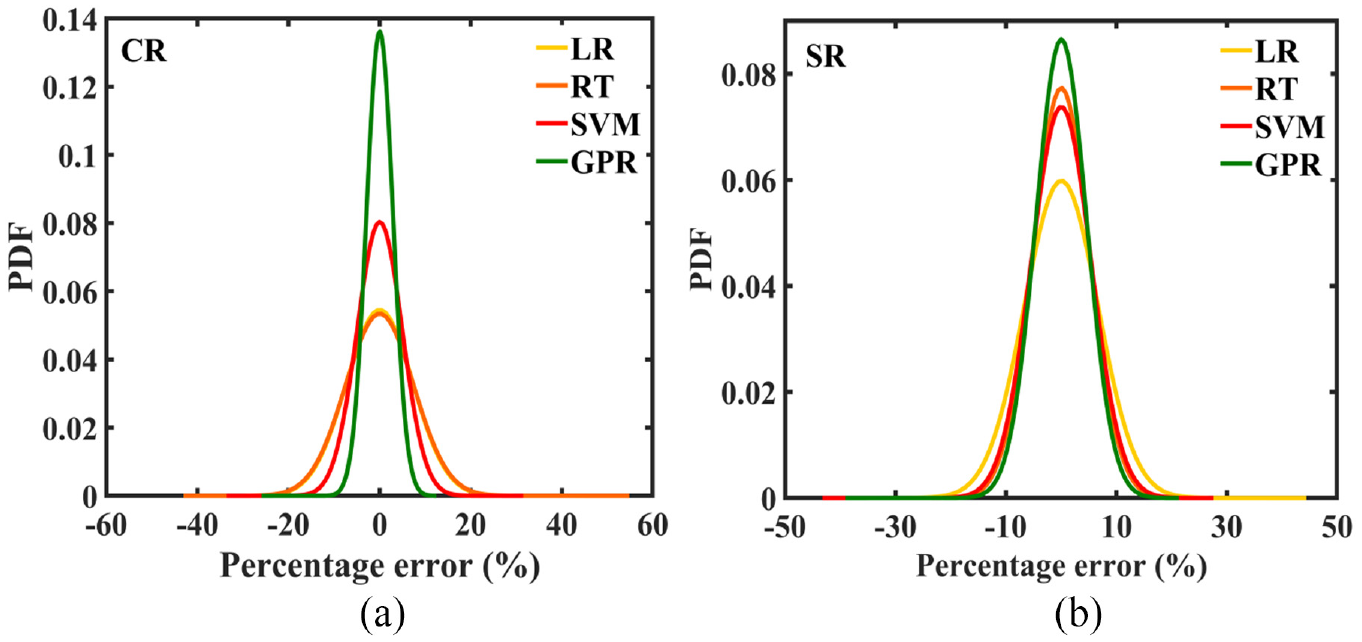
The error analysis of considered ML models: (a) the comparison of percentage errors in the prediction of cutting rate associated with the considered ML models and (b) the comparison of percentage errors in the prediction of surface roughness associated with the considered ML models.
With adequate confidence in the predictive capabilities of the GPR based ML model, the model is further used to predict the response quantities for the unknown large number of samples derived from Monte Carlo Sampling (MCS) keeping the range of process parameters the same as the training dataset (refer to Table 1). To this end, the parametric uncertainty of 1%, 3%, and 5% is introduced to the individual mean values of process parameters and three different datasets with 10,000 samples in each are constructed. It is worth noting here that the range of parametric uncertainty is within the range of parametric variation in the ML training dataset. The response quantities for these unknown datasets are predicted using GPR based ML models.
Figure 6 depicts the stochastic bounds for the cutting rate (CR) and surface roughness (SR) subjected to a different percentage of parametric uncertainty. Furthermore, it is observed that the probabilistic distribution profile for CR and SR is a normal distribution.
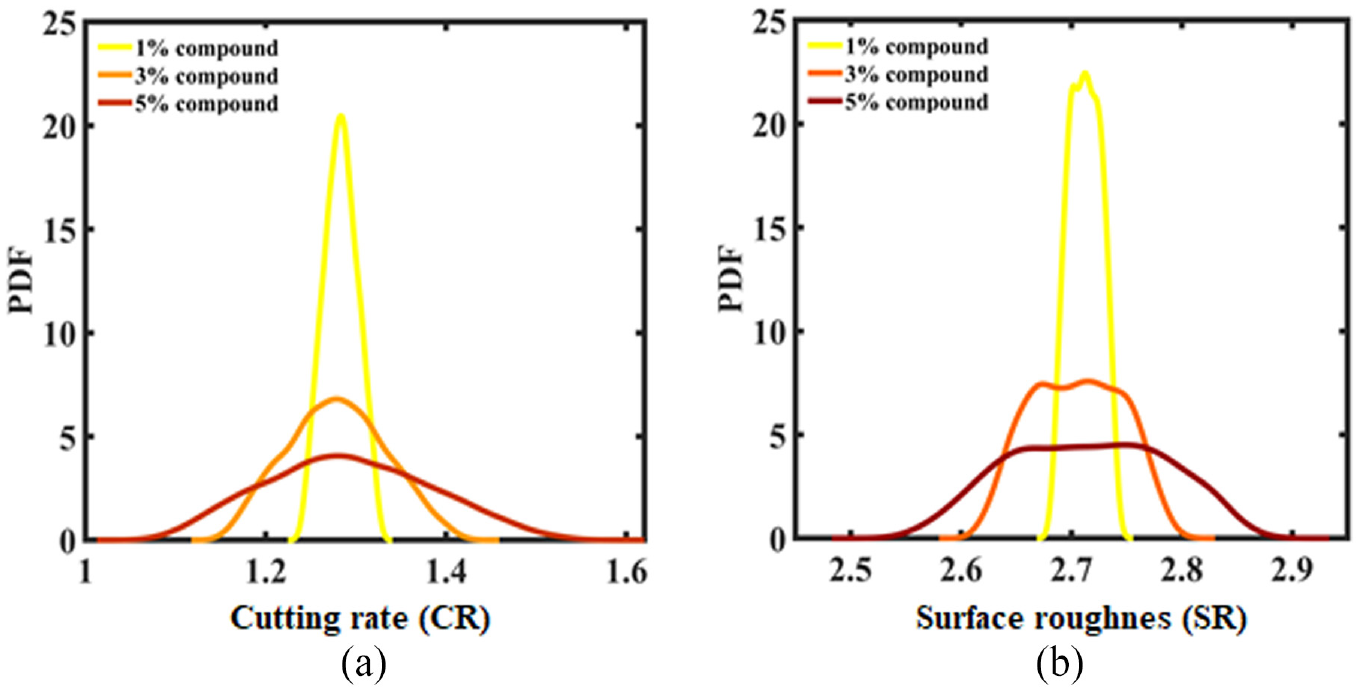
GPR based predictions of (a) CR and (b) SR, corresponding to the 1%, 3%, and 5% stochastic variation in the mean values of process control parameters. Here compound means stochasticity is applied to all the considered process parameters.
Probabilistic WEDM responses
To capture the relative significance of individual process variables on the quantities of interest (QoI), the data driven sensitivity analysis is conducted. In this regard, the individual process parameters are subjected to stochastic variation of 5% at a time and the rest of the parameters are kept at their mean values. With such a setting, the MCS based huge datasets with 10,000 individual samples are constructed. The GPR based ML model is then employed to forecast the responses for the constructed sample space.
It is worth mentioning that the responses predicted from the ML model are found to be consistent without any reproducibility errors. When the same sample points were predicted multiple times the responses remained constant. Figure 7 reveals the whole probabilistic characterization of the process responses (CR and SR). Figure 7(a) and (c) reveals the relative significance of individual parameters on the cutting rate and surface roughness, respectively. It can be noticed that pulse on time (Ton), pulse off time (Toff), and peak current (IP) are the most significant parameters in terms of cutting rate, while pulse on time (Ton), peak current (IP), and servo voltage (SV) are the most influencing parameters for surface roughness. Considering the significant process parameters, the effect of individual and compound parametric stochastic variation (5%) on the CR and SR is then depicted in Figure 7(b) and (d), respectively.
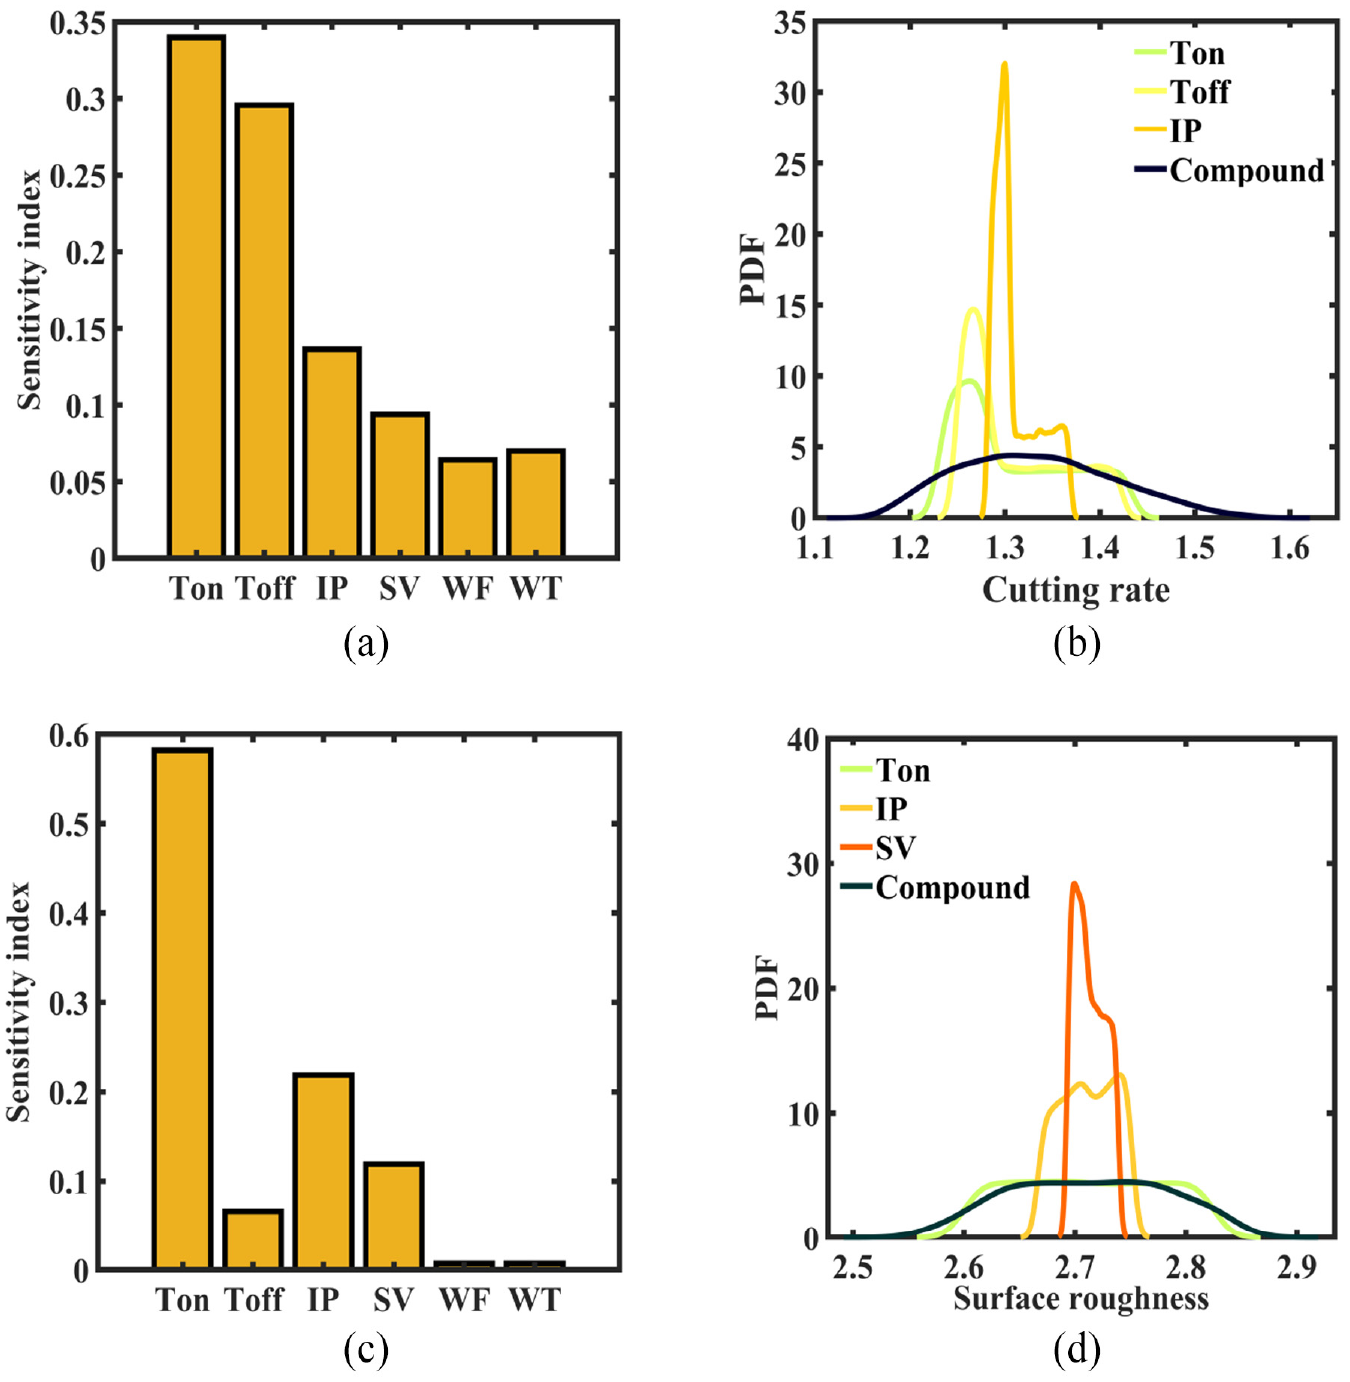
GPR based probabilistic characterization of response quantities (predictions made for unknown huge sample space derived from Monte Carlo sampling): (a) data-driven sensitivity analysis corresponding to the cutting rate, (b) Pdf plots of cutting rate corresponding to individual and combined parametric variation, (c) data-driven sensitivity analysis corresponding to the cutting rate, and (d) Pdf plots of surface roughness corresponding to individual and combined parametric variation.
The process parameters of WEDM are usually level based, hence it becomes essential to characterize the effect of level based uncertainty on the process responses. In this regard, with the understanding of relative significance on the cutting rate and surface roughness (reported in the preceding paragraph), the level 2, level 3, and level 4 (refer to Table 1) of the significant process parameters corresponding to the response characteristics are subjected with ±5% stochasticity. The probabilistic insight on the effect of level based uncertainty on the cutting rate and surface roughness is furnished as the Pdf plots in Figure 7. With the perturbation of ±5% stochasticity in the levels of individual most significant parameters, the MCS based sample space (10,000 samples) is constructed for each case. The prediction of response quantities corresponding to the MCS based samples is carried out using GPR based ML model.
Figure 8 reveals that the cutting rate shoots up with the increase in Ton and IP as the probabilistic description shifts toward its higher value with subsequent levels of Ton and IP (refer to Figure 8(a) and (c)). Whereas, the probabilistic description of cutting rate diminishes with an increase in the subsequent levels of Toff (refer to Figure 8(b)). The trend of variation in cutting rate with the variation in Ton, Toff, and IP is found to be in agreement with the available deterministic results. 38 Enhancement in the cutting rate due to the increase in pulse on time (Ton) is the consequence of large thermal energy cascading from the spark gap due to the extension of pulse on time. It is observed from Figure 8(a) that the variation bound in cutting rate with respect to the randomness of Ton at level 2 is relatively less than the variation bounds corresponding to the randomness in succeeding levels, indicating that the impact of uncertainty of Ton at level 3 and level 4 is more pronounced when compared with the Ton at level 2. The reduction in the cutting rate on increasing the Toff is due to the decline in the pulse frequency and easy removal of the large quantity of heat from the spark gap by the dielectric fluid thereby directing toward less transmission of heat to the work material. Moreover, it is evident from Figure 8(b) that the random fluctuations exhibited by the cutting rate are more severe due to the uncertainty of Toff at level 2 and level 3. The uncertainty in Toff at level 4 has a relatively lesser impact on the cutting rate as witnessed from the minimum variance of the Pdf plot. There is an enhancement in the cutting rate as the peak current increases as stated above. An increment in the peak current induces a high energized spark thereby commencing abrupt melting and vaporization of the work material which thus resulted in a high cutting rate. It can be noticed in Figure 8(c) that the variance of the Pdf plot at level 4 is minimum than the variance of the Pdf plots for the preceding levels. Thus, the impact of uncertainty in IP at level 2 and level 3 on cutting rate is more than the impact of uncertainty in IP at level 4. Figure 8 also reveals that surface roughness increases with the increase in Ton and IP as the Pdf plots representing its probabilistic description shifts toward the higher value with subsequent levels of Ton and IP (refer to Figure 8(d) and (e)). While surface roughness diminishes with an increase in the SV as the Pdf plots shift toward lower SR with subsequent SV levels (refer to Figure 8(f)). The trend of variation of SR with the variation in Ton, IP, and SV is found to be in agreement with the available deterministic results. 39
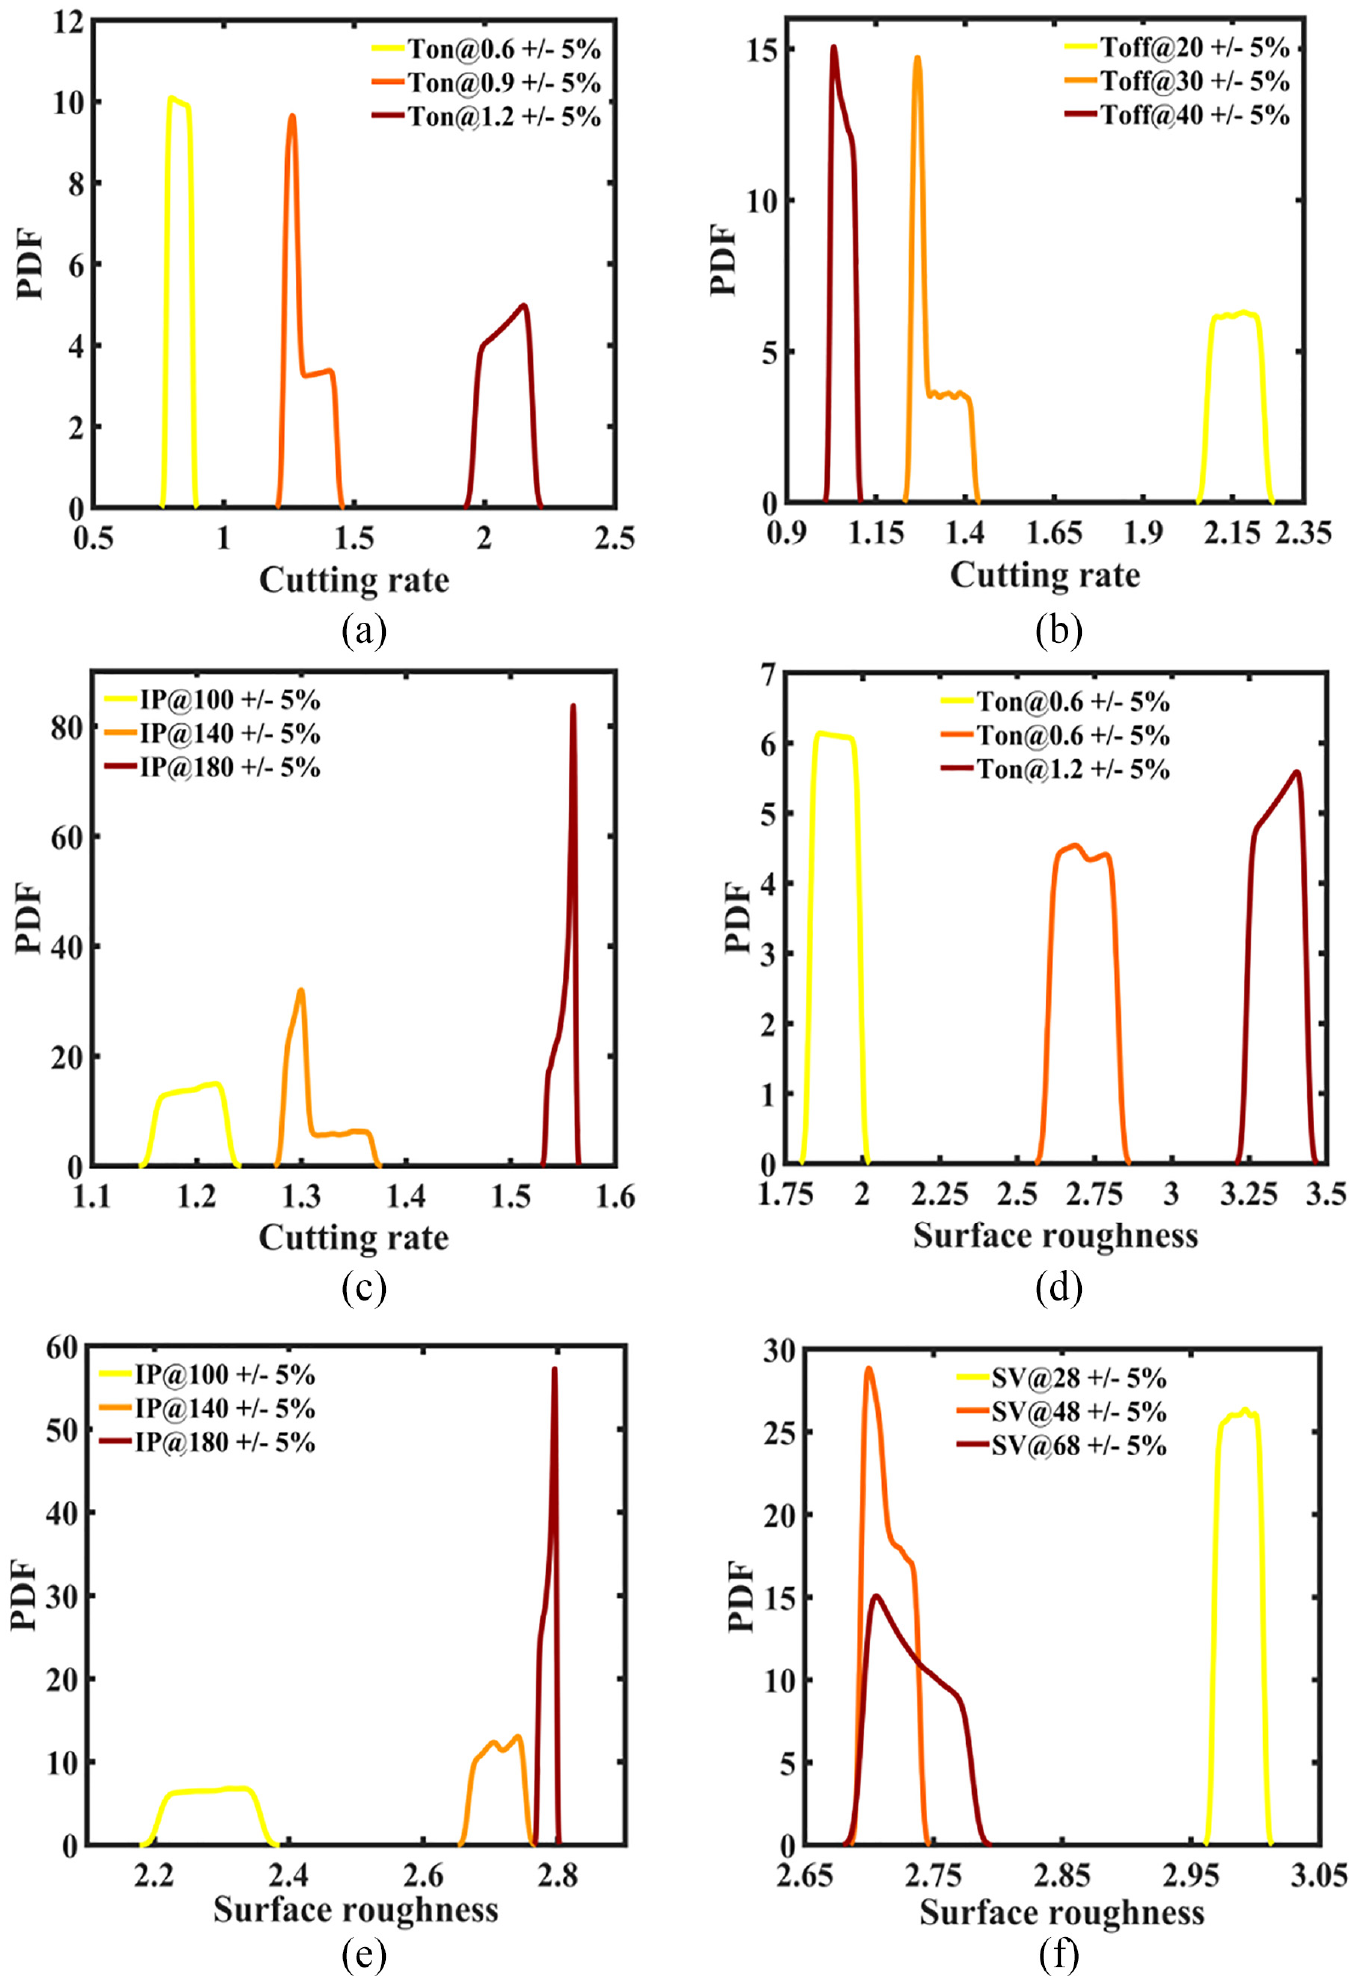
Effect of level based uncertainty on the WEDM response quantities: (a) pulse on time-dependent cutting rate, (b) pulse off time-dependent cutting rate, (c) peak current dependent cutting rate, (d) pulse on time-dependent surface roughness, (e) peak current dependent surface roughness, and (f) servo voltage-dependent surface roughness.
The substantial rise of surface roughness on increasing the Ton is due to the transfer of large accumulated heat in the spark gap to the work material thereby forming deep and wide craters. Besides, the variance of the Pdf plots of surface roughness due to the stochasticity in Ton at level 3 and level 4 is almost equal but relatively larger than the variance of the Pdf plot of surface roughness manifested due to the stochasticity in Ton at level 2. This indicates that the effect of level-based uncertainty in Ton on surface roughness is more notable for the level 3 and level 4. The increase in the surface roughness corresponding to the increase in IP is attributed to the impact of high energized spark on the work material which commences large scale melting and vaporization of the work material thereby forming craters of large dimensions. Besides, it is noticed from Figure 8(e) that the variance of the Pdf plots for surface roughness diminishes with the subsequent increase in the levels of IP. It implies that the effect of level-based uncertainty for level 2 of IP is more prominent in comparison with level 3 and level 4 of IP. Hence as the peak current increases, the effect of uncertainty on the surface roughness diminishes. The reduction of surface roughness corresponding to the increase in servo voltage (SV) is mainly because of the widening of spark gap length leading toward less intense spark thereby preventing the formation of unevenly sized craters. Furthermore, it is also noticed from Figure 8(f) that the variance of the Pdf plot of surface roughness on account of stochasticity in SV at level 3 is the maximum.
Conclusions
The novelty of the present article is to create an efficient machine learning-driven approach to capture the probabilistic behavior of two salient WEDM responses namely cutting rate and surface roughness in the light of inevitable parametric uncertainties. To carry out the aforesaid investigation, a dataset of 52 samples reported by Agarwal et al. 35 is employed. We induced the Gaussian white noise in the reported results to introduce the natural reproducibility errors while training the ML models. In the next step four different ML models namely, LR, RT, SVM, and GPR are trained and tested. To eliminate the model over-fitting and for successful validation, a five-fold cross-validation scheme is adopted. The prediction capability of the models is compared on the basis of statistical indices such as the coefficient of determination (R2 values) and the root mean squared error (RMSE). It is noticed that the Gaussian process regression-based ML model is found to be the most efficient model in predicting the responses.
To carry out the probabilistic investigation, the traditional Monte Carlo Sampling approach is employed for creating the 10,000 samples (domain of the sample space is within the maximum and minimum bounds of the process parameters). Then the GPR based ML model is further exploited to forecast the cutting rate and the surface roughness corresponding to these unknown 10,000 samples. With the simulated estimates, data-driven sensitivity analysis is performed. As a result, it was observed that Ton, Toff, and IP are the most sensitive parameters to affect the cutting rate while for surface roughness, Ton, IP, and SV are the most sensitive parameters. Furthermore, the stochastic bounds of the cutting rate and surface roughness due to the compound effect of parametric uncertainty (percentage of parametric uncertainty considered is 1%, 3%, and 5%) are exhibited and it is noticed that cutting rate and surface roughness are normally distributed. Lastly, the effect of level-based uncertainty in the most significant process parameters on the process performance features (CR and SR) is analyzed. The findings of the present study would improve and add new perspectives in the WEDM process optimization. The proposed probabilistic framework based on ML approaches could be extended further to other manufacturing processes for large scale computational characterization of their performance features.
Footnotes
Appendix
Acknowledgements
SS and KKG are grateful for the financial support from MoE, India during the research work.
Declaration of conflicting interests
The author(s) declared no potential conflicts of interest with respect to the research, authorship, and/or publication of this article.
Funding
The author(s) received no financial support for the research, authorship, and/or publication of this article.