
Abstract
In the present study, the bake hardening (BH 240) steel sheet’s formability behavior is studied experimentally based on the Nakajima test method. A forming limit diagram is successfully constructed using universal sheet metal forming machine by offline measuring the strains of deformed specimens. In-process strain measurement based on a digital image correlation technique is also performed for a few selected samples to compare the results with manual strain measurement techniques. All the deformed specimens are also characterized to correlate the sample geometries with hardness values and microstructure. It is observed that the hardness value gradually decreases with an increase in sample width for all the deformed specimens up to the width of 150 mm, except for full-width sample of 200 mm. Microstructural analysis reveals that the morphology of ferrite grains changes with the sample geometry in all the deformed specimens. Microstructural characterization at the top surface of the specimen demonstrates that the aspect ratio of grains is maximum for a 25 mm width sample due to uni-axial stretching. It is also noted that grain’s aspect ratio is close to one (minimum) for a 200 mm width sample due to almost equi-biaxial elongation in grains. It is also observed that the aspect ratio of grains obtained from specimen cross-section indicates that the ratio increases gradually from 25 to 200 mm width samples.
Introduction
In recent years, one of the major emphases of automobile industries is to use thinner gauge steel sheets to improve environmental performance by reducing fuel consumption and greenhouse gas emissions without compromising passenger safety.1–3 The use of thinner gauge steel sheets necessitates a favorable combination of desired properties, including high tensile strength and ductility, good surface finish, dent resistance, and good formability. 4 However, these requirements are often contradictory as it is difficult to achieve high strength without compromising formability. Therefore, an application of high strength steel sheet in automotive components requires a proper understanding of the strength-formability trade-off.4,5
The bake hardening (BH) steel sheet is popular for automobile applications, particularly in the outer body panels. It offers a superior balance between strength and formability than the other steel grades of similar composition and strength level. 4 The BH steel exhibits good formability before bake hardening treatment due to its low yield strength and high ductility. In BH steels, the strain aging phenomenon improves the dent-resistant in press-formed automobile body parts by increasing the yield strength (YS) of formed components.4,6,7 It is reported that the strain aging phenomenon during paint baking of fabricated outer body parts in the temperature range of 150oC–200oC increases the YS value due to the segregation of soluble interstitial carbon atoms in press forming operation and formation of Cottrell atmospheres.4,8 Many researchers also highlighted the formation of carbide precipitates in the saturated denser atmosphere created by interstitial-dislocation interaction during the last stage of strain aging.4,8,9 However, the formation of precipitates during paint baking in steel with reduced carbon is debatable. It is reported that aging response is more pronounced in ultra-low carbon steels containing soluble carbon in the range of 10–15 ppm in comparison to low carbon grade steels. 7 Several researchers have studied extensively the influence of various metallurgical factors including steel chemistry (particularly solute carbon content), ferrite grain size, pre-strain level, and the aging temperature on strain aging behavior of BH steels.4,9–13 It is generally accepted that a decrease in ferrite grain size increases the bake hardening response. 14 Few studies also reported that ferrite grain size has no influence on the bake hardening mechanism.4,7,15 That is due to the effect of grain size on the bake hardening response is not fully understood. It is noted that bake hardening behavior depends on the amount of dissolved carbon present both at the grain boundaries as well as within the ferrite grains. It is also realized that increase in grain boundary area effectively promote more solute carbons at the grain boundaries, which results in a higher bake hardening response. 7
Although numerous studies were carried out to elucidate BH steels’ strain aging mechanisms, studies about the BH steel sheets’ formability are scarce in the open literature. The formability of sheet metals is generally evaluated using a forming limit curve (FLC), representing maximum values of major and minor strains at localized necking of sheet for various linear strain conditions.15–17 A boundary is established between different strain states that facilitate sheet forming and lead the sheets into failure.18–20 Narayanasamy et al.21,22 experimentally investigated the formability of bake hardening and extra galvannealed interstitial free (IF) steel sheets. They concluded that extra galvannealed IF steel exhibited superior formability than that of BH steel due to the presence of necklace grains in BH steel, which deteriorated the formability.21,22 Hariharan et al. 1 proposed a methodology to estimate the forming limit diagram of BH steel based on geometric interpolation of the orientation-specific limit strains between the uniaxial, plane strain, and biaxial strain paths. Manikandan et al. 3 experimentally investigated the formability of different high-strength automotive steel sheets and reported the better formability of BH 180 steel than BH 220 steel. The authors reported that an increase in the strength of steel generally reduced its formability. Most of the previous formability studies of steel sheet mainly focused on the experimental determination of FLC by stretching the gridded specimens using a hemispherical or flat-bottom punch. The experimentally measured values were also compared with analytically and numerically computed FLCs.22–26 Several research works have also been carried out to understand the complex interactions between many formability parameters by correlating the bulk mechanical properties, strain rates and deformation temperature of sheet metal during actual press-forming operation.1,21,23–25
The requirement of today’s automobile industries is to realize the complex forming of automotive sheet for application in intricate parts, which demand superior sheet metal forming properties. Therefore, the present investigation focuses on experimental determination of the forming limit diagram of baked hardening steel sheets for the successful production of required press forming parts. To achieve a complete description of FLC, specimens with varying widths are used for obtaining different strain conditions starting from uniaxial to biaxial strain with an inclusion of plane strain condition. Further, experimentally determined FLC is compared with reported literature which exhibits a similar experimental study of BH steel grades.1,3 In addition to that, FLC of BH steel is predicted using Keeler and Brazier 27 and Paul 28 models with a purpose to gain better insight into the forming characteristic. An attempt is also made to correlate the specimens’ forming behavior with microstructure and mechanical properties by characterizing the specimens of varying width.
Experimental procedure
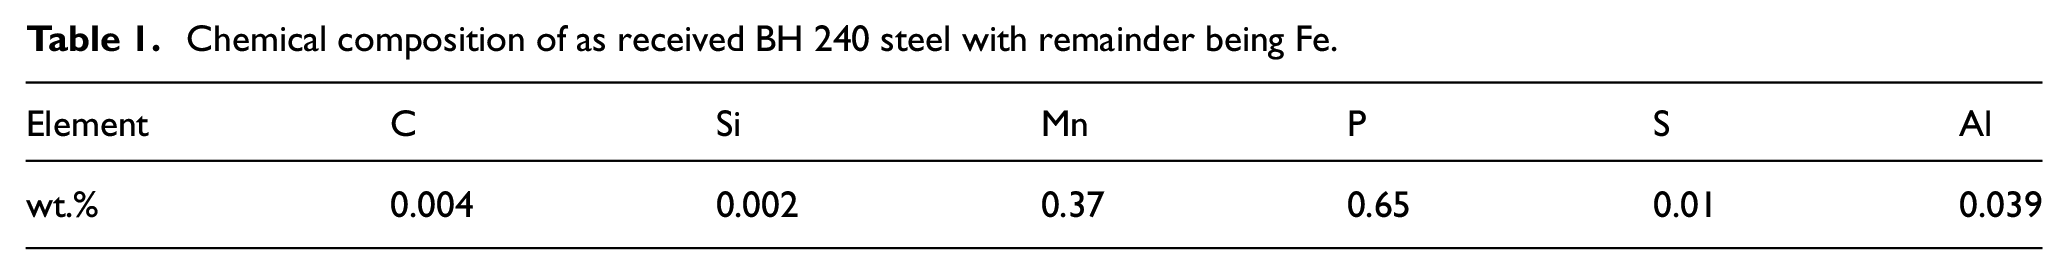
An as-received flat 0.63 mm thick bake hardening (BH 240) grade steel sheet obtained from an integrated steel plant was used for the formability study. The chemical composition of the as-received steel sheet ascertained by optical emission spectroscopy (OES) is shown in Table 1. In the present investigation, the forming limit curve (FLC) of the BH steel sheet was estimated by Nakajima test as per ISO 12004-2 standard. 29 Figure 1 shows the schematic representation of the experimental setup used in the present study. The test was carried out using an Instrumented Universal Sheet Metal Testing Machine (Model: 142-40, Make: Erichsen) at a punch velocity of 60 mm/min and a blank holding force of 75 kN. In the present study, a 100 mm diameter drawing punch was used for local deformation on test specimens’ surface. Five different dog-bone shaped specimens with varying blank widths of 25, 50, 75, 150, and 200 mm, as mentioned in ISO 12004-2, were prepared in order to attain uni-axial to bi-axial strain conditions for achieving a complete description of FLC of BH 240 steel sheet. 29 Sufficient care was taken to ensure that fracture was never initiated from the edges of the test pieces during the sectioning of test specimens by an electrical discharge machining (EDM). 29 Further, square grids of dimension 1.5 × 1.5 mm2 were inscribed on the specimen surface by electro-chemical etching after preparing required samples of varying shapes. A suitable lubricant and teflon blank of approximately the same size of drawing punch diameter were used before starting each test for minimizing the friction between punch and the test specimens. Major and minor local strain distributions in both directions were determined by measuring grid dimensions of deformed specimens at the end of each test. Figure 2 shows the test specimens with different geometries before and after the completion of tests.
Chemical composition of as received BH 240 steel with remainder being Fe.
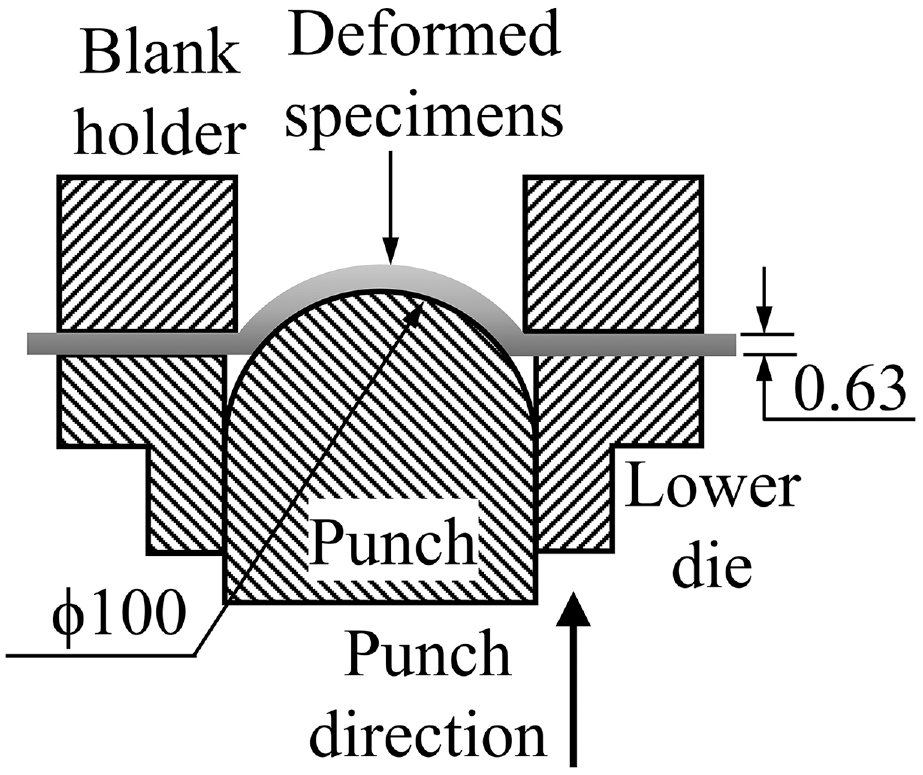
Schematic diagram of an experimental setup.
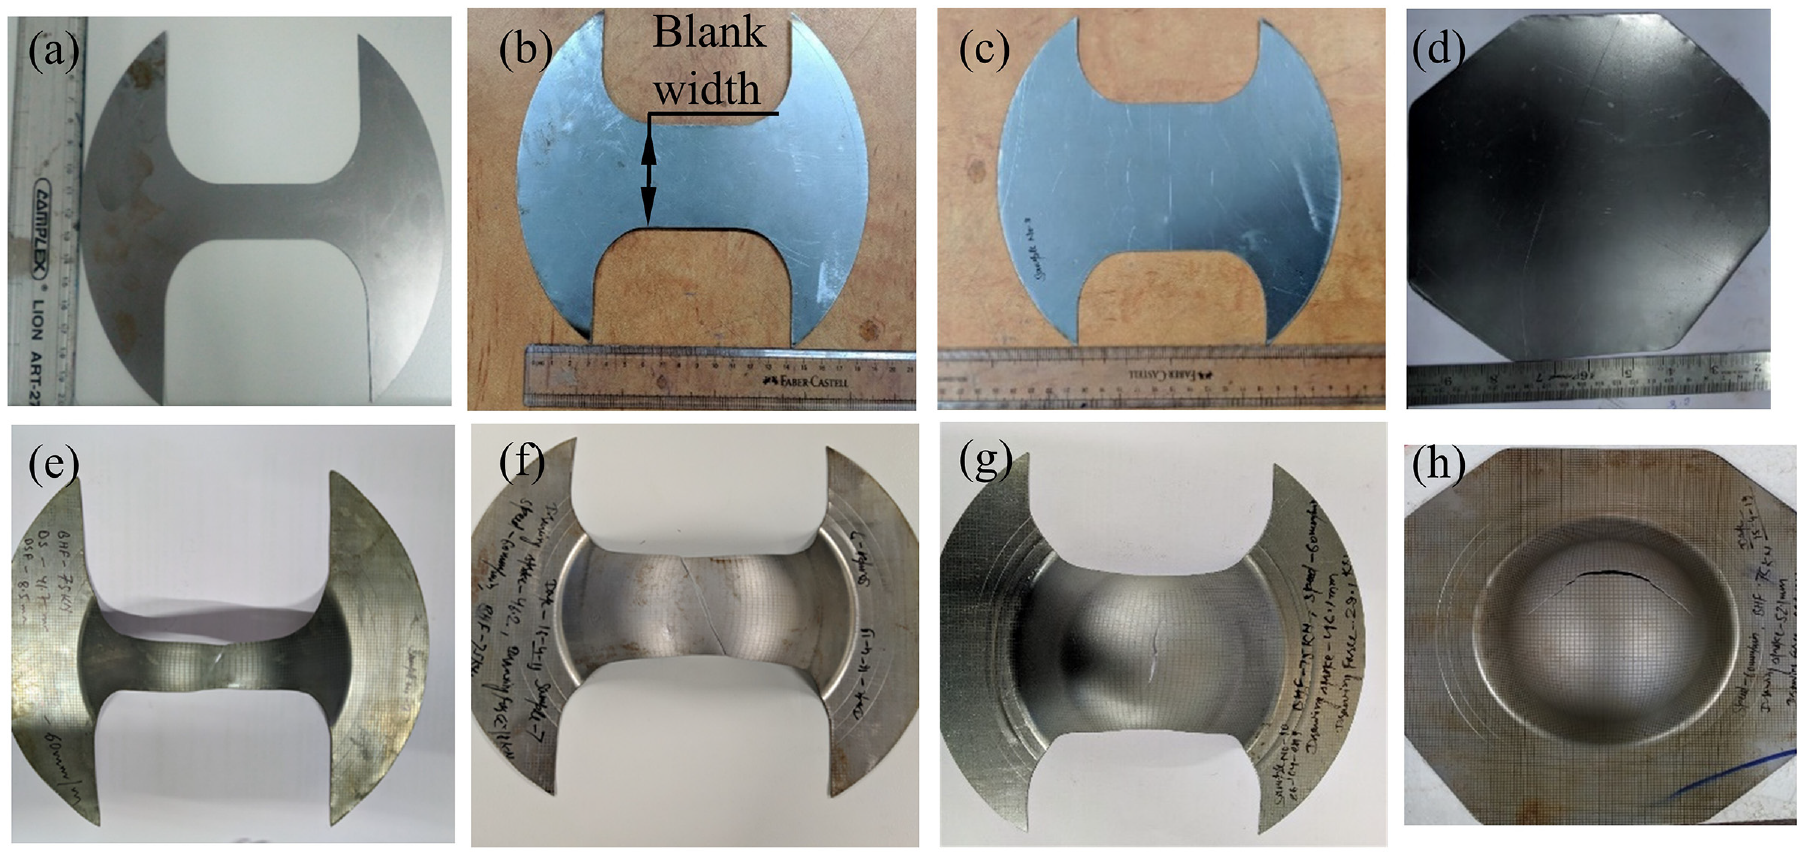
Pictures of as-received and deformed samples with varying blank width of (a and e) 25 mm, (b and f) 50 mm, (c and g) 75 mm, and (d and h) 200 mm.
Micro-hardness values were obtained from the top surface and cross-section of both the as-received and deformed specimens using Vicker’s Micro-hardness tester (Model: NVH-AUTO, Make: OMNI-TECH) with load and dwell time of 100 gm and 10 s, respectively. Reported hardness values are the average of 10 readings obtained from different locations of each specimen. A schematic representation of a relevant portion of deformed specimen to exhibit the hardness measurement points along crack propagation direction is shown in the Figure 3. The hardness readings were obtained from the top surface at a distance of ∼0.5 mm away from the crack edge and along the center line of the polished cross-section of the deformed specimens. The room temperature tensile testing of the as-received specimen was performed as per ASTM E8M standard in a 100 kN capacity servo-hydraulic controlled INSTRON® 8501 universal tensile testing machine at a constant strain rate of ∼0.001 s−1. 30 An average of three identical tests was considered to represent the estimated tensile properties. Microstructural characterization of all the specimens, as-received and deformed, was carried out using an optical microscope. All the specimens, as per standard metallographic technique, were properly sectioned, mounted in bakelite powder, polished and etched with 4% nital solution before microstructural observation. The samples were examined under an optical microscope both from the top surface and cross-section of the sheet.
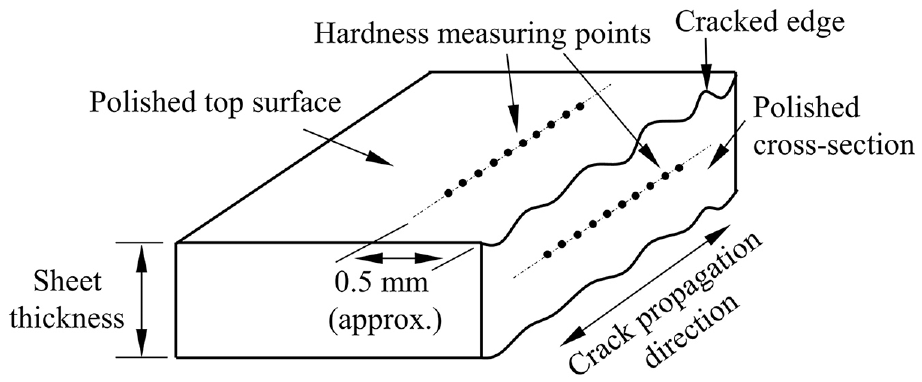
Hardness measuring location of deformed specimens.
Experimental results
Tensile property of as-received specimen
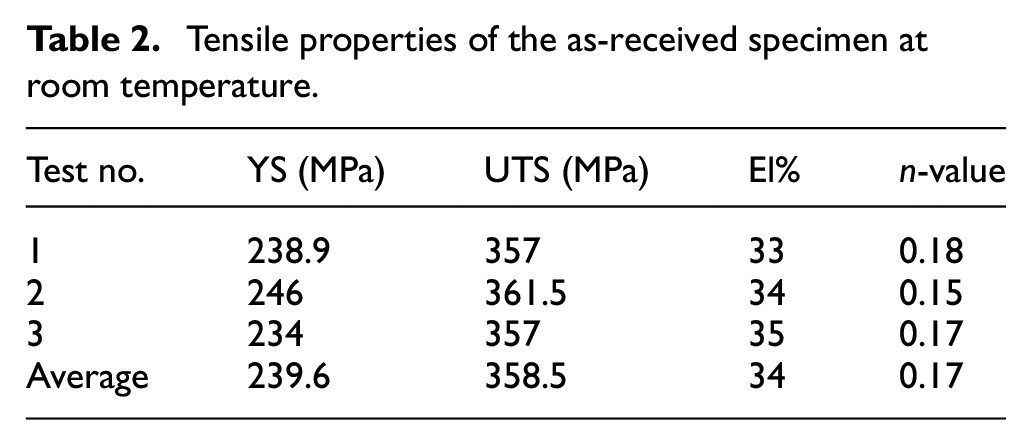
Figure 4 shows the engineering stress-strain behavior of the as-received BH 240 steel sheet at room temperature with a strain rate of 0.001 s−1. The figure demonstrates satisfactory reproducibility of all the three tests carried out under identical conditions. An average of three tests was considered for the estimation of tensile properties, such as yield strength (YS), ultimate tensile strength (UTS), total elongation (El%), and strain hardening exponent (n-value). The figure reveals that the total elongation of the samples during the tensile test is in the range of 33% to 35%. The strain hardening exponent is estimated based on the slope obtained by log-log plot of true stress versus true strain from yield point to UTS. An average value of the slopes for all three tests are considered to represent the n-value. The measured tensile properties of the as-received specimens at room temperature are shown in Table 2.
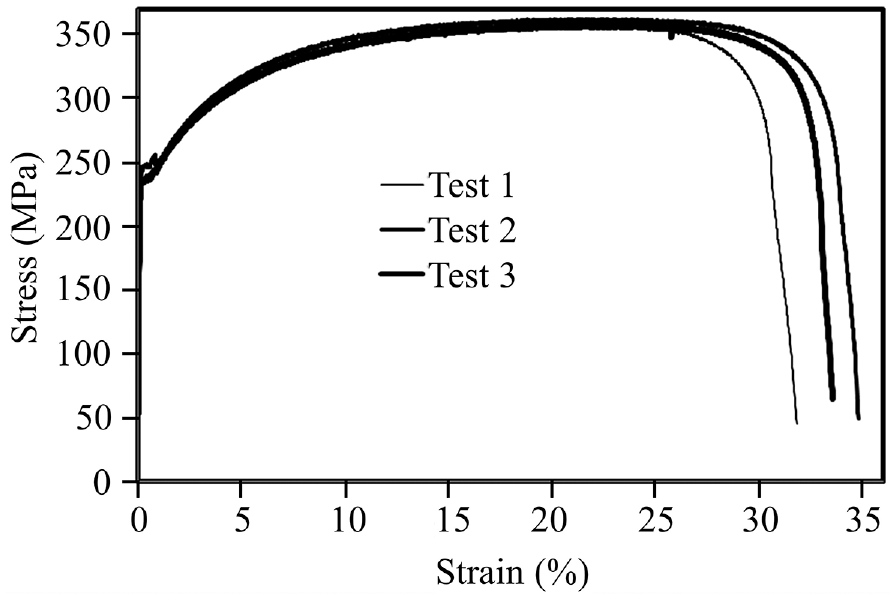
Tensile behavior of the as-received steel sheet at room temperature.
Tensile properties of the as-received specimen at room temperature.
Formability study
To successfully construct the FLC for BH 240 grade steel, the major (ε1) and minor (ε2) forming limit strains were estimated by manually measuring the local major and minor strains at different grid points of deformed specimens on each side of the fracture line. The grids were considered along the longitudinal direction (i.e. parallel to the shaft of blank) with a total grid length of at least 20 mm. 29 Five rows of grid points were measured with 20 points were available in each row. An average of the calculated major and minor forming limit strains of five rows is presented here. The following standard procedure was undertaken to estimate the accumulation of localized necking strain near the specimen’s crack location. (i) A parabola [f(x) = kx2 + lx + m] was fitted employing available local strain values at the grid point from both sides of the crack. The vertex of the curve indicates the location of crack initiation, (ii) Second derivatives of major and minor strains that is, [f″(x) = 2k] were determined at both sides of the crack to estimate the inner boundaries required for subsequent analysis, (iii) The outer boundaries (w) were calculated as per the procedure mentioned in ISO 12004-2 standard, (iv) The strain data within the outer boundaries were further used to fit an inverse parabola [f1(x) = 1/(kx2 + lx + m)], (v) vertex of the inverse parabola curve indicates major (ε1) forming limit strain. Figures 5(a) and (b) show local major and minor strains as a function of grid distance for one of the test samples with a blank dimension of 25 mm. The figure illustrates the presence of a certain degree of scattering in the distribution of strains that can be attributed to experimental measurement error. The estimated major (ε1) and minor (ε2) forming limit strains for the 25 mm width sample at the crack location are 41.04% and −25.60%, respectively. The procedure mentioned above was followed to estimate the major (ε1) and minor (ε2) forming limit strains for all deformed specimens with varying geometry.
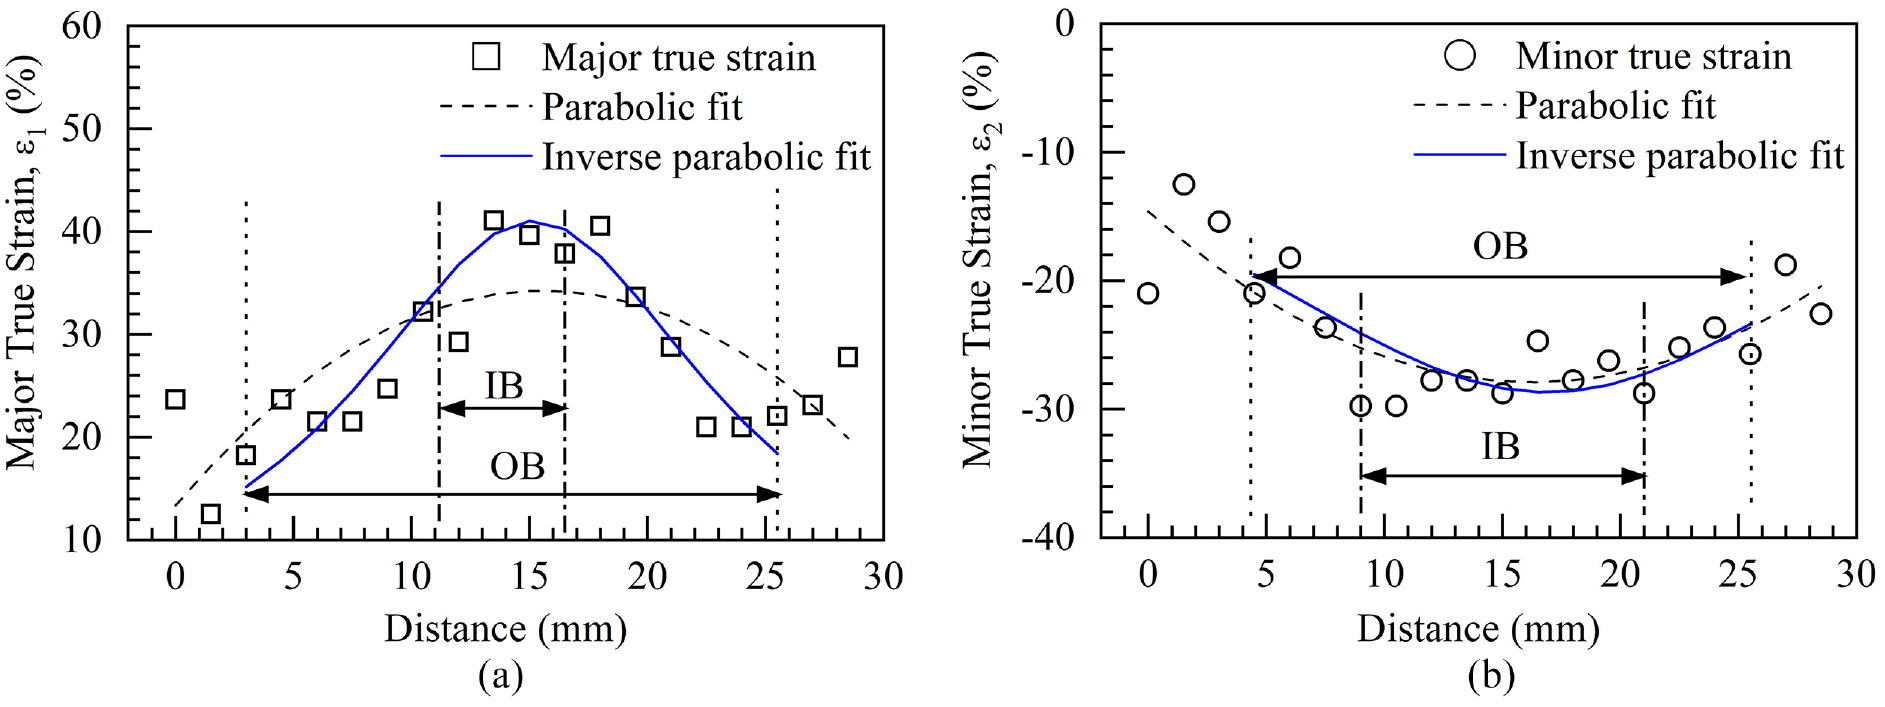
Local (a) major and (b) minor strains as a function of grid distance for the test sample with a blank dimension of 25 mm. OB and IB indicate outer and inner boundaries, respectively.
Figure 6 shows the complete forming limit curve (FLC) of BH 240 steel obtained by calculating major and minor forming limit strains in deformed samples of five different geometries. The true major and corresponding true minor strains in Figure 6(a) for sample blank widths of 25, 50, and 75 mm are 40.45% (±1.36) and −27.37% (±1.12), 37.71% (±3.66) and −25.26% (±1.17), and 34.06% (±1.98) and −19.29% (±1.07), respectively. The negative minor strain implies the condition of uniaxial stretching, where specimens elongate in the major strain direction and contract in the minor strain direction with decrease in specimen width. It is interesting to note that the minor strain value moves toward near-zero with increasing specimen width of 150 mm. The major and minor strains for the specimen blank width of 150 mm are 16.92% (±1.63) and 0.07% (±1.35), respectively, indicating stretching under plane strain condition. It is also observed that the major strain decreases with an increase in test specimen blank width and reaches minimum value under plane strain condition. This is mainly due to comparatively less elongation in the longitudinal direction and around zero contraction in the sample’s transverse direction. The critical value of major strain obtained at the lowest point in FLC near the plane strain condition is the plane strain forming limit (FLC0). The values of major and minor strains are further increasing up to 39.51% (±1.27) and 25.15% (±0.84), respectively, for the full-width specimen of diameter 200 mm. Under this condition, the deformed sample is likely to stretch both in major and minor strain directions prevailing biaxial stretching.
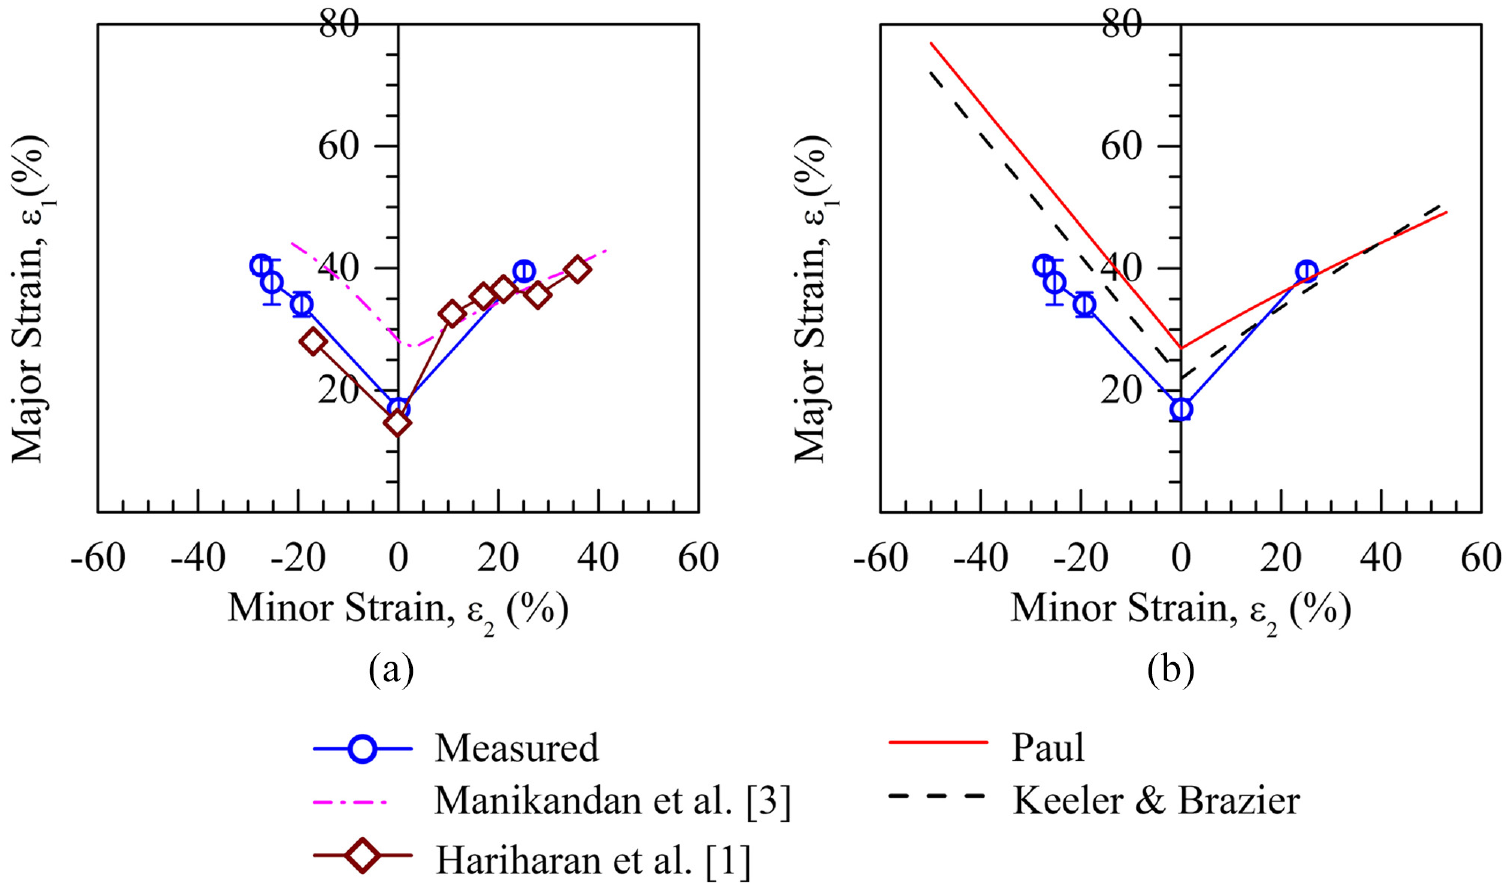
In the same figure, the forming limit curves of BH steel reported by Manikandan et al. 3 and Hariharan et al. 1 are also included for comparison purpose. Manikandan et al. 3 showed the FLC of BH 220 grade steel. The reported major and minor strains of BH 220 steel in uniaxial stretching, plane strain stretching and biaxial stretching are 44.04% and −21.20%, 27.94% and 0.21% and 43.57% and 43.56%, respectively. A comparison between the result of Manikandan et al. 3 and the present study indicates that the reported FLC in Manikandan et al. 3 is higher than the present study. The comparatively better formability of BH 220 steel reported in Manikandan et al. 3 may be attributed to the variation in many parameters including higher strength of BH 240 grade steel as compare to BH 220 grade steel and difference in thickness of steel sheets. Further, FLC of Hariharan et al. 1 shows the magnitude of major and minor strains are, respectively, 28.02% and −16.98% in uniaxial stretching, 14.66% and −0.19% in plain strain stretching and 39.91% and 35.81% in biaxial stretching. A comparison between FLC obtained in the present study and reported in Hariharan et al. 1 corroborates well with a negligible difference indicates essentially equivalent tensile properties of both the studied and literature reported specimens.
The theoretically estimated forming limit curves of BH 240 grade steel employing the empirical relationship of Keeler and Brazier 27 and Paul 28 are included in Figure 6(b). An empirical relationship used by Keeler and Brazier 27 to calculate plane strain forming limit (FLC0) is shown in equation (1) as
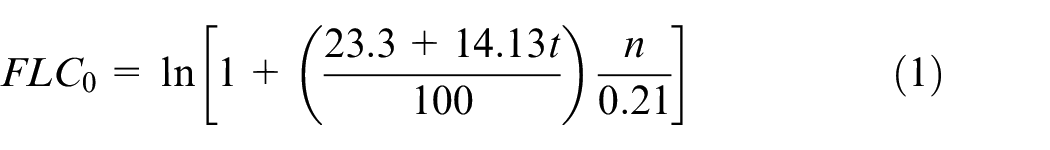
The above equation is valid for work hardening exponent (n) and sheet thicknesses (t) less than or equal to 0.21 and 3.1 mm, respectively. 27 The left and right sides of the forming limit curves were calculated based on equations (2) and (3), respectively, as


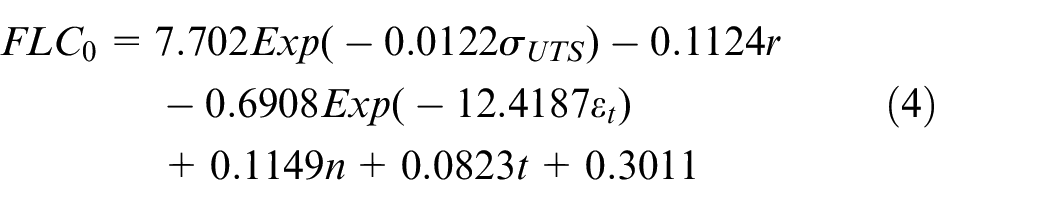
Paul 28 carried out a nonlinear regression analysis to calculate FLC0 by correlating the sheet metal tensile properties. It is observed that the FLC0 value for the steel sheet is strongly correlated with tensile properties, including ultimate tensile strength (UTS), total elongation (εt), strain hardening exponent (n), coefficient of normal anisotropy (r), and sheet thickness (t) 24 as
Paul used equation (2) to calculate the left side of the FLC. The right side of the FLC was estimated based on equations (5) as

where, the material constant (p) was calculated as follows

The above mentioned equations were utilized for theoretical prediction of FLCs, based on both Keeler and Brazier 27 and Paul 28 models, using the r-value of 1.6 28 and material tensile properties as shown in Table 2. Forming limit curves, shown in Figure 6(b), clearly demonstrate that theoretically predicted strain values are on a slightly higher side than experimentally determined values, particularly on the negative side of the curve under the condition of uniaxial stretching. This difference in theoretically estimated values with experimental data is attributed to the limitations of empirical models as well as a certain level of error involved in manual strain measurements.
Further analysis of in-process strain measurements was also performed using the digital image correlation (DIC) technique for sample width of 50 (uni-axial stretching) and 200 mm (biaxial stretching) to compare manually measured and in-process calculated strain paths. AutoGrid® in-process strain measurement software was employed to carry out the analysis of strain path assessment in the deformed specimens. Figure 7 shows the pictorial view of the deformed samples of widths 50 and 200 mm. In the case of specimen geometry having 50 mm width, the appearance of a crack is observed close to the longitudinal strip specimen’s central location, which is almost above the punch tip. However, the full-width specimen shows the crack’s position a little away from the specimen’s central location (punch tip). The appearance of crack little away from the specimen’s central location is mainly associated with difficulty in obtaining exact symmetrical loading primarily due to the presence of friction component and pre-existing local defects/impurities in the steel matrix. 25 Figure 7(a) reveals that the square grids for a specimen width of 50 mm are stretched mainly in the major strain direction after the deformation. In the case of 200 mm full-width specimen, the grid aspect ratio is close to one even after deformation attributed to the biaxial stretching of specimens, as shown in Figure 7(b). Figures 7(c) and (d) depict the color contour maps of sheet thickness reduction across the specimen geometry obtained just before the crack’s appearance for different sample widths of 50 and 200 mm, respectively. It is observed that overall thickness reduction just before appearing the crack is about 30% and 53% for 50 and 200 mm width specimens, respectively. Color contour map of 50 mm width specimen, Figure 7(c), clearly demonstrates three different zones consisting of the safe zone with thickness reduction up to about 21% (green contour), necking zone with thickness reduction in the range of 21%–26% (yellow contour) and finally the failure zone where maximum thickness reduction just before appearing the crack is around 30%. Similarly, a color contour map of full-width specimen demonstrates a safe zone with thickness reduction up to about 45% (green contour), necking zone with thickness reduction in the range of 45%–50% (yellow contour), and finally the failure zone with a maximum thickness reduction of around 53% (Figure 7(d)). It can be concluded from the analysis that the thickness reduction before the failure of the specimen is higher in biaxial stretching (200 mm width sample) than in uniaxial stretching (50 mm width specimen).
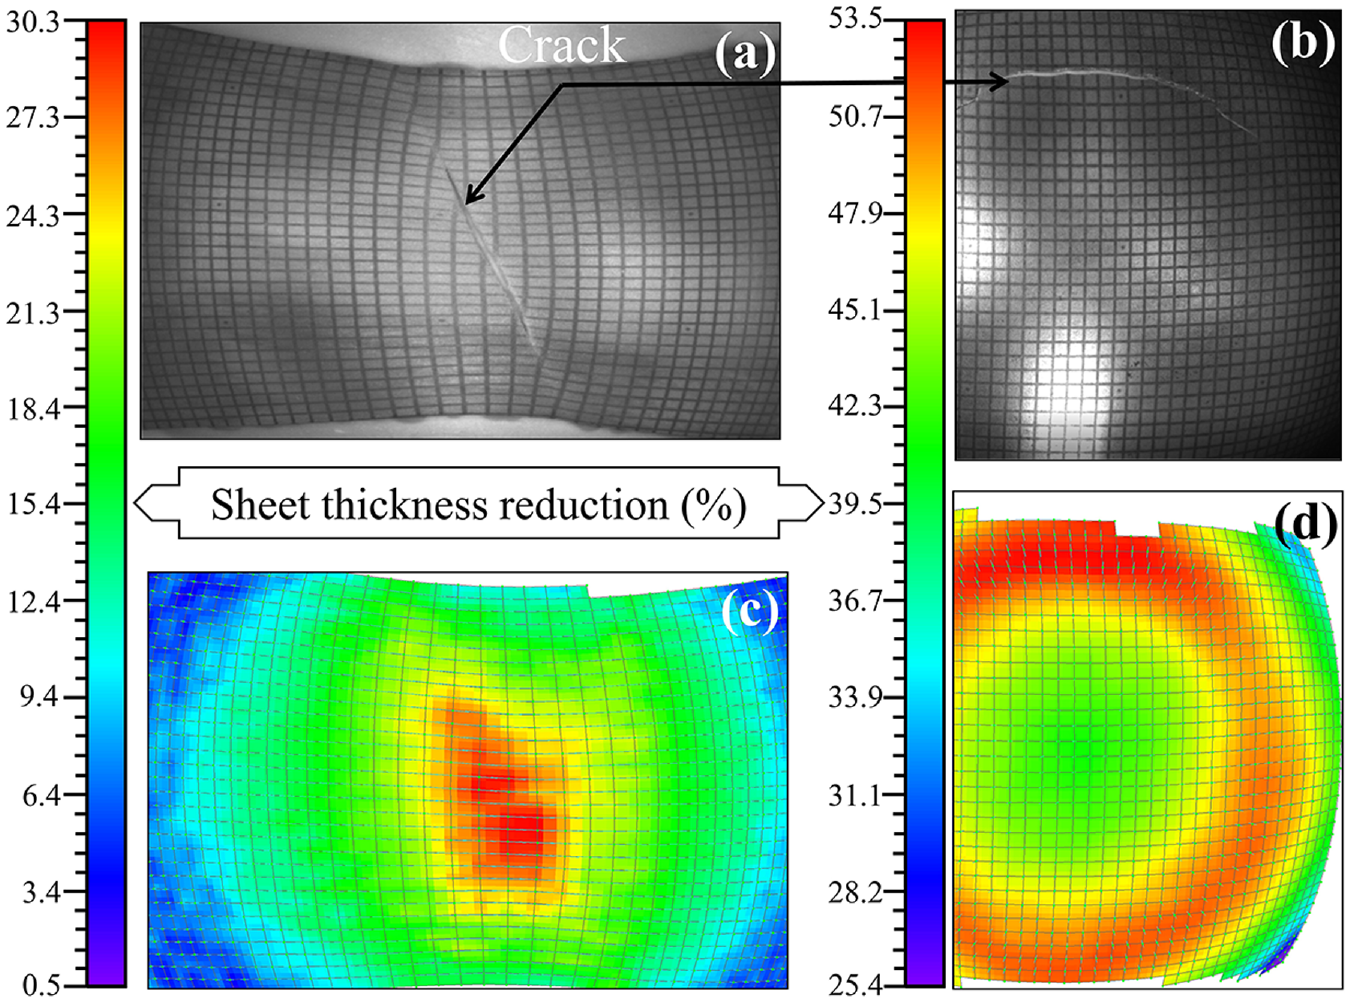
Pictorial view of deformed samples (a and b) along with contour map of thickness reduction (c and d) across the specimen geometry of 50 mm (a and c) and 200 mm width (b and d) samples.
Figure 8 represents the in-process strain distribution just before the appearance of cracks in 50 and 200 mm width samples. Figure 8 demonstrates that the distribution of minor strains in 50 mm width specimen is on the FLC’s negative side, indicating uni-axial stretching. In 200 mm full-width specimen, positive values of both major and minor strains confirm biaxial stretching. Trend lines are fitted in Figure 8 by considering ε1 = −2ε2 and ε1 = 1.38ε2 for specimen’s width of 50 and 200 mm, respectively, mainly to understand the distribution of major and minor strains for varying specimen widths. Based on the above analysis, it is understood that in-process strain path agrees well with the manually measured values under the condition of biaxial stretching for 200 mm width specimen. However, a minor discrepancy in manual strain measurement with in-process measurement technique for specimen width of 50 mm is largely due to difficulties to accurately estimate the minor strains during compression in manual measurement. This is assumed to be the main cause for obtaining slightly higher values of minor forming limit strains in manual measurement under the condition of uniaxial stretching and position of experimental forming limit curve is in slightly lower side to theoretically predicted FLC, particularly in the negative side of the curve.
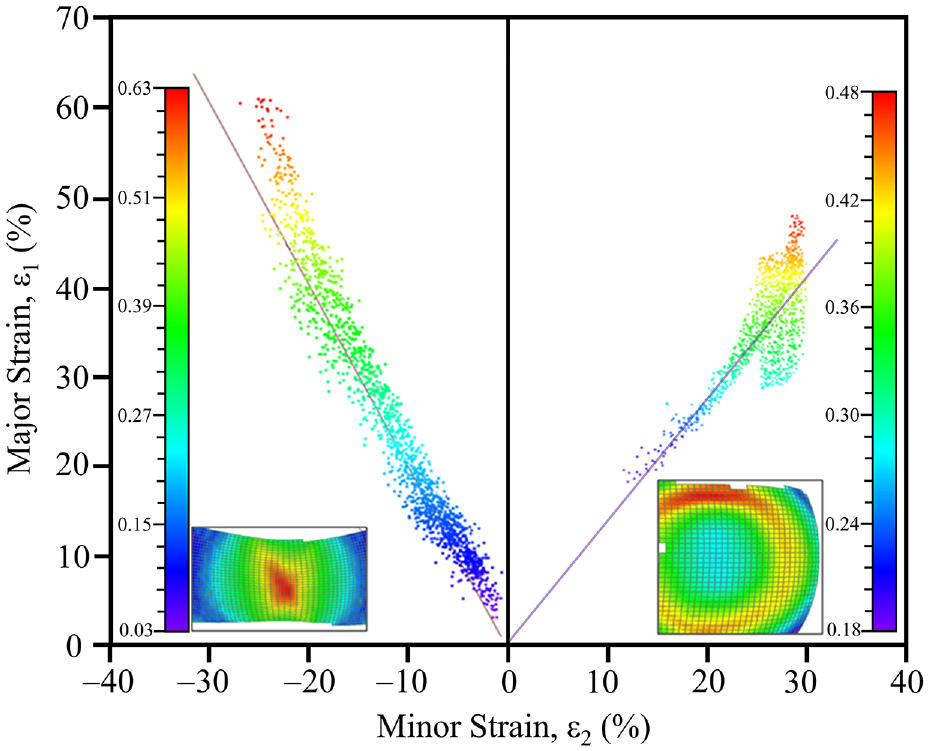
FLC obtained from AutoGrid® in-process software for specimen widths of 50 mm and 200 mm.
Microstructure and hardness correlation
Figure 9 shows the optical micrographs obtained from the top surface of as-received and deformed specimens for various blank widths. As shown in Figure 9(a), the optical micrograph clearly illustrates that the microstructure of as-received bake hardening steel predominantly consists of equiaxed ferrite grains with an average grain size of 15.8 µm. A comparison of the micrographs, as shown in Figure 9(b) to (f), depicts that the aspect ratio of grain size changes with a change in the deformed specimen’s blank width. Figure 10 shows a variation of average grain size and aspect ratio obtained from all the sample’s top surface with varying geometries. Figure 10(a) shows the grain size increases from about 10 to 16 µm in the transverse direction and decreases from about 23 to 16 µm in the longitudinal direction with an increase in specimen blank width from 25 to 200 mm. However, the overall average grain size, that is, an average of longitudinal and transverse grain sizes, is approximately the same as around 17 µm for all samples. That can be attributed to a gradual decrease in grain width and a corresponding increase in grain length for a change of blank size from 200 to 25 mm. Figure 10(b) also demonstrates the aspect ratio of grains is maximum for a blank width of 25 mm due to uniaxial stretching. In contrast, the aspect ratio is close to one for a sample width of 200 mm due to equi-biaxial stretching of grains.
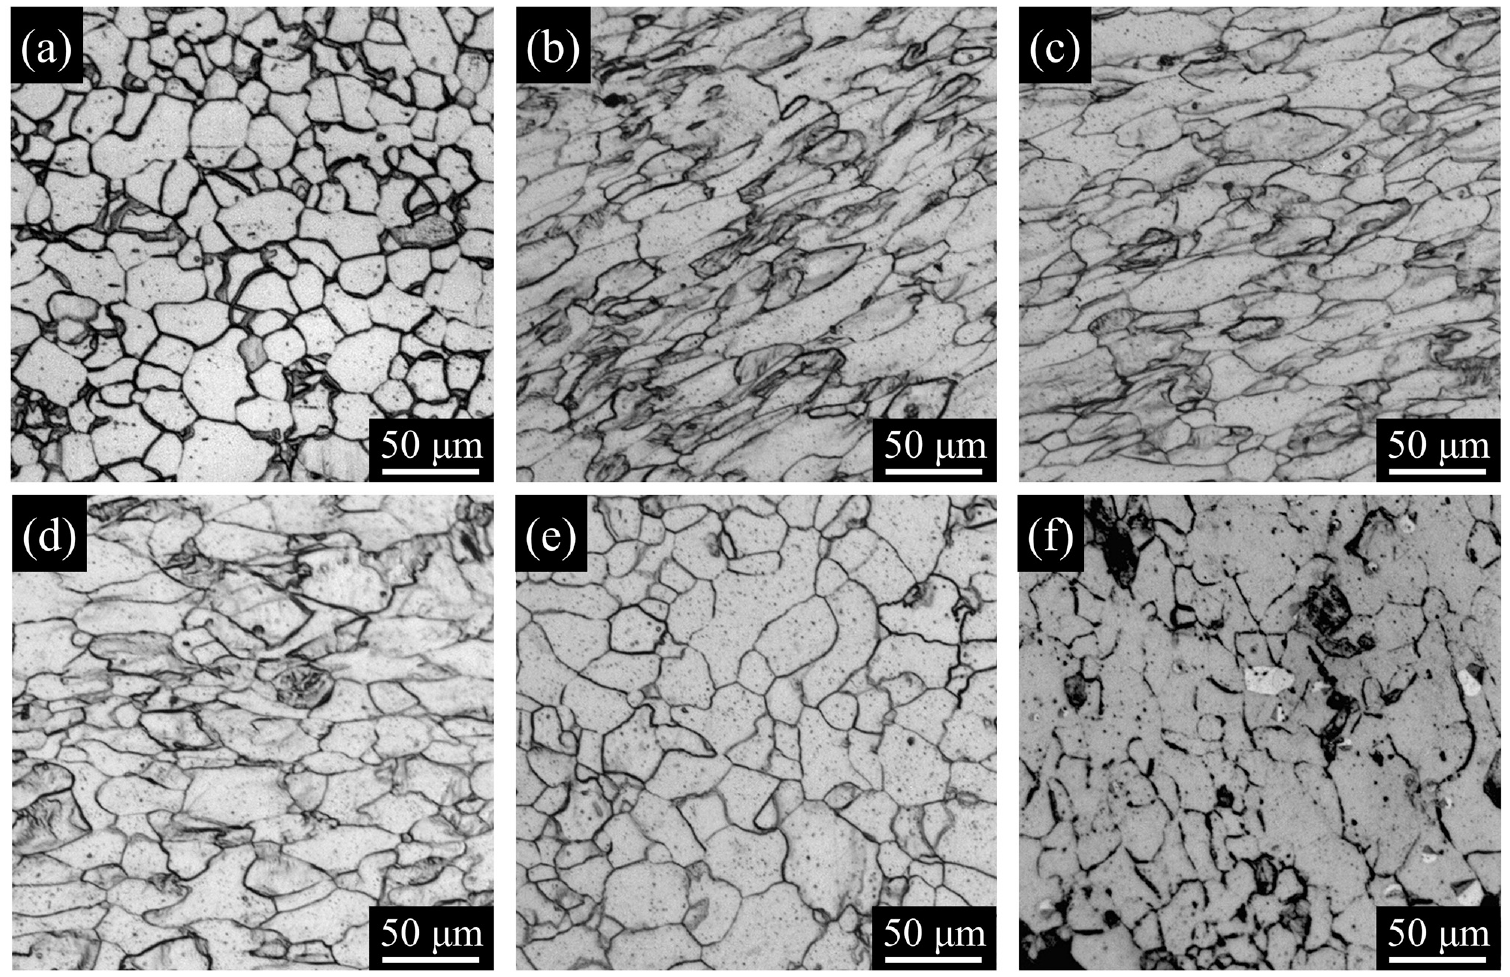
Microstructure obtained from top surface of as-received (a) and deformed specimens of various blank widths: (b) 25 mm, (c) 50 mm, (d) 75 mm, (e) 150 mm, and (f) 200 mm.
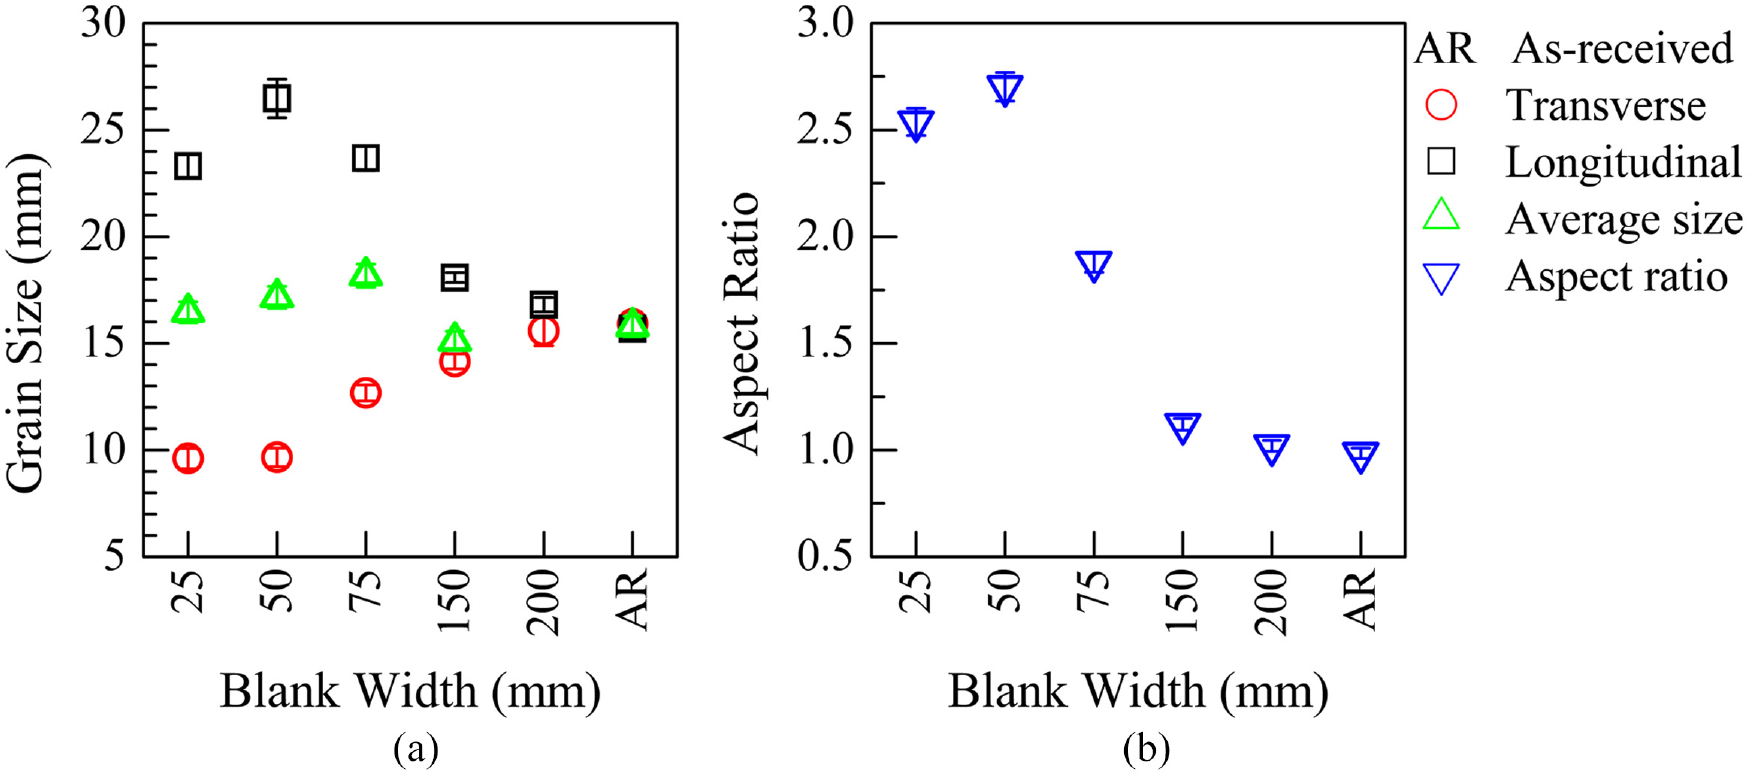
Variation of (a) grain sizes and (b) aspect ratio of grains at the top surface of all samples after deformation.
The optical micrographs along the transverse cross-section (i.e. cross-section of blank width) of as-received and deformed specimens with varying blank widths are shown in Figures 11(a) to (f). Optical micrographs illustrate grain morphology changes with the change in geometry of the deformed specimens. As shown in Figure 11(a), the optical image of the as-received sample indicates that ferrite grains are elongated in the rolling direction with an average estimated grain size of 13.7 µm. Figure 12 shows the variation of average grain size and grain aspect ratio along a transverse cross-section of deformed specimens with varying blank width. In the transverse direction, the grain size increases gradually from around 11.5 to 20 µm with a rise in blank width from 25 to 200 mm as shown in Figure 12(a). The wider sample exhibited biaxial deformation resulting in elongation of grains both in longitudinal and transverse directions. Grains were expected to be compressed negligibly in the thickness direction, as observed in Figure 12(a). Further, Figure 12(b) shows the aspect ratio of grains increases gradually from 1.7 to 3.1 as a rise in blank width from 25 to 200 mm. That is due to the compression of grain in the transverse direction during uniaxial deformation while biaxial deformation elongates grains in a transverse direction.
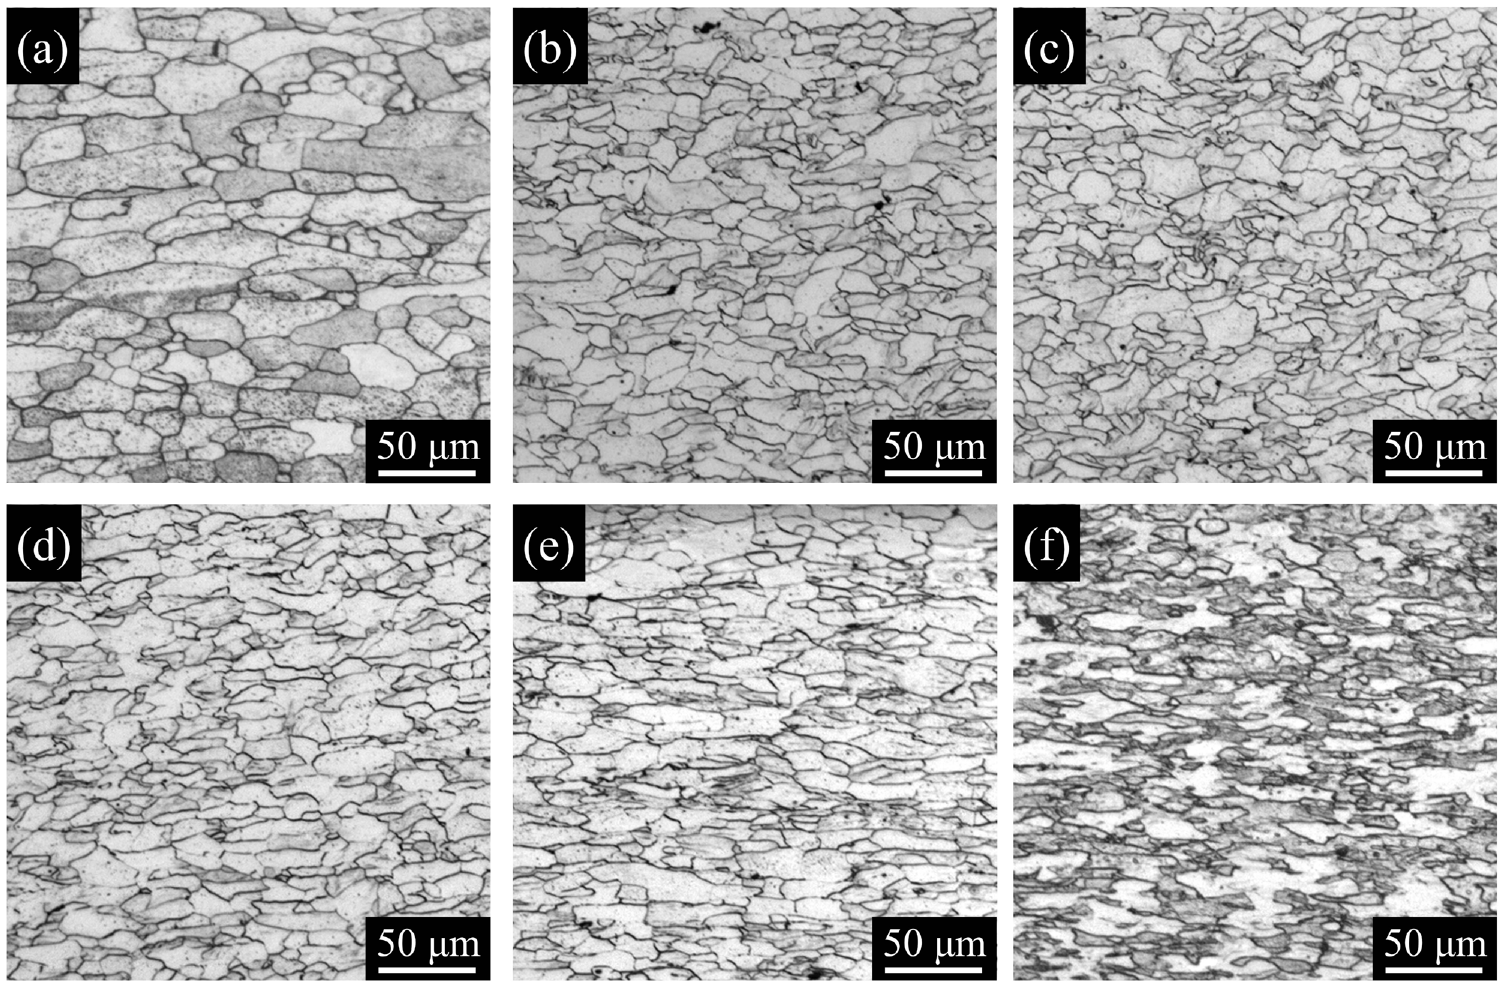
Microstructure along cross-section of (a) as-received and deformed specimens of various blank widths: (b) 25 mm, (c) 50 mm, (d) 75 mm, (e) 150 mm, and (f) 200 mm.
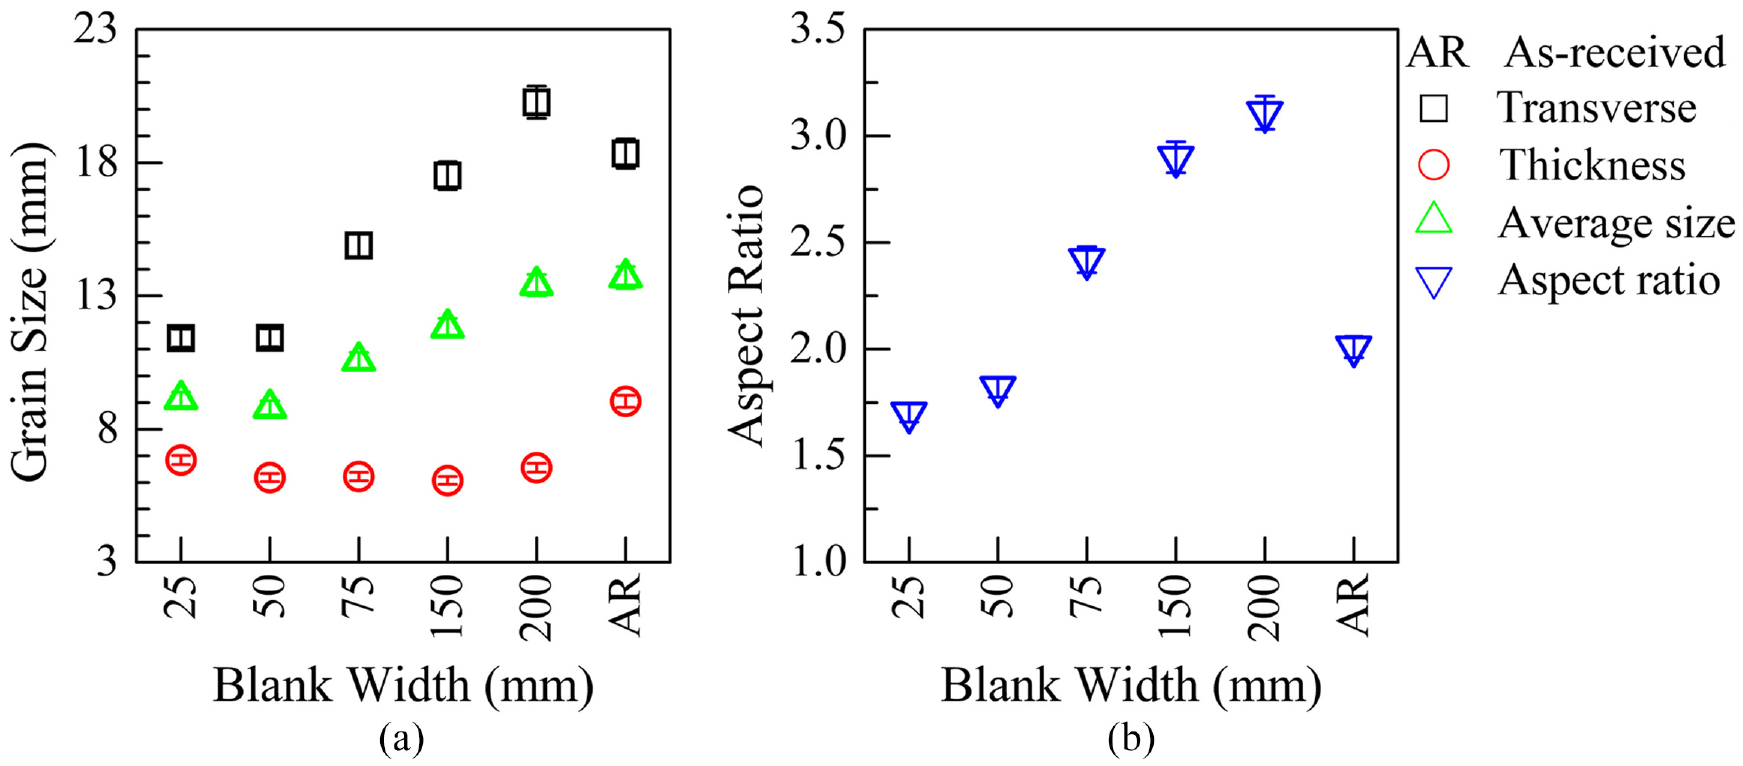
Variation of (a) grain sizes and (b) aspect ratio of grains along the transverse cross-section of all samples after deformation.
The average microhardness values of both as-received and deformed specimens of varying blank widths are shown in Figure 13(a). The presence of deformed grains, results in higher hardness values in tested specimens compared to as-received specimen as per expected metallurgical behavior. Slightly higher hardness values were obtained from each specimen’s top surface compared to the hardness values obtained from a cross-section of the same specimen. It is also observed that the average hardness value gradually decreases with an increase in blank width up to 150 mm, and it further increases for blank width of 200 mm.
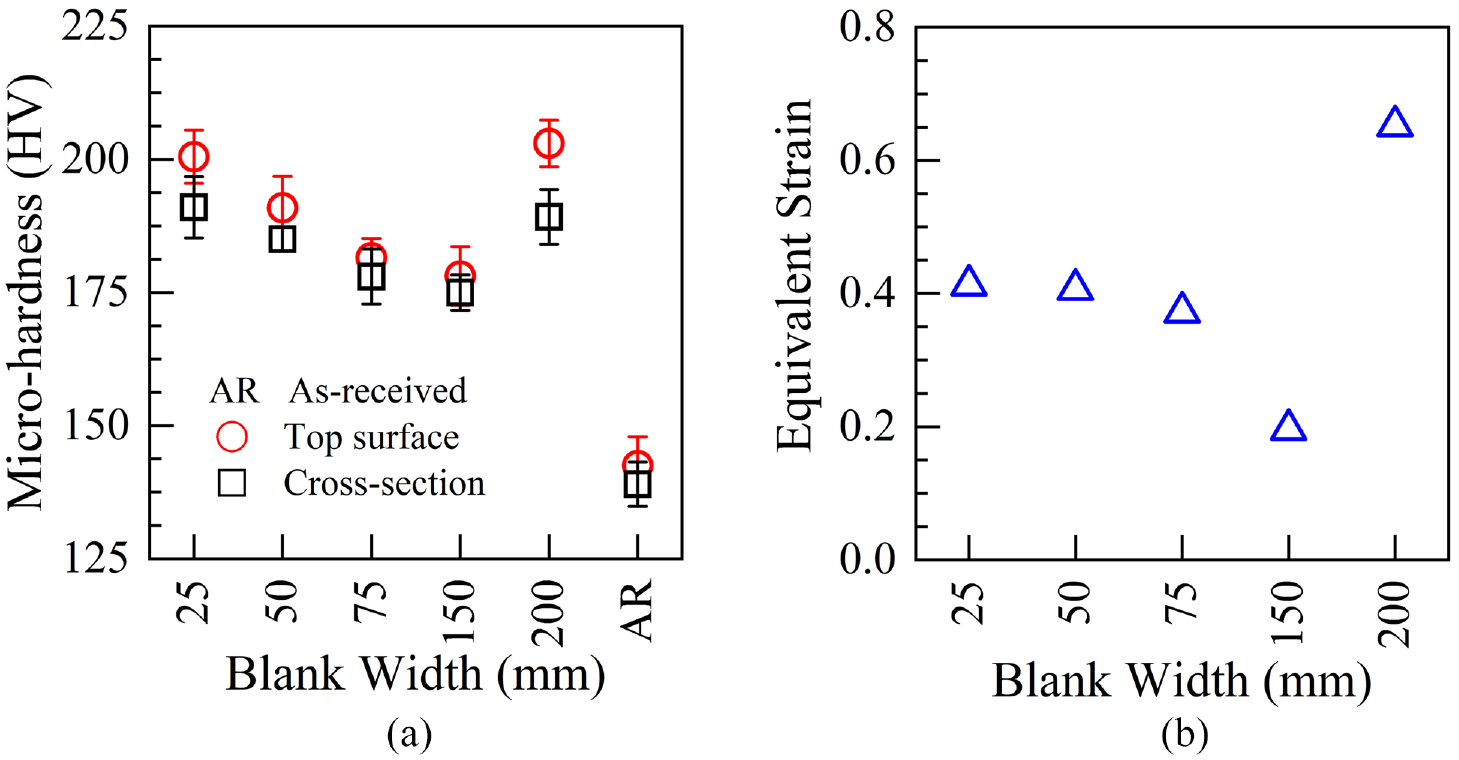
Micro-hardness of as-received and tested samples of varying blank width (a) Micro-hardness of as-received and tested samples and (b) variation of equivalent strain for different blank widths.
Optical micrographs obtained from the specimen’s top surface, Figure 9, demonstrate that elongation of grains increases with decreasing blank width and highly elongated grains in 25 mm width specimen is observed due to the high levels of deformation at the failure point indicative of high strain hardening. This can be attributed to an increase in equivalent strain values with decreasing blank width under uniaxial stretching in tension-compression side of FLD, leading to high equivalent strains for failure in case of 25 mm width specimen. A high level of strain hardening is also envisaged in the grains of 200 mm width specimen during biaxial elongation. High equivalent strain for failure of 200 mm width specimen is due to higher limiting major and minor strain values under the condition of biaxial stretching. In the case of 150 mm width specimen, minimum hardness value was obtained corresponds to least limiting strain close to the plane strain condition. The equivalent strain (dεeqv) for different widths is further calculated to compare it with the obtained hardness values of deformed specimens:
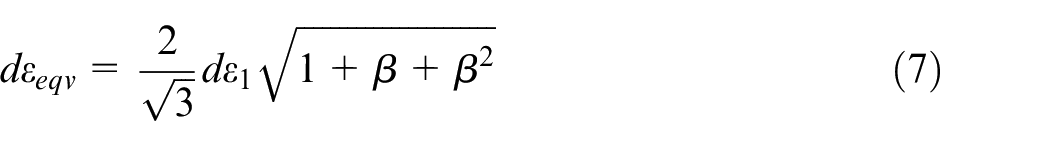
Here,
where, dε1 and dε2 are major and minor true strain rates, respectively, and β is the ratio of major and minor true strain rates. 31 Figure 13(b) shows the variation of equivalent strain for different blank widths. The equivalent strain decreases from 0.41 to 0.19 with an increase in blank width up to 150 mm and further the strain increases to 0.65 for a specimen width of 200 mm. A comparison of Figure 13(a) and (b) represents both micro-hardness and equivalent strain follow a similar trend with the change in blank width, indicating high equivalent strain is cause for an increase in hardness value and failure of the specimen. Higher equivalent strain also indicates a higher effective strain hardening rate in biaxial stretching for a specimen width of 200 mm in comparison to other deformed specimens.
Discussion
Bake hardening behavior of BH steels is extensively studied by many researchers and measured bake hardening response is correlated with microstructure and mechanical properties.4,7,9–13 Though numerous research activities are performed about the tensile properties and microstructural relationship of BH grade steels, however, experimental determination of FLC of BH steels is limited and required further investigation. Several theoretical studies are also performed to correlate the sheet metals forming behavior with important tensile properties and deformation temperature.21,23–25 However, experimental evaluation of FLC for different grades of BH steel requires further understanding for establishing a better correlation of formability with mechanical properties and microstructure. Keeping this in view, the formability behavior of BH steel and its correlation with microstructure is attempted in this investigation. The present study highlights that the forming behavior of BH steel obtained in the present investigation corroborates well with literature information. The present study also demonstrates that the ferrite grain size and its morphology depend on the nature of strain path experienced by the material during press forming operation. In the case of blank width of 25 mm, the aspect ratio of grains obtained from the top surface is maximum in comparison to other deformed specimens due to uniaxial stretching, which results in a gradual decrease in grain width in minor strain direction and a corresponding increase in grain length in major strain direction. In contrast, the aspect ratio is close to one for a sample width of 200 mm due to equi-biaxial stretching of grains in both major and minor strain directions. Cross-sectional microstructural analysis reveals that the uniaxial deformation compresses the grains while biaxial deformation elongates it in the transverse direction as the aspect ratio of grains increases gradually with a rise in blank width from 25 to 200 mm. This observation signifies that the change in strain path during forming operation has a strong influence on microstructure evolution in BH steel. It should be noted that application of BH steel sheet for intricate automobile parts required complex-forming operation, which results in an abrupt change in strain path for any given location of the sheet. 32 Therefore, a detailed understanding of the fundamental issues related to microstructural changes with alteration of strain path during forming operation is of practical importance. Analysis of hardness data of deformed specimens clearly demonstrates that hardness value increases with change in strain paths toward uniaxial and biaxial stretching from plane strain condition (FLC0). It is also noted that hardness value and equivalent strain follow a similar trend with the change in blank width; therefore, higher hardness value indicates a higher equivalent strain for failure. Analysis of experimental data indicates that the thinning of the specimen just before the failure is more in biaxial stretching (200 mm width sample) than in uniaxial stretching (50 mm width specimen). This observation suggests that strain hardening will be more for the specimen deformed under biaxial stretching in comparison to other deformed specimens that follow different strain paths. This change in mechanical properties is associated with alteration of microstructure because of different complex strain paths experienced by the specimens during deformation. Higher effective strain hardening rate obtained in biaxial stretching condition as compare to plane strain and uniaxial stretching conditions is associated with the development of dislocation substructure due to variation in complex strain paths. 32 It is reported that dislocation substructure formed during biaxial stretching consists of dense tangled cell walls, which results in high hardness with increasing work hardening rate.32,33 In contrast, uniaxial stretching generally results in an ordered cell wall network of dislocations, which allows movement of mobile dislocations to a certain extend depending on deformation level and strain paths.
The current analysis clearly demonstrates that microstructure development and mechanical properties are highly sensitive to complex strain paths experienced by the material during forming operation. It should also be noted that bake hardening response depends on deformed microstructure as well as the amount of dissolved carbon present at the grain boundaries and within the ferrite grains after forming operation. It is also realized that ferrite grain size, dislocation substructure and dislocation density control the diffusion of carbon by providing the necessary driving force to overcome the grain boundary energy during bake hardening treatment. Therefore, the bake hardening response of steel sheet also depends on the complex strain path experienced by the material during forming operation. 7 In view of the above, further study on fundamental issues are very much required particularly related to the detailed microstructural analysis of BH steel with variation in strain path.
Conclusion
A detailed study on comparison of experimentally calculated and empirically estimated forming limit curve of bake hardening steel sheets is reported in the present work. The present study is also focused on the mechanical and microstructural properties by characterizing the specimens of varying geometries. The following conclusions have arrived from the present work:
Forming limit diagram obtained in the present study is reasonably good agreement with the experimentally determined and the theoretically estimated curves.
Microstructural analysis reveals that the morphology of ferrite grains changes with the sample geometry. It is observed that the average grain size obtained from the top surface is approximately the same for all the deformed specimens. The grain aspect ratio obtained from the top surface is maximum for a blank width of 25 mm due to uniaxial stretching, while it is minimum for blank width of 200 mm due to biaxial stretching of grains.
Average grain size along the cross-section of deformed specimens decreases gradually with a decrease in sample width and maximum for blank width of 200 mm. However, the grain aspect ratio along the cross-section of specimens increases gradually from sample width of 25 to 200 mm.
The average hardness value gradually decreases with an increase in blank width up to 150 mm, and it further increases for blank width of 200 mm. This is further confirmed by estimating the equivalent strain, which follows a similar trend with the change in blank width indicating high equivalent strain is cause for an increase in hardness value and failure of the specimen.
Footnotes
Declaration of conflicting interests
The author(s) declared no potential conflicts of interest with respect to the research, authorship, and/or publication of this article.
Funding
The author(s) received no financial support for the research, authorship, and/or publication of this article.