
Abstract
The fracture forming limit diagram (FFLD) is gaining special attention in high strength materials where the necking tendency rarely occurs during sheet metal forming processes. In the present work, the classical Marciniak and Kuczyński (MK) model has been modified by coupling it with different ductile damage models (Cockcroft and Latham, Brozzo, Oyane, Ko, Oh, Rice and Tracey, McClintock and Clift) and anisotropic yielding functions (Hill 1948 and Barlat 1989) to predict the fracture limits of Inconel 625 (IN625) alloy at different temperatures. Firstly, uniaxial tensile testing has been conducted for the determination of important mechanical properties. Consequently, stretch forming experiments have been performed to analyze the forming limits of a material. It has been found that the safe and fracture forming limits of the material increased by approximately 17.26% and 22.22%, respectively, on increasing the temperature from 300 to 673 K. From the comparative analysis of different combinations of ductile damage models and yielding functions, the Cockcroft and Latham (C-L) damage model in combination with the Barlat 1989 yielding function helped in best predicting the theoretical FFLD as it displayed the least average root mean square error (RMSE) of 0.033. The other ductile damage models used for predicting the theoretical fracture limits displayed large error; hence, they should not be considered while designing a critical component in the manufacturing industry using IN625 alloy.
Keywords
Introduction
Inconel 625 (IN625) alloy is a precipitation-hardening alloy with major chemical contents of Ni-Cr-Fe along with some secondary precipitation in the metal matrix of Ni-Al/Ti/Nb. These precipitates in the metal matrix help achieve the excellent blend of different mechanical properties even at higher processing temperatures. Due to the excellent performance of IN625 alloy in extreme conditions, it has been used immensely in aerospace and nuclear applications. 1 The sheet metal forming process is one of the major processes used in the manufacturing industry for making several complex components. The workability or the maximum deformation during any sheet metal forming process is often affected and limited by a failure occurring in the sheet metals. The necking phenomenon usually occurs due to the sheet’s localized thinning during the excessive deformation that occurs while forming complex shape components. The necking phenomenon also leads to the loss of the load bearing capacity of sheet metal.
The forming of a high strength material such as IN625 alloy is difficult at room temperature conditions. 2 In the past, several forming techniques, such as hydro-forming,3,4 electro-magnetic forming, 5 incremental forming,6,7 hot and warm forming, 8 deep drawing, 9 etc., have been used to improve the formability of the material. Hydro-forming and electro-magnetic forming techniques help in improving the quality and formability by many folds. Components with highly complex shapes can be easily produced using these forming methods, but they have some disadvantages, such as high equipment cost and poor production rate. Hot forming is usually carried out at a temperature higher than the recrystallization temperature of the material. It is sometimes less preferred to form components of complex shapes, as instability in the material might arise due to the recrystallization, recovery, and grain growth. However, warm forming helps in improving the safe and fracture forming limits of the material by increasing the ductility of the material. 10 It is also simple and economic compared to other advanced forming techniques.
The forming limit diagram (FLD) usually describes the onset or the occurrence of localized necking. Goodwin 11 and Keeler 12 first established an experimental way of determining the FLD. The FLD is used extensively to evaluate the formability of different sheet metals. However, the determination of an experimental FLD involves extensive resource consumption and also requires an expert researcher to draw a trustworthy limiting curve. 13 Thus, various researchers in the past have proposed different theoretical models to determine the limiting curve in order to reduce rigorous experimental processes. By considering that sheet metals possess homogenous properties, the first such models for the theoretical prediction of localized necking and diffused necking were proposed by Hill and Swift respectively. However, several discrepancies have been found in the forming limits between the experimental results and these proposed models for the case of having the ratio of minor to major strains greater than zero. Further, the Marciniak and Kuczyński (MK) 14 proposed one of the most commonly used theoretical forming limit prediction model by having an assumption that the failure occurred due to the presence of non-homogeneity (structural and geometric) present in the sheet metals. The classically proposed MK model was later improved by Hutchinson and Neale15,16 incorporating the influence of groove rotation angle. It is noteworthy to mention that the accuracy of the necking limit estimated by the MK model can be influenced by the choice of yield models, hardening equations, initial geometric imperfection factor, and strain rate sensitivity index etc. as demonstrated in the previous literature.17–19 The MK model is mainly based on thickness variation and necking theory for FLD prediction. The MK model is unable to predict failure when there is a negligible change in the thickness of the considered metal, especially in the negative or low stress triaxiality region. Marciniak et al. 20 modified the proposed MK model by using the Hill 1948 yield criterion and found very credible forming limits for aluminum, steel, and copper. Banabic et al. 21 used five different methods while predicting the forming limits, namely, Swift’s diffused necking, Hill’s localized necking, the finite element approach, the modified maximum force criterion, and the MK model for comparing the predictive efficiency of these methods for AA5182 metallic sheet. The normal anisotropy of the material also influences the forming limits of the material. Ávila and Vieira 22 used von-Mises, Hill 1948, Hill 1979, Logan and Hosford and Hill 1993 yielding functions while predicting the forming limits using the MK model and they also found that the criterion used highly affects the predicted forming limits of the material.
Recently, several challenges have arisen in forming complex-shaped components due to the sudden appearance of fractures without any prior hint of substantial necking. 23 On the basis of the opening mode of the crack tip, the fracture limits can be classified into the shear fracture forming and tensile fracture forming limit diagram (FFLD). The continuum damage (ductile) models in combination with the yield criterion used help in the prediction of the theoretical FFLD. The Bao-Wierzbicki (BW) 24 model is one of the most popular damage models used for the evaluation of the fracture locus. Three different empirical relations have been proposed in the BW model to estimate the fracture limits in the whole stress triaxiality (−0.33 < η < 0.67) range. Different researchers in the past have used several damage models in the estimation of the FFLD. Isik et al. 25 in their study over AA1050-H111 introduced normal anisotropy into the damage models for FFLD prediction using the Nakazima, bulge, and Incremental sheet metal forming experiments. Park at al. 26 combined the Hill 1948 and Barlat 1991 yielding functions into the Lou-Huh ductile damage model for the prediction of an accurate FFLD for stainless steel. Pandre et al. 27 used seven different ductile fracture criteria to calibrate the fracture limits of DP590 steel. They found that among all the models used, BW damage criteria can be used in the future for evaluating the fracture limits of DP590 steel. Takuda et al. 28 used five different proposed criteria for investigating the failure of cylindrical deep-drawn cups using A5052, A1100, and A2024-T4 alloys. They further found these criteria to be accurate in predicting the HDR after implementing the ductile damage models. Prasad et al. 29 also compared the abilities of six models to predict the fracture limits of the solution-treated IN718 alloy for aerospace applications. They found that Oh’s model accurately followed the experimentally evaluated fracture limits of the material with the least average absolute error (AAE) of approximately 10%. Wu et al. 30 used six different damage models to study the failure of material using the hydroforming technique. The Rice-Tracey model was found to have results approximately the same as those obtained by the experimental approach. These ductile damage models have also been used to evaluate the fracture for different processes such as biaxial stretching, bore expansion, hydroforming, tube bending, and deep drawing. These fracture models can predict fracture initiation with high accuracy, as they perform evaluations by considering the deformation energy. However, these damage models have certain limitations in the calculation of material constants which restricts their application in different manufacturing processes. Further, it is also evident from the literature that very limited work has been done for the prediction of fracture limits using the damage models (considering anisotropy) for the warm forming of Inconel alloys.
In the present work, different combinations of ductile damage models (Cockcroft and Latham, Brozzo, Oyane, Ko, Oh, Rice and Tracey, McClintock and Clift) and yield criteria (Hill 1948 and Barlat 1989) have been incorporated into the classical M-K model for predicting the fracture limits of IN625 alloy at forming temperatures of 300 and 673 K. The stretch forming experiments have been performed to find experimental fracture limits for validating the theoretical results. A comparative analysis has also been performed to find the best combination of yield criteria and damage models for predicting the fracture limits using a modified M-K model which could be used in the manufacturing industry in order to avoid costly and time-consuming experimental procedures for finding the limiting strains and forming complex shapes.
Theoretical framework of modified Marciniak and Kuczyński (m-MK) Model
The fracture prediction in the present work has been carried out with the help of a modified Marciniak and Kuczyński (m-MK) model. 23 The theoretical framework to obtain the fracture limits of the material using the proposed m-MK model has been described step by step below in Figure 1. The non-linear equations used in this theoretical model have been solved using the Newton-Raphson solver in the MATLAB software.
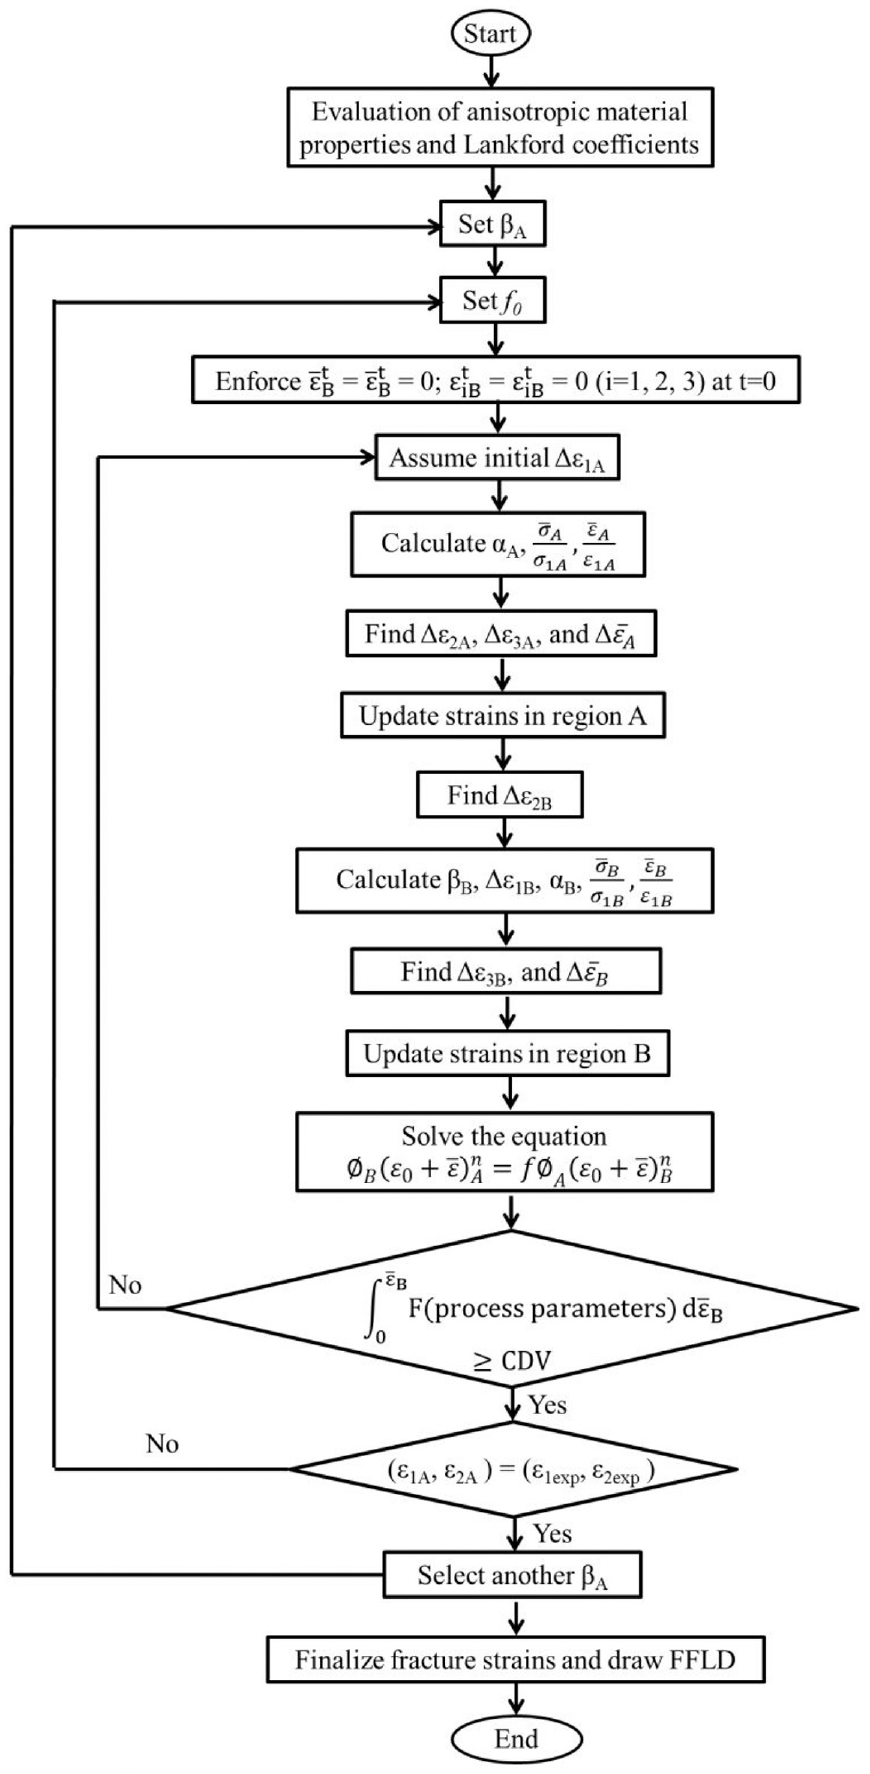
Layout of the procedure to be followed for calculating the fracture limits using the proposed m-MK model. 23
The classical MK model has been used in abundance to find the forming limits of a given material. When applying the classical MK model, inhomogeneity has been assumed in the material in terms of the groove. The groove region (region “B”) is the critical region; it plays a major role in the initiation of fracture, while region “A” is the safe part of the sheet metal, as shown in Figure 2. The ductile fracture criteria have been used for characterizing the condition of fractures in the stretch formed specimens. The principle strains in region A at the time of the fulfillment of the fracture conditions are considered to be the limiting strains of the material.
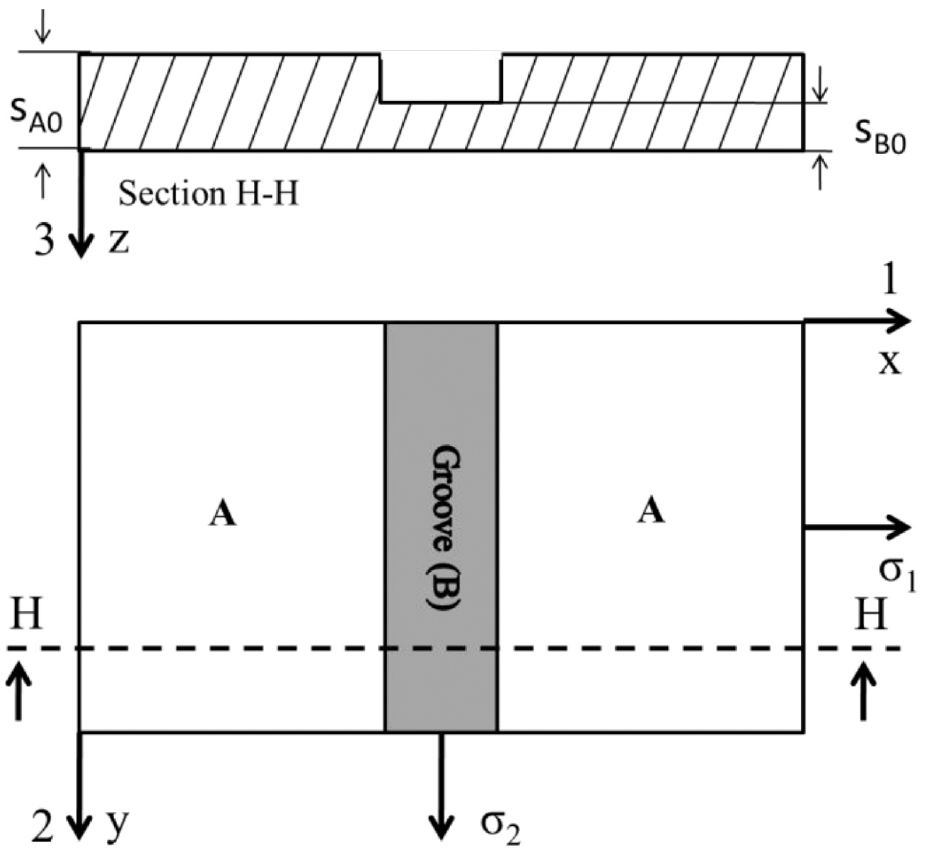
Geometric imperfection assumed while solving MK model.
The classical MK model has been designed by assuming the plane stress condition in regions A and B. Hence, equations (1) and (2) hold true (for the indices 1, 2, and 3 in these equations, please refer to Figure 4).


While undergoing the deformation, the region A has been assumed to have gone under the proportional loading which further resulted in no tangential strains (
The inhomogeneity factor or the initial thickness ratio f0 is defined as f0 = sB0/sA0; where 0 < f0 < 1. Further, sA0 and sB0 are defined as the initial thickness in regions A and B respectively. Additionally, to have simplicity in solving the mathematical formulations, the deformation in region A is assumed to have occurred along linear strain paths. The slope of each path is defined as the principle stress ratio (
The computation of the fracture strains starts with a small increment in the principle strain (
The Hill 1948 31 yield criterion can be expressed using the mathematical function shown below in equation (3).
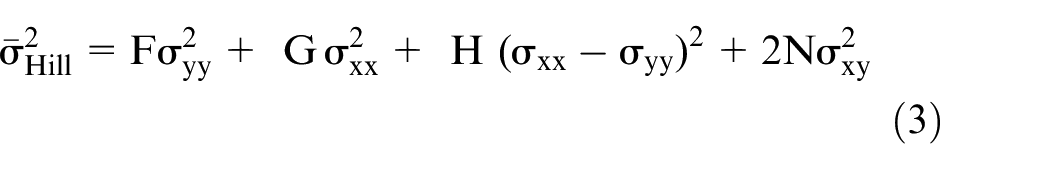
Here, F, G, H, and N are the material constants which describe the anisotropy of the material. Stoughton
32
suggested neglecting the component for shear stress (σxy) in order to reduce the complexity of the yield function. Further, in a plane of principle stress, the stress components
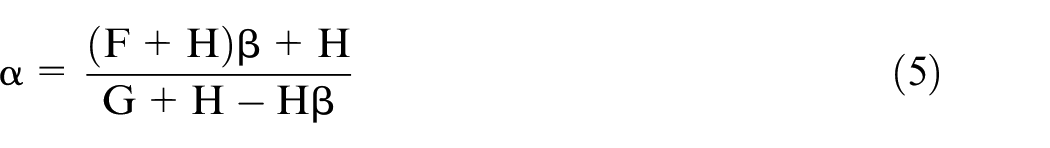
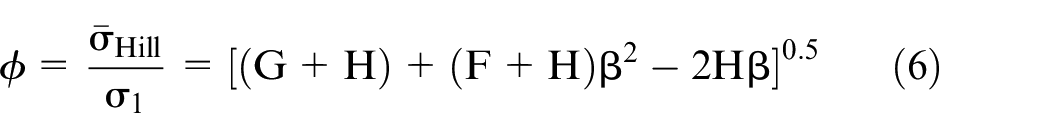
The parameter ϕ, derived from the Hill 1948 yielding function can be expressed as
By assuming the plane stress condition (

The material constants shown in equation (3) can be evaluated using two different approaches, namely, the r-based and σ-based approach. In the present work, the r-based approach has been used. Hence, the anisotropic coefficients in the three directions, namely, the RD (Rolling direction) or 0°, DD (Diagonal direction w.r.t. RD) or 45°, and ND (Normal direction w.r.t. to RD) or 90°, have been evaluated. The formulation for the evaluation of all the constants is shown below.
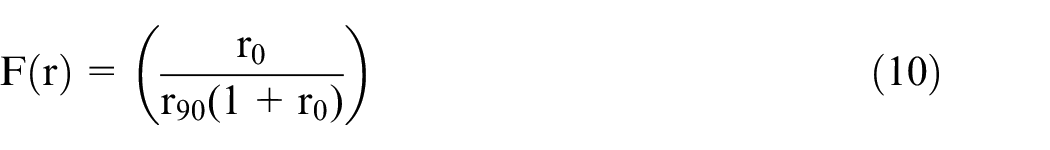
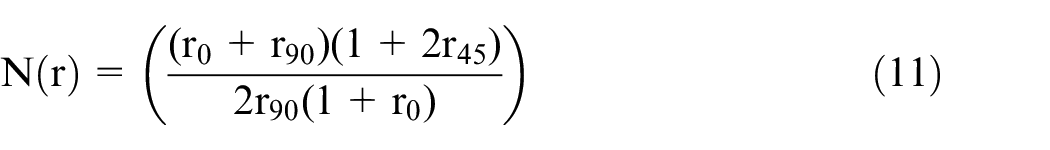
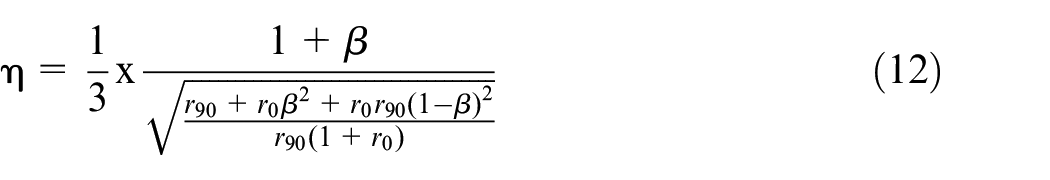
The stress triaxiality (η) using the Hill 1948 yield criterion can be evaluated using equation (12).
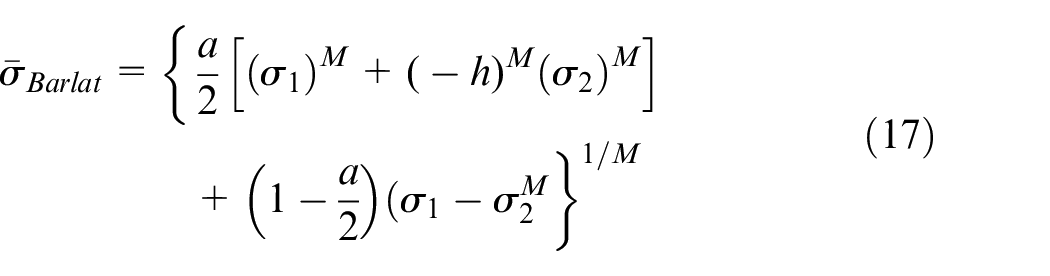
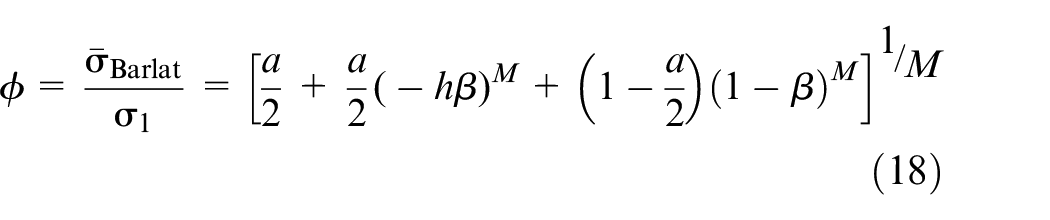
The Barlat 1989 33 yield criterion can be mathematically expressed using equation (13).
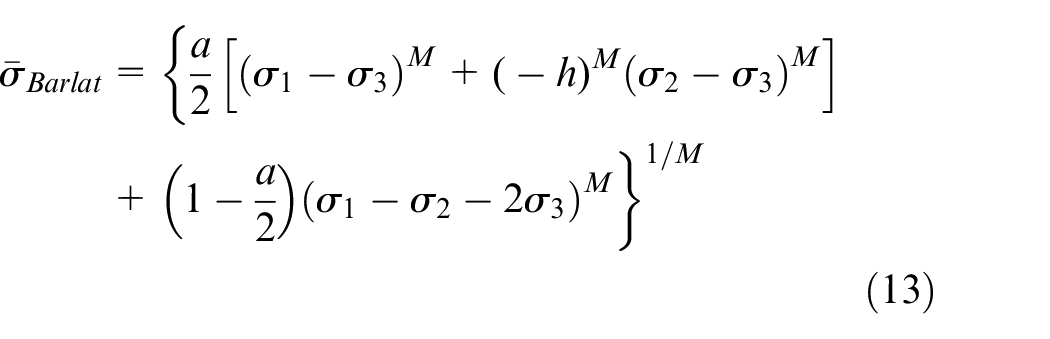
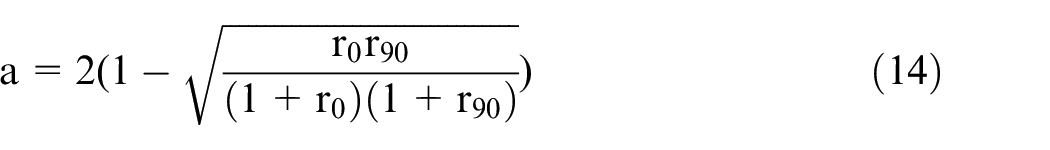
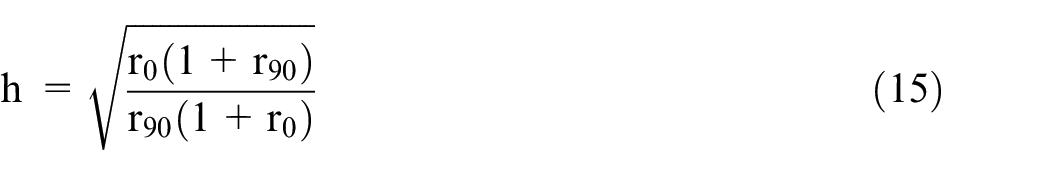
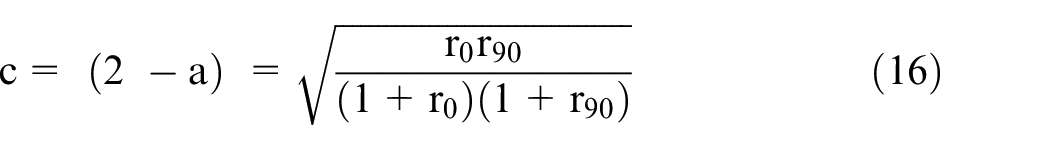
Here, σ1, σ2, and σ3 are the principle stresses. M is an integer exponent with 6 as its value for the BCC material and 8 for the FCC material. IN625 is the FCC material; hence, the value of M is selected to be 8. The material constants a, c, and h can be calculated using equation (14)–(16).
Under the plane stress condition, equation (13) can be transformed into equation (17).
The parameter ξ, which is the ratio of equivalent to the major principle stress for the Barlat 1989 yielding function can be evaluated using equation (18).
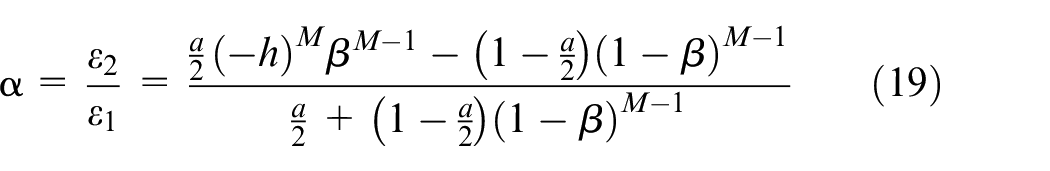
Further, the strain ratio (α) using the Barlat 1989 yielding function can be evaluated as
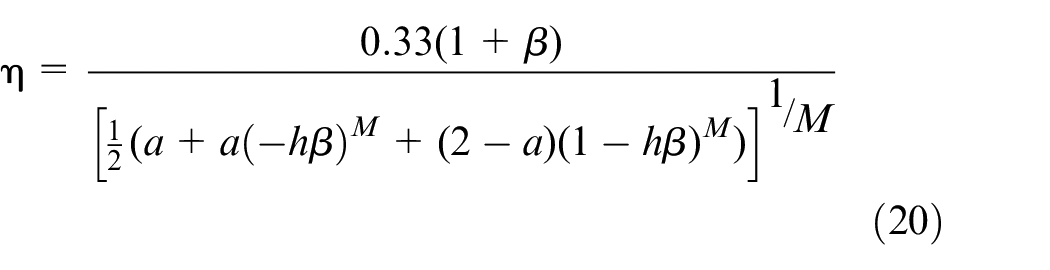
The stress triaxiality (η) using the Barlat 1989 yield criterion can be evaluated using equation (20).
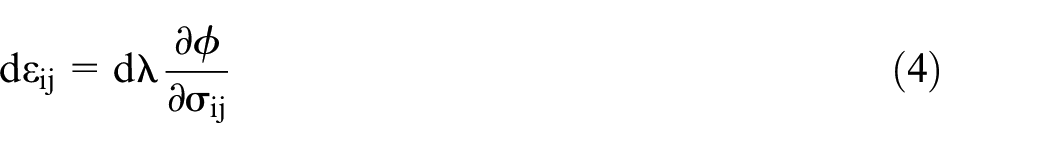
The incompressibility constraint (dε3 = −(dε1 + dε2) has been followed for the determination of the fracture limit. The non-zero components for the evaluation of the strains are defined using the flow rule

The increment in the equivalent strain can be evaluated using equation (22) in which

At this particular stage, the strains in the area of the non-defective region have been updated using equations (23) and (24).


All the components of strain have been calculated up until now. Further, the components corresponding to the groove for t + Δt also need to be calibrated. Additionally, the link between regions A and B can be expressed as shown below.
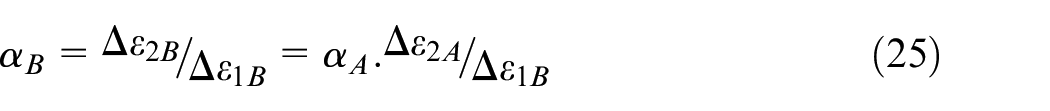
Continuity in the groove direction of strain; Δε2B = Δε2A.
From the interface of both of the regions, equilibrium can be achieved; σ1A·sA = σ1B·sB, where, sA and sB are the current thicknesses of regions A and B respectively.
The continuity equation can be used for calculating the ratio of principle strains in the groove region.
Further, the relation of principle strains in region B can be written as
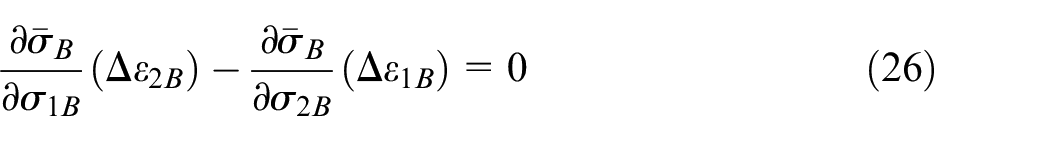
The principle stress ratio in the case of the Hill 1948 and Barlat 1989 yield criteria for region B can be calibrated using equations (5) and (19) respectively. Further, the unknowns, namely, αB, β2B, and Δε1B can be calculated using equations (25) and (26) and the stress ratio relations for the respective yield criteria. Thus, the strains in the groove region get updated at this step.


To perform the iterative process to update the strains, the force compatibility equation

Where,

On achieving the parameters associated with the fracture of region B, the iterations must be stopped. The principle strains in region A at the current step are known as the limiting strains. The FFLD has been plotted using equation (31), which is shown below.
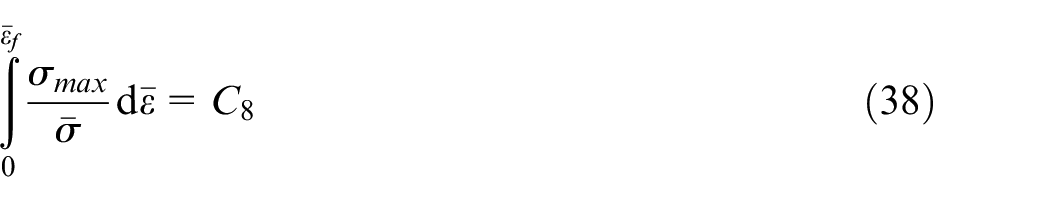
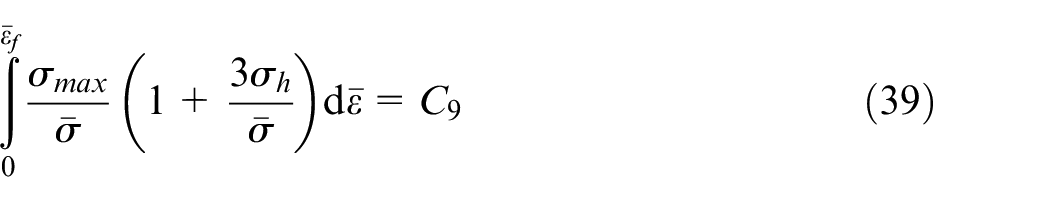
The ductile damage models listed below are used in abundance for influencing the damage history of stress and strain on the occurrence of the fracture of sheet metals. The absolute value of material constants should be considered in the case of each damage model for easy mathematical computations.
Cockcroft and Latham (C-L) 34 :
Brozzo et al. (Bo) 35 :
Oyane et al. (Oy) 36 :
Clift et al. (Cl) 37 :
Rice and Tracey (RT) 38 :
McClintock (MT) 39 :
Oh et al. 40 :
Ko et al. 41 :
In equation (32)–(39),
Material and method
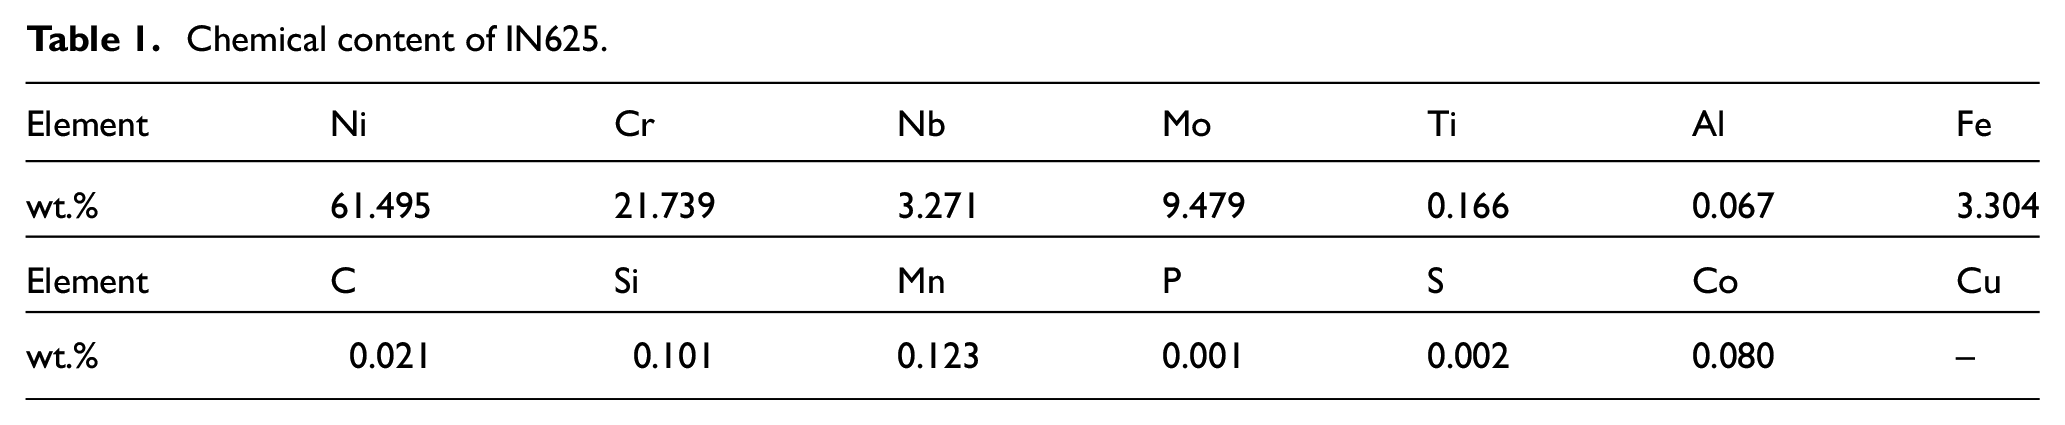
A 1 mm thick IN625 alloy sheet has been used in the present work for performing the uniaxial and stretch forming experiments at 300 and 673 K temperature. The chemical composition for the as received IN625 alloy by weight percentage has been determined according to the procedure mentioned in the ASTM E3047 42 standard and is shown below in Table 1.
Chemical content of IN625.
The uniaxial tensile testing has been performed using the dog bone shaped specimen, designed using the ASTM E8/E8M 43 standard. The tensile test has been conducted using the specimens cut in three different directions, namely, 0° (parallel to the rolling direction of the sheet), 45° from the rolling direction, and 90° (perpendicular to the rolling direction of the sheet). The testing has been done at 300 and 673 K temperature. The testing has been done at a slow strain rate of 0.0001 s−1.
A 40 ton hydraulic press has been used for to perform the experimental stretch forming process at 300 and 673 K. It has an inductive heating coil for high-temperature testing, and a K-type contact thermocouple has been used for finding the exact temperature over the whole forming setup. Figure 3 represents the schematic diagram of the stretch forming setup and design of the specimens used for finding the limiting strains in the present work. It consists of three primary components, namely, a hemispherical punch with the diameter of 50 mm, die, and blank holder. To restrict the easy flow of sheet metal, a circular draw bead with the diameter of 84 mm has been designed over the circular die. The specimen designs for stretch forming were selected based upon the ASTM E2218-15 44 standard and the method proposed by Sajun Prasad et al. 45 The molybdenum disulfide based Molykote lubricant has been used in this study. The laser etching process has been used to mark the grids with the diameters of 2.5 mm over specimens to capture the major and minor strains across the deformed specimens accurately. The deformed grids over all the specimens were measured using an optical microscope with image analyzing software to obtain major and minor strains. The punch speed and the blank holding pressure (BHP) have been maintained to be 5 mm/min and 20 MPa respectively.
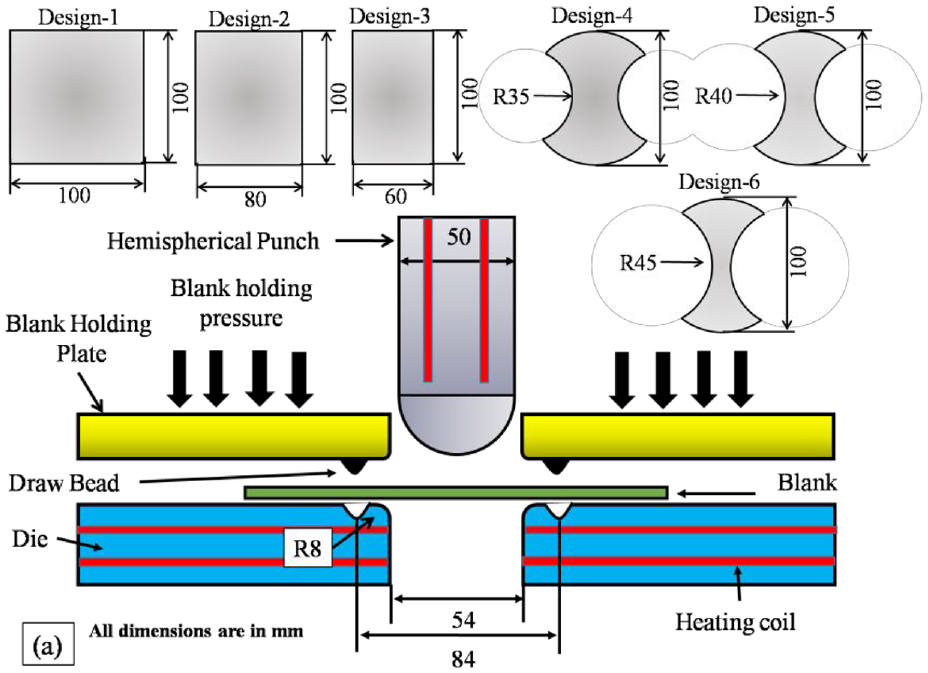
Schematic representation of stretch forming setup and design of all the specimens.
In the present work, six types of specimens have been used to find the complete forming limit diagram of IN625 alloy at forming temperatures of 300 and 673 K. The Design 1, 2, and 3 specimens are of rectangular shape and have dimensions of 100 mm × 100 mm, 100 mm × 80 mm, and 100 mm × 60 mm, respectively. The 100 mm × 100 mm square-shaped specimens were used to induce biaxial tensile strain in the material, and they were lubricated using Molykote lubricant to impose deformation close to the equi-biaxial strain path. Rectangular specimens of the same length but with the narrower widths of 80 and 60 mm were deformed to change the strain path during deformation. However, failure in the sheet metals was consistently observed at the draw-bead position during the testing of rectangular specimens of 40-mm width. Hence, the Hasek specimens of Designs 4, 5, and 6, shown in Figure 3, were used. In these specimens, the material could flow into the die cavity from the lateral side, as the width was lower than the draw-bead diameter. However, the sheet metal gets locked in the draw bead and stretched in the longitudinal direction. The quantity of material drawing into the die cavity depended on the width of the specimen, and this induced the compressive strain and hence the strain path. 45
Results and discussion
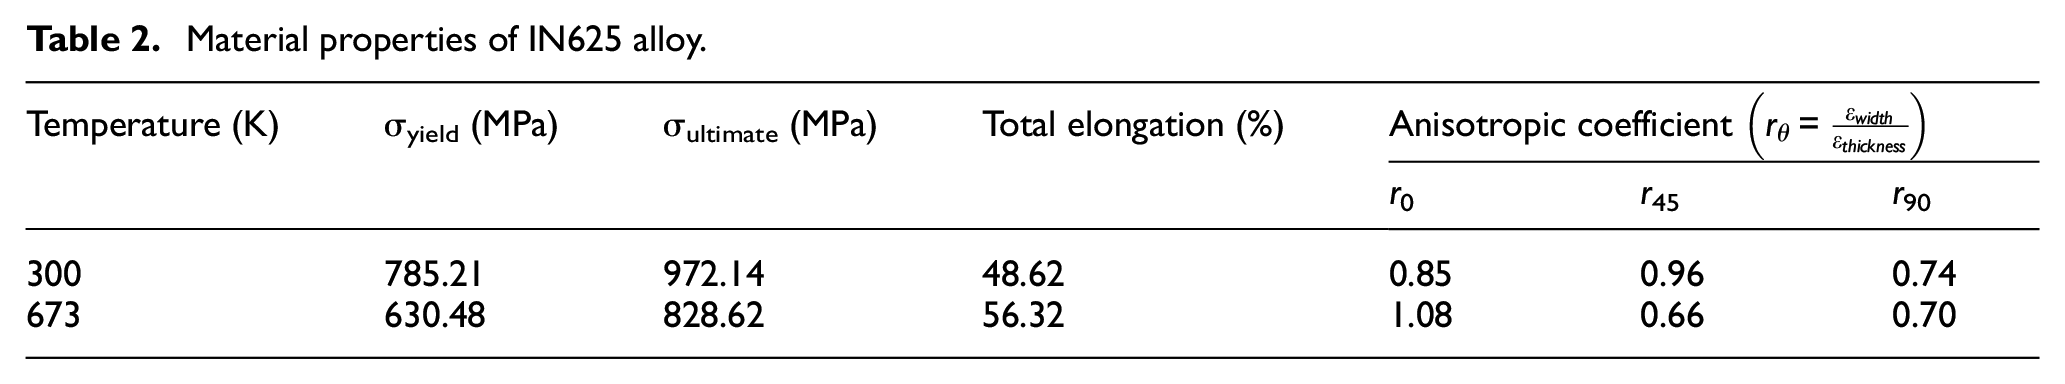
The engineering stress-strain curve of IN625 alloy is shown in Figure 4. The basic material properties at 300 and 673 K are shown in Table 2. On increasing the temperature from 300 to 673 K, the total elongation increased by 15.83%, while the yield and ultimate stress decreased by 19.74% and 14.81%, respectively. It is worth mentioning that serrated flow stress behavior has been reported at 673 K. This serrated behavior is popularly described by the Portevin–Le Chatelier effect or dynamic strain aging (DSA). According to the classification of Rodriguez, 46 serrations type A, B, and C are generally observed in metal. The oscillation type of the flow stress behavior is found from 673 K, which indicates the B-type of serrated flow behavior. The fluctuation of flow stress is because of rapid dynamic recrystallization, where the former process ends before the latter one starts. Similar observations were reported in previous work done by Lin et al. 47
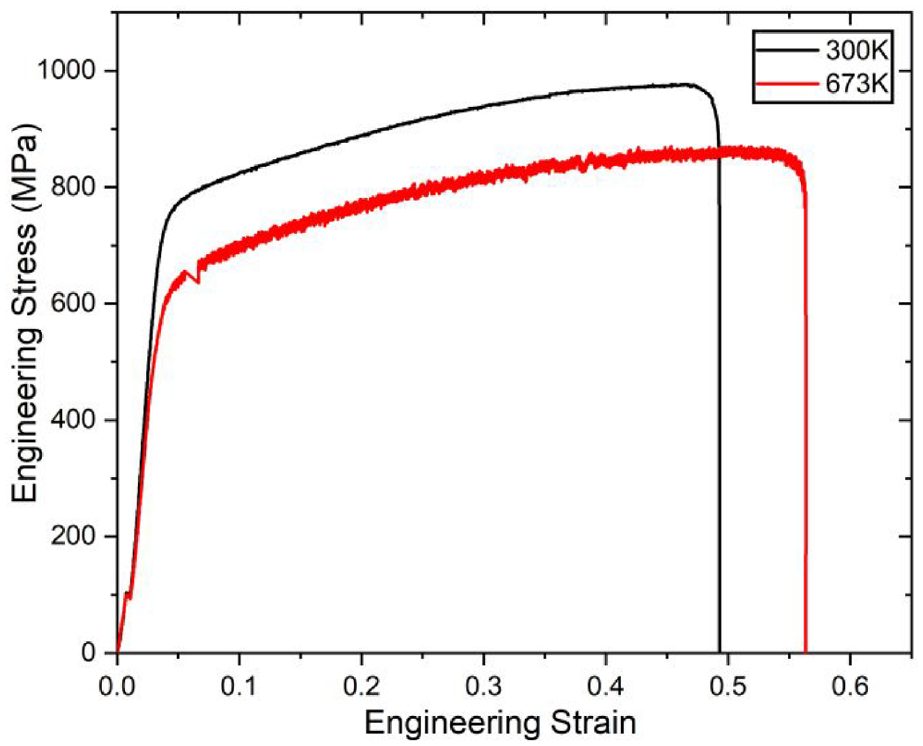
Engineering stress-strain curve of IN625 alloy.
Material properties of IN625 alloy.
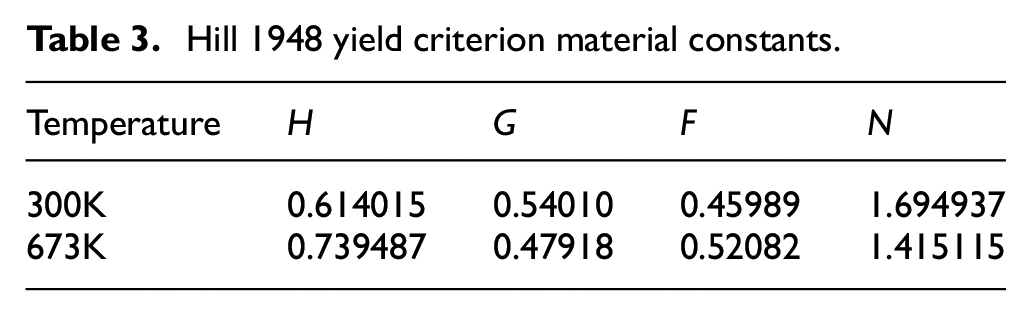
The material constants for Hill 1948 and Barlat 1989 yield criteria have been estimated and are shown in Tables 3 and 4, respectively.
Hill 1948 yield criterion material constants.
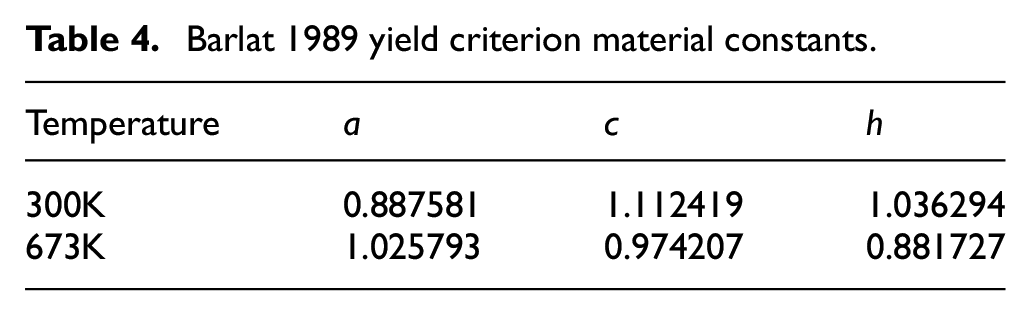
Barlat 1989 yield criterion material constants.
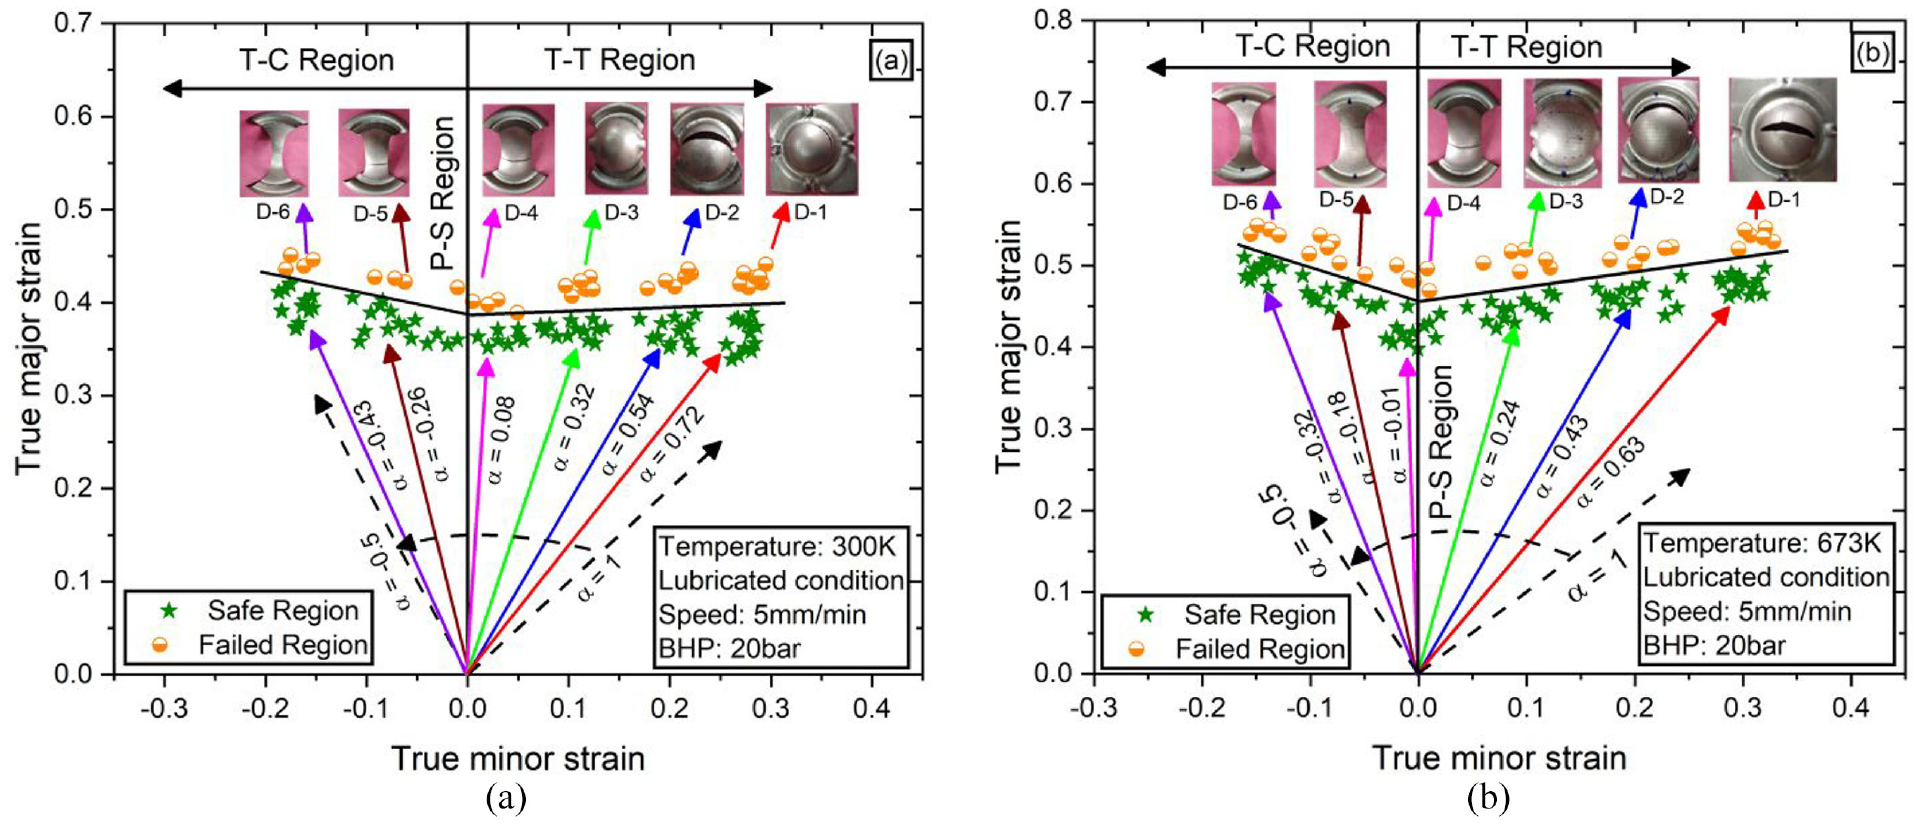
The true major and minor strains for the safe and failed regions have been plotted in the principle strain graph using six different designs of specimens. The specimens were stretch formed until the fracture of the specimens. It was of particular interest that a sub-size hemispherical punch of ϕ50 mm was used in the present work instead of the standard punch of ϕ101.4 mm proposed by Hecker. 48 Hence, the bending strain induced on the outer surface of the sheet metal while wrapped around the smaller punch during deformation was calculated using the procedure mentioned by Morchhale et al. 49 and Prasad et al. 50 The approximately V-shaped black line separating the safe and fractured points is called the forming limit diagram (FLD). The FLDs obtained at temperatures of 300 and 673 K after the inclusion of the bending strain are shown in Figure 5(a) and (b), respectively. The whole FLD space can be distributed into the Tension-Compression (T-C) region, Tension-Tension (T-T) region, and plane-strain (P-S, minor strain = 0) region. The point of intersection between the experimental FLD and the P-S axis is known as the FLD0. This point can also be used for representing the formability of the material. At 300 and 673 K, the FLD0 has been found to be 0.386 and 0.458, respectively. The FLD0 displayed an improvement of approximately 17.26% with an increase in the temperature from 300 to 673 K. The lubricated condition has been used during the experimental stretch forming process; hence in the T-T region, the strain ratios (α) obtained are 0.72 and 0.63 at 300 and 673 K, respectively. On reducing the width of the specimens, the strain path, marked by differently colored long arrows, shifted toward the T-C region. The D-4 specimen exhibited deformation near the P-S region at both of the temperatures.
FLD at (a) 300 K and (b) 673 K.
The experimental fracture forming limit diagram (FFLD) has also been evaluated using the same stretch formed specimens at 300 and 673 K temperature. Silva et al. 51 reported large errors in the direct measurement of the major fracture strains (ε1f) because of the inhomogeneous deformation around the crack region. Thus, the volume consistency equation has been followed for evaluating the fracture strains of the specimens. 52 No significant stretching of the material in the lateral direction across the necked region has been observed after the appearance of necking in the specimens at both of the temperatures. Rather, the thinning of the specimens took place because of the excessive strain localization. Thus, the minor fracture strain (ε2f) has been assumed to be equal to the necking strain (ε2n). Further, the fractured specimens were cut in the perpendicular direction of the fracture line as shown in the representative diagram (Figure 6). The thickness (tf1 and tf2) across the maximum thinned region has been measured and the minimum of the two thicknesses has been considered as the fracture thickness of the specimen. The true strain along the thickness direction has been measured as (ε3f = ln(tf/t0)), where tf = min(tf1, tf2) and t0 = initial thickness of the sheet. Thus, the major fracture strain has been estimated using the equation (ε1f = −ε2f − ε3f). For each specimen, several fracture points have been collected and represented in the plain stain space. A curve passing below each cluster of fracture data points has been drawn and named as experimental fracture forming limit diagram (FFLD).
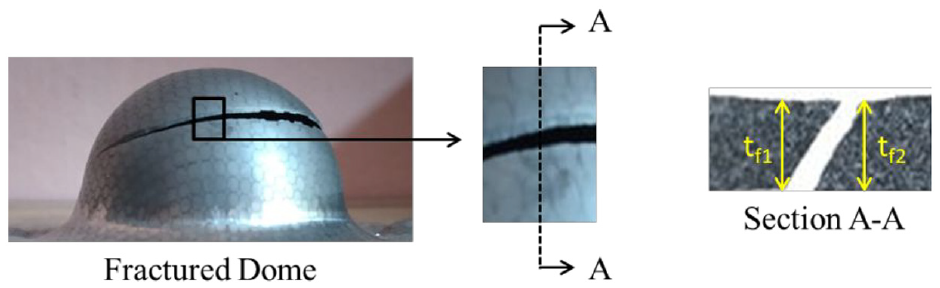
Thickness measurement through the thickness direction of the fractured dome.
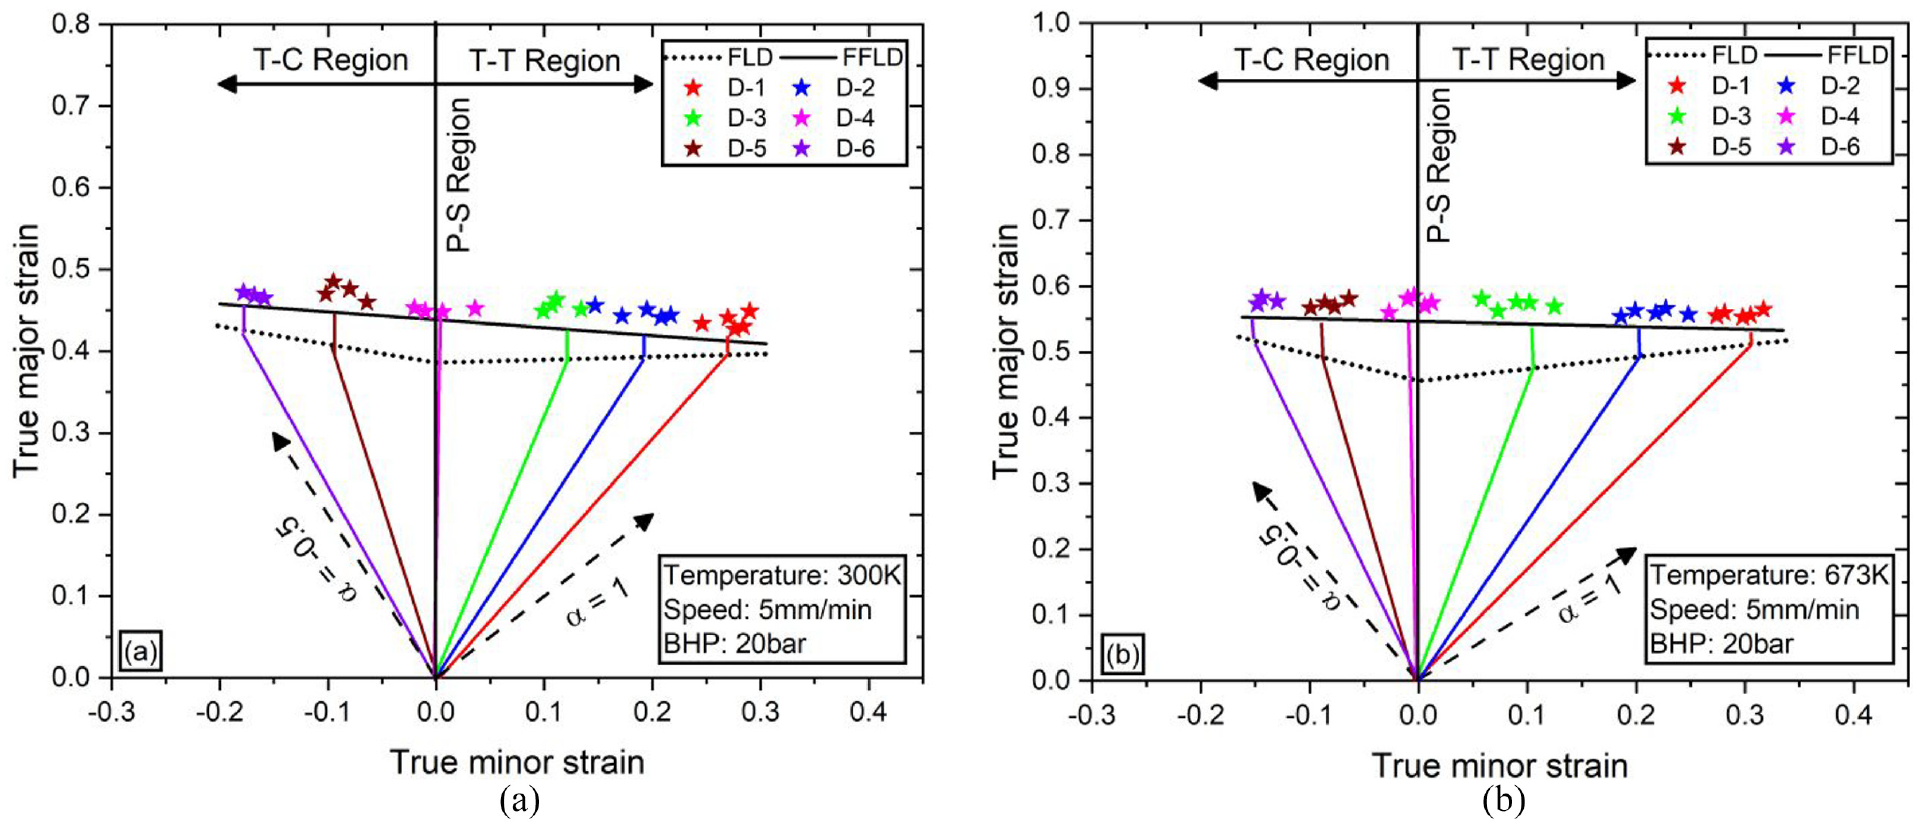
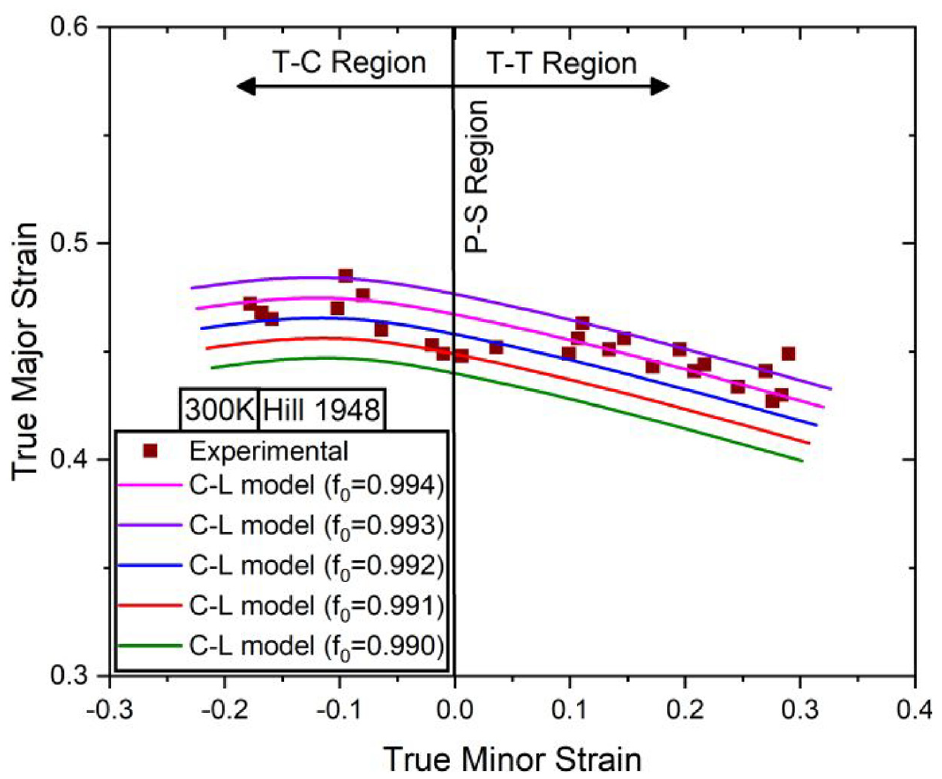
The FFLDs of IN625 alloy at 300 and 673 K have been estimated and are shown in Figure 7(a) and (b) respectively. The estimated fracture points have been fitted with the help of a straight line in the principle fracture strain locus also known as the FFLD. Table 5 represents the maximum safe forming major strains for IN625 alloy. The fracture limits of the material improved by approximately 22.22% as the forming temperature increased from 300 to 673 K.
FFLD at (a) 300 K and (b) 673 K.
Safe forming and fracture major strains obtained from the specimens deformed along different deformation paths.
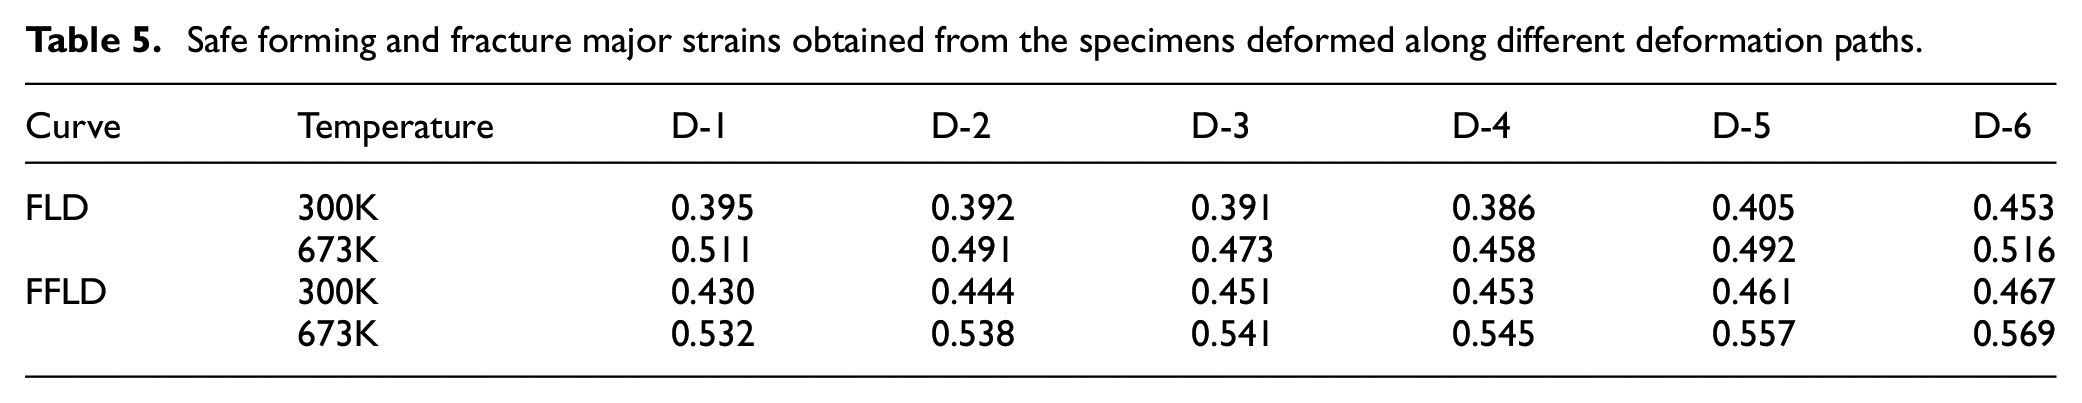
The theoretical prediction of the FFLD has been done using a modified MK model. The curve predicted using the MK model is highly sensitive to the assumed inhomogeneity factor (f0). A proper theoretical FFLD can be obtained only if an appropriate value of f0 has been chosen before running the whole modified MK model algorithm. A detailed representative figure for the prediction of the FFLD using a modified MK model by introducing a combination of the Cockcroft and Latham damage model and Hill 1948 criterion into the MK model at 300 K is shown in Figure 8. The FFLD found using the modified MK model with f0 to be 0.992 followed the experimental fracture locus with the highest accuracy. A similar trial and error process needs to be performed to find the appropriate f0 value while implementing the modified MK model using different combination of damage models and yielding functions to find the accurate and best fitted FFLD. The material constants (Table 5) for different ductile damage models shown in equations (32)–(39) have been calibrated at both 300 and 673 K using the Hill 1948 and Barlat 1989 yielding functions in order to find the fracture strains using the stretch forming process. The finalized f0 value after applying the trial and error approach for all of the cases is shown in Table 6.
Representative figure to find appropriate f0 value using the trial and error approach.
Material constants for different damage models.
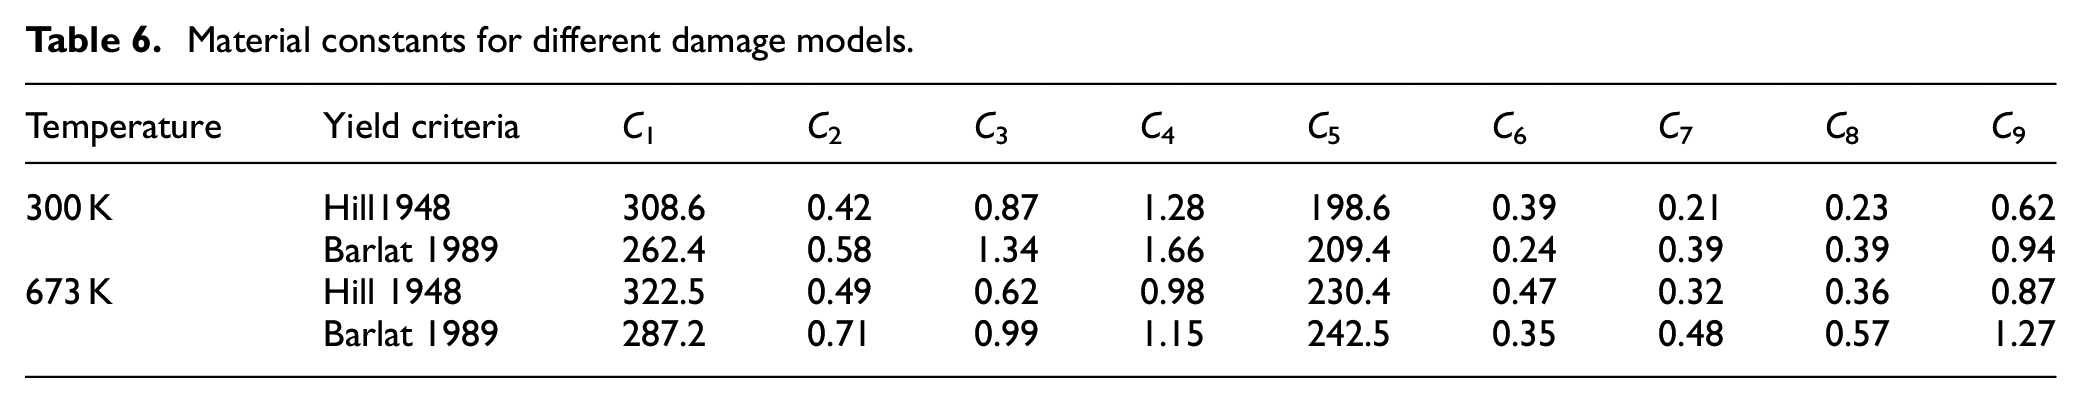
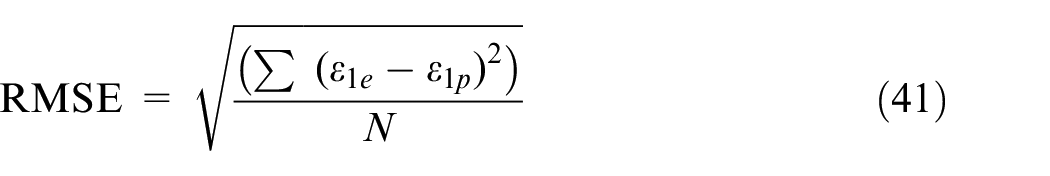
Figure 9 shows the theoretical fracture limits predicted with the help of the modified MK model using different ductile damage models and yielding functions at 300 and 673 K. These fracture loci have been predicted using the f0 value shown in Table 7. Notably, none of the utilized models is able to accurately predict the fracture limits (on comparing it with the experimental results) in any of the graphs shown below. Different models seem to predict the fracture limits accurately in the different regions of the FFLD. Thus, to confirm the damage model having best prediction ability of fracture strains while applying the modified MK model, the root mean square error (RMSE) has been calculated using equation (41) in each case.
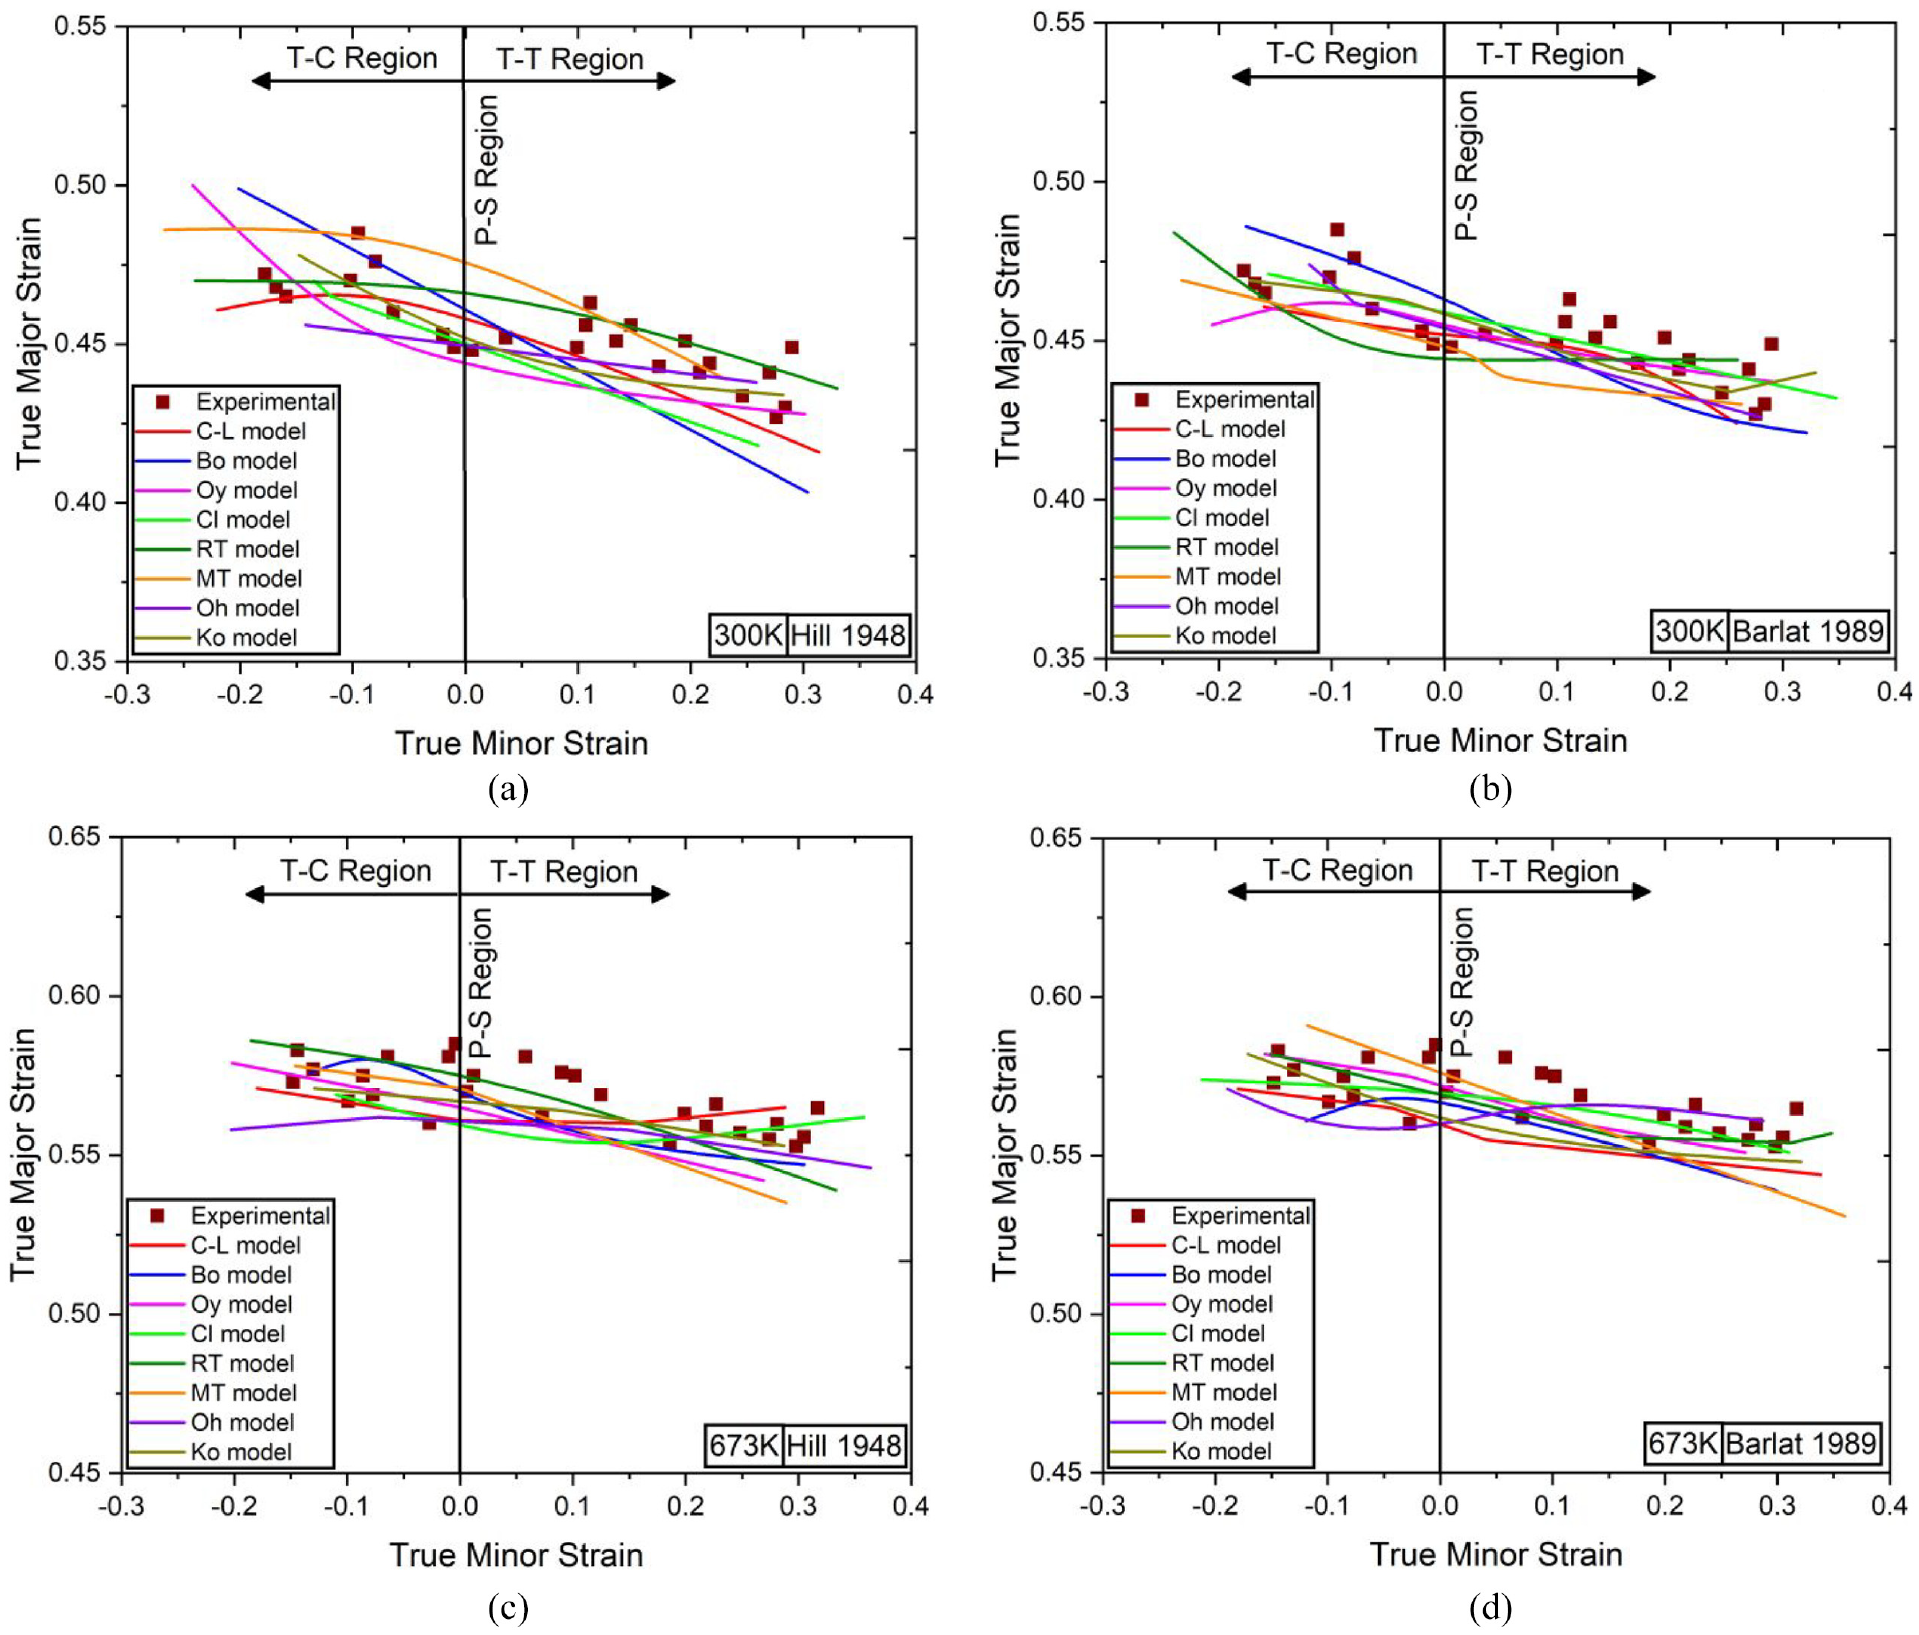
Prediction of theoretical FFLD using modified MK model in case of (a) 300 K, Hill 1948, (b) 300 K, Barlat 1989, (c) 673 K, Hill 1948, and (d) 673 K, Barlat 1989.
Finalized f0 value for all the considered combination of ductile damage models and anisotropic yield criterion.
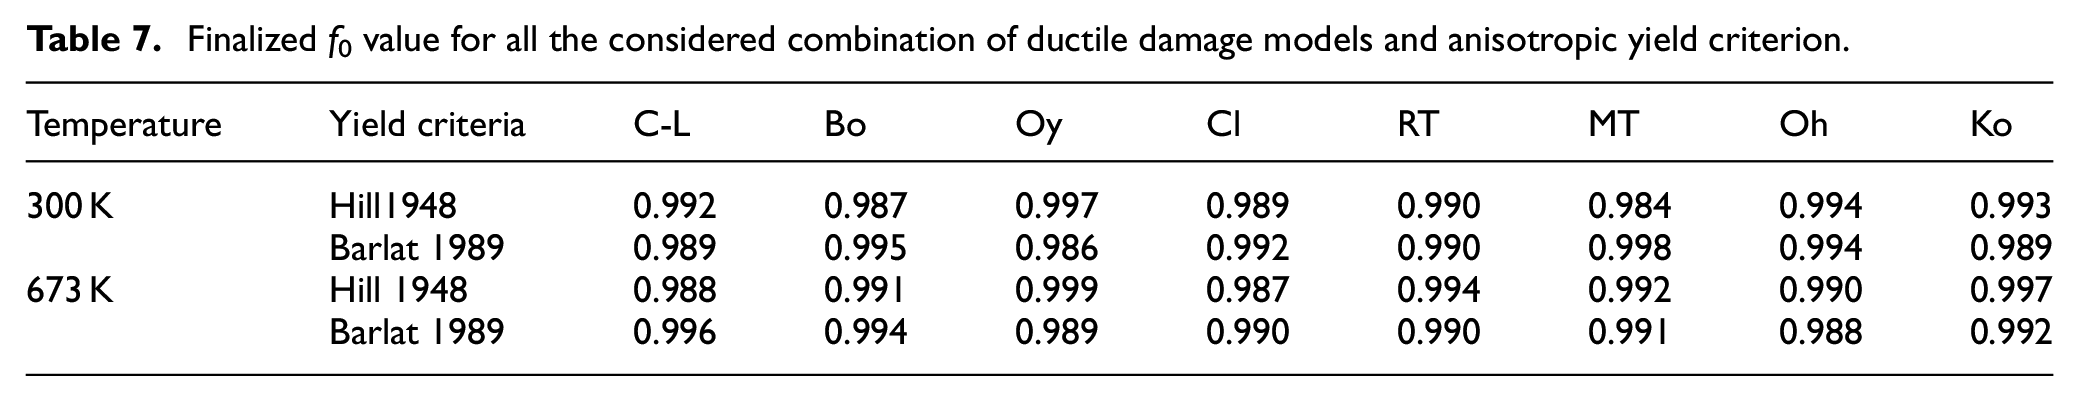
Figure 10 shows the RMSE obtained using the modified MK model by incorporating different ductile damage models and using the Hill 1948 and Barlat 1989 yielding functions at 300 and 673 K. At 300 K, the Cockcroft and Latham (C-L) model displayed the least RMSE while predicting the fracture limits using both of the yielding functions. However, at 673 K, the C-L model had the best prediction only in the case of the Barlat 1989 criterion. On considering the overall average of RMSE, the C-L model (RMSE = 0.062) best predicted the results and hence should be preferred when predicting the theoretical fracture limits. The Oyane (Oy, RMSE = 0.134) and Oh (RMSE = 0.137) models also predicted results with high accuracy, though not as high as the C-L model, and can also be used for predicting the FFLD. Further, the Brozzo (Bo, RMSE = 0.183) model displayed the highest overall average RMSE; hence, it should be least preferred to predict the fracture limits. The combination of the C-L damage model and the Barlat 1989 yield criterion has been found to predict the theoretical fracture limits of IN625 alloy with the highest accuracy using the modified MK model.
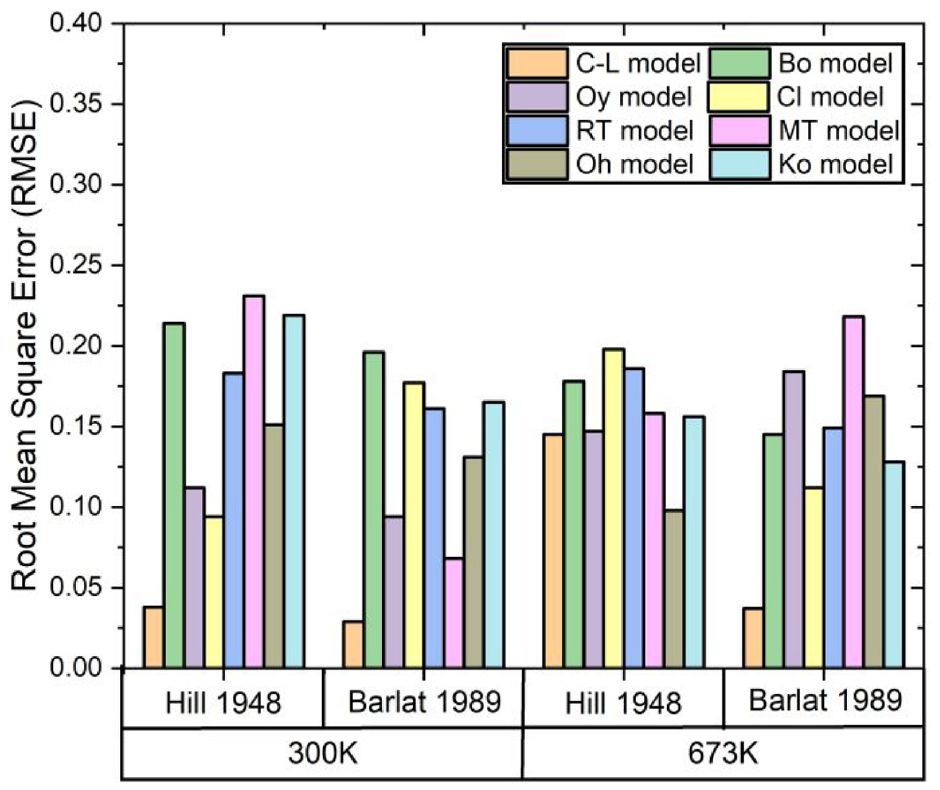
RMSE obtained in case of different considered cases.
Conclusions
In the present study, the experimental forming and fracture limits have been evaluated using the stretch forming process at 300 and 673 K using six different design specimens. On increasing the temperature from 300 to 673 K, the forming and fracture limits of the material improved by approximately 17.26% and 22.22%, respectively. The classical Marciniak and Kuczyński (MK) model has been modified by introducing eight different ductile damage models into it for the prediction of fracture limits using the Hill 1948 and Barlat 1989 yielding functions. This study helped in finding the best combination of the ductile damage model and yield criterion for the theoretical prediction of the FFLD using the modified MK model. Among the 16 different combinations of ductile damage models and yielding functions, the Cockcroft and Latham (C-L) damage model along with the Barlat 1989 yielding function best predicted the theoretical FFLD with the smallest average root mean square error (RMSE) of 0.033. Some of the other models, namely, the Rice-Tracey, Brozzo, McClintock, and Ko models, displayed an average RMSE beyond the acceptance limit, and hence, they should be the least preferred for the prediction of fracture limits while using the modified MK model.
Future work involves the further improvement of the modified MK model by introducing the critical thickness imperfection effect, which will be related to the equivalent plastic strain, initial grain size, and surface roughness, as these factors play an important role in the critical sheet metal forming process. Also, effect factors such as the initial groove angle, sheet thickness, and strain hardening coefficient, strain rate sensitivity, constitutive model, advanced yield criteria, and inhomogeneity factor over the predicted fracture limit diagram using the modified MK model will also be communicated in the future.
Footnotes
Appendix
Declaration of conflicting interests
The author(s) declared no potential conflicts of interest with respect to the research, authorship, and/or publication of this article.
Funding
The author(s) disclosed receipt of the following financial support for the research, authorship, and/or publication of this article: The authors express their sincere gratitude toward Science and Engineering Research Board, Government of India (ECR/2016/001402) and BITS-Pilani, Hyderabad Campus for financially supporting the present work.