
Abstract
Ductility and tensile strength are among the basic mechanical properties of polymers. Generally, it is difficult to enhance the ductility without significantly reducing the tensile strength. In this study, thermoplastic polyurethane (TPU) is mixed with 0%, 2.5%, 5%, 7.5%, 10%, and 12.5% polyamide 6 (PA6). The results show that the sample containing 100% TPU has the largest elongation of 690.5%. When PA6 is added, the elongation decreases gradually to 635.0%, 623.1%, 529.5%, 476.0%, 391.3%, and 242.8%, corresponding to 2.5%, 5%, 7.5%, 10%, 12.5%, and 100% PA6, respectively. The tensile strengths are 36.7, 33.8, 29.4, 26.5, 23.1, and 24.9 MPa, corresponding to 0%, 2.5%, 5%, 7.5%, 10%, and 12.5% PA6 samples, respectively. The tensile strength decreases gradually when the PA6 content is increased. Notably, the tensile strength of the 12.5% PA6 sample increases compared to the 10% PA6 sample. In addition, the hardness of the TPU/PA blend increases slightly as the PA6 ratio is increased. Finally, scanning electron microscope images demonstrate that PA6 particles act as particles dispersed or dissolved in TPU/PA blends.
Introduction
Blended polymers can be used to prepare compounds that possess the advantages of all the components. However, in immiscible blends, adhesion does not usually exist, resulting in less desirable mechanical properties. Tensile strength and ductility are among the most important mechanical properties of polymers. In many cases, we need high values of both properties. For example, shoe soles often use thermoplastic polyurethanes (TPU) because of their flexibility and high elasticity. For customers to feel comfortable wearing shoes, people often improve the elasticity of the shoes. Nevertheless, there are several challenges to increasing the strain without losing the tensile strength, and vice versa, which significantly limit the applications of blended polymers.
TPU has a unique combination of toughness, good elastic properties, high wear resistance, surface adhesion, flexibility, and biodegradability, making them suitable materials for use in a wide variety of products.1–5 TPU is a thermoplastic elastomer composed of linear, segmented block copolymers with hard and soft segments.6–9 During the solidification process, phase separation always occurs due to the non-miscibility of the hard segments with the soft ones. Furthermore, as TPU has good compatibility with polarizing thermoplastics, many polymers can be mixed with TPU to create new blended polymers.10–12
Ma et al. 13 indicated that blended polymers of ethylene vinyl acetate (EVA) and TPU are rarely investigated owing to their poor compatibility. The SEM results showed many large particles in the EVA/TPU mixture were exposed at the surface due to the phase separation between TPU and EVA. The polybutylene terephthalate (PBT) and TPU mixture can be prepared by melting. The crystallinity of PBT decreased as the TPU content increased. Furthermore, blending with TPU does not change the crystal structure of PBT as TPU mainly occupies the PBT spherical region alternating in the mixture. Interestingly, PBT toughness showed marked improvement with the addition of TPU. Tehran et al. 14 indicated that TPU and clay nanoparticles could be blended with PBT to improve impact strength, but it led to a decrease in tensile strength and elastic modulus.
Polyamide 6 (PA6) is an engineering plastic with excellent mechanical properties, elasticity, and wear resistance; however, its disadvantage is the low impact strength.15–18 Several researchers have added TPU and other materials to improve its impact strength. For example, Chiu et al. 19 tried to improve the impact strength and viscosity of PA by blending two elastomers, TPU and POE-g-MA, in the PA matrix. The results indicated that POE-g-MA significantly enhances the impact strength of PA. Chen et al. 20 studied TPU/PA6 blends with EVA-g-MAH and conductive carbon black, prepared using a twin screw extruder. The results showed that EVA-g-MAH not only improves blending compatibility but also enhances mechanical properties. Cai et al. 11 reported that the elongation at break of the TPU/PA6 mixture increased significantly from 1150% (neat TPU) to 1350% (7.5 wt.% PA6) and 1375% (10 wt.% PA6), without decreasing the tensile strength. Besides, Zhang et al. 21 improved the impact strength of PA1010 by adding thermoplastic polyester urethane elastomer (TPU). The results showed that the notched impact strength of the TPU/PA1010 blend was higher than that of neat PA1010, and its fracture surfaces had a ridged and oriented structure. In addition, when the TPU content is 20 wt.%, there is a brittle-tough transition with a new toughening mechanism. Pan et al. 22 studied the partial compatibility of PA52/TPU blends with a PA52/TPU ratio of 50/50. As a result, the PA52/TPU composite containing 6 wt.% of EVA-g-MAH exhibited optimum mixing properties and excellent mechanical properties.
Most of the existing studies considered the solution state; however, very few studies have focused on more convenient industrial fusion mixing methods.23–30 Our work elucidates on both the theoretical study and practical application of polymer mixtures. Blending TPU with PA6 will provoke the self-assembly of new hydrogen bonds and affect the hydrogen bonding distribution in the TPU.
Materials and methods
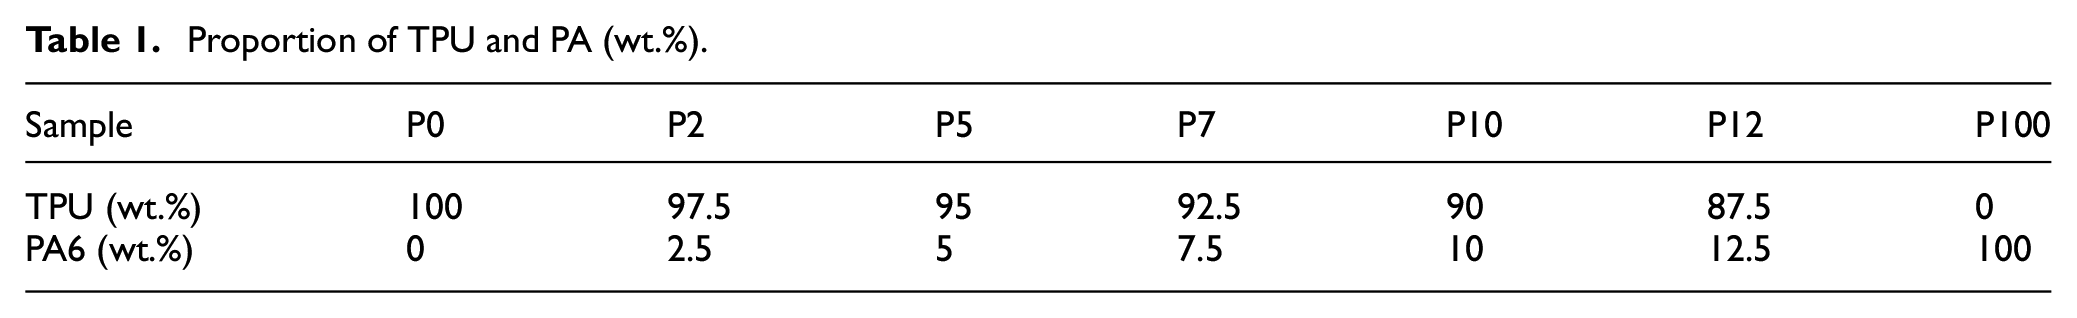
TPU resins (HD-E29013) and PA6 resins (F-X9190) from Shandong Huada Chemical New Materials, China, provided by Thuan Thang Plastic Co., Ltd. was used for the experiment. The samples consisting of TPU and PA resins were mixed in the ratios given in Table 1. The resins are dried for 10 h at 80°C before being injected by a vertical plastic injection molding machine (TKC) as shown in Figure 1.
Proportion of TPU and PA (wt.%).
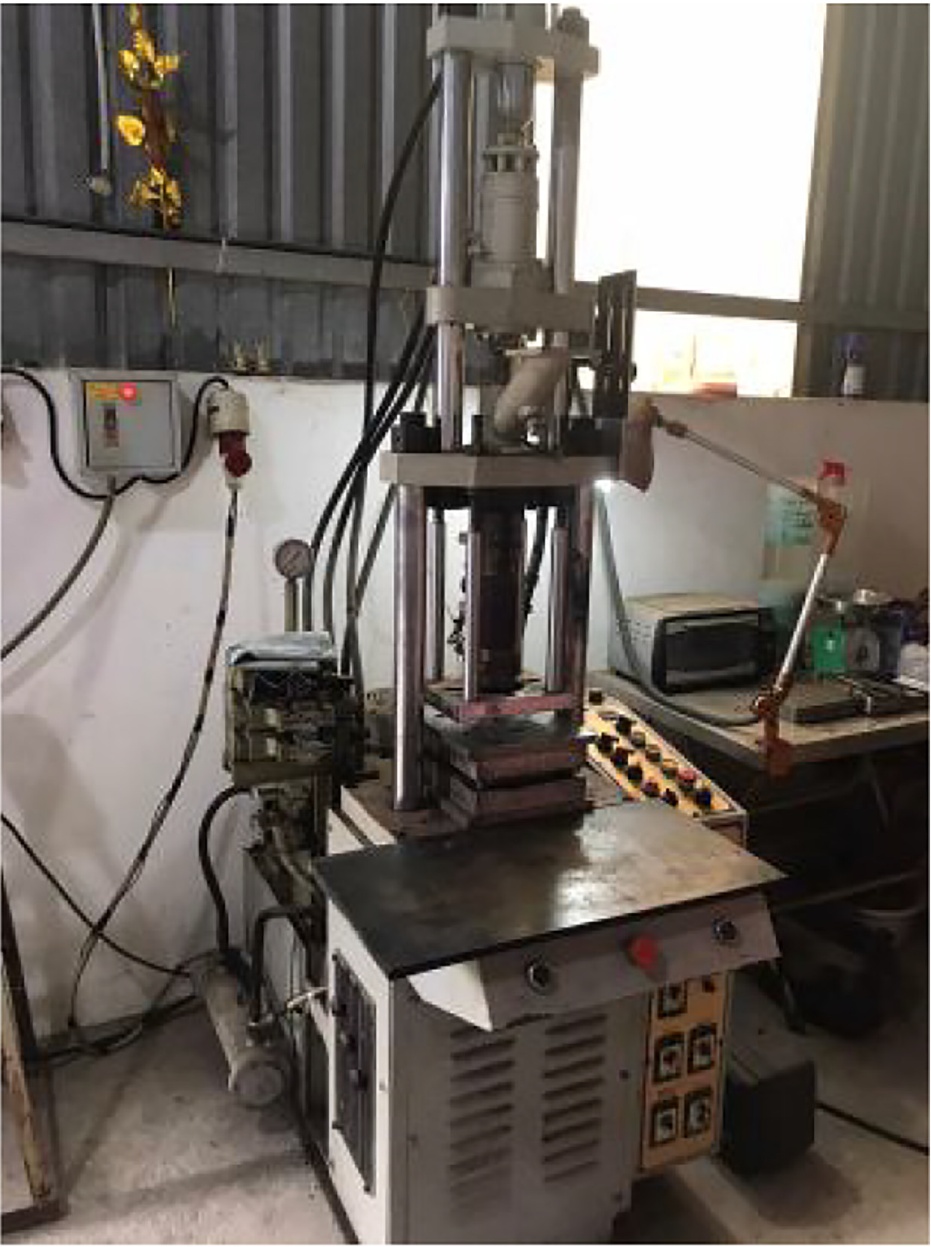
Vertical plastic injection molding machine (TKC).
The tensile strengths of the samples are determined according to ASTM D638. The samples are classified into six groups with four samples per group. Before testing, we smoothened the edges of the sample and cleaned them so that they are free of oil, grease, and other impurities. Then, they are retained at a temperature of 23°C ± 20°C and humidity of 50% ± 5% for at least 40 h before conducting the test.
The elongation is calculated based on ASTM D638-02. The sample is machined to the standard dimensions, as shown in Figure 2. Tensile tests are conducted at the Plastic Rubber Testing Center in Ho Chi Minh City, and the tensile speed is 50 mm/min at 30°C. The test is performed on a universal Shimadzu Autograph AG-X Plus 20 kN (Japan) with a high-resolution camera (1.8 μm). It has the following specifications: maximum test capacity of 20 kN, speed range 0.001-1600 mm/min, speed accuracy: ±0.1% of test speed, operating temperature 5°C-50°C, and a data acquisition rate of 1000 Hz.
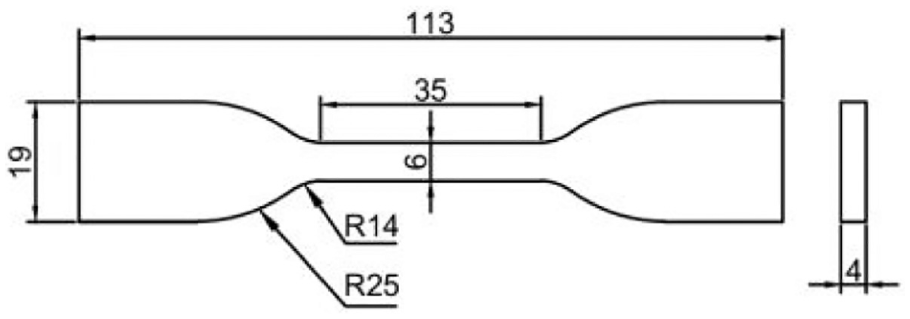
Sample size of the tensile test.
To determine the Shore D hardness, the samples are tested according to the ASTM D2240-05 standard by using a hardness measuring device TECLOCK GS-702N, as shown in Figure 3.
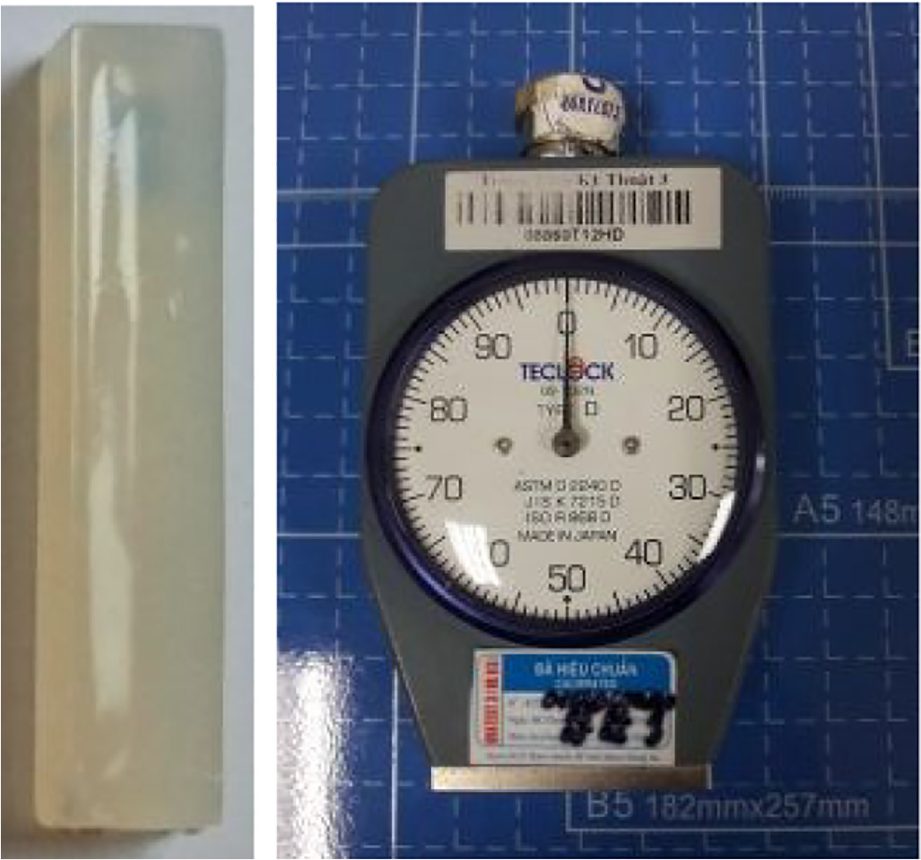
Hardness test sample and SHORE D TECLOCK GS-702N testing machine.
A HITACHI S-4800 high resolution scanning electron microscope (SEM) shown in Figure 4 is used to observe the microstructure.
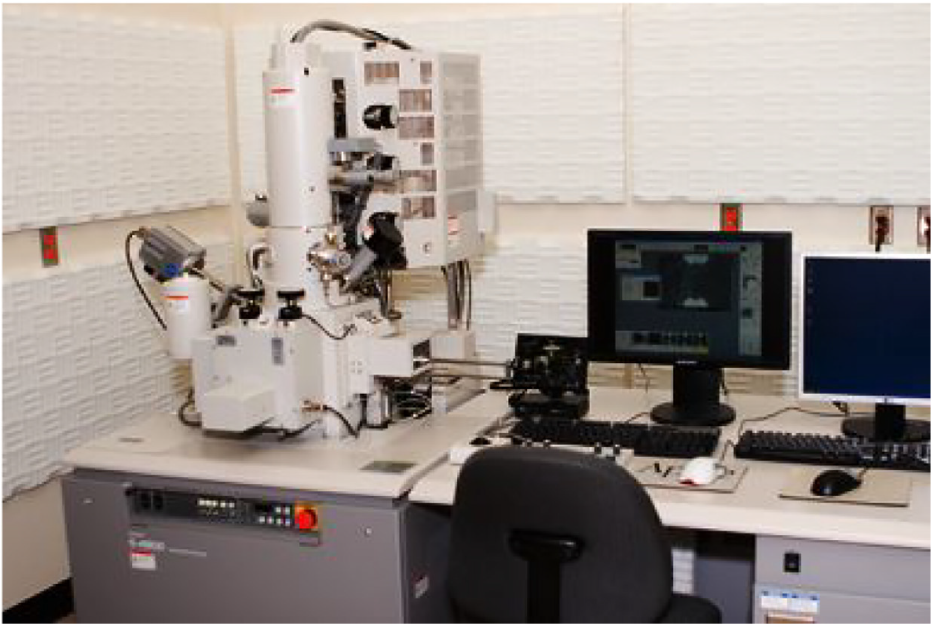
SEM HITACHI S-4800.
Results and discussion
Specimen details
Figure 5 shows the samples obtained from injection molding with different proportions of PA. The neat TPU sample has a clear white color. The higher the proportion of PA6, the more opaque the specimen; meanwhile, the neat PA6 model has a yellowish color. TPU and PA6 are linked by hydrogen bonds. Therefore, after injection, the samples often show surface pitting.
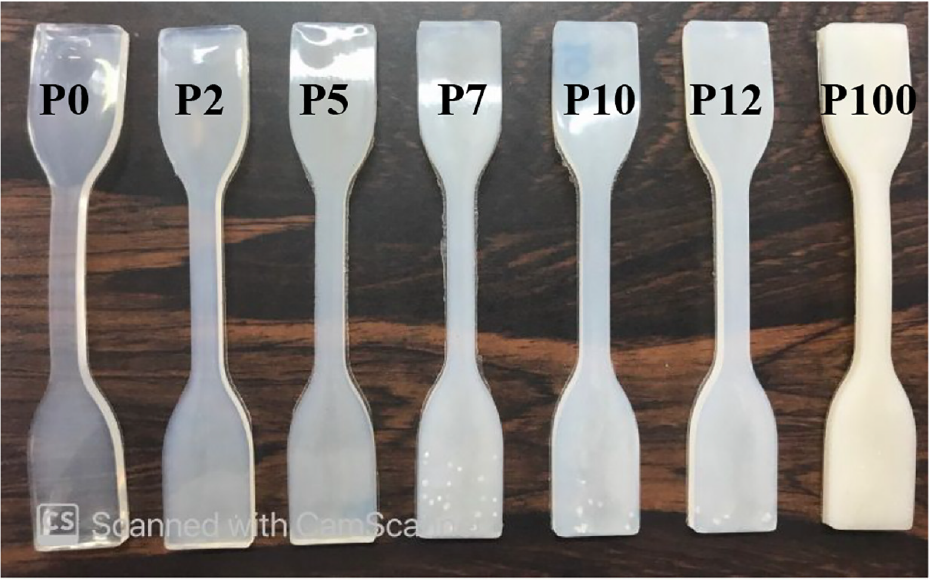
Specimens used for testing.
Materials with suitable Hildebrand dissolution parameter values are considered miscible, and this parameter can be estimated using methods developed by Cai and Jackson.11,27 Polymers with dissolution parameter circumference is close to or less than 2.04 MPa1/2 are considered highly compatible. For example, Cai et al. 11 showed that the perimeter of the solubility parameter of the hard chain segments of TPU and PA6 is 2.8 MPa1/2. At the same time, the circumference of the TPU and PA6 soft chain segment is 1.3 MPa1/2. Both of them are close to or lower than 2.04 MPa1/2. Therefore, we can conclude that TPU and PA6 are compatible. Furthermore, according to the molecular structure, PA6 has an amide group (–CONH–), and TPU has a urethane group (–NHCOO–) and an ester group (–COO–). Therefore, during the melt mixing process, the amide groups of PA6 and the ester group or the urethane group of TPU can form hydrogen bonds among the molecules, which can significantly enhance the compatibility of TPU and PA6.
Tensile strength
The samples after tensile testing and the stress-strain curves of each sample group are shown in Figures 6 and 7 and Table 2. Compared to the other samples, the neat PA6 is more brittle with a lower value of strain of approximately 242.8%, while TPU has a considerably high ductility of 690.5%. Strain results show that plastic serfdom can be assessed for TPU/PA6 blend samples, allowing to reach higher strains than for neat PA6. This means that TPU is capable of increasing the deformability of TPU/PA6 blends. De León’s study found that TPU may reach an extremely high strain close to 800%. This is related to H-bonding loss among TPU molecules, which is responsible for providing high deformability. 5
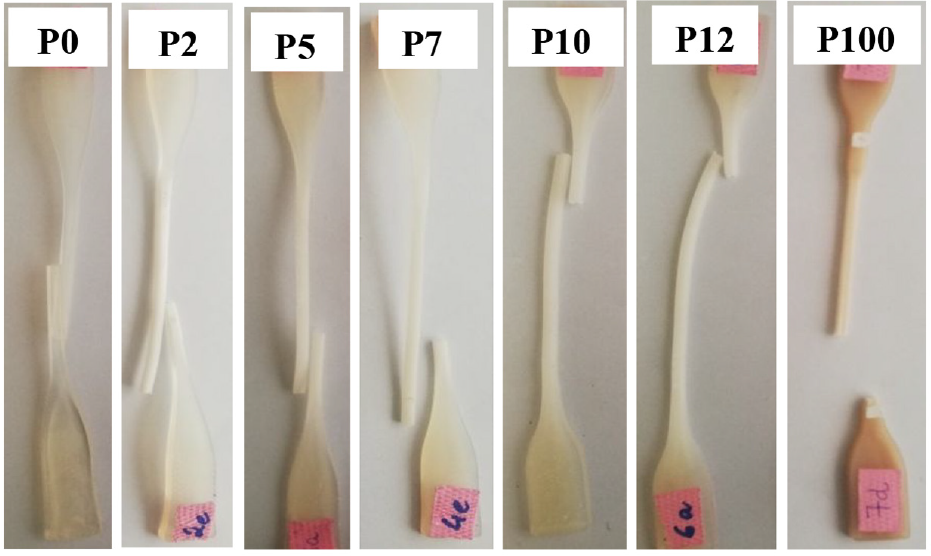
Samples after tensile testing
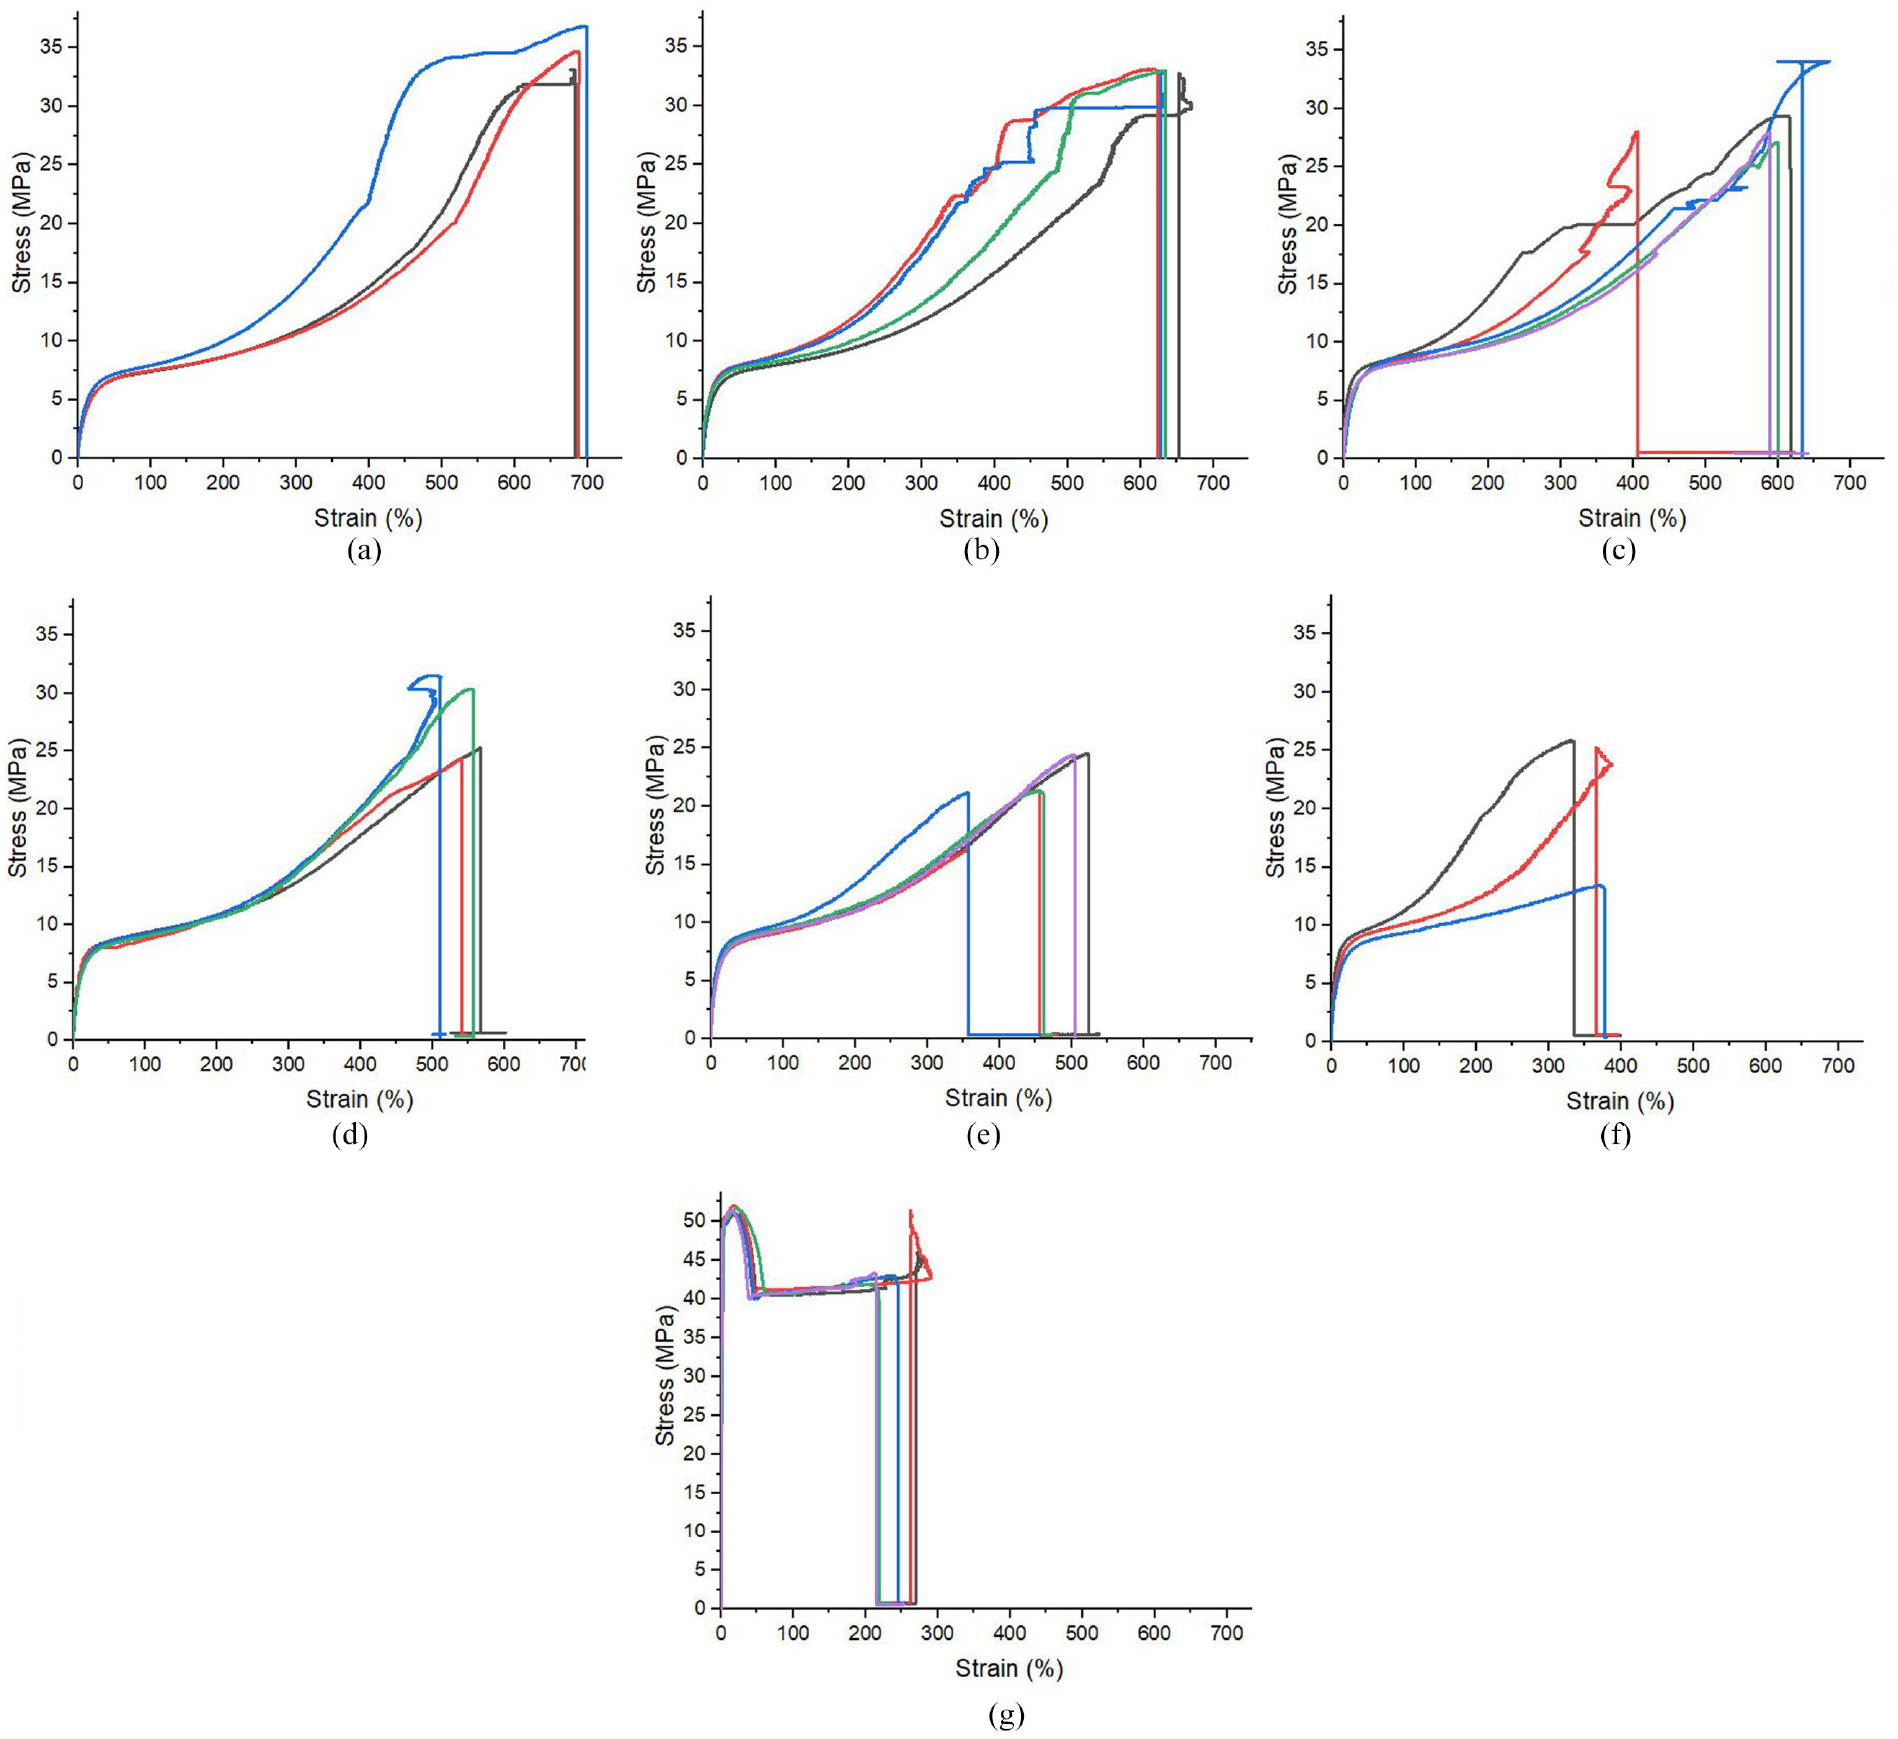
Stress-strain curve of samples. (a) 100% TPU samples, (b) TPU/2.5% PA6 blend samples, (c) TPU/5% PA6 blend samples, (d) TPU/7.5% PA6 blend samples, (e) TPU/10% PA6 blend samples, (f) TPU/12.5% PA6 blend samples, and (g) 100% PA6 samples.
Stress and strain of TPU/PA6 blends.
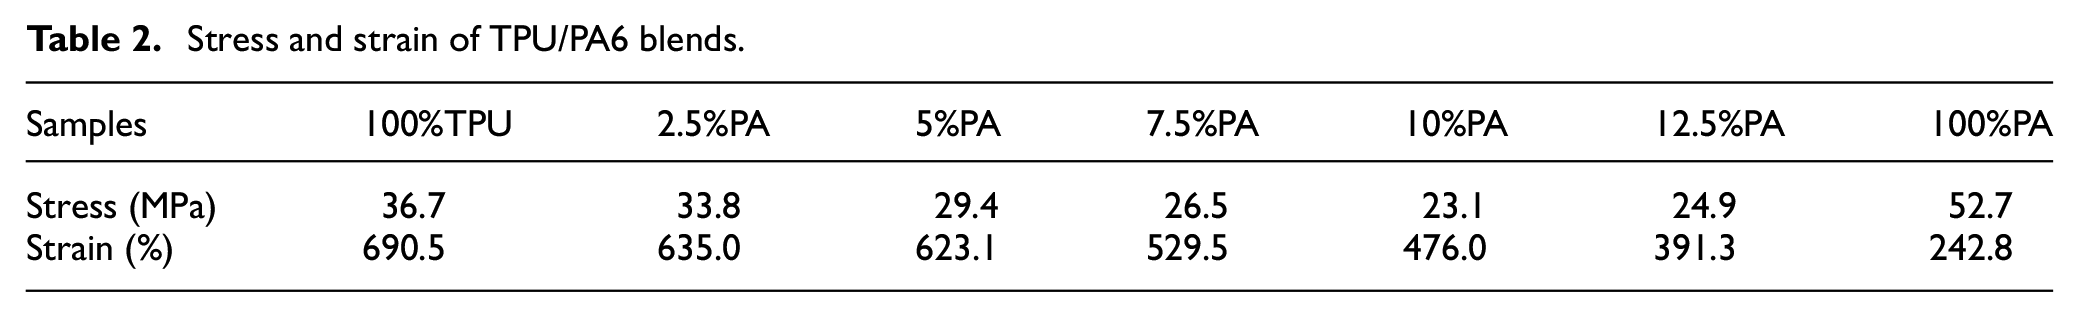
Figure 8 shows the average tensile strength of TPU/PA6 samples. The tensile strengths of the samples are 36.7, 33.8, 29.4, 26.5, 23.1, 24.9, and 52.7 MPa corresponding to P0, P2, P5, P7, P10, P12, and P100 samples, respectively. The sample containing 100% PA6 achieves the highest tensile strength, which is an outstanding characteristic of PA6 and is similar to the recent report. 19 The tensile strength decreases gradually as the PA6 content increases. Notably, in 12.5% PA6 samples, the tensile strength is higher than the 10% PA6 samples. This phenomenon can be explained by the structure of TPU that consists of microphase-separated soft and hard segments. When the PA6 content is less than 10%, most hydrogen self-assembly occurs in the soft segments. However, when the PA6 content is 12.5%, hydrogen bond self-assembly occurs more in the hard segments, leading to further structural damage. 11 In Shadi’s work, the results show a characteristic U-shaped curve for tensile strength. Incompatible blends usually show this typical U-shaped curve and a decrease in tensile strength. The degree of reduction in tensile strength is related to the mixed morphology. Blends with finer dispersion show less loss of properties. 30 Due to this fact, TPU/12.5% PA6 blend has higher tensile strength than TPU/10% PA6 blend.
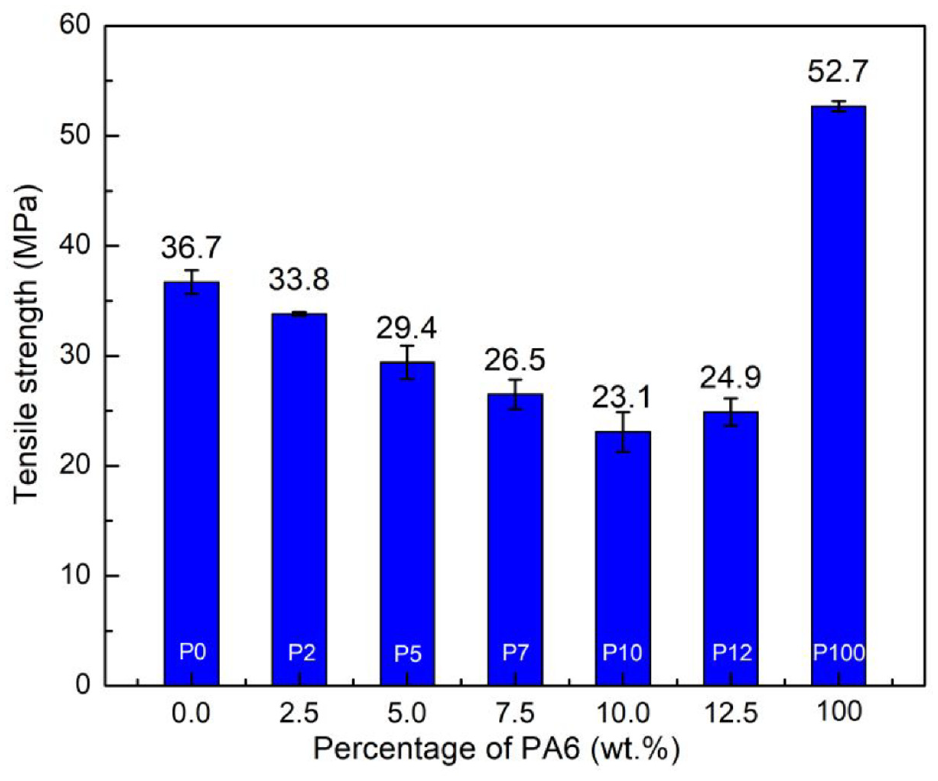
Average tensile strength of TPU/PA6 samples.
The effect of PA percentage on the elongation value is presented in Figure 9. Comparing to other samples, the neat PA is more brittle with a lower value of elongation of about 242.81%, while neat TPU has a greatly higher ductile of 690.48%. Adding PA6 will cause a decrease in the elongation 635.0%, 623.1%, 529.5%, 476.0%, and 391.3% corresponding to P2, P5, P7, P10, and P12 samples, respectively. The neat PA6 sample has the smallest elongation with 242.8%. The elongation at fracture decreases as PA6 is added to the polymer, apparently because the hard segment is gradually destroyed. On the contrary, PA6 has very low elongation, but the combination with TPU can greatly improve the elongation properties of PA6.
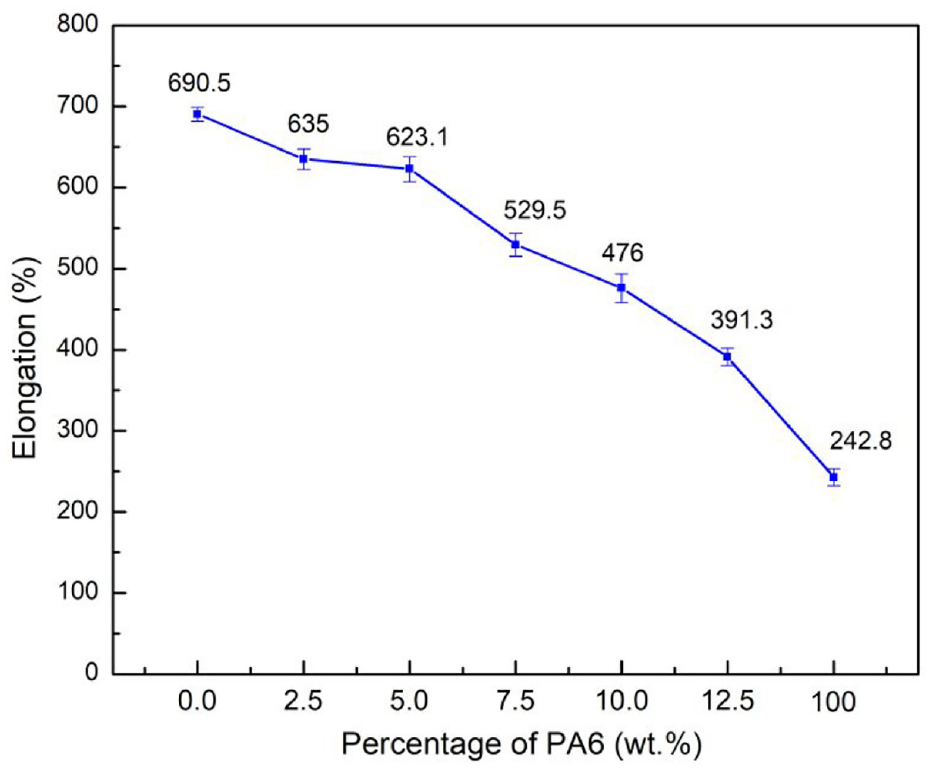
Effect of PA percentage on the elongation value.
Normally, the blend can be of no effect, total effect, or multiplication effect. PA6 is an engineering plastic with high tensile stress, while TPU is an elastomer with low tensile stress and high elongation. Chiu et al. 19 suggested that, to increase the toughness of the resin, we can use lower Tg modifier levels, smaller particles, and better compatibility with the base polymers. The elongation of the PA/TPU blend is higher than neat PA6 but lower than neat TPU and so, the blend has no multiplier effect.
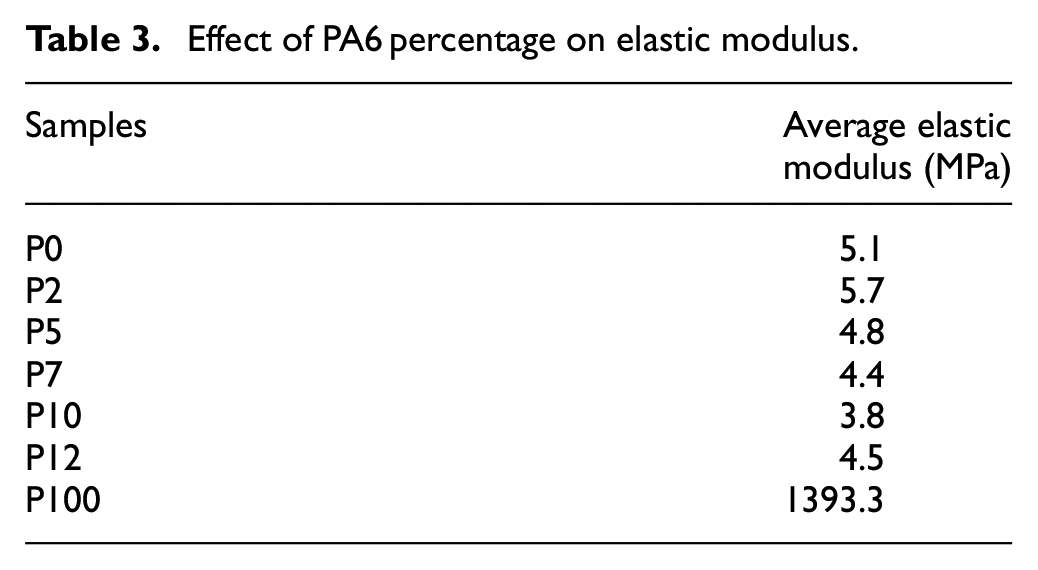
Table 3 presents the average elastic modulus of the samples. These values are nearly the same for all the samples except for the P100 sample. The elastic modulus of PA6 is extremely high, 1393.3 MPa, while TPU has a 5.1 MPa of elastic modulus, similar to the recent report.31 The TPU/2.5% PA6 blend sample has an elastic modulus of 5.7 MPa that is considerably higher than the other TPU/PA6 blend samples.
Effect of PA6 percentage on elastic modulus.
Hardness
Figure 10 shows the average hardness of the test samples. The hardness values of the P0, P2, P5, P7, P10, and P12 samples are 48.4, 49.4, 50.2, 51.8, 52.6, and 73.4 Shore D, respectively. The hardness increases slightly with the increase in PA6 content owing to it higher hardness than TPU. Terban’s 29 research indicated that the soft regions provide ductility for materials, made up of polyester or polyether chains. In comparison, the hard regions provide rigidity and elasticity through physical cross-linking. They are formed by additions to the chain, such as diols and diisocyanates. TPU properties may be adjusted by controlling parameters like the chain length of the components and swapping different components.
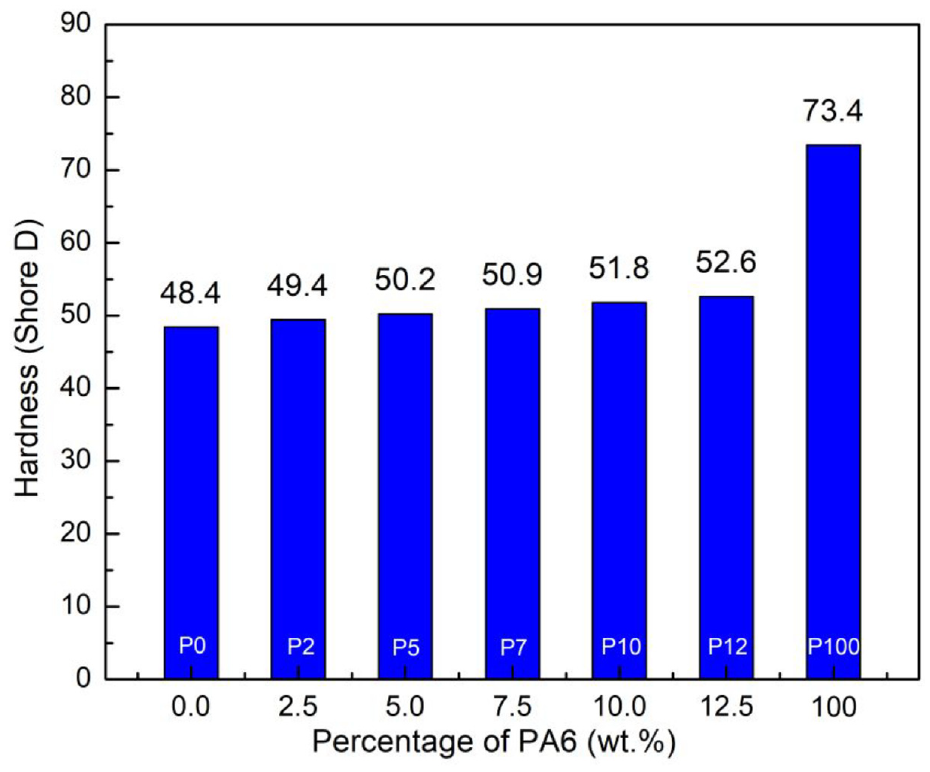
Average hardness of test samples.
SEM micrographs
Scanning electron microscopy (SEM) was used to clarify the distribution of TPU and PA. Figure 11 shows the SEM micrographs for the TPU/PA blend with different weight percentages of PA6. The higher the content of PA6, the larger the PA6 particles. Moreover, the TPU acts as a flexible matrix with PA6 particles that are dispersed or dissolved in this matrix. TPU usually acts as a hardening agent that improves the impact properties of PA6. Chiu’s 19 study showed that PA and TPU are dispersed into each other. The reason is that PA6 and TPU both have polar groups, and so, they can be compatible. However, the observations of Pan et al. 22 showed that many large particles in the TPU/PA blend remained exposed on the rough surface due to the poor compatibility between PA and TPU.
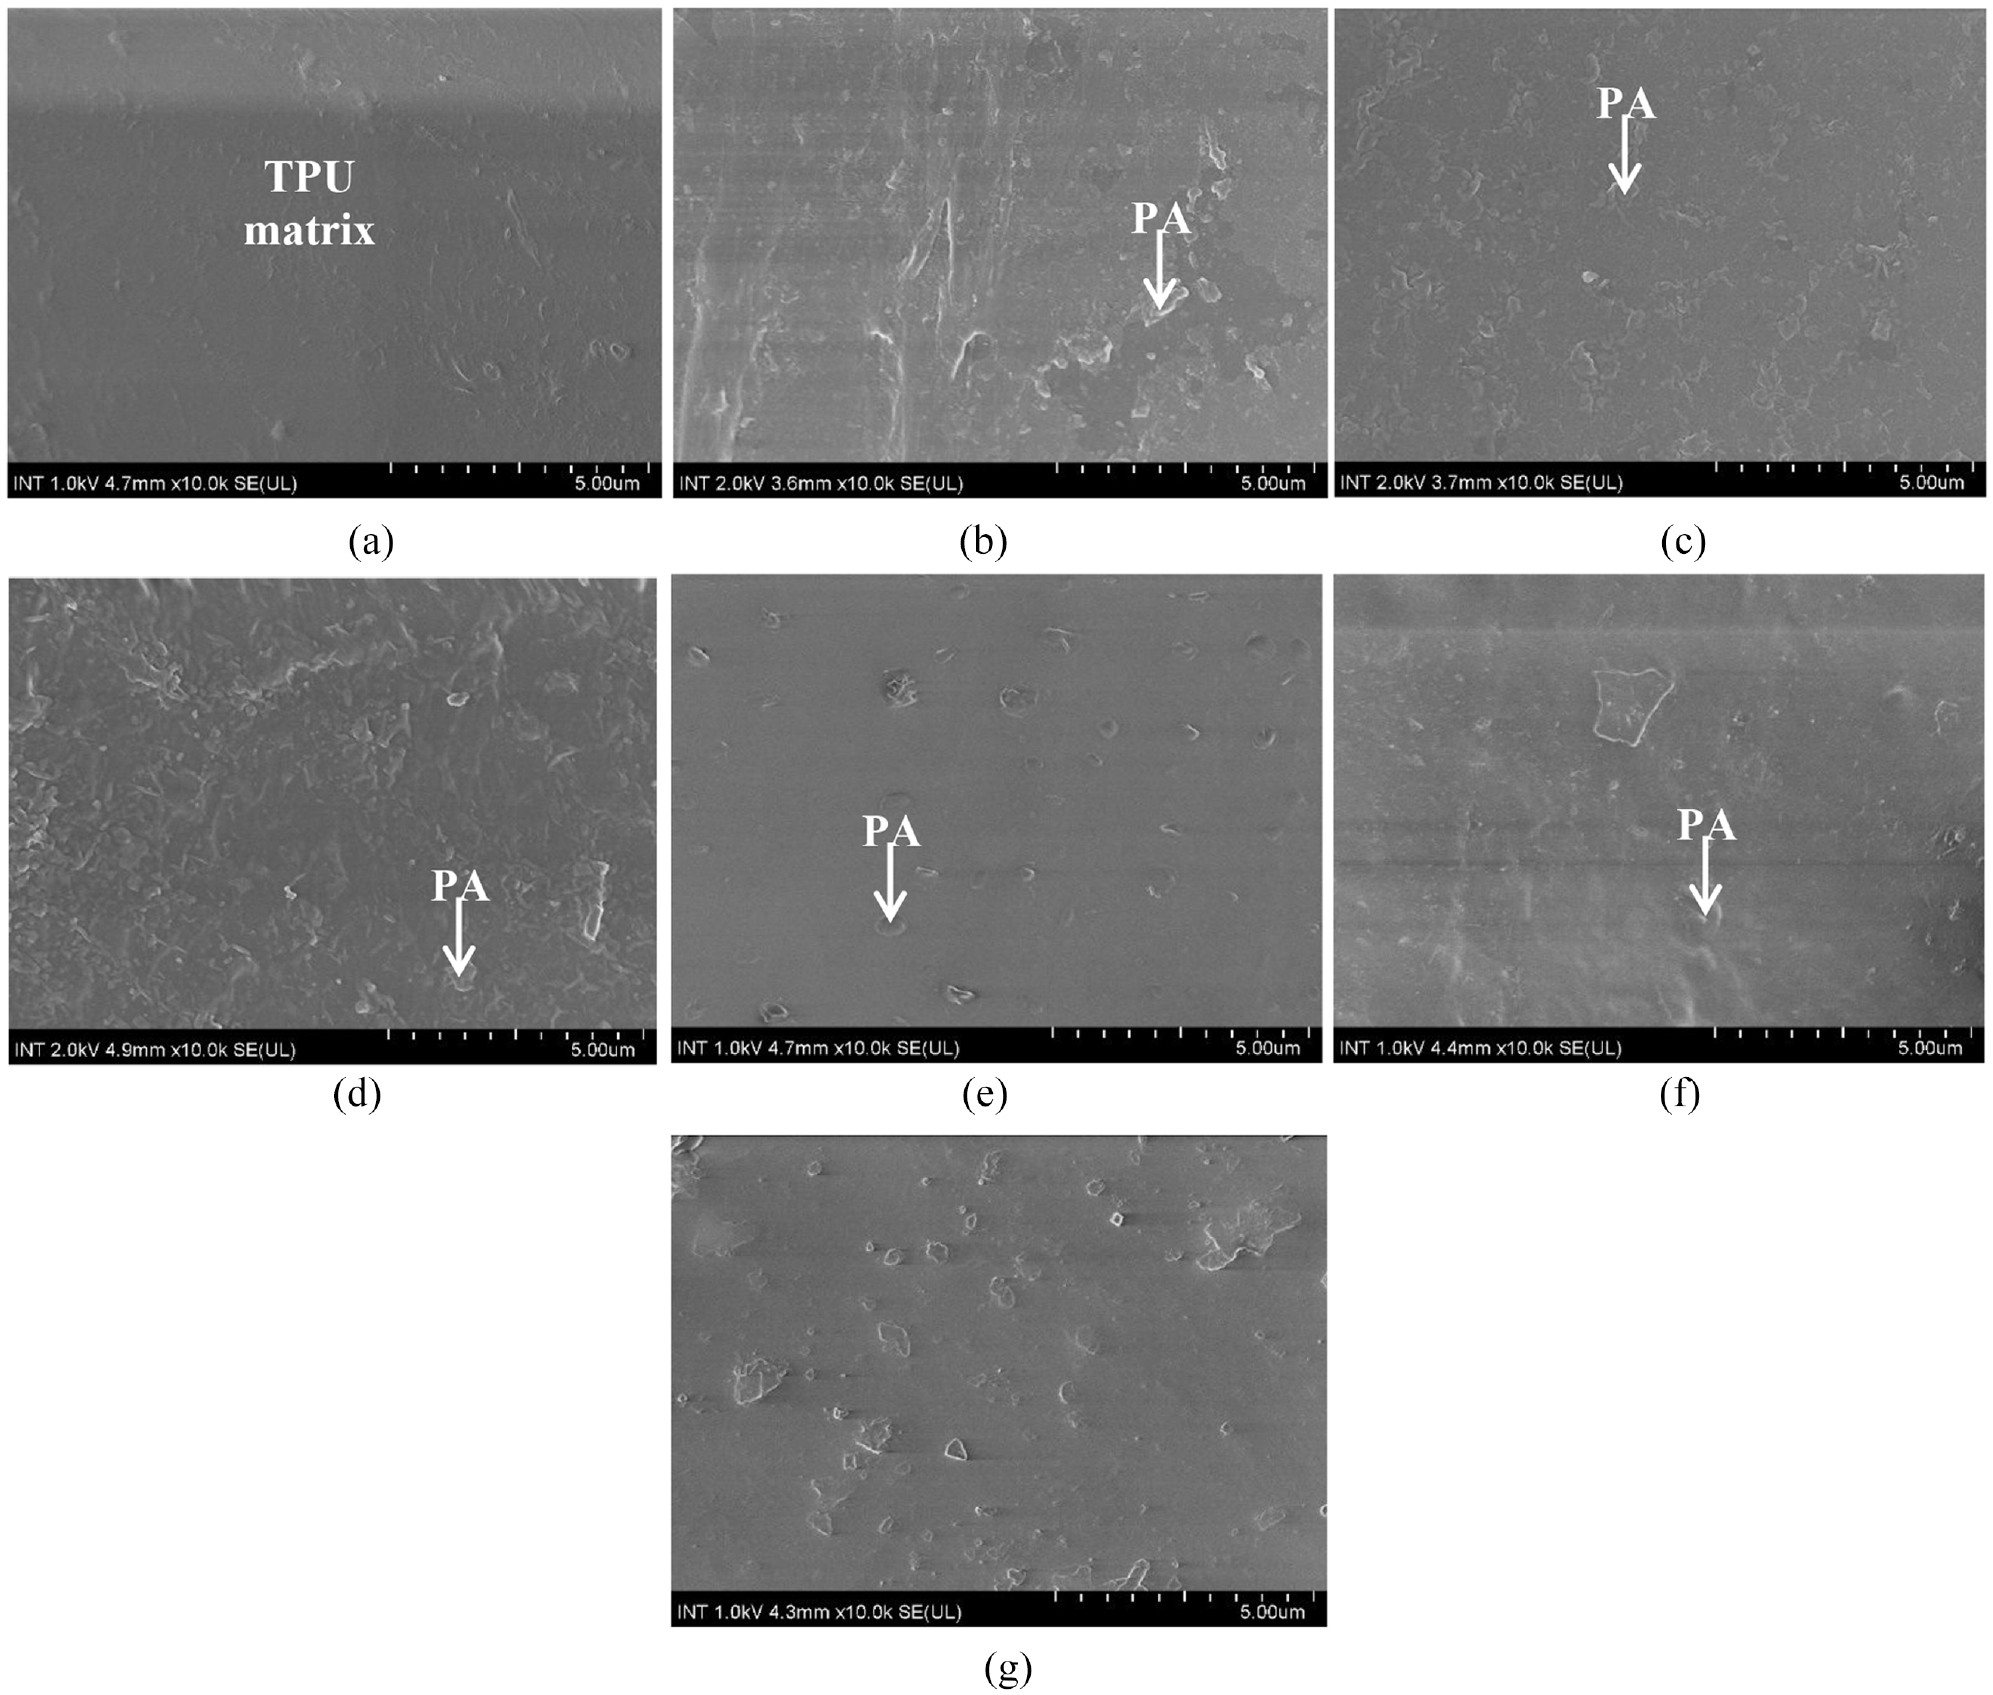
SEM micrographs for the TPU/PA blend with different weight percent of PA6: (a) 100% TPU samples, (b) TPU/2.5% PA6 blend samples, (c) TPU/5% PA6 blend samples, (d) TPU/7.5% PA6 blend samples, (e) TPU/10% PA6 blend samples, (f) TPU/12.5% PA6 blend samples, and (g) 100% PA6 samples.
TPU is a thermoplastic elastomer composed of linear, segmented block copolymers having hard and soft segments. The hard segment of TPU is [–CONHC6H4CH2C6H4NHCOO(CH2)4O–], while its soft segment is [–CO(CH2)4COO(CH2)4O–]; the PA6 component is [–CO(CH2)5NH–]. During the solidification process, phase separation always occurs due to the non-miscibility of hard segments with soft ones. As a result, the hard segments of the different molecules are connected by hydrogen bonds between the molecules (H–bonds). In contrast, the soft segments form an elastomer matrix that characterizes the elastic properties of TPU.
Figure 12 shows a schematic of the possible hydrogen-bonded self-assembly distribution process in a TPU/PA6 mixture. The self-assembled hydrogen bond distribution process in the TPU/PA6 mixture has three stages. 11 Firstly, when the PA6 content is less than 7.5 wt.%, most hydrogen self-assembly occurs in the soft segment. Then, with an increase in the content of PA6, some PA6 chains spread out, and the soft fractional mixed domain self-assembled to form bonds between the hard segmented TPU and PA6 molecular chains. The mixing increases and partially replaces the intrinsic hydrogen-bonding interaction in this region without impairing the intrinsic hydrogen-bonding interaction of the hard segment. Nevertheless, with a further increase of over 10 wt.% in the PA6 content, more hydrogen bonding self-assembly occurred in the hard segments, resulting in further structural damage. This can be also related to the dispersion of some extent of PA6 in the TPU matrix, which leads to a reduction of the cohesive energy density in this phase.
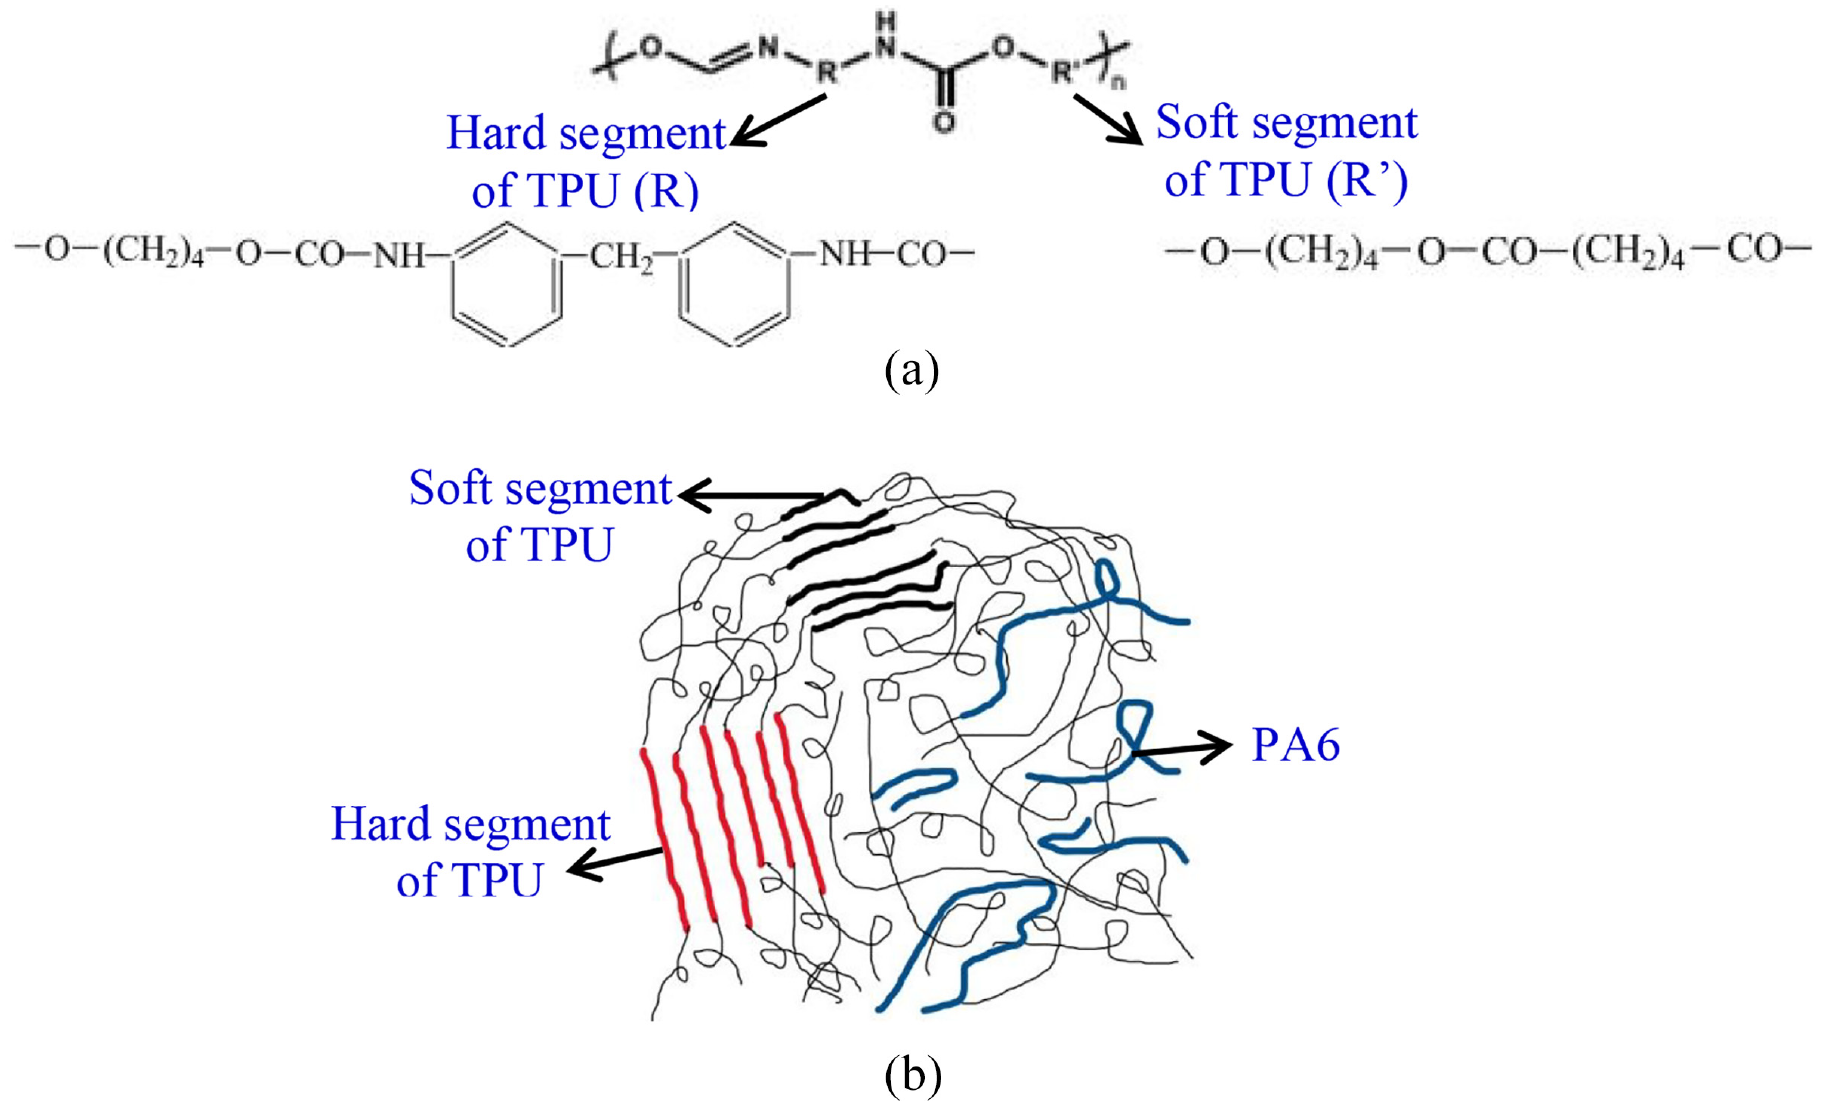
Distribution process of hydrogen-bonded self-assembly in TPU/PA6 blends: (a) hard and soft segments of TPU and (b) hard and soft segments of TPU in TPU/PA6 blend.
Conclusions
This study demonstrates that the elongation of the TPU/PA6 blends can remain consistent with the high value of the tensile strength. Specifically, the elongation values of the 0%, 2.5%, 5%, 7.5%, 10%, and 12.5% PA6 samples are 690.5%, 635.0%, 623.1%, 529.5%, 476.0%, and 391.3% respectively. The respective tensile strengths for the above ratios are 36.7, 33.8, 29.4, 26.5, 23.1, and 24.9 MPa. In which, the tensile strength of the TPU/12.5% PA6 samples increased compared to samples containing TPU/10% PA6. More importantly, the elongation of TPU/12.5% PA6 remains guaranteed. These results of the TPU/PA6 blend are pertinent for products like shoe soles that require both durability and flexibility. The hardness increases slightly on increasing the PA6 content as PA6 has a higher value of hardness than TPU. Moreover, the higher the PA6 content, the bigger the size of the particles. TPU plays a key role in creating a flexible matrix, and PA6 acts like particles that are dispersed or dissolved in the TPU matrix.
Footnotes
Acknowledgements
We acknowledge HCMC University of Technology and Education, Dong Nhan Phat Co., Ltd and Material Testing Laboratory (HCMUTE). They gave me an opportunity to join their team, accessed the laboratory and research machines. Without their appreciated support, it would not be possible to conduct this research.
Data availability
The data used to support the findings of this study are available from the corresponding author upon request.
Declaration of conflicting interests
The author declared no potential conflicts of interest with respect to the research, authorship, and/or publication of this article.
Funding
The author received no financial support for the research, authorship, and/or publication of this article.