
Abstract
Tangential ultrasonic vibration-assisted grinding (TUAG) has a wide prospect in machining difficult-to-machine materials. However, the surface generation mechanism in TUAG is not fully recovered. This study proposes an analytical model of the surface topography produced by TUAG. Based on the model, the surface topography and roughness are predicted and experimentally verified. In addition, the influence of the grinding parameters on the surface topography is analyzed. The predicted surface topography well coincides with experimental measurements, and the prediction error in surface roughness Ra by the proposed model is less than 5%. Compared with conventional grinding, TUAG produces a surface with more uniform scratches and surface roughness Ra was reduced by up to 27% with the proper parameters. However, the improvement of surface roughness in TUAG is weakened when grinding speed or depth of cut increases. Moreover, the influence of the ultrasonic vibration amplitude on the surface roughness is not monotonous. With the grinding parameters selected in this study, TUAG with an ultrasonic amplitude of 7.5 μm produces the minimum surface roughness.
Keywords
Introduction
The poor grinding performance of difficult-to-machine materials (i.e. nickel-based superalloy and titanium alloy) by using conventional grinding (CG) process limits the development of new engineering materials, especially in the manufacture of aero-engine parts.1–3 As a hybrid machining process, ultrasonic vibration-assisted grinding (UVAG) was successfully developed to achieve the high-efficiency precision machining of these materials; thus, UVAG has received extensive research attention.4–7 UVAG can be divided into many types based on the ultrasonic vibration direction in accordance with the grinding direction. In tangential ultrasonic assisted grinding (TUAG), the ultrasonic vibration direction is parallel to the grinding direction. This grinding process is similar to intermittent grinding and shows the characteristic of separability, which allows the improvement of surface quality by reciprocating the ironing of the processed surface. It is found that TUAG can effectively reduce grinding force and temperature.8,9 Meanwhile, the machinability of the workpiece material is improved due to the ultrasonic vibration.10–12 In TUAG, the surface topography and roughness are problems that cause concern. However, reports on the characterization of the surface topography ground by TUAG are fewer compared with reports on the other two types of one-dimensional ultrasonic vibration, thereby restricting TUAG’s application.
The ground surface roughness Ra greatly affects the performance of a ground part.13,14 In grinding, the final surface roughness of the workpiece is formed by the interference of the movement of multiple abrasives and is affected by the grinding parameters. 15 The reciprocation of the ironing of abrasives in TUAG reduces the height of the residual material on the processed surface. Recent studies have found that the surface roughness decreases under ultrasonic grinding conditions, but the effects of ultrasonic vibration are not apparent with uprated process parameters. The addition of high frequency vibration can expand the selection range of process parameters under poor cooling conditions, and the ideal surface roughness can still be achieved. However, the influence of ultrasonic parameters on surface roughness is not linear.16–19 Understanding the influence of grinding process parameters on ground surface roughness Ra and its mechanism is essential to the improvement of the controllability of UVAG for the achievement of the high-quality grinding of difficult-to-machine materials. Nowadays, compound machining by TUAG is not being maximized, because studies on the effect of single abrasive intermittent cutting on surface roughness are lacking. Therefore, a model to analyze the effect of ultrasonic vibration on the workpiece ground surface is highly needed.
The surface topography after machining seriously affects the performance of a part.20,21 In recent years, some scholars obtained the three-dimensional surface topography of a ground surface by simulation. Two kinds of simulation for the three-dimensional surface topography exist. In the first kind, the ground surface topography can be directly obtained by mathematical modeling. The simulation of non-Gaussian rough surfaces with various types of autocorrelation functions and large autocorrelation lengths can be combined with FFT and Johnson translator system. 22 In addition, given that the height probability distribution and power spectrum can specify both height and spatial distribution, a random surface can be generated to obtain a more realistic surface topography. 23 The second kind of simulation is based on the grinding kinematics. The shape of the abrasive has little effect on the prediction of ground surface roughness, and converting 3D cutting edges into 2D contours is performed to improve simulation speed. 24 The simulation shows that the orderly arrangement of abrasive particles leads to a better grinding performance. 25 In addition, compared with mathematical modeling of ground surface, the simulation based on the grinding kinematics is controllable. It allows further analysis of the influence of grinding process conditions on the surface topography. And it is pointed out that the modeling of the actual working surface of a grinding wheel is also important in kinematics simulation. At present, the modeling of grinding wheel surface usually simplifies the abrasive as a sphere. One abrasive represents a cutting edge, which is quite different from the actual situation. The actual state of grinding wheel can be effectively simulated by measuring the height of abrasives on the actual working surface of the grinding wheel.
This study aims to build a theoretical simulation model to predict the surface topography of workpiece processed in CG and TUAG with green silicon carbide (GC for short) abrasive wheel, respectively. The experiment involving a grinding workpiece is used to verify the reliability of the theoretical simulation model. Correspondingly, the influences of grinding parameters and ultrasonic conditions on the surface roughness Ra in TUAG can be determined.
Surface topography model
The ground surface topography is the result of the comprehensive effects of the scratching, ploughing, and cutting by the abrasive grains on the grinding wheel. To facilitate the modeling, the following assumptions are made to simplify the problem25,26:
The material can be removed as long as the GC abrasives interfere with the workpiece surface.
The influences of GC abrasive wheel wear and machine tool vibration can be neglected.
The elastic concession of GC abrasive wheel can be ignored.
The modeling of the theoretical ground surface topography is divided into two parts. 27 First, the GC abrasive wheel surface topography is represented by a mathematical model with abrasive wheel parameters. Then, the ground surface topography is simulated by combining the GC abrasive wheel surface information and abrasive kinematic analysis. The simulation flowchart is shown in Figure 1.
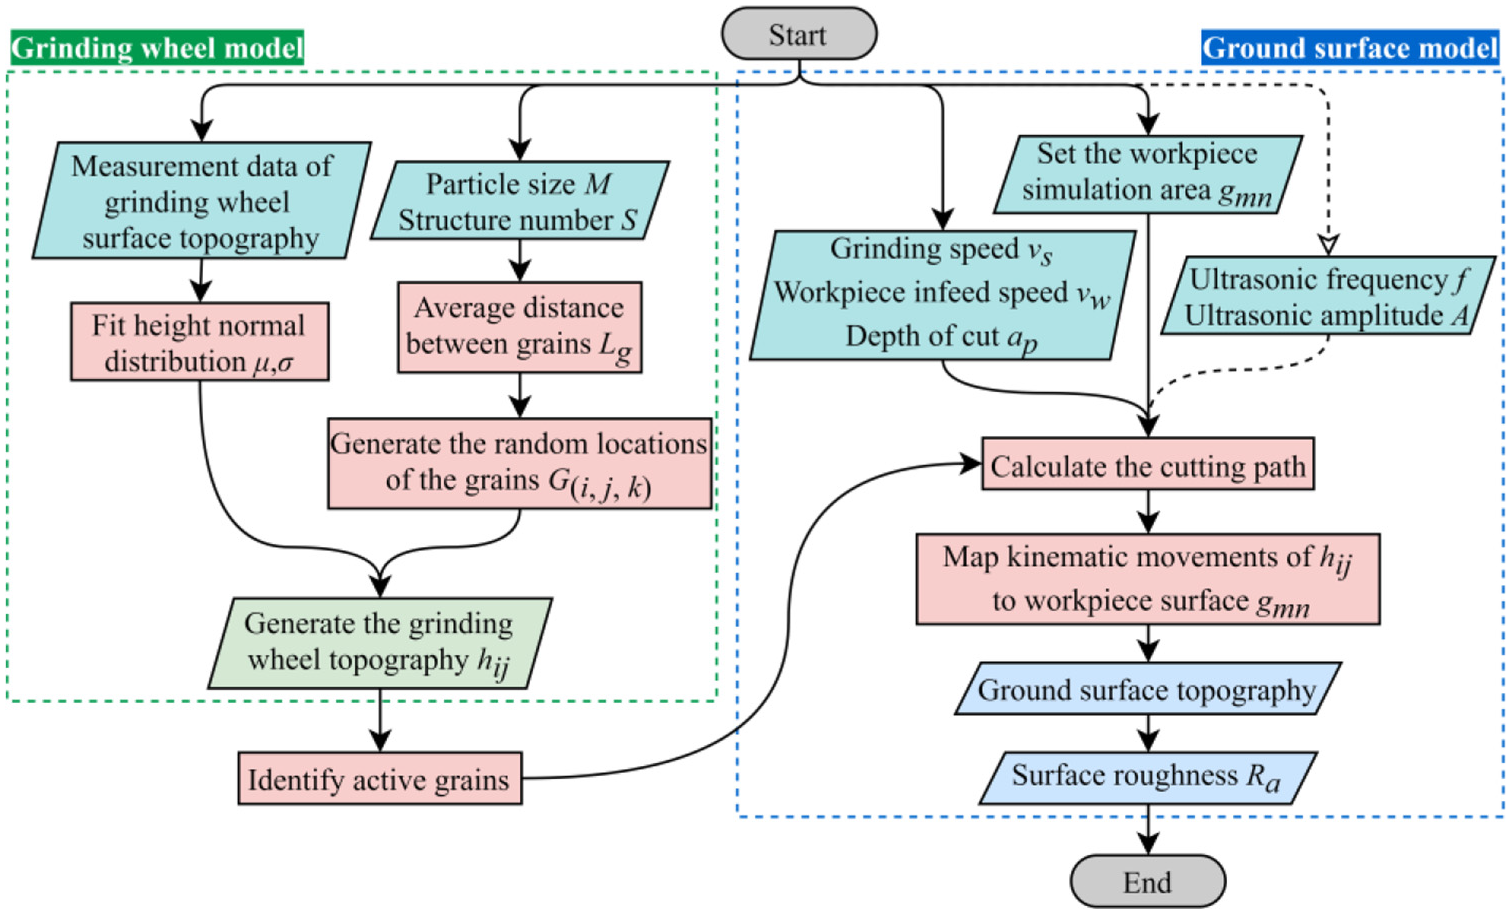
Modeling flowchart of ground surface topography.
Topography model of the GC abrasive wheel
The actual working surface of a grinding wheel is related to the outermost abrasives.28,29 The overall photographical picture of the GC abrasive wheel is shown in Figure 2(a). The surface topography is observed by a laser confocal microscope (Sensofar S Neox). Figure 2(b) and (c) show the three-dimensional and top view of surface topography of the 80# mesh GC abrasive wheel after dressing. Abrasives are randomly distributed on the grinding wheel surface with irregular shape and size. The agglomeration area of the abrasive that appears in the distance between two abrasives is sufficiently small, and the abrasives’ heights are similar. It is impossible to directly distinguish a single abrasive. Therefore, the abrasives cannot be assumed to have a specific simple shape. 30 The envelope surface of the outermost abrasives is regarded as the actual working surface of the grinding wheel, which is related to the spatial position and exposure height of the GC abrasive.
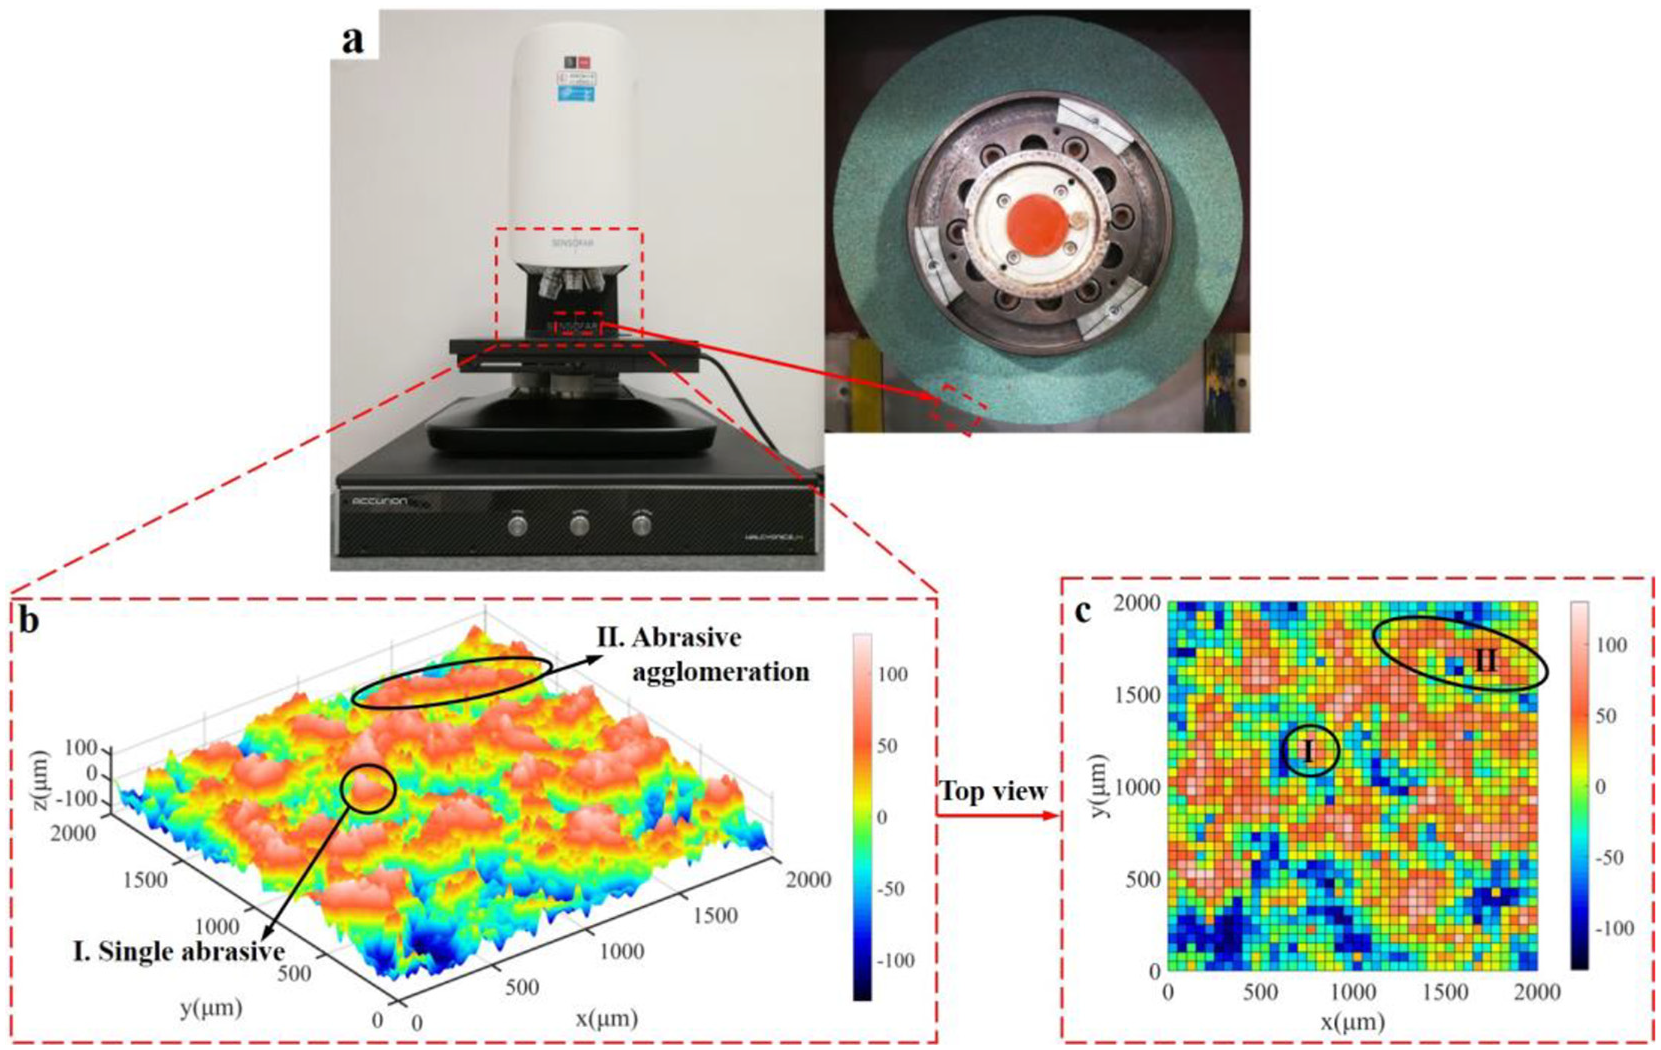
GC abrasive wheel topography: (a) measured setup, (b) 80# mesh GC grinding wheel, and (c) top view.
Hou and Komanduri 31 believed that the size of abrasive satisfied Gaussian distribution. And according to Zhou et al. 32 and Sun et al., 33 the diameter of abrasive is related to particle size M, which is the preparation parameter of the grinding wheel. The maximum diameter dgmax of abrasive is shown as equation (1).

The average diameter dgavg of abrasive is shown as equation (2).

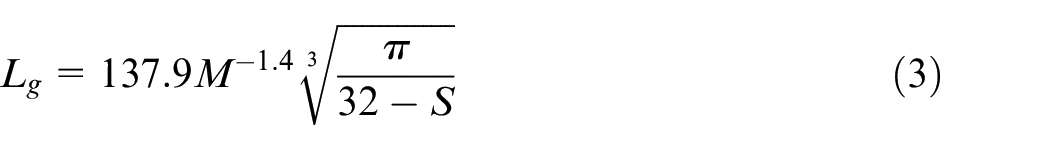
The average distance between adjacent abrasive Lg is related to the structure number S of the wheel, and it can be determined as equation (3).
The abrasive center G(i, j, k)(xgi, ygj, zgk) is initially evenly placed on the z = 0 plane with the distance Lg. The random spatial position G(i, j, k)(xGi, yGj, zGk) is simulated by shifting the operator, as shown in equation (4).
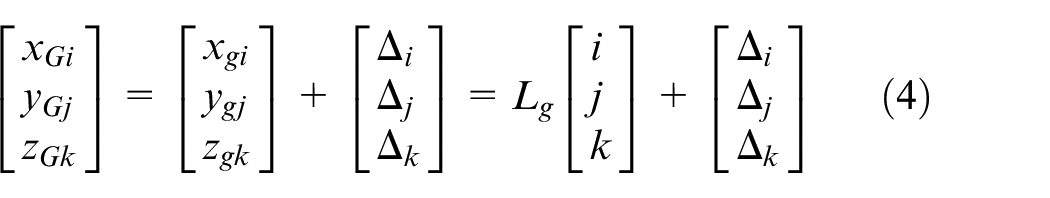
where (i, j, k) is the position index of the abrasive on the coordinate axis and the shifting operator
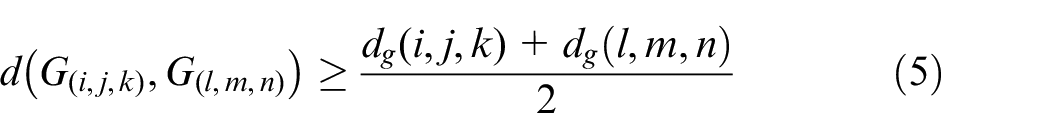
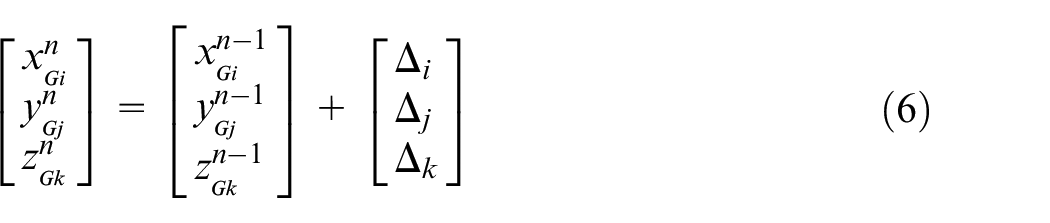
where d(G(i, j, k), G(l, m, n)) represents the Euclidean distance between the centers of abrasive G(i, j, k) and G(l, m, n) in three-dimensional space. After n iterations, the spatial position of the abrasive center particle G(i, j, k) can be expressed by equation (6).
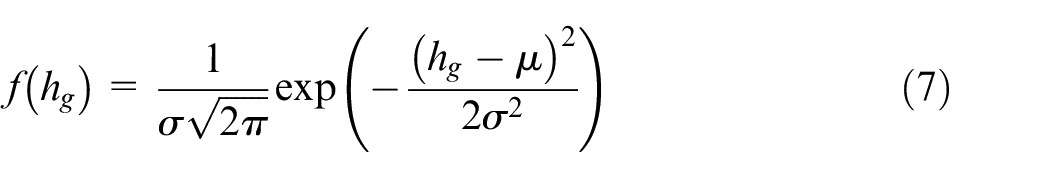
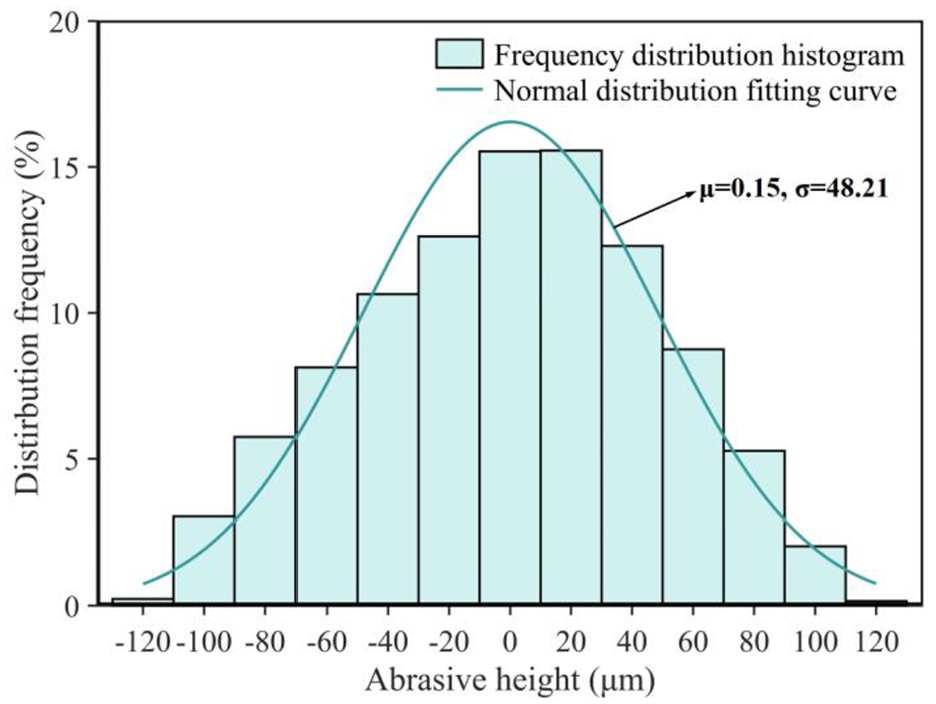
Doman et al. 34 and Zhou and Xi 35 proposed that the height distribution of abrasive on the grinding wheel surface conformed to a normal distribution. The measurement data of the 80# mesh GC abrasive wheel surface is statistically analyzed, and the frequency histogram of the height distribution is drawn in Figure 3. The α is set to 0.05 in the parameter test. The final fitting result shows that the abrasive height hg corresponds to a Gaussian distribution N(μ, σ 2 ), which can be expressed by equation (7), as follows:
Height distribution of GC abrasive wheel surface.
In this investigation, the mean μ and standard deviation σ of the fitted normal distribution for the GC80H6V40M grinding wheel are 0.15 and 48.21, respectively.
According to the abovementioned studies, the simulated surface topography of 80# mesh GC abrasive wheel is shown in Figure 4. The simulated wheel surface topography represents both the single abrasive and abrasive agglomeration as the actual wheel surface, which further rationalizes the proposed wheel surface model.
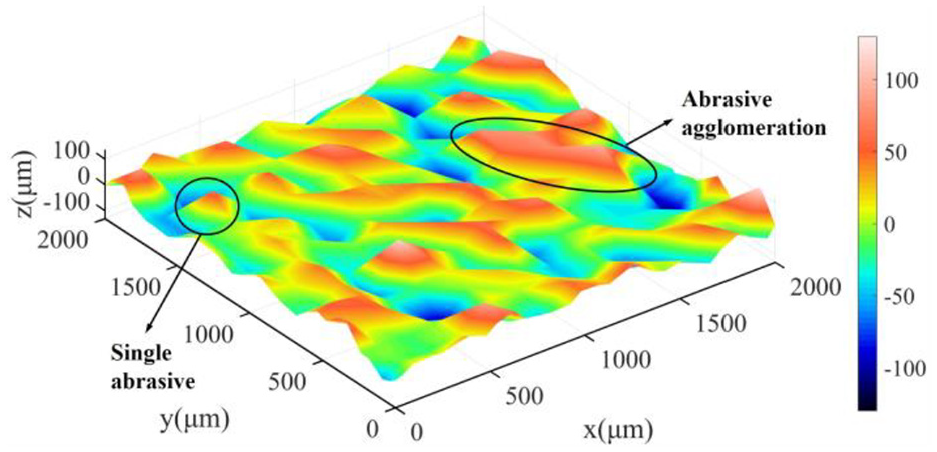
Simulated topography of GC abrasive wheel surface.
Mathematical model of abrasive trajectory
The cutting path of a single abrasive is a cycloid synthesized by the grinding wheel speed vs and the workpiece infeed rate vw in CG. The workpiece is vibrated by a simple harmonic parallel to the feed direction in TUAG, whose vibration displacement x and vibration velocity vf are expressed in equations (8) and (9), respectively.


The moving speed vd of the grinding wheel relative to the workpiece without regard of the grinding wheel speed vs is expressed by equation (10), as follows:

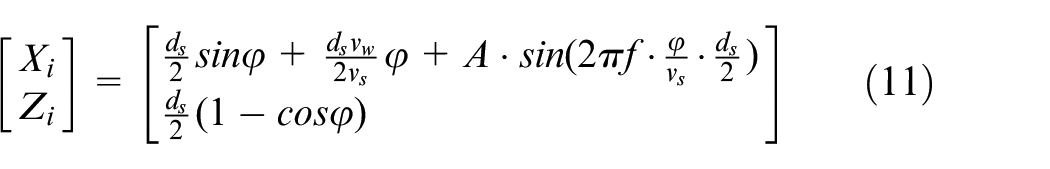
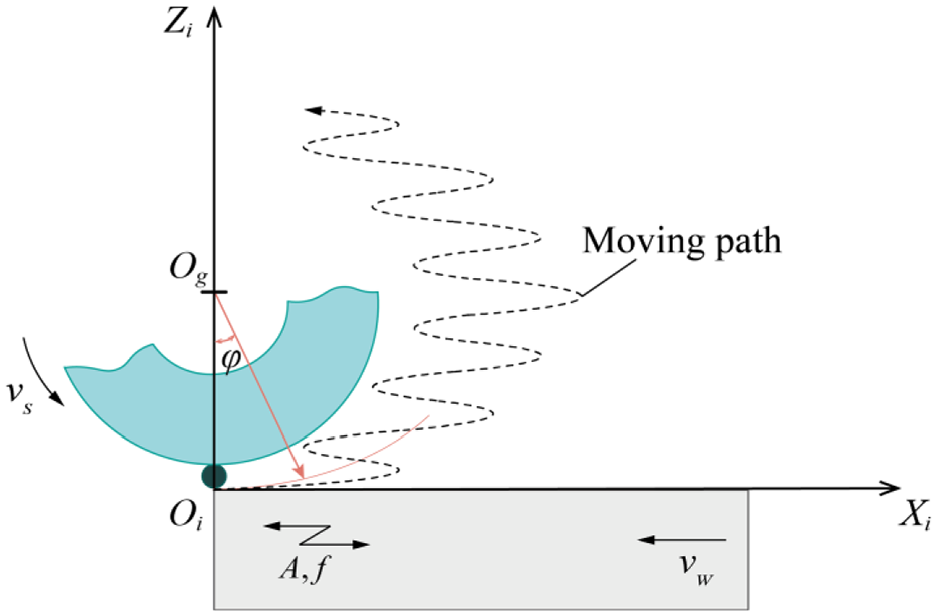
The initial phase of ultrasonic vibration is assumed to be 0, and the workpiece is assumed to be stationary. According to the principle of relative movement between grinding wheel and workpiece, the trajectory of a single abrasive is shown in Figure 5. The plane local coordinate system OiXiZi is established with the lowest point of the abrasive as its origin. The cutting path of a single abrasive particle in the grinding process can be defined as equation (11), as follows:
The trajectory of a single abrasive in local coordinate.
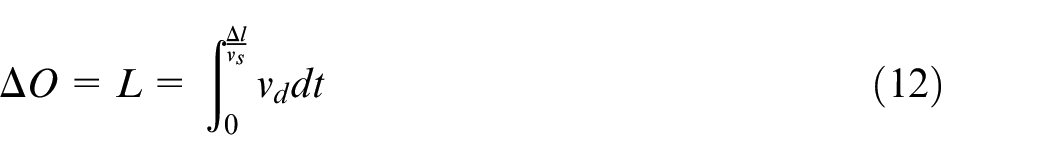
In practice, the height distribution of the abrasive along the radial direction of grinding wheel is uneven; as a result, the movement trajectories of different abrasives are distributed in concentric circles of different diameters. Moreover, the generation of the machined surface topography is the result of the superposition of the cutting marks of multiple abrasives on the grinding wheel. Figure 6 shows the trajectory of two adjacent abrasives in the circumference of the grinding wheel. The distance between the abrasives is Δl. Oi and Oi+1 are the origins of the local coordinate system of the two abrasives. The distance between the two origins in direction X is the moving distance L of the grinding wheel center Og in relative movement, and the distance in direction Z is the diameter difference between the abrasives Gi and Gi+1, which can be calculated by the following equations (12) and (13):

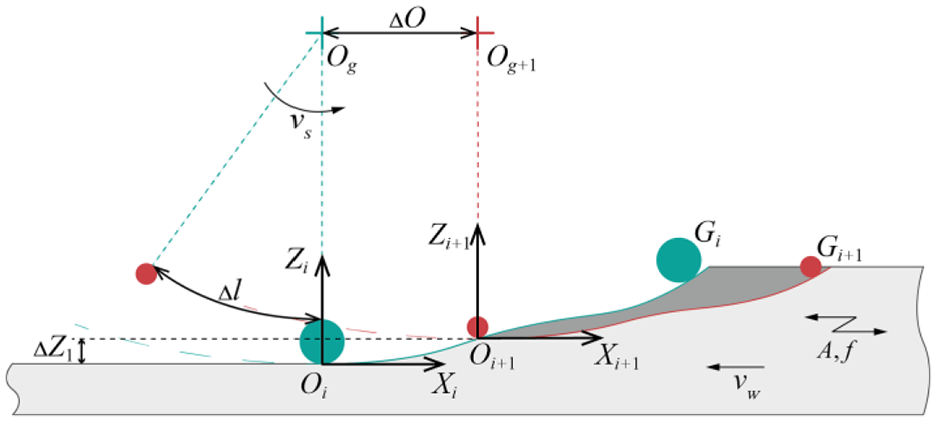
The trajectory of two adjacent abrasives.
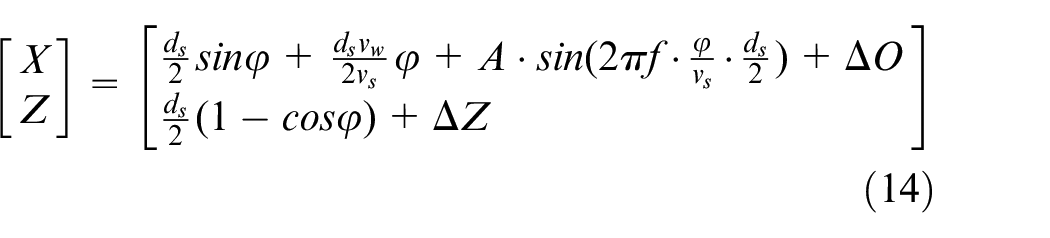
If the origin of plane local coordinate system of abrasive particle Gi is selected to coincide with the origin of the global coordinate system OXZ, then the transformation of the abrasive Gi+1 in the local coordinate system Oi+1Xi+1Zi+1 to the global coordinate system OXZ can be achieved by a coordinate transformation. The cutting path of the abrasive Gi+1 in the global coordinate system can be expressed by equation (14), as follows:
Ground surface topography simulation
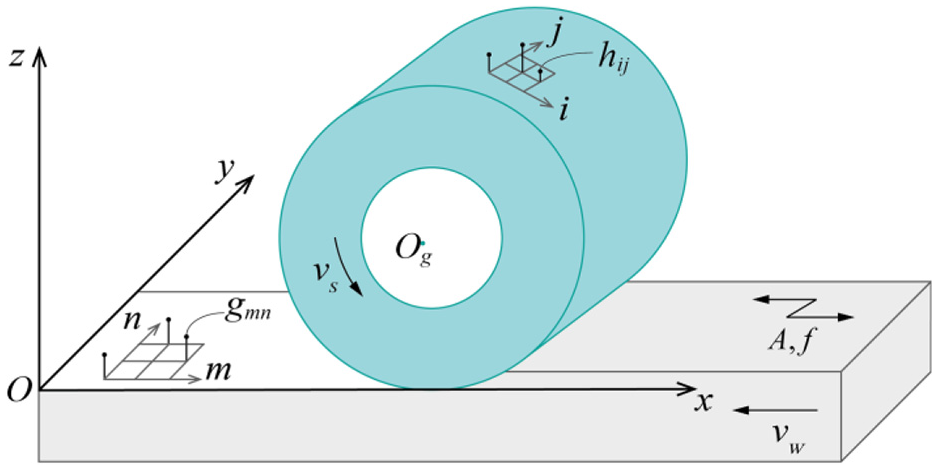
Figure 7 shows that a global coordinate system Oxyz is established by taking the lowest point of the surface of the workpiece after grinding as the origin. The simulation area of the workpiece is determined while simulating the theoretical ground surface topography. Then, the simulation area of the workpiece and grinding wheel working surface are discretized. The surface of the workpiece is represented by a topological matrix gmn, and each element g(m, n) in the matrix is the height value of z coordinate that corresponds to each grid point (m, n) in the xOy plane of the workpiece simulation area. Similarly, the grinding wheel working surface is represented by a topological matrix hij, and h(i, j) is the height corresponding to the cutting edge at the circumferential and axial positions (i, j) of the grinding wheel. The cutting edge of the wheel plays an important role in surface generation.
Mapping of cutting edge trajectories to workpiece surface.
In addition, judging whether h(i, j) is an active cutting edge before the simulation is necessary, because not all abrasives are involved in grinding. The relationship between the topological matrix of grinding wheel surface topography and the depth of cut is the basis for judgment. The active cutting edge can be determined by using equation (15), as follows:

The global coordinate system Oxyz is the same as the local coordinate system of the cutting edge of hmax. The distance in the x and z directions between the local coordinate system origin of any cutting point on the grinding wheel surface and the global coordinate system origin can be expressed by equation (16) and (17).
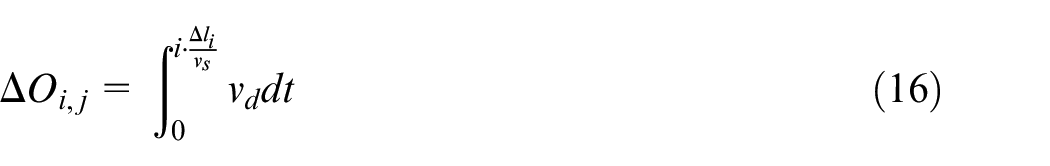

where Δli is the circumferential spacing of the grinding wheel topological matrix hij.
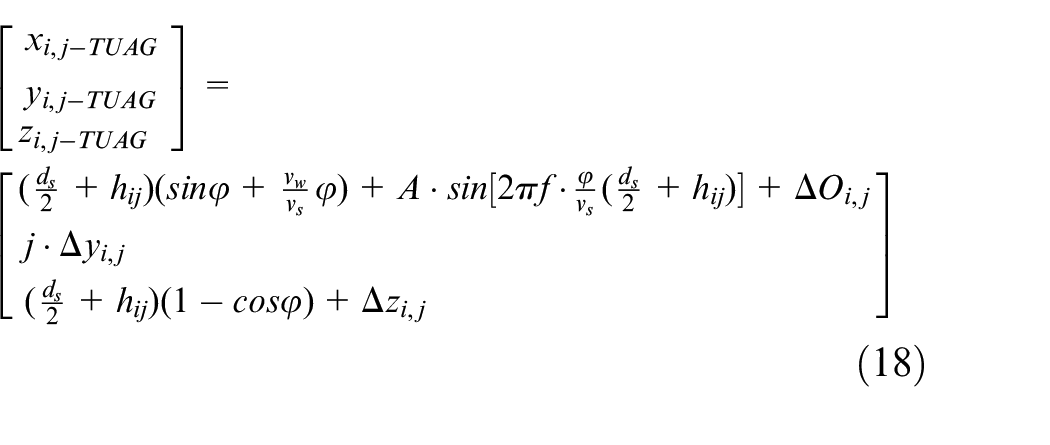
The trajectory of the active cutting point in the global coordinate system Oxyz during TUAG is expressed by equation (18), as follows:
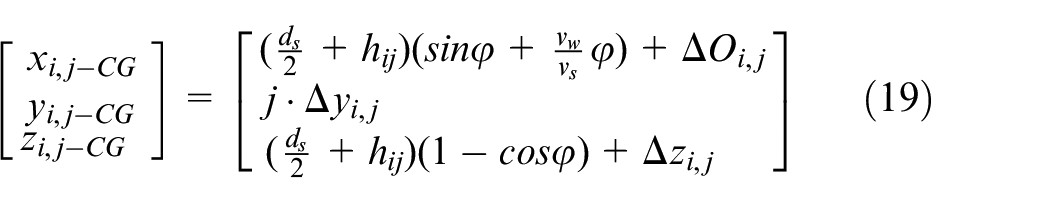
where Δyi,j is the axial spacing of grinding wheel topological matrix hij. When the ultrasonic amplitude A = 0 μm, the trajectory of the active cutting point in the global coordinate system Oxyz during CG is expressed by equation (19), as follows:
zi,j(m, n) is discretized according to the grid points (m, n) and the calculation results of the cutting edge trajectory. The minimum value of zi,j(m, n) under the combined action of each cutting edge forms the final grinding surface profile. Therefore, the simulation results of ground surface simulation can be expressed by equation (20), as follows:

Ground surface roughness modeling
The arithmetical mean deviation of the profile (Ra) is a commonly used parameter for evaluating surface roughness in production. The smaller the Ra value is, the higher the surface quality is. The method to simulate the actual measurement of surface roughness Ra is as follows:
The profile of topography zp perpendicular to the grinding direction is intercepted in the evaluation length ln, and zp is divided into five groups according to the sampling length lr.
In each sampling length, the reference line zp-mid is obtained, which is the arithmetic mean center line of the profile.
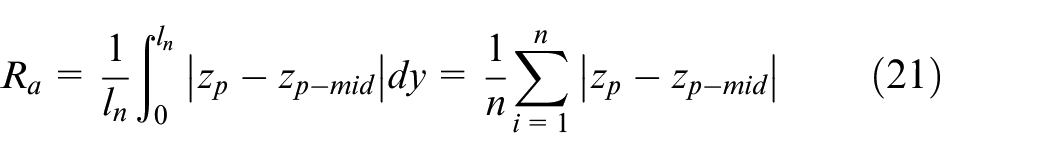
Ra is the arithmetic mean of the absolute value of the deviation from each point on the measured profile to the center line, which can be calculated by equation (21), as follows:
Experiment details
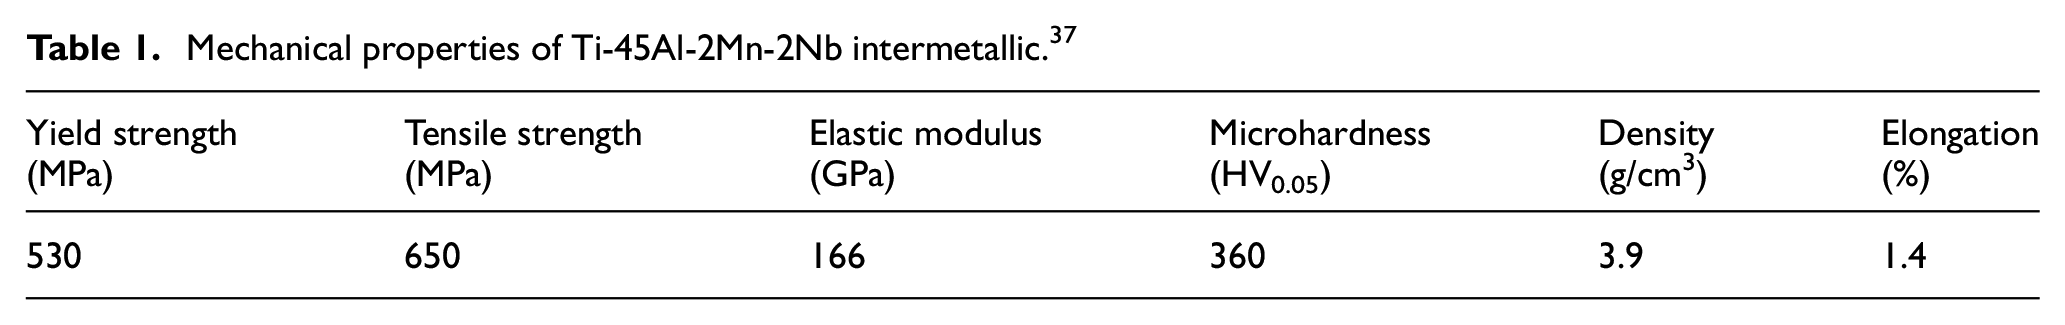
Compared with titanium alloys and nickel-based alloys, titanium-aluminum intermetallic has the advantages of low density, high temperature creep resistance, and favorable oxidation. 36 The workpiece material used in the experiment was Ti-45Al-2Mn-2Nb (at.%). The alloy has good castability and a lamellar structure. The average grain size was approximately 50–100 μm. The main mechanical properties are shown in Table 1.
Mechanical properties of Ti-45Al-2Mn-2Nb intermetallic. 37
The workpiece blocks with dimensions of 30 mm×10 mm×12 mm were prepared by wire cut electrical discharge machining (WEDM). The roughness of the work surface used in grinding experiment was reduced to 0.8 μm by milling. The experiment was conducted on the surface with a length of 30 mm and a width of 10 mm. Figure 8 shows the primary topography surface of the workpiece after milling.
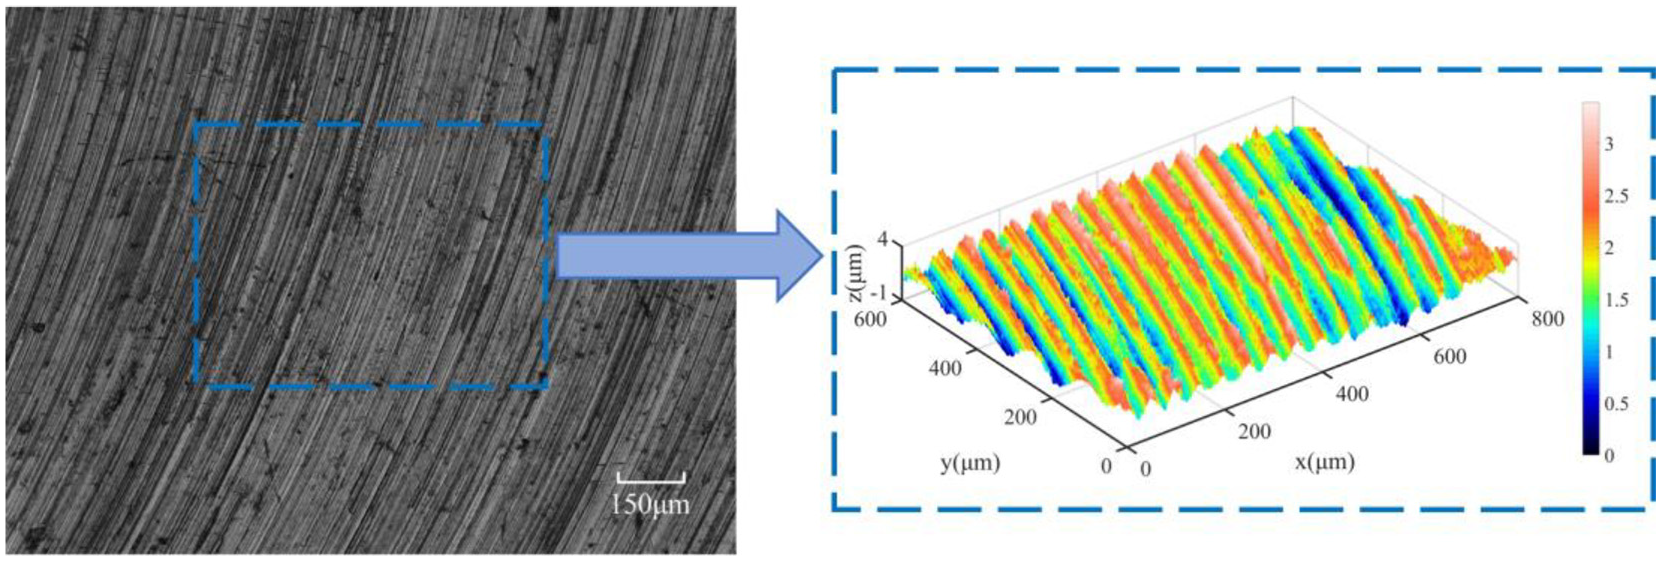
The primary topography surface of the workpiece by milling.
The grinding experimental setup is shown in Figure 9. The workpiece was clamped on the titanium alloy platform connected to the horn. A self-developed ultrasonic vibration equipment 38 was connected to the workpiece. The ultrasonic power frequency was set to 20 kHz to generate an ultrasonic vibration parallel to the feed direction. The maximum amplitude of the ultrasonic vibration platform under load reached 12 μm, as measured by the eddy current sensor.
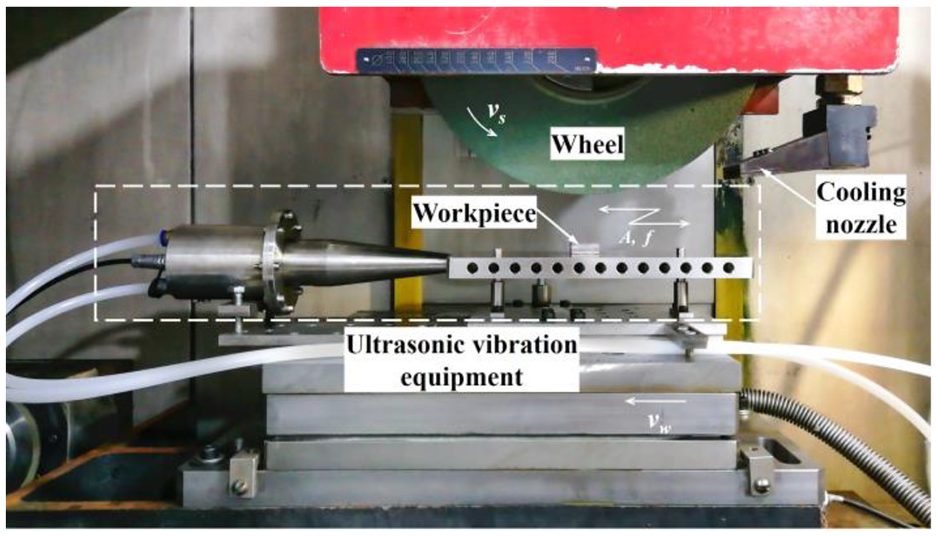
Grinding experimental setup.
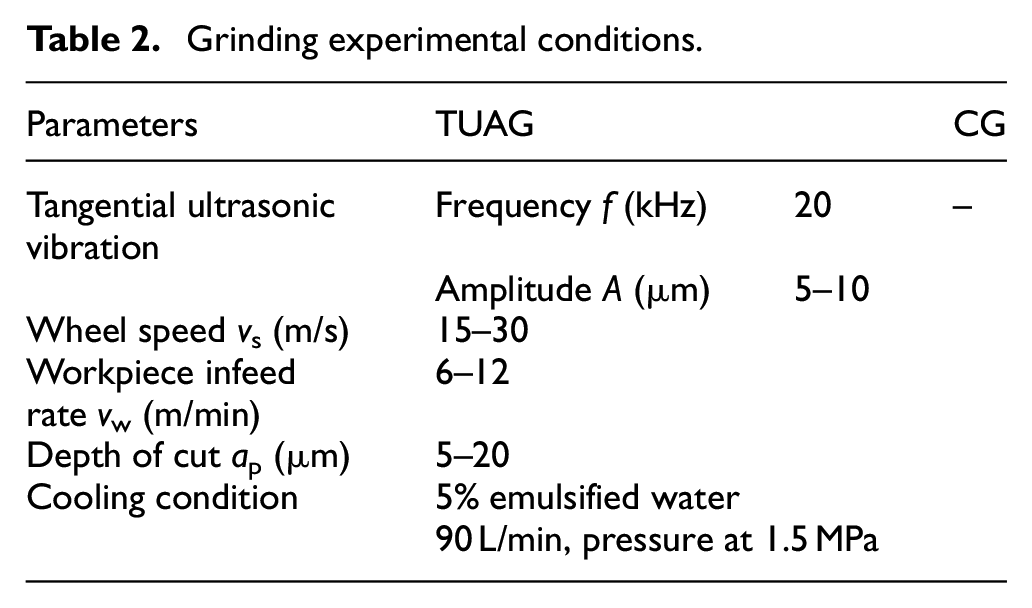
All tests were conducted on a high-speed surface grinder (Blohm Profimat MT-408), which has a maximum output power of 45 kW and maximum rotational speed of 8000 rpm. The grinding wheel was a green silicon carbide wheel coded as GC80H6V40M with a diameter of 400 mm and a width of 20 mm. The detailed grinding experimental conditions are listed in Table 2. Before each group of grinding experiments, a single-point diamond dresser was utilized to dress the GC wheel; the dressing parameters are as follows: wheel speed of vc = 20 m/s, infeed rate of fc = 200 mm/min, and a total dressing depth of aH = 0.1 mm. In addition, the grinding speed of vs = 30 m/s was the typical value for grinding titanium alloys. 37 CG and TUAG experiments were alternately performed under each set of parameters, and a 5% emulsion with a flow rate of 90 L/min at 1.5 MPa pressure was used for cooling during the grinding process. The machined surface topography was measured by a 3D confocal microscope (Sensofar S Neox). The surface roughness Ra was obtained by a profilometer (MAHR M2) by moving the diamond probe perpendicular to the grinding direction.
Grinding experimental conditions.
Results and discussion
Verification of the proposed model
Figure 10(a) and (b) show the ground surface topography measurement and simulation results, respectively. The grinding marks are along the direction x, that is, the feed direction of the workpiece, thereby reflecting the interaction between the abrasive and workpiece surface during the grinding process. The cross-sectional profiles on the yOz plane of the measured and simulated ground surface are generally consistent, as shown in Figure 10(c). The peak-to-valley values of surface asperities vary within 0–3 μm.
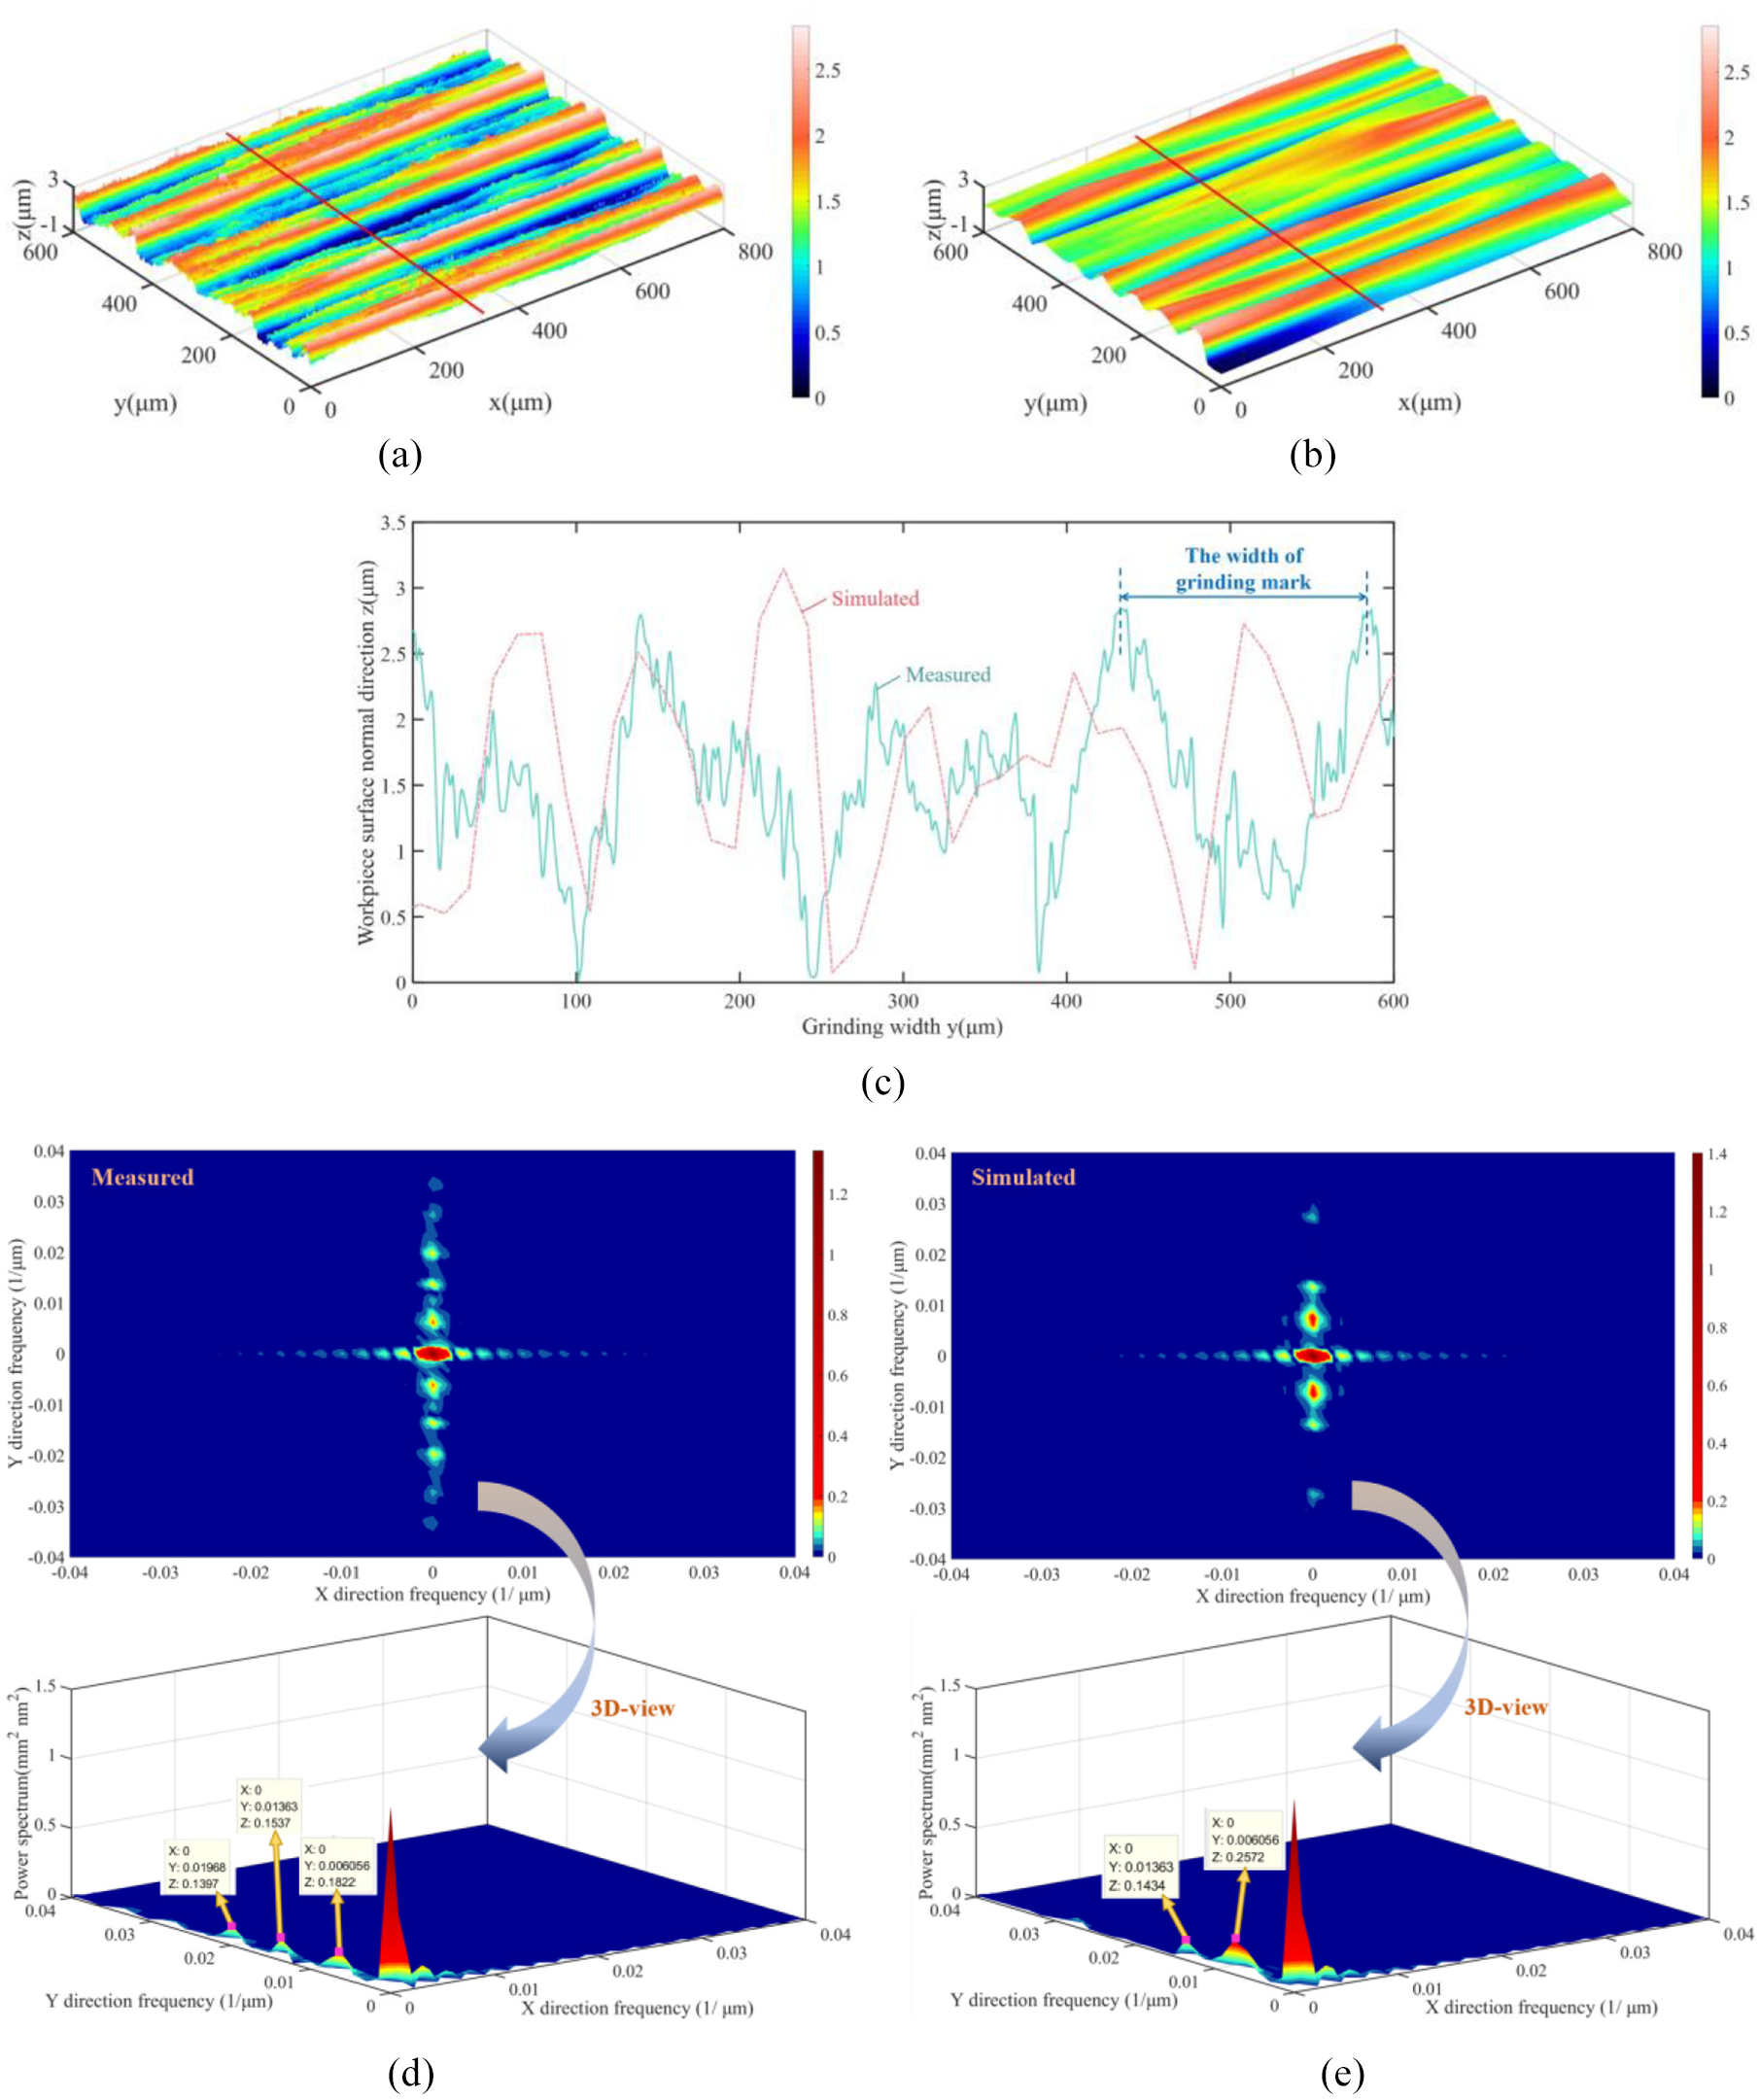
Comparison of measured and simulated workpiece surface (vs = 25 m/s, vw = 8 m/min, ap = 15 μm): (a) measured surface, (b) simulated suface, (c) 2D cross-sectional profile at x = 300 μm, (d) 2D-power spectrum analysis of measured surface, and (e) 2D-power spectrum analysis of simulated surface.
The 2D power spectrum distribution of the simulated surface highly coincides with the experimental result, as demonstrated in Figure 10(d) and (e). In the direction x, no dominant peak value is found, that is, no directional texture and periodic structure are found. In the direction y, the lowest frequency 6.06 × 10⁻³ μm−1 signals are consistent and correspond to the average width between the abrasives. In addition, due to the presence of multiple cutting edges on a single abrasive, a part of the low frequency (1.32 × 10⁻² μm−1) corresponds to the spacing between the cutting edges. However, compared with the 2D power spectral analysis of the simulated surface, some of the higher frequencies (1.97 × 10⁻² μm−1) on the measured surface come from the material side flow and other material residual reasons during the actual grinding process.
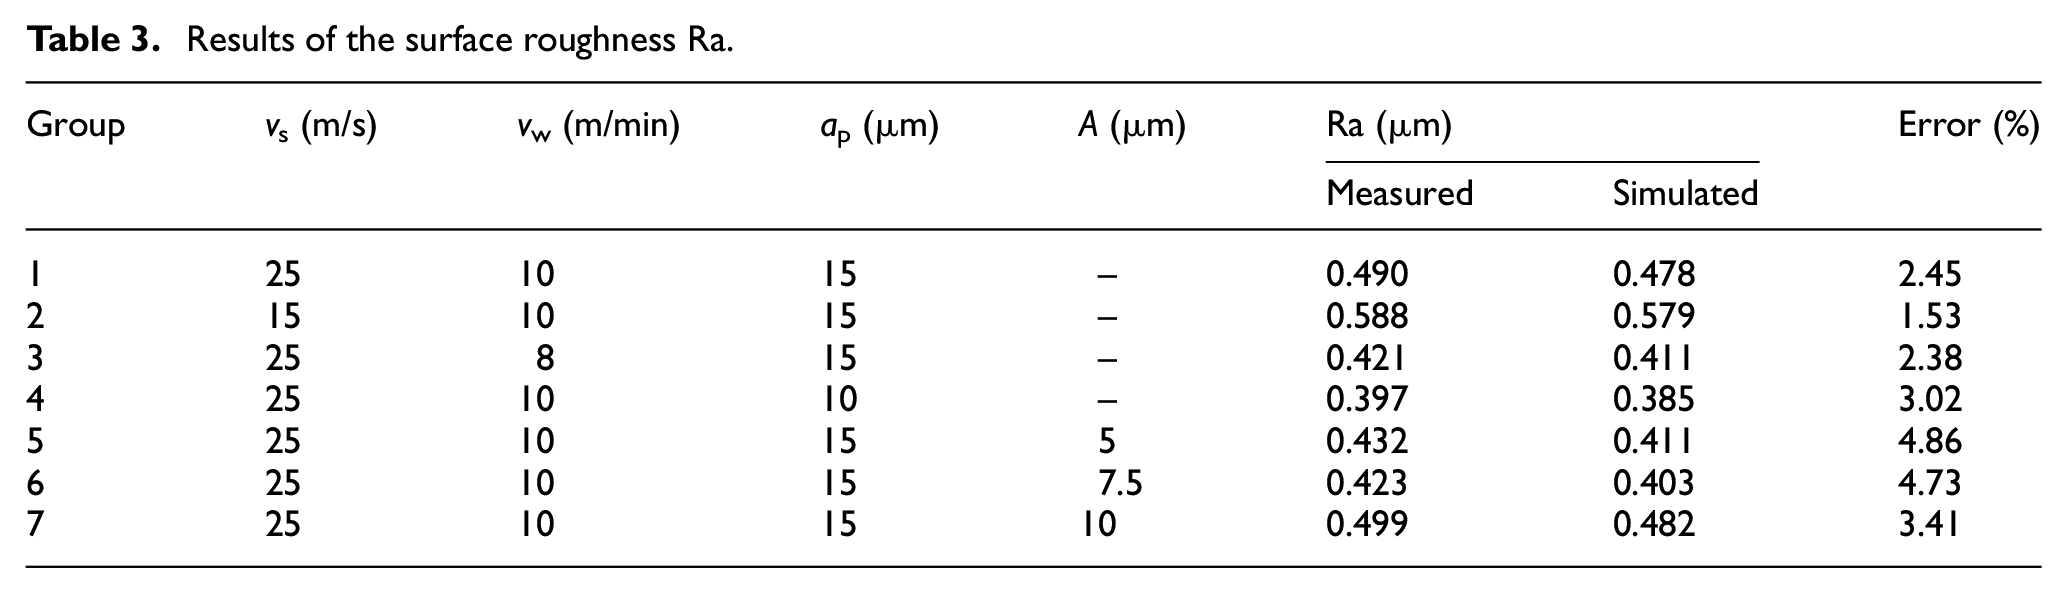
As shown in Figure 11, the measurement method performs the same operation on the simulated ground surface. Each of the ground surfaces is subjected to measurement five times at equal intervals in the x direction. OFAT (One Factor At a Time) was applied for filling the grinding parameters in Table 3. The surface roughness Ra measurement and simulation results show that the simulation values are smaller than the measured values. On the one hand, the surface roughness Ra increases due to grinding wheel wear during machining. On the other hand, the surface roughness Ra is adversely affected by the material pile-up along the two sides of a grinding groove during ploughing. 39 In addition, the error between the simulation and the experimental measurement is within 5%. The simulation model is valid as the error is within the acceptable range. Therefore, the proposed model is rationalized and can be used for studying the surface generation in TUAG.
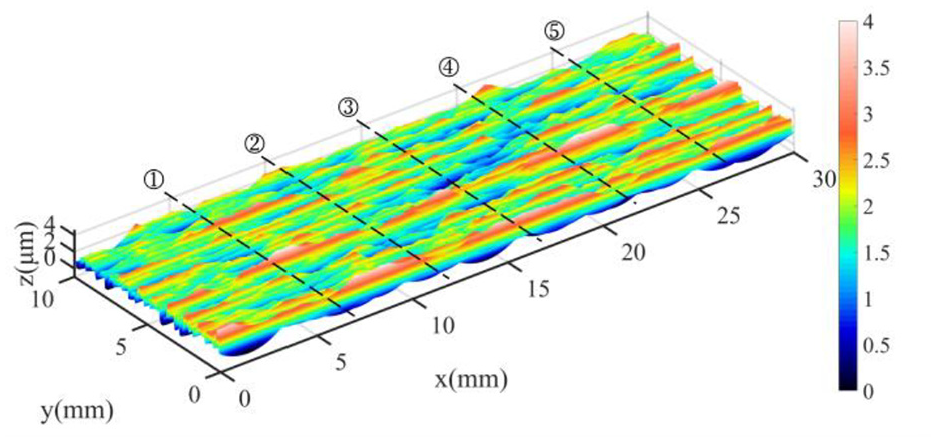
Schematic of the surface roughness Ra simulation area.
Results of the surface roughness Ra.
In this study, generation mechanism modeling of surface topography is established only based on grinding kinematics, but the properties of workpiece materials also have a great influence. In addition, grinding wheel wear has been neglected in this study, which is one of the sources of simulation errors. Further consideration of these conditions will improve the simulation accuracy in future studies.
Influences of TUAG
The ground surface topographies ground by different ultrasonic amplitude parameters are shown in Figure 12. The average widths of the grinding mark in measured and simulated ground surfaces are consistent. And the average width of the grinding marks on the conventional grinding surface is similar to that in the TUAG surface, which is approximately 150 μm. However, the surface topography produced at the ultrasonic amplitude of A = 7.5 μm represents an obvious difference with those produced by the other grinding parameters. The grinding marks are more uniformly distributed on the ground surface and the quantity of grinding mark is higher. The change in the surface topography affects the surface roughness. Therefore, the parameters used in TUAG have a notable influence on the surface roughness.
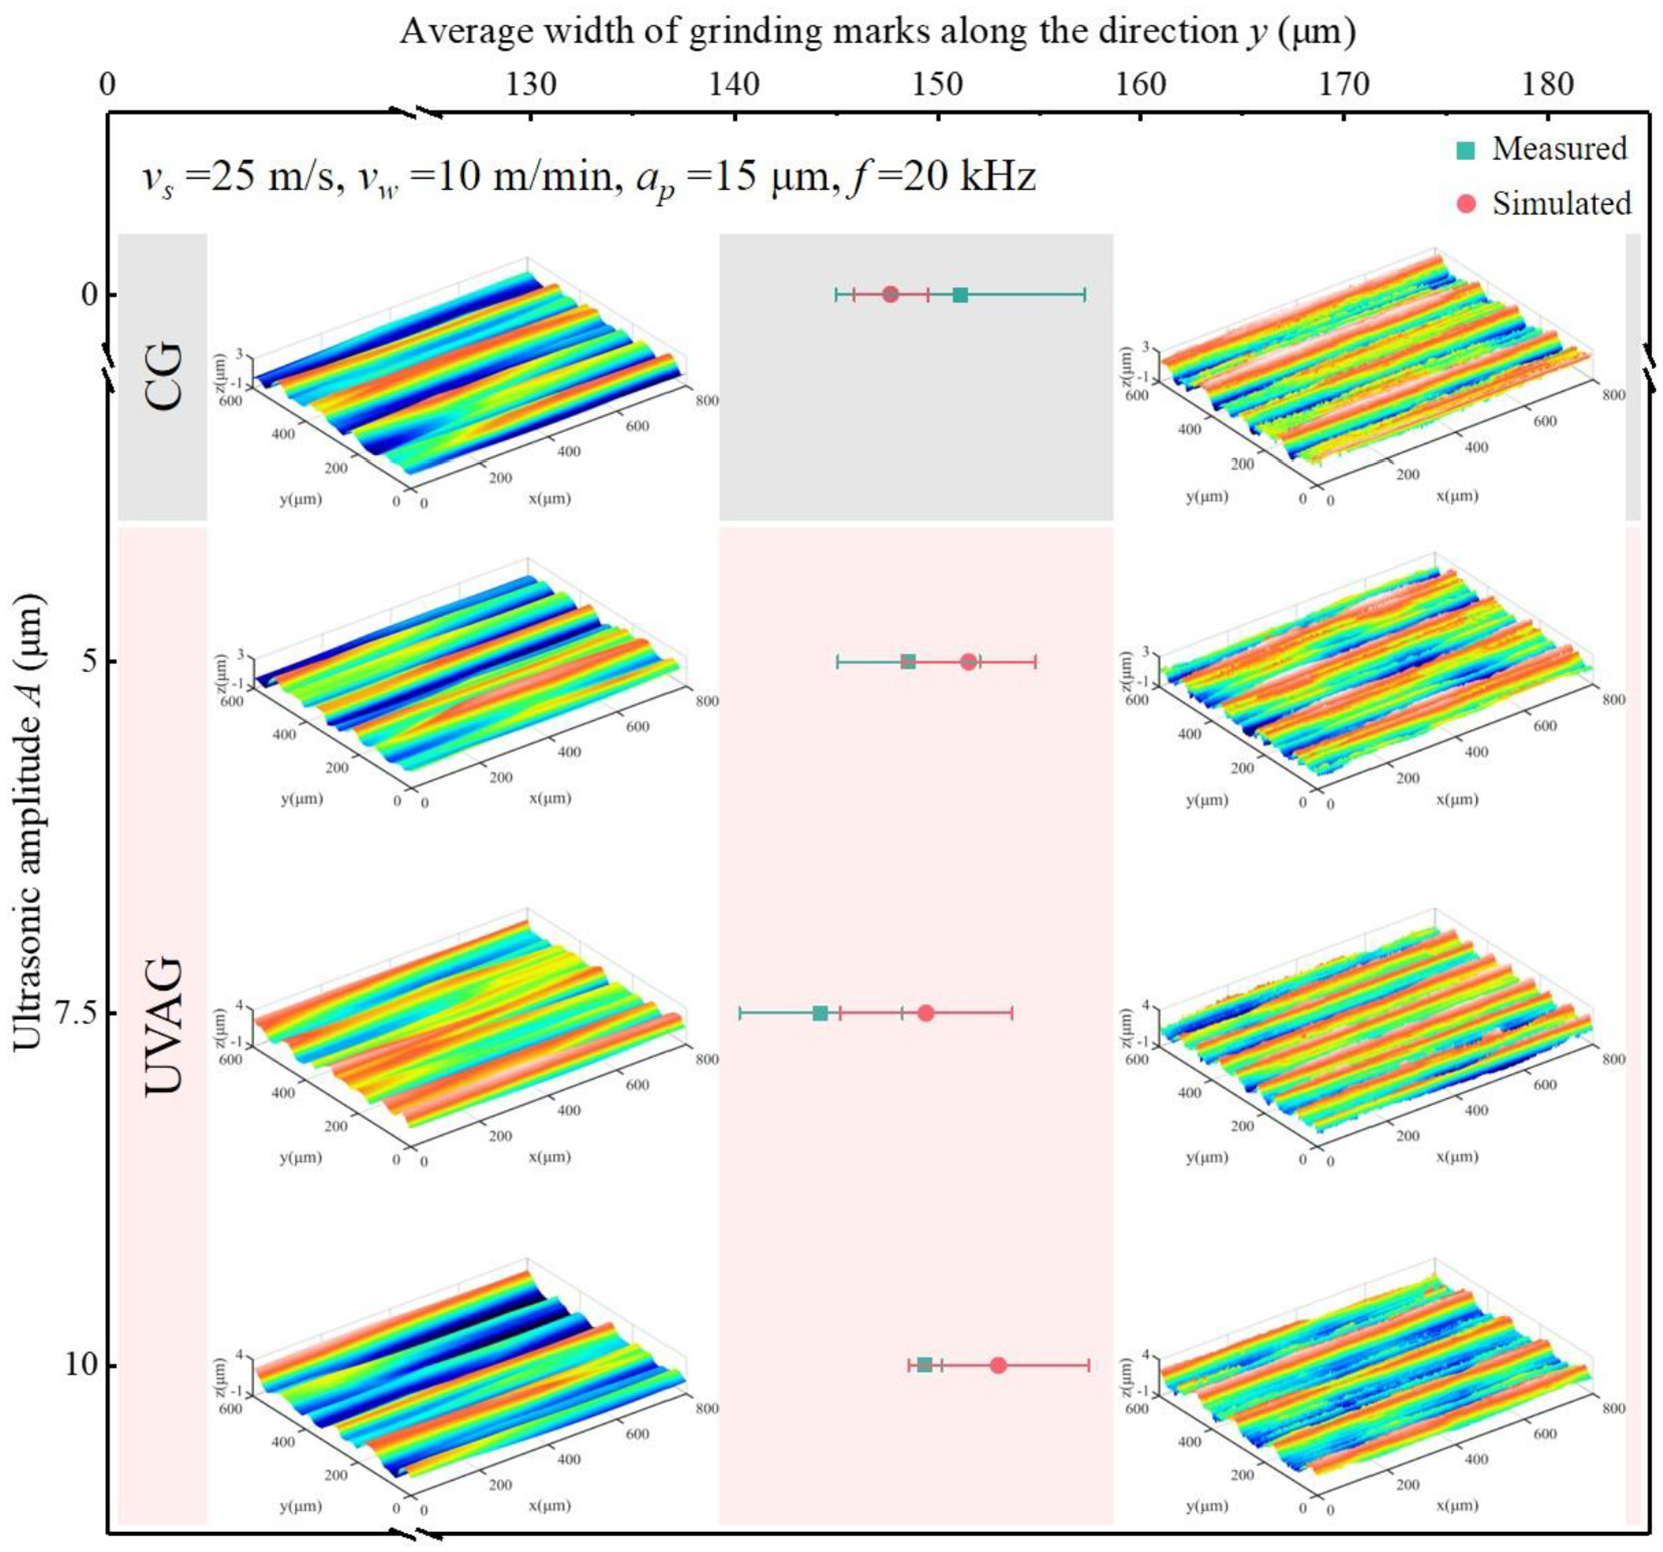
Results of measured and simulated ground surfaces.
The effects of grinding parameters used in TUAG on the surface roughness Ra are indicated in Figure 13. CG and TUAG have the same variation trend with the different grinding parameters. The grinding wheel speed is inversely proportional to the surface roughness. The increase of the grinding wheel speed leads to the decrease in the maximum undeformed cutting thickness, which in turn leads to the decrease in scratch depth. Correspondingly, surface roughness can be reduced by up to 33%. The workpiece infeed rate and depth of cut are directly proportional to the surface roughness. When these parameters increase, the maximum undeformed cutting thickness increases, and the surface roughness can be increased significantly by up to 72% and 108%. Therefore, depth of cut is the main factor affecting surface roughness.
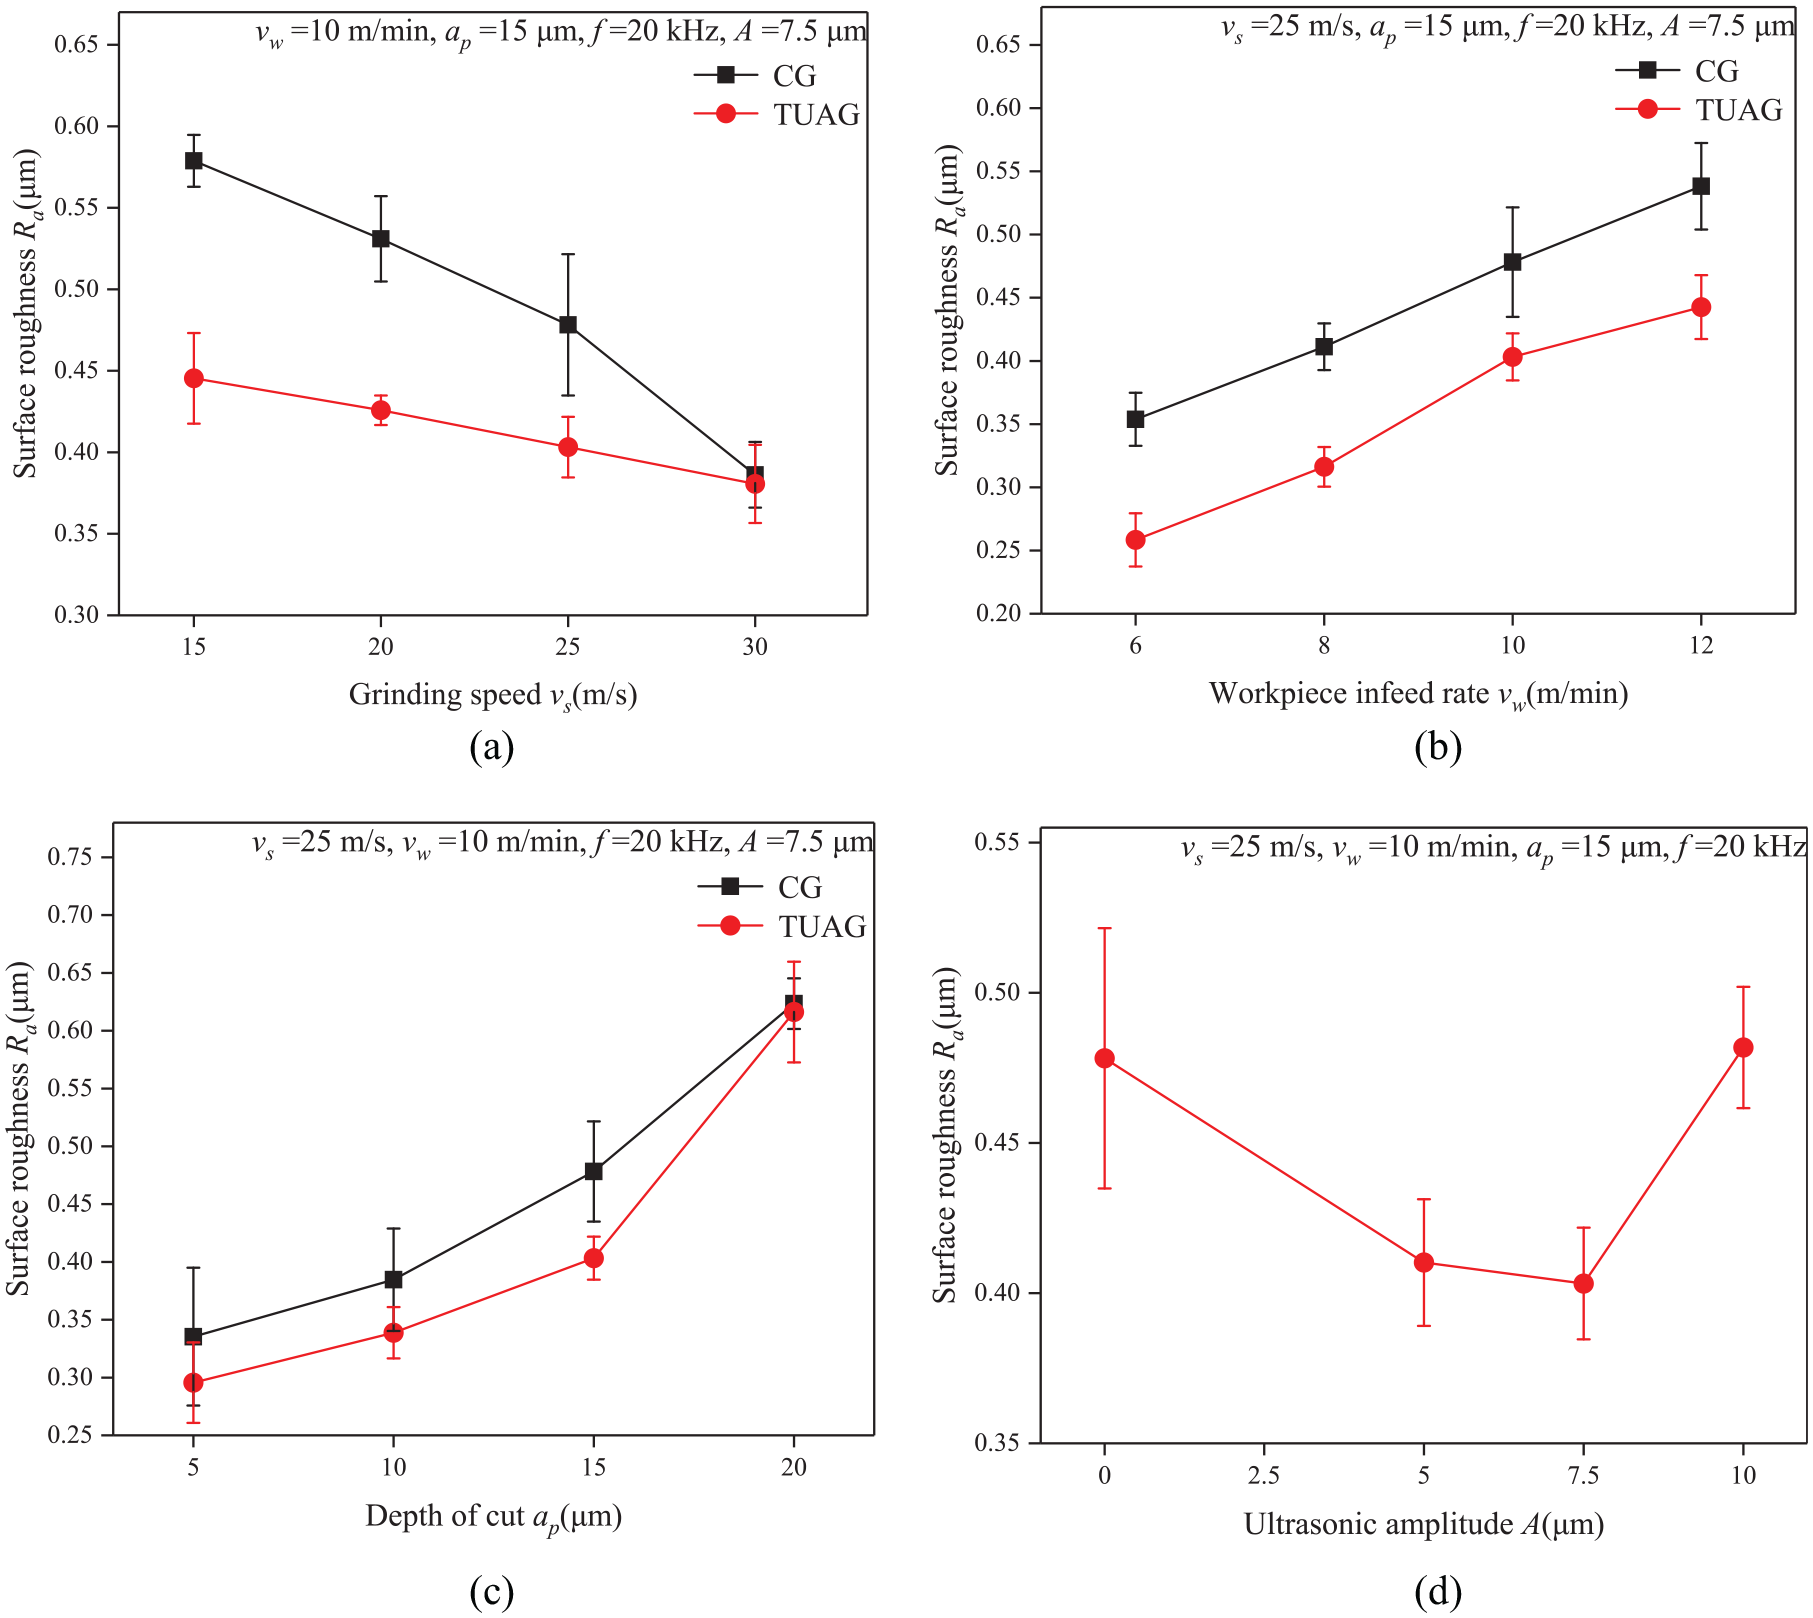
Surface roughness Ra of different: (a) grinding speed, (b) workpiece infeed rate, (c) depth of cut, and (d) ultrasonic amplitude.
The surface roughness Ra is reduced by TUAG, as shown in Figure 13(a) to (c). The surface roughness Ra is related to the height of the material residual area. The tangential residual height of the workpiece surface is reduced by the repeated ironing of the grinding wheel in TUAG. Therefore, TUAG produces a better surface finish. 40 The percentage reduction of surface roughness Ra is the parameter used for measuring the effect of TUAG by following equation (22):

where Ra-CG is the surface roughness value of CG, and Ra-TUAG is the surface roughness value of tangential TUAG at the same grinding conditions.
As shown in Figure 13(a), with increasing grinding speed from 15 m/s to 30 m/s, workpiece infeed rate of vw = 10 m/min, and depth of cut of ap = 15 μm, the surface roughness Ra of CG and TUAG decreased from 0.579 and 0.445 μm to 0.386 and 0.381 μm, respectively, whereas the percentage reduction of surface roughness Ra decreased from 23.1% to 1.3%. As shown in Figure 13(b), with increasing workpiece infeed rate from 6 to 12 m/min, grinding speed of vs = 25 m/s, and depth of cut of ap = 15 μm, the surface roughness Ra of CG and TUAG increased from 0.354 and 0.258 μm to 0.538 and 0.443 μm, respectively, whereas the percentage reduction of surface roughness Ra is higher than 15%, and the maximum is 27%. As shown in Figure 13(c), with increasing depth of cut from 5 to 20 μm, grinding speed of vs = 25 m/s, and workpiece infeed rate of vw = 10 m/min, the surface roughness Ra of CG and TUAG increased from 0.335 and 0.296 μm to 0.623 and 0.616 μm, respectively, whereas the percentage reduction of surface roughness Ra decreased from 11.6% to 1.1%. The surface roughness Ra values of TUAG and CG have the same changing trend under different grinding conditions. The maximum undeformed cutting thickness of a single abrasive decrease with increasing grinding speed, which benefits the formation of chips and reduces the surface roughness Ra. The distance of grinding trajectories between adjacent abrasives increases with increasing workpiece infeed rate, increasing the tangential residual height and increasing surface roughness Ra increase. The thickness of the chips of the abrasive increases with increasing depth of cut. Thus, the depth of the scratches left on the workpiece surface increases, and the surface roughness Ra increases. However, the influences of ultrasonic vibration differ under various grinding parameters. The higher grinding speed (vs = 30 m/s) and depth of cut (ap = 20 μm) weaken the influence of ultrasonic vibration; thus, it is not conducive to the transmission of ultrasonic amplitude to the grinding arc area. The influence of ultrasonic vibration is relatively stable with different workpiece infeed rates, and the surface roughness Ra of TUAG is approximately 0.1 μm lower than that of CG.
Furthermore, Figure 13(d) shows that the surface roughness Ra first decreases from 0.478 to 0.403 μm and then increases to 0.482 μm with increasing ultrasonic amplitude from 0 to 10 μm. At the ultrasonic amplitude of A = 7.5 μm, the surface roughness Ra is the smallest, which results in approximately 42% reduction compared with the surface roughness in CG. The impact force of abrasive particles on the workpiece increases with excessive ultrasonic amplitude. Figure 14 shows that the length of the cutting trajectory of a single abrasive in the grinding arc becomes longer with increasing amplitude exerted on the workpiece in TUAG, which accelerates the grinding wheel wear process and increases the ground surface roughness Ra. 41 The surface roughness Ra has a minimum value with an appropriate ultrasonic vibration amplitude.
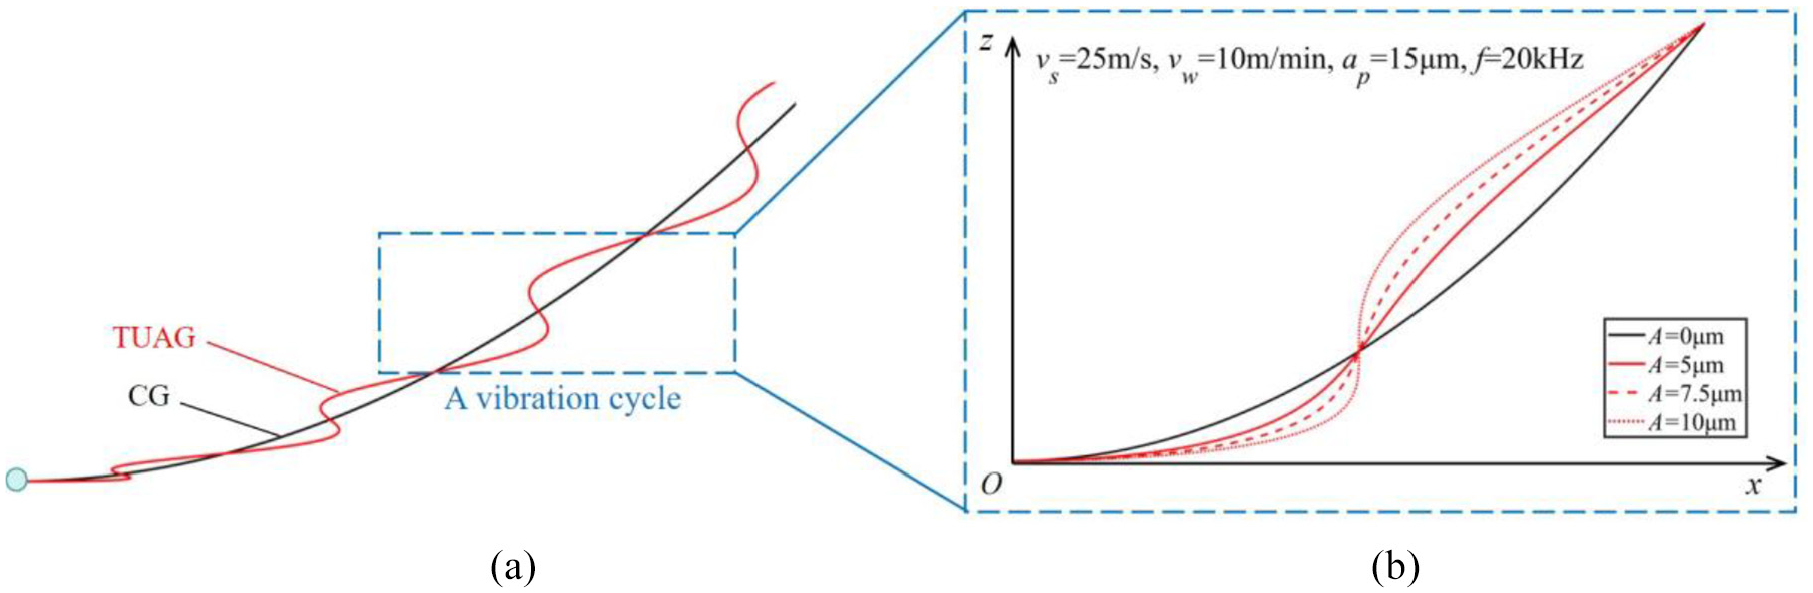
Cutting path of a single abrasive: (a) CG and TUAG and (b) a vibration cycle.
In summary, the influence of a single grinding parameter on surface roughness has been determined. Depth of cut ap has the greatest influence on surface roughness. Research on the coupling effect of influencing factors is lacking. The abovementioned studies thus offer a basis for a new strategy to optimize the parameters in future studies.
Conclusions
In this article, the ground surface topography model was established based on abrasive kinematics. The grinding wheel model was established by statistical analysis of the abrasive height on the actual working surface of GC grinding wheel. The grinding experiments of CG and TUAG with GC abrasive wheel were conducted for TiAl intermetallic. The effect of grinding parameters, that is, ultrasonic amplitude, grinding speed, workpiece infeed rate, and depth of cut, on surface roughness Ra was investigated. The following conclusions are obtained:
(1) The theoretical ground surface topography model is built by combining with the actual working surface model of a GC abrasive wheel and the kinematic model of single abrasive for simulation. In particular, the cutting edge of the wheel plays an important role in this surface generation. Moreover, this modeling strategy can produce better results. The error between the simulated value and the measured value of surface roughness Ra is less than 5%, which rationalizes the model.
(2) Compared with CG, TUAG generates a surface with lower surface roughness Ra, which is conducive to the improvement in surface quality. The surface roughness Ra can be reduced by up to 27% under the current experimental conditions. However, with increasing grinding speed or depth of cut, the influence of ultrasonic vibration on the reduction of the surface roughness is not obvious. The reduction percentage of the surface roughness Ra decreases by approximately 1%.
(3) The effects of ultrasonic vibration amplitude on the surface roughness are not monotonous in TUAG. The surface roughness Ra decreases by increasing the ultrasonic amplitude within a certain range. With further increase in ultrasonic amplitude, the impact force of abrasives on the workpiece increases, and abrasive wear becomes serious. In this study, with a grinding speed of vs = 25 m/s, a workpiece infeed rate of vw = 10 m/min, a depth of cut of ap = 15 μm, and an ultrasonic vibration frequency of f = 20 kHz, a mediated ultrasonic vibration amplitude of 7.5 μm achieves the minimum surface roughness Ra of 0.403 μm in grinding TiAl intermetallic.
Footnotes
Appendix
Declaration of conflicting interests
The author(s) declared no potential conflicts of interest with respect to the research, authorship, and/or publication of this article.
Funding
The author(s) disclosed receipt of the following financial support for the research, authorship, and/or publication of this article: This work was financially supported by the National Natural Science Foundation of China [Nos. 51921003 and 51775275], National Key Laboratory of Science and Technology on Helicopter Transmission (Nanjing University of Aeronautics and Astronautics) [No. HTL-A-20G01], the Project Funded by China Postdoctoral Science Foundation [No. 2020TQ0149], and the Foundation of Graduate Innovation Centre in NUAA [No. KFJJ20200506].