
Abstract
The reshaping process of pipes is an important method in producing non-circular pipes. Desired profile products are produced by passing round pipe through the rotating rollers. Cave-in defect is one of the common defects in the reshaping process. Roller design issues can decrease this kind of defect. In this paper, a method based on the slab method and the incremental plasticity has been presented to the numerical study of a 2D reshaping process. For investigating the Cave-in defect, the contact model has been developed. The concept of element elongation has been introduced to increase the accuracy of the contact model. Based on the presented method, numerical software has been developed to simulate the 2D reshaping process. Elastic-plastic equations for this subject have been driven based on the incremental method, J yielding criterion, and non-linear combined hardening. The effects of the radius of the roller profile on cave-in defects have been investigated by using the presented software (DARF). A set of experiments has been conducted in a forming station to verify the results. Results show that the presented model has higher accuracy than the Abaqus commercial software in predicting the cave-in defect. Based on the results of the model, the local increase of yielding stress directly affects the cave-in defect. Also, a meaningful relationship between the radius of the roller and the amount of the cave-in has been observed.
Keywords
Introduction
The reshaping process is used to convert a circular pipe into a non-circular pipe, like a square pipe, using a set of rollers in specific stations. High production rate, continuous production, producing an interstice-free square pipe, a very small pipe with a square cross-section are some advantages of this process. Designing the roller profile and calculating the number of forming stations are the most important issues in planning this process. 1 In the square pipe forming, the radius of a roller profile is constant during each stage. The radius of the roller is increased between stages until a flat roller in the final station. Figure 1 shows a schematic of the reshaping process in which a circular pipe converts into a square cross-section pipe.
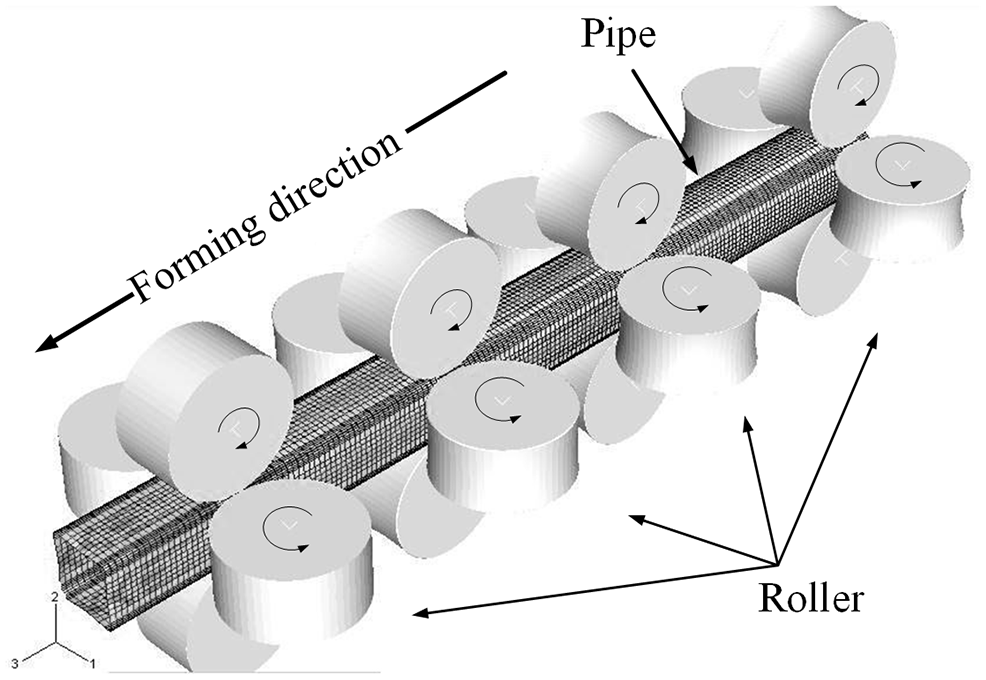
Reshaping process of circular pipes into square pipes.
The reshaping process is a subdivision of the cold roll forming process. Many defects of the reshaping process and the cold roll forming process are common. Defects such as bow, twist, edge waves, and spring-back are common in the processes. These defects have been investigated in different papers. Sajjad et al. 2 studied the effect of two different flower patterns in cold roll forming of U-shaped sheets of AA5052 aluminum alloy on the bow defect. They showed that the supporting stand plays an important role in minimizing the bow defect. Bidabadi et al. 3 showed that the experimental setup adjustment has more impact on the bow defect than the geometrical parameters in the U-shaped sections with pre-notched of the product. They also indicated that approaching the holes to the edge of the sheet increased the bowing defect. Decreasing the flange width, the web width, and the distance between two forming stations also increases the bowing defect. Shirani Bidabadi et al. 4 showed that the bending angle in the forming stations has the most effect on the ovality defect of the pre-notched sheet in cold roll forming of U-shaped sections. Safdarian and Naeini 5 reported that increasing the bending angle and the strip thickness in cold roll forming of U-shaped sections increases the bow defect.
Another issue in the cold roll forming process is spring-back. The prediction of spring-back is a n important issue in this process. Many studies were done in this field. Liu et al. 6 investigated the spring-back estimation of car threshold sections considering the planar swift’s model, anisotropic Hill’s 48 model, and Yid2000-2d model in the company with Yoshida-Uemori kinematic hardening pattern. They showed that considering the Yid2000-2d model in the company with Yoshida-Uemori predicts the spring-back 25% more accurately than Swift’s model. Naofal et al. 7 predicted the spring-back in roll forming of arc-shaped section considering Yoshida-Uemori pattern and applying elastic modulus changes due to plastic deformation. They have reported that the spring-back is more accurately predicted using Yoshida-Uemori kinematic hardening pattern and considering the elastic modulus variation as a chord.
Talebi-Ghadikolaee et al. 8 presented a model to predict the fracture in cold roll forming of U-shaped sections of Aluminum 6061-T6 sheets using three fracture criteria Ayada, Rice-Tracey, and normalized Cockroft-Latham. They showed that using the plane-strain tensile test to calibrate the Ayada criteria predicts the crack occurrence with less than 10% error.
There are many reports of numerical and analytical studies of the different aspects of the reshaping process. Salmani Tehrani et al. 9 reported the effects of friction and wear of rollers in the reshaping process (circular to square cross-section) using the FEM method. Kiuchi et al. 10 applied the slab method and finite difference solution to accomplish a 2D elastic-plastic analysis of this process. In this research, a method to design the rollers and processes using a simple contact model and the forward-backward algorithm has been presented.
Kiuchi et al. 11 applied the shape functions to analyze the sheet form during the reshaping a circular pipe to an elliptical cross-sectional pipe. In this paper, the profile shape, cross-sectional area, dimension of corners, circumferential shrinkage, length increase, and increase of the pipe wall thickness have been investigated. Kiuchi et al. 12 used a forward-backward algorithm to design channel section roller and they study conditions for creations of the cave-in defect. Naeini et al. 13 used the same algorithm to design roller to produce pipe with a pentagonal cross-section.
Reshaping square pipe by four flat plates was performed by Leu. 14 In this method, the pipe is initially well clamped and gradually converted into the square shape by the flat plates. Also, the cave-in defect, as well as the effective parameters on the process using FEM, have been investigated in this paper. There is no investigation about the cave-in mechanism in this paper. Also, the relation between roller geometry and cave-in defect is not reported in this paper.
Abrinia and Farahmand 15 investigated the reshaping force of a circular pipe into a rectangular form using the Upper Bound Method. The four flat rollers were used in this process. The separation between pipe and roller was neglected.
Zeng et al. 16 used a 3D analysis in a FEM software, Abaqus, to investigate the effect of important parameters on channel shape sections reshaping. Besides, a statistic equation has been presented to design the rollers. This equation consists of important and effective parameters in the forming channel-shaped pipes.
Naeini et al. 17 developed the contact model for the elastic-plastic study of the reshaping process. In this model, rollers were assumed rigid and the pipe was considered as a two-dimensional feature.
In this paper, a new contact model has been developed to predict the cave-in defect. A conceptual contact model called element elongation has been introduced to enhance the accuracy and speed of the calculations. By calibrating this parameter with the pipe crushing test, the accuracy of the presented contact model in predicting cave-in defects is significantly increased. For this purpose, the reshaping process of a circular pipe into a square pipe has been studied by using the Slab Method and the Finite Difference Solution. In this method, the cross-section of the pipe is divided into some major elements in the circumferential direction and also divided into some minor elements in the thickness direction. Besides, the elastic-plastic solving method based on the incremental plasticity and the nonlinear combined hardening effect was applied considering the yielding criterion. To define the cross-section of the rolls, the profile of rolls is divided into lines and arcs of a circle. The rollers are considered rigid on the contrary of pipes. The relative position of the pipe and roll was designed using the newly developed contact model. Based on the mentioned method, the software titled (DARF) is developed. Results of the DARF software were compared to the Abaqus software in predicting the cave-in defect and higher accuracy was attained than the Abaqus. Finally, employing the DARF, the effects of roller radius and the decrease amount on the cave-in defect during the reshaping process of square pipes have been presented.
Theory
The cross-section of the pipe is divided into some major elements for simulating this process. To consider the thickness effect, each major element is divided into an appropriate number of minor elements. Major and minor elements are shown in Figure 2.
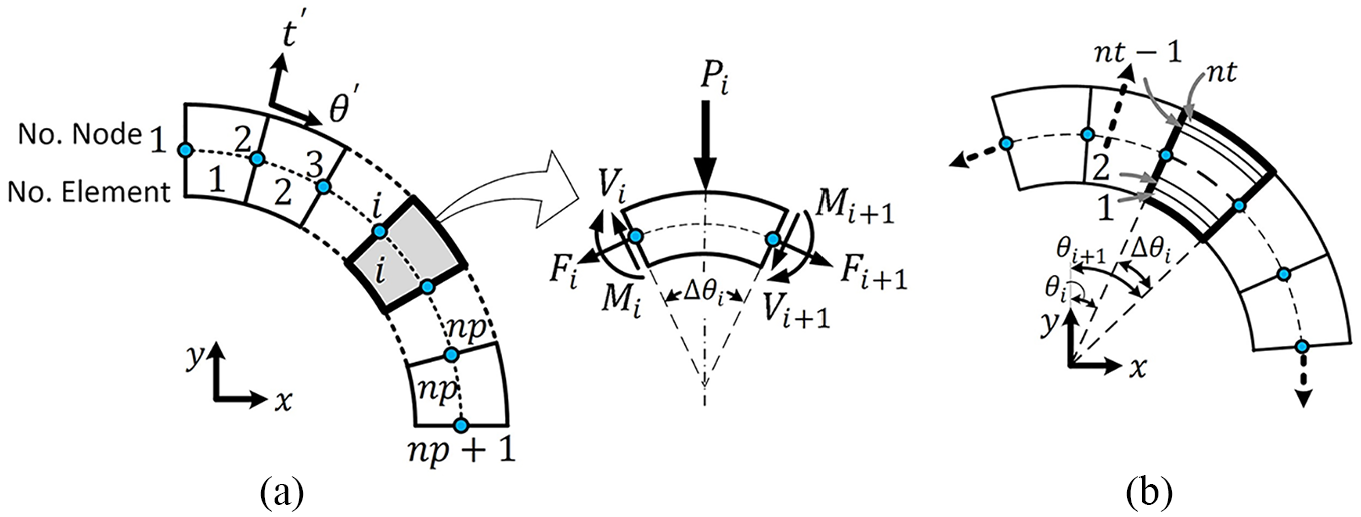
Pipe elements: (a) major elements and (b) minor elements.
By considering the equilibrium equations for the major element in the radial direction, equation (1) and in the circumferential direction equation (2) are obtained. Equation (3) is obtained by equating the sum of the moments around the center of the major element to zero. In equation (3), is the length of the ith element
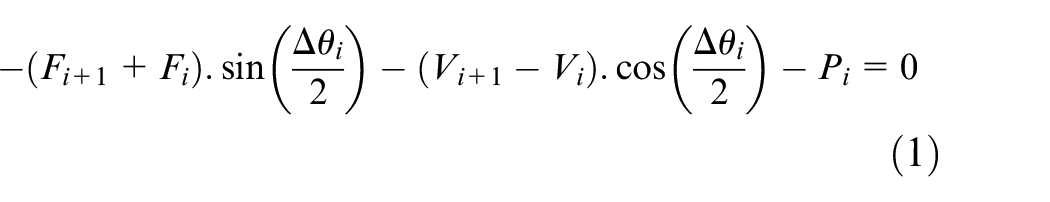
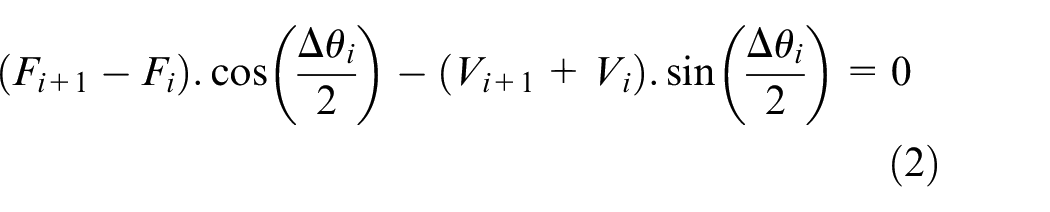

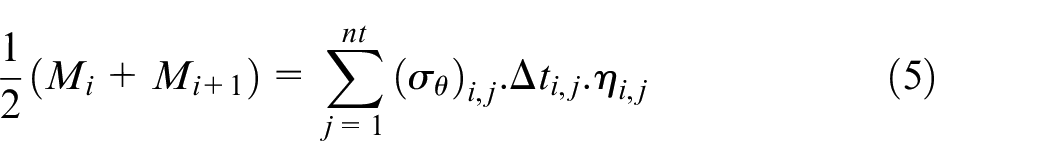
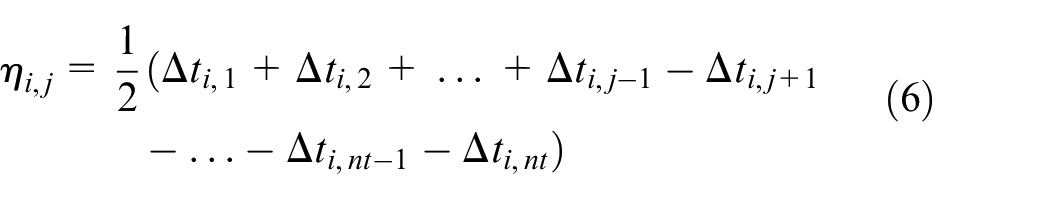
Figure 3 shows the stress distribution, circumferential force, and moment. Equation (4) is obtained by applying equilibrium equations according to Figure 3 to establish the relationship between circumferential stress and circumferential force. In equation (4),
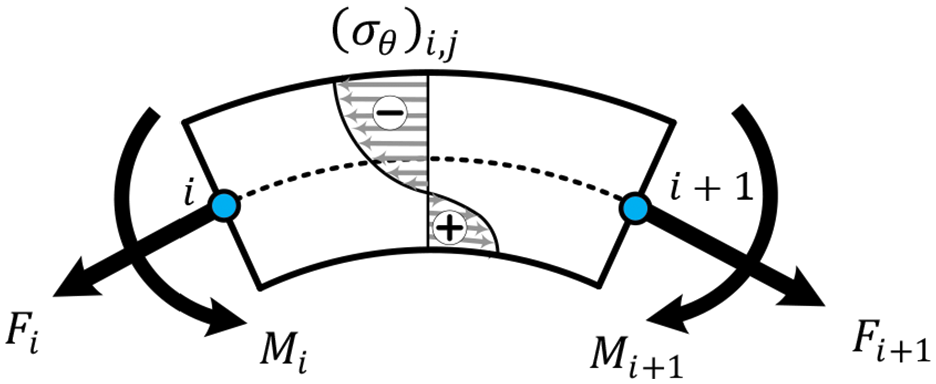
Circumferential force, moment and the resultant of circumferential stresses.
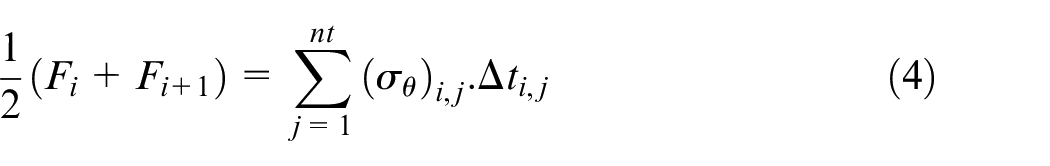
Equation (5) is obtained by equating the sum of the moments in the ith major element to zero, according to Figure 3.
Pipe length is assumed to be high enough, therefore, the longitudinal strain can be neglected and a plane strain theory can be used. The shearing displacement between two neighbor elements has been neglected and the element curvature in circumferential direction has been assumed constant.
By assigning major and minor elements, five equilibrium equations in radial and circumferential directions, bending torque, circumferential force, and resultant circumferential stress can be written which are followed by writing the compatibility equation. Considering Figure 4, the compatibility equation based on conservation of curvature radius of the element has been presented in equation (7).
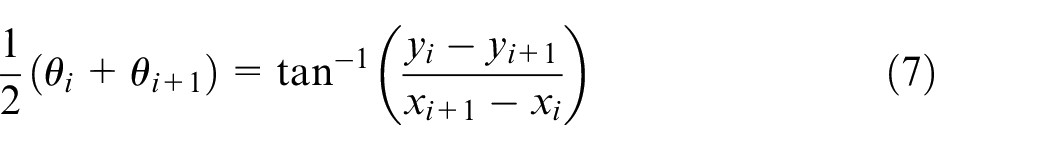
Equations (1)–(7) belong to major and minor elements, considering the boundary conditions resulting from the contact model described below and the symmetry conditions of the boundaries. Finally, a set of equations is created from the sum of the written equations for all elements. By solving the set of equations, the force, bending moment, contact force, and new coordinates of the elements are obtained. Strain components are calculated using new coordinates of the nodes.
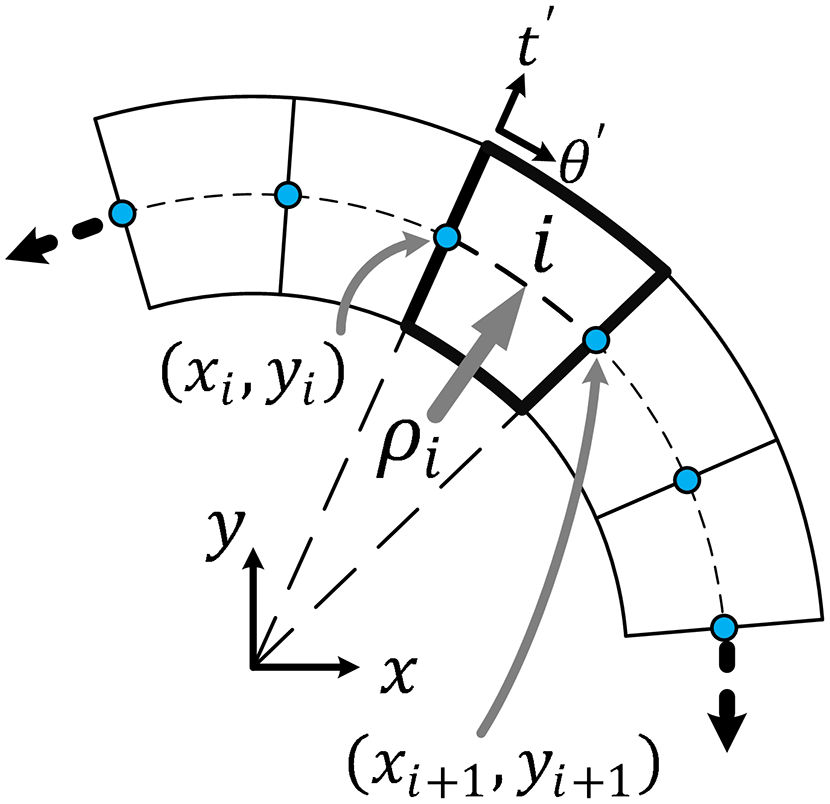
Compatibility of each major element.
Contact model
The rollers are assumed as elements consist of lines and circular arcs for numerical study. The used elements for this purpose are shown in Figure 5.
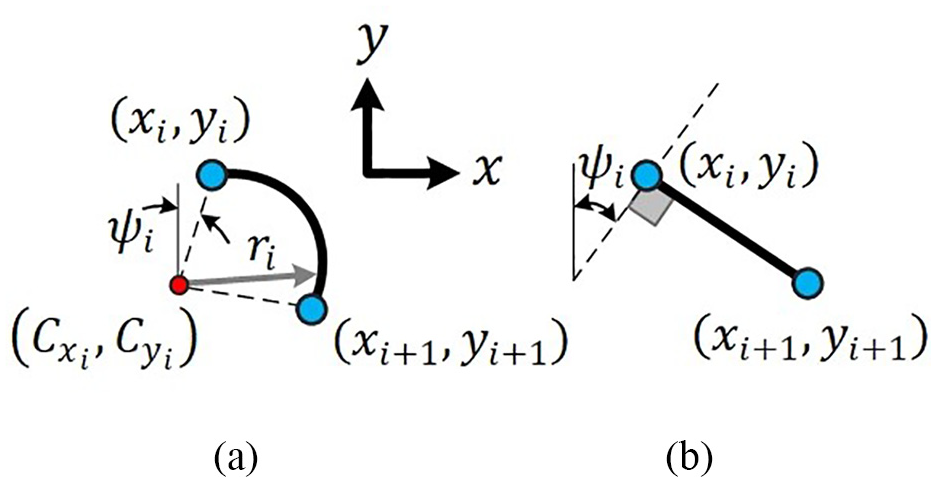
Elements used in roller modeling: (a) arc element (b) line element.
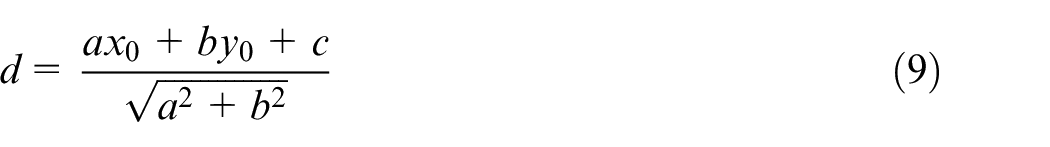
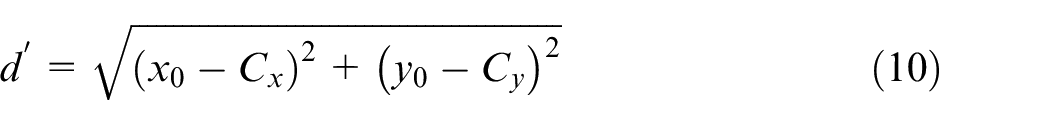
By using the equation of a line and circle, the position of nodes on the pipe with respect to rollers can be achieved. Equation (8) is considered in line elements to determine the position of nodes on sections with respect to the rollers, which constants of the equation are obtained according to the coordinates and input parameters for modeling the rollers. The distance between the node and the roller is obtained using equation (9). In the case that the roller is modeled as an arc, the roller equation is considered as equation (10), and the distance from the node to the roller as equation (11). Figure 6 shows the parameters used in the concept of the node distance from the roller elements.


The rollers are classified into the top, bottom, right, and left roller categories to increase the detected accuracy in the contact model. The geometric distance equation has modified based on the possible angles and positions of the rollers with the relative position to profile, for the top, bottom, right, and left rollers to increase the accuracy of contact detection and simulation speed.
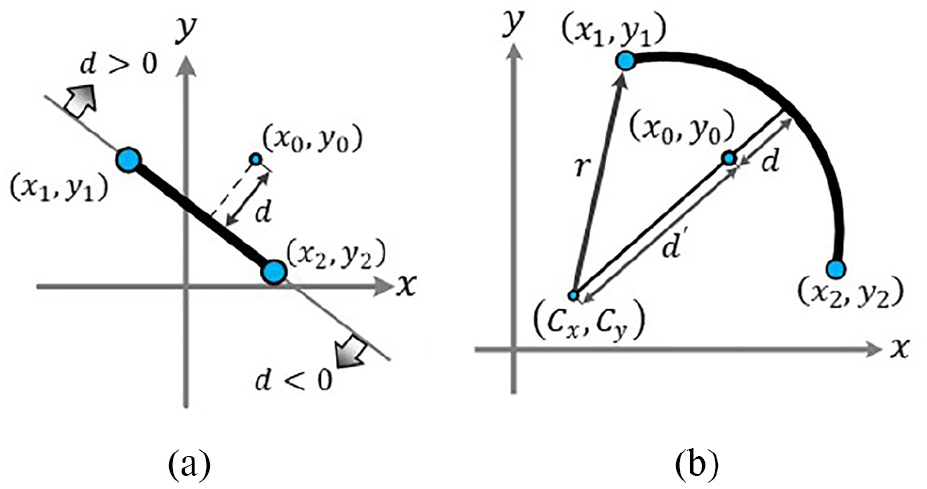
The distance of the node from the roller elements: (a) line element and (b) arc element.
If a node is located within the virtual distance, it would be assumed as a contact node. One more equation should be added which is called “contact equation” to fully define the system. For contact nodes, displacement equations have already been added to previous equations. For other nodes, the “P Force” has been considered zero. Thus, “dpi = 0” has been added to system equations. Related boundary condition has been added at last. Figure 7 shows the algorithm that was used for the contact model.
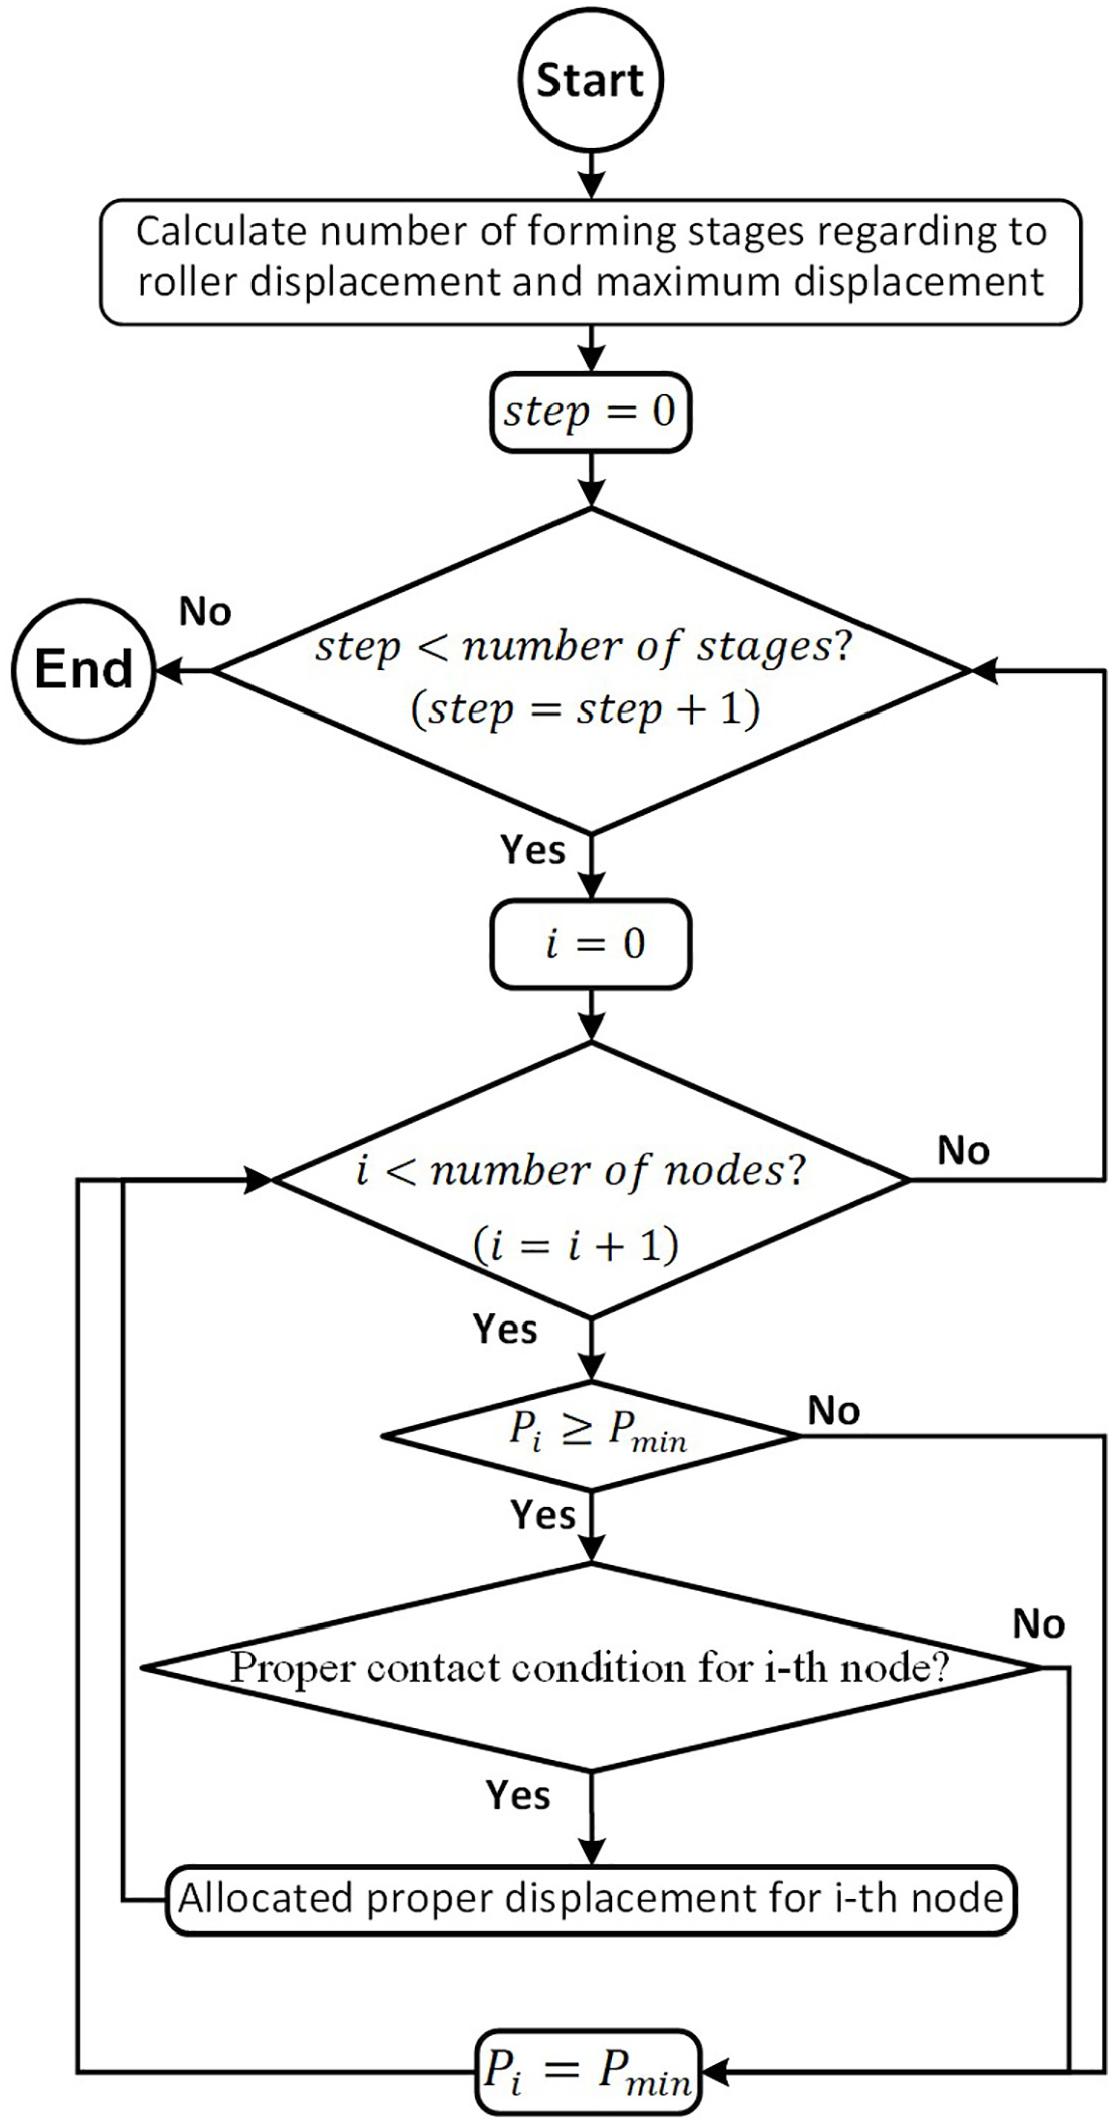
Presented algorithm for applying contact model in numerical study.
Element elongation and sliding the node on the roller
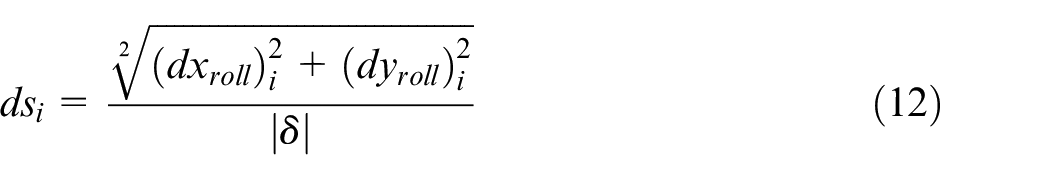
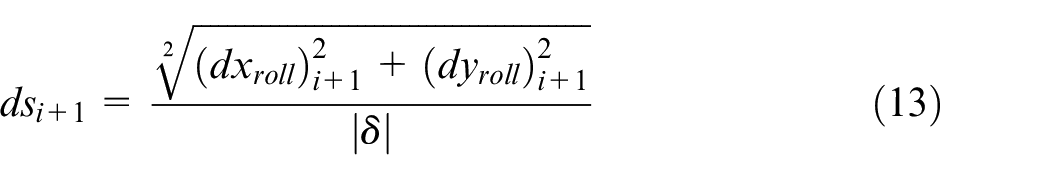
In the presented analytical model, the contact is considered only in the nodes, and the contact is not detected in the gap between two nodes to increase the speed of calculation. When the shape of the roller is very complex or when the cave-in defect begins to form, there would be an interference with the roller in the areas between two nodes. An example of the interference is shown in Figure 8. The normal vector on the roller profile is calculated according to Figure 8 to solve the problem. By projecting the normal vector from the profile surface on the nodes, the direction of the applied displacement for two adjacent nodes can be calculated. In this paper, assuming that in two adjacent nodes, the node with less displacement is a function of the displacement of the second node, which is sliding the node on the roller. The magnitude of the applied displacement to the nodes relative to the displacement in each step of the simulation is obtained using equations (12) and (13). The magnitude of the applied displacement by the roller to node i in the direction of x is equal to
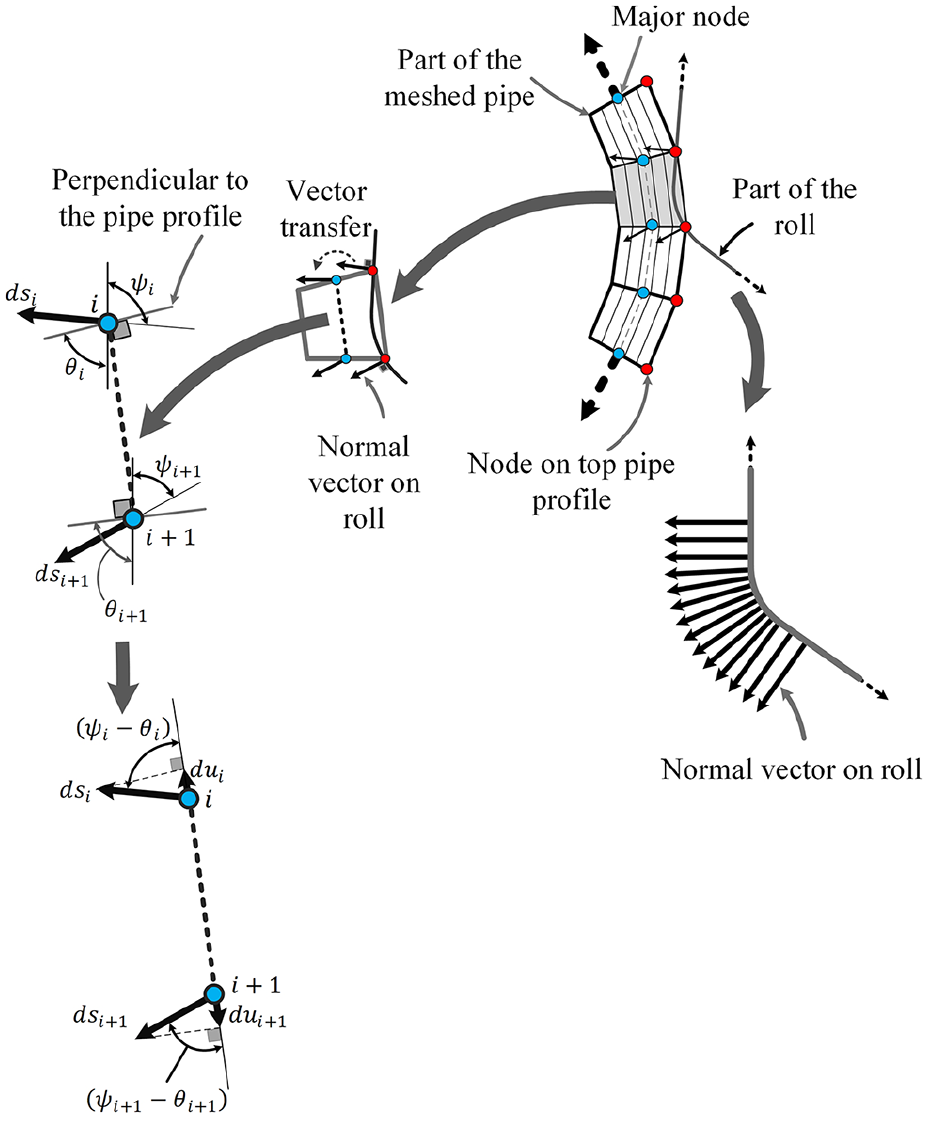
Element elongation due to contact with the roller has many changes in the vertical vector.
In the following, the obtained displacement from equations (14) and (15) is calculated in the circumferential direction to identify the node with slip conditions. Elong parameter is defined as equation (16) to determine the qualified node. This parameter represents the elongation of the element. Elong is divided by the element size to remove the size effect.


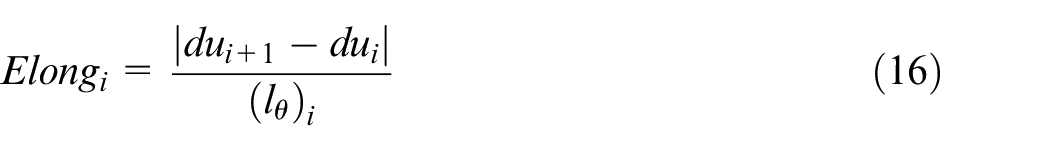
If two successive nodes have the contact condition in the analysis, the element elongation has to be calculated using equation (16). Then it should be compared to the limit value determined from the beginning of the analysis. If the elongation is greater than the limit value, the node with a smaller ds is considered a free node, and the other node is in the contact position. The limit value is obtained from the pipe crushing test. In this method, a pipe similar to the primary pipe is placed between two flat plates and is compressed. Then the magnitude of the cave-in defect in the pipe is calculated. The simulation with DARF is repeated using different limit values. A value that indicates a similar cave-in is regarded a suitable value for the analysis of the pipe.
Elastic-plastic equations
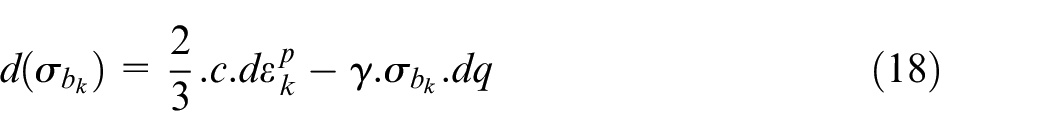
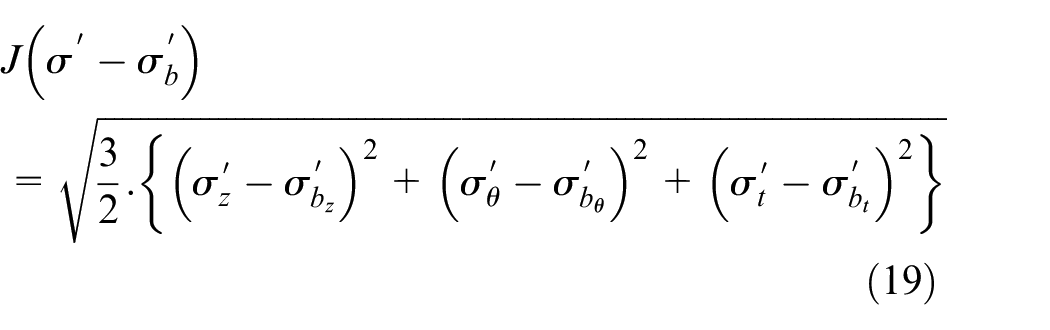
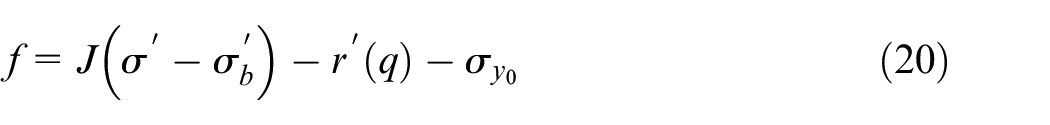
In this paper, incremental plasticity associated with nonlinear combined hardening has been used. In combined hardening, the yielding surface grows larger and displaces at the same time. The surface enlargement is expressed by equation (17) while the displacement has been shown by the back-stress (Figure 9). The back-stress increment has been defined by equation (18). 18 Q, b, c and are constants that have been obtained from the standard tension test. 19 Equations (19) and (20) show, in sequence, J yielding criterion and applied yielding function. 20
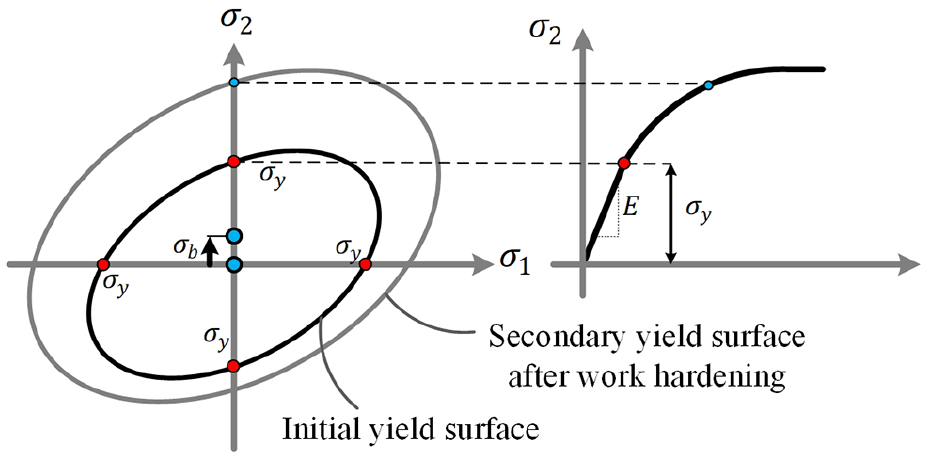
Alteration of yield surface in nonlinear combined hardening.

In the incremental elastic-plastic analysis, defining the current incremental state in the elastic or plastic state is one of the most important considerations. According to Figure 10, an element can have five different statuses. 1, 2, and 5 are elastic statuses while 3 and 4 are plastic statuses. 13
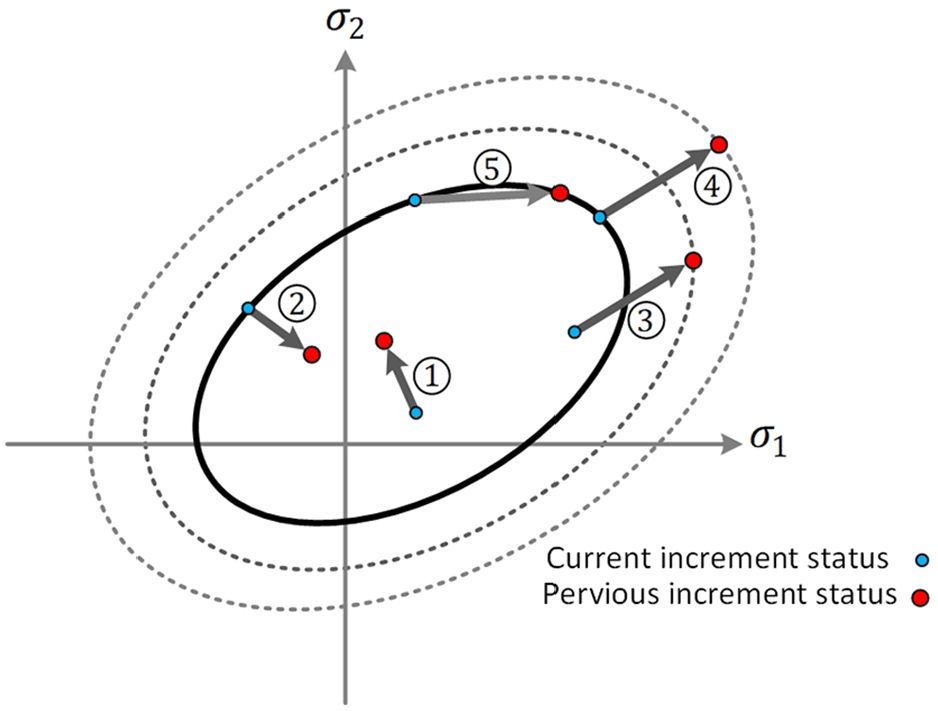
Different increment statuses: 1 – elastic loading,2 – elastic unloading, 3 – plastic loading, 4 – plastic loading,5 – neutral status.
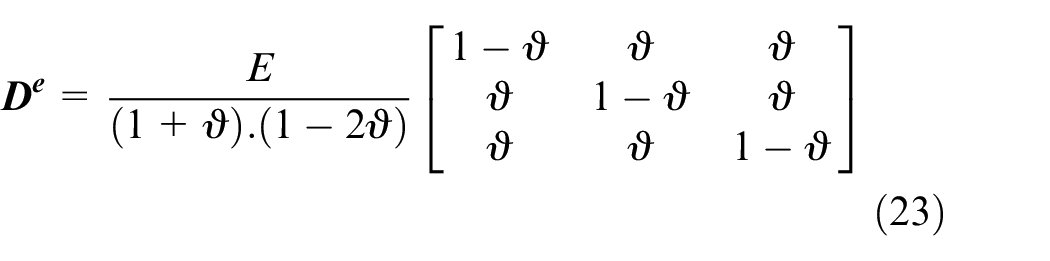
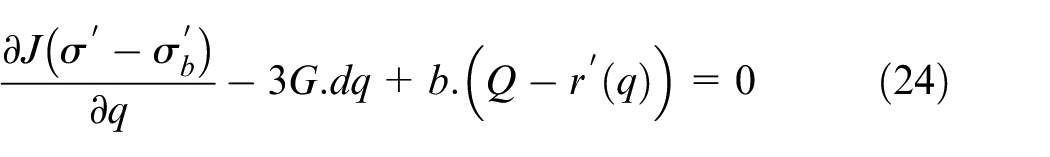
The relation of stress with strain is defined by the Figure 10, The D coefficient is obtained from equation (21) in elastic conditions and in plastic conditions by radial return algorithm. In the radial return algorithm, each increment of the program is solved in two steps. In the first step, the increment is assumed to the elastic and then the plastic condition is solved in the second step. If it is plastic, the equation (24) will be solved by the Newton-Raphson method. The solution of this equation leads to the increment of plastic strain. Finally, the D coefficient should be modified using the equations (21)–(25) in plastic conditions.

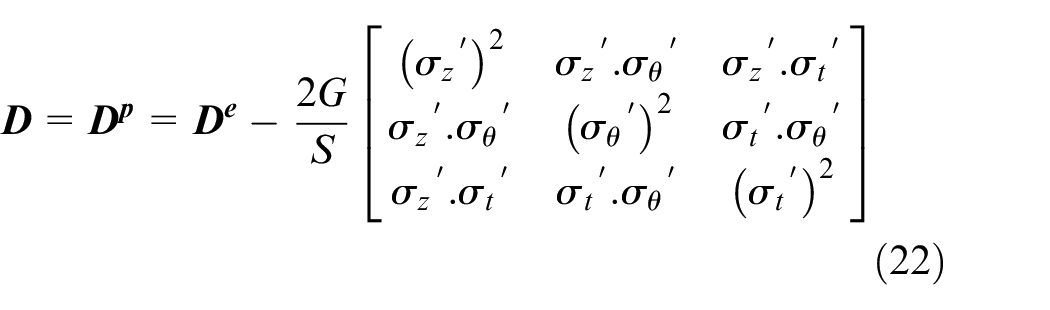
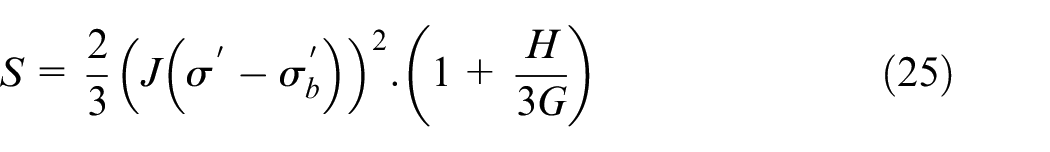
In equation (25), H is the slope of real stress and strain curve. Figure 11 shows the Elastic-Plastic algorithm that was used in the numerical analysis.
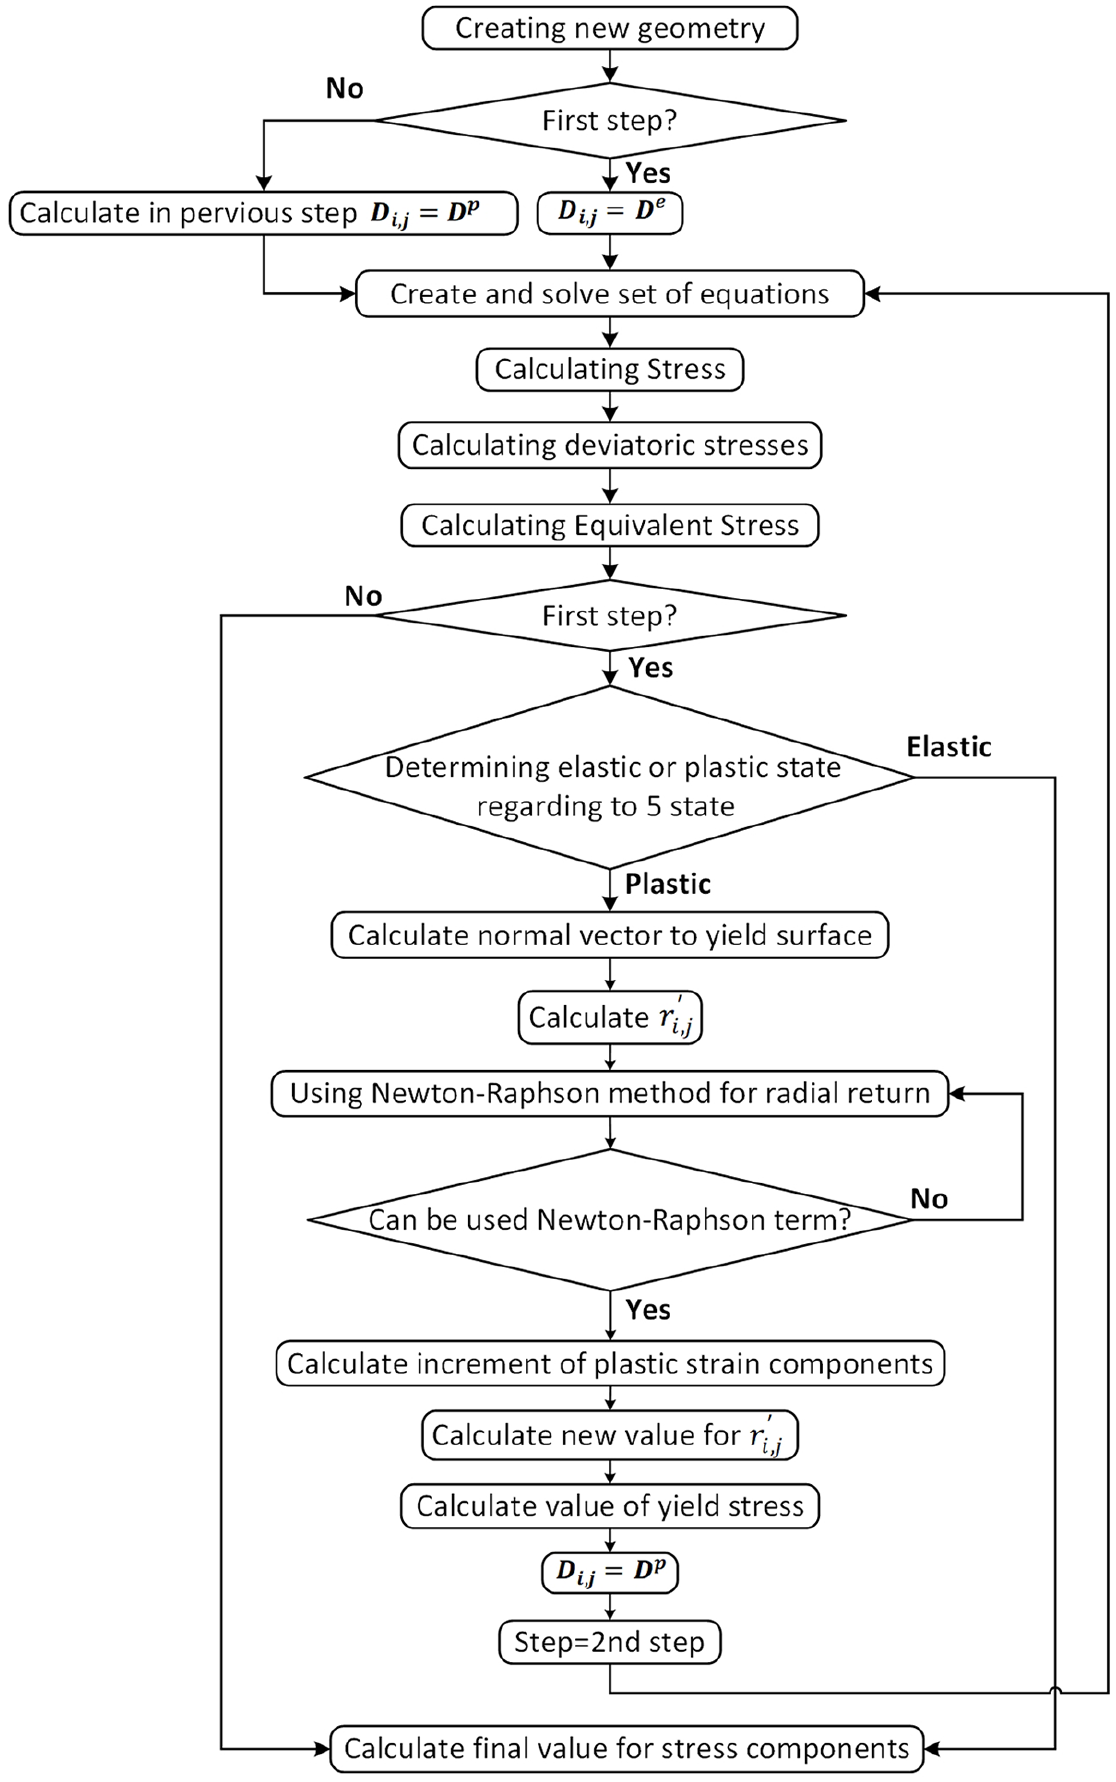
Elastic-plastic algorithm.
Modeling
As mentioned before, rollers are modeled as elements including lines or arcs of a circle. Regarding the symmetry of the square tube, just 1/8 of the tube cross-section has been considered. Figure 12 shows two samples of the model in the DARF software.
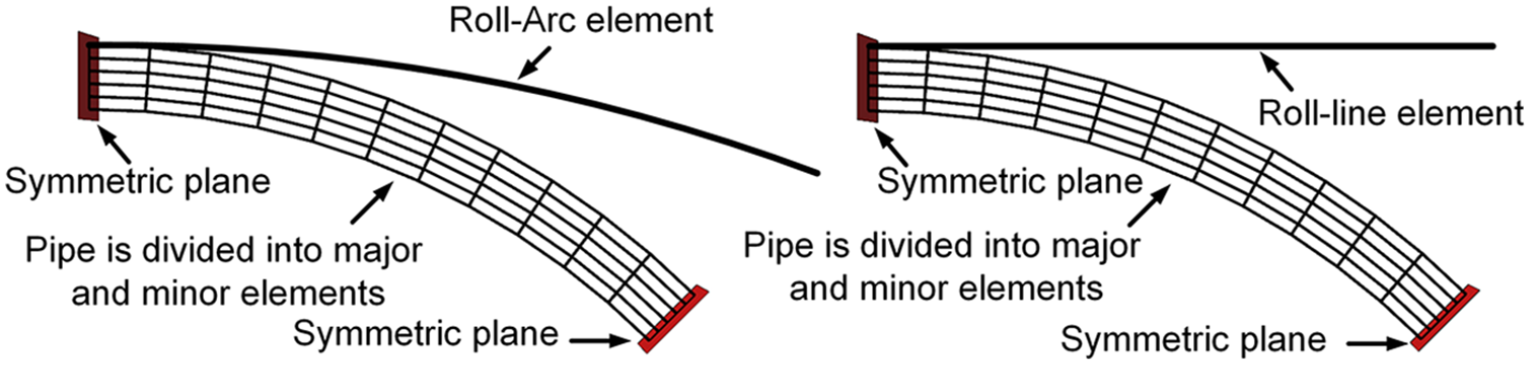
Two samples of modeling, which are divided into major and minor elements in the developed software (DARF): circular pipe and roller.
To study the effects of tubular roller radius, a pipe with an 80 mm diameter has been chosen. Besides, the100, 125, 150, 200 mm has been selected for the radius of rollers and infinite (straight line) displacement is assumed 4 mm.
Material properties
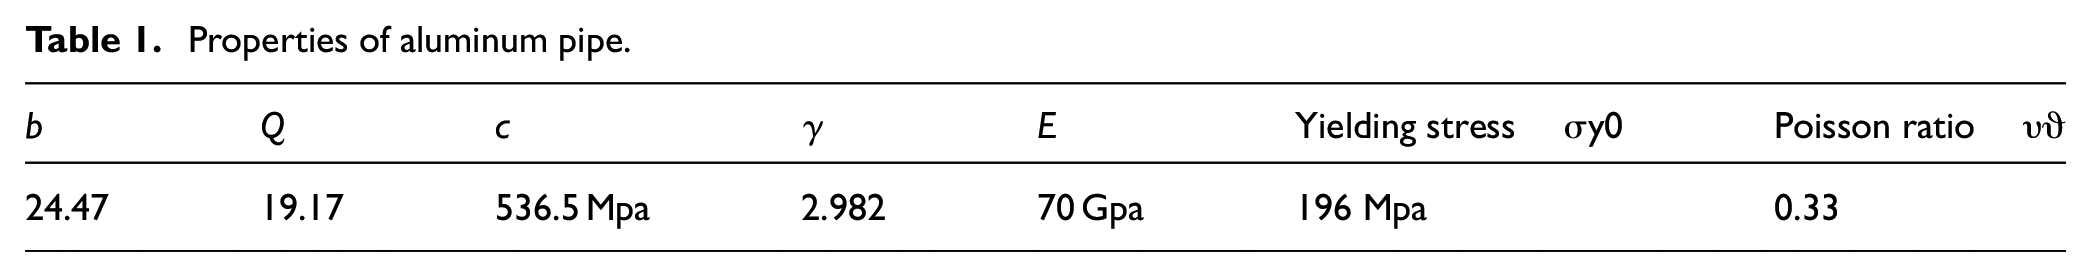
To define the mechanical properties of a sample, one Aluminum pipe has been tested with a 1-D tension test. The work hardening coefficient and other properties are presented in Table 1.
Properties of aluminum pipe.
Numerical simulation with the Abaqus software
For evaluating the presented software with commercial finite element software, the Abaqus 2020 software has been selected. For this purpose, 2D numerical simulation with a dynamic explicit solver has been used. Figure 13 shows the meshed geometric model of pipe in the Abaqus software. The roller and the pipe have been modeled by analytical rigid and deformable elements respectively. The geometrical properties are the same for simulation with the Abaqus software and the DARF software.
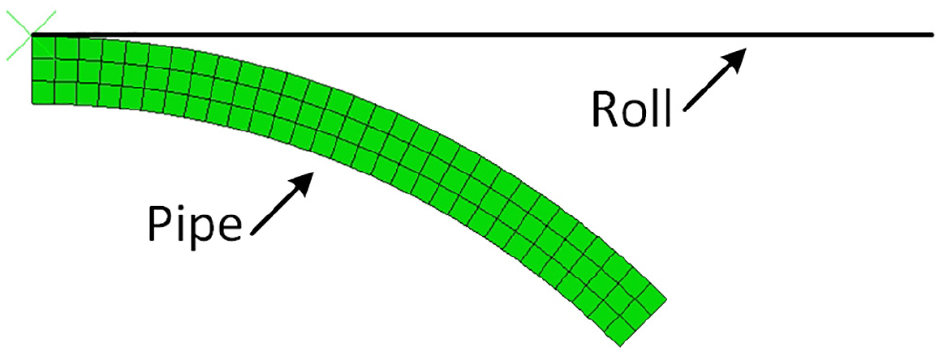
The meshed model in the Abaqus software.
The roller movement has been constrained in all directions except the vertical direction. Vertical displacement has been set as 4 mm. Surface to surface contact has been used for the contact between the roller and the pipe. The separation possibility was considered in the contact setup. The CPS4R first-order element with four nodes has been used. The same as the DARF software setup, a 1/8 of the tube cross-section has been considered for the numerical simulation with the Abaqus software.
Experimental tests
Figure 14 shows the experimental set-up containing a machine with one forming station and four flat rollers. Aluminum tubes with 200 mm length and 3 mm thickness have been used as input workpieces. The experimental tests are performed for two states: 2 and 4 mm. Figure 15 shows the deformed pipe. The cave-in defect of pipe has been measured by a CMM machine.
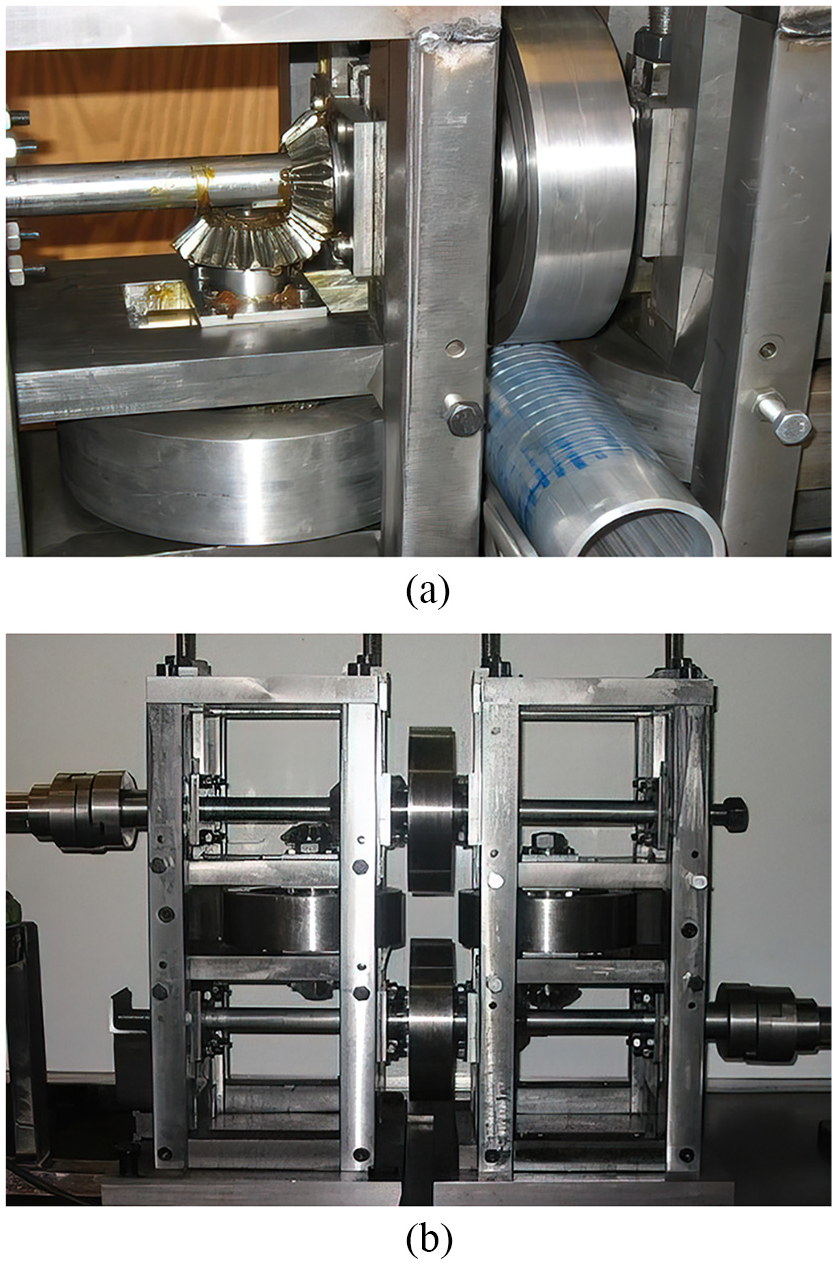
The experimental setup: (a) feeding the pipe and (b) the forming machine.
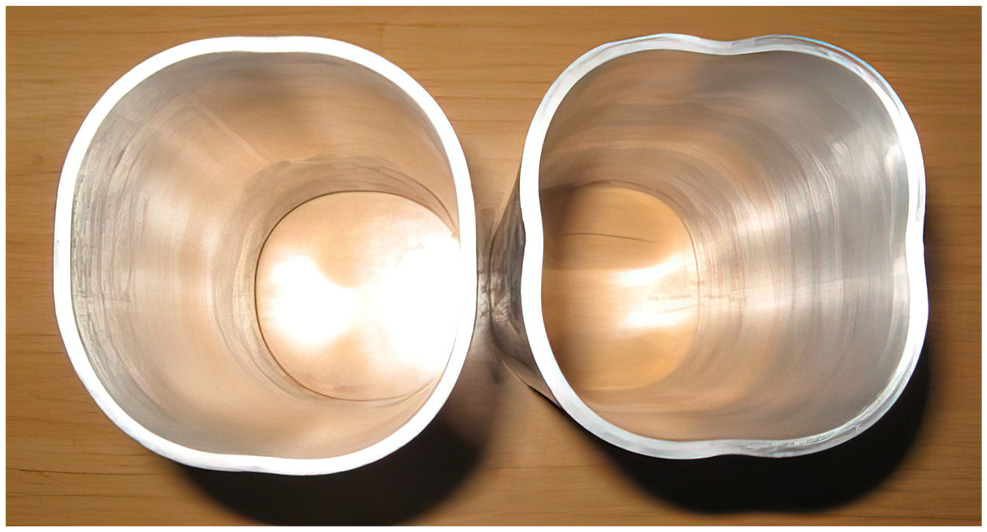
Workpieces: for the sample in right-hand the displacement is equals to 4 mm and in the left-hand is equal to 2 mm.
Result and discussion
As mentioned before, for comparison between the presented software in this paper (DARF) and FEM commercial software, numerical simulation was also done by the Abaqus commercial software. Figure 16 shows the Von Mises stress distribution of the pipe that pipe crashing was observed in forming the pipe by using a flat surface roll. Part (a) of this figure has been calculated with the Abaqus software and part (b) has been calculated with the DARF software. As it was clear in this figure, a cave-in defect is detectable in this forming situation.
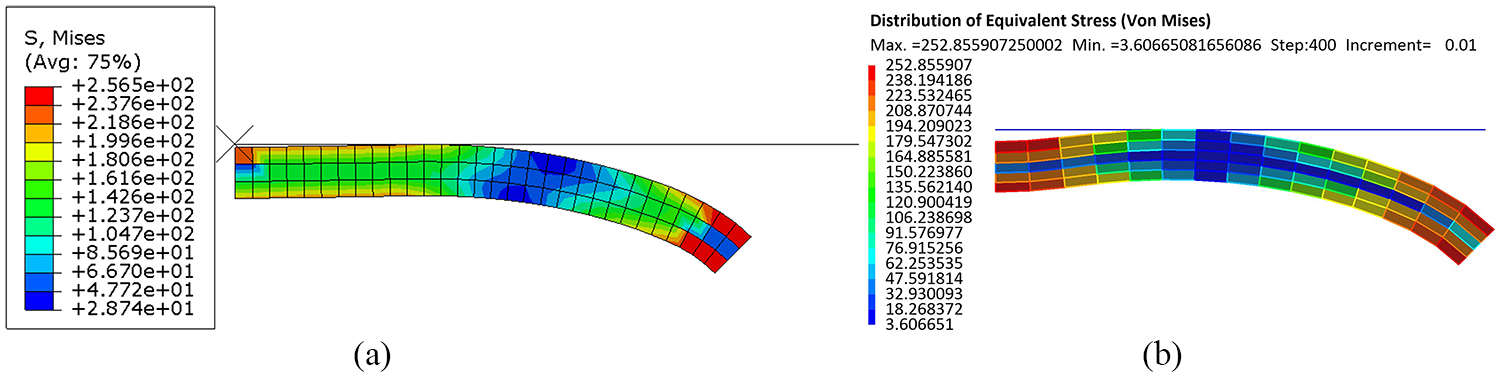
The Von Mises stress distribution of the pipe in forming the pipe by using a flat surface roll: (a) using Abaqus and(b) using DARF.
Figure 17 shows the results of the prediction of the cave-in effect by numerical simulation from the presented software (DARF) and the Abaqus commercial FEM software. Also, the results of experiments for verifying numerical simulation existed in this figure. As can be seen in this figure, the results of the DARF prediction is considerably closer to experimental results than the Abaqus software results. It means that the DARF software predicate the forming process with higher accuracy than the FEM commercial software.
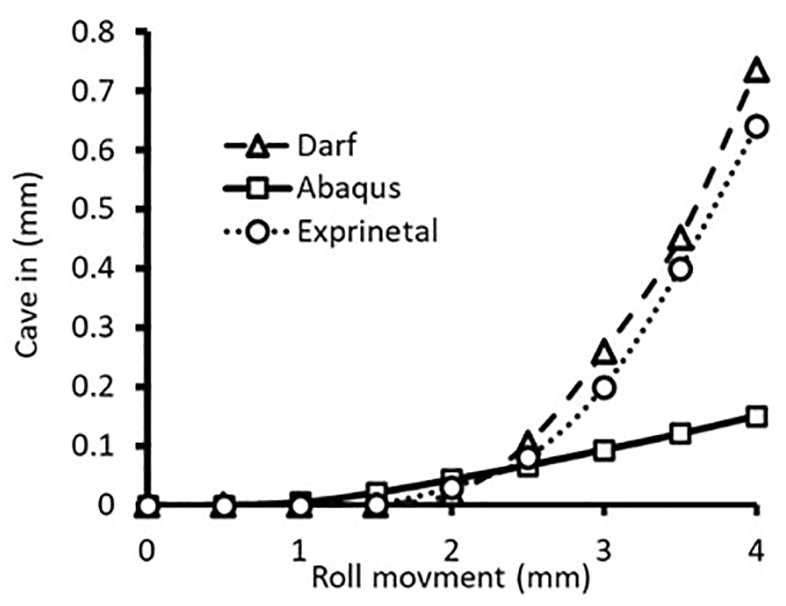
Comparison between the results of the DARF software and the Abaqus software with experimental results.
Despite the high accuracy and speed of calculation, Abaqus is a general software. So it is not specifically optimized for the process like reshaping. One of the reasons for the higher accuracy in DARF Software is the specialization of contact detection equations for reshaping. This specialization causes the software to have a high speed of calculation besides the simplicity of working.
Figure 18 shows the effect of roller radius on maximum cave-in defects in different roller movements. These data have been obtained from the numerical simulation. Regarding this figure, a decreasing trend can be seen between the maximum measured cave-in and the roller radius.
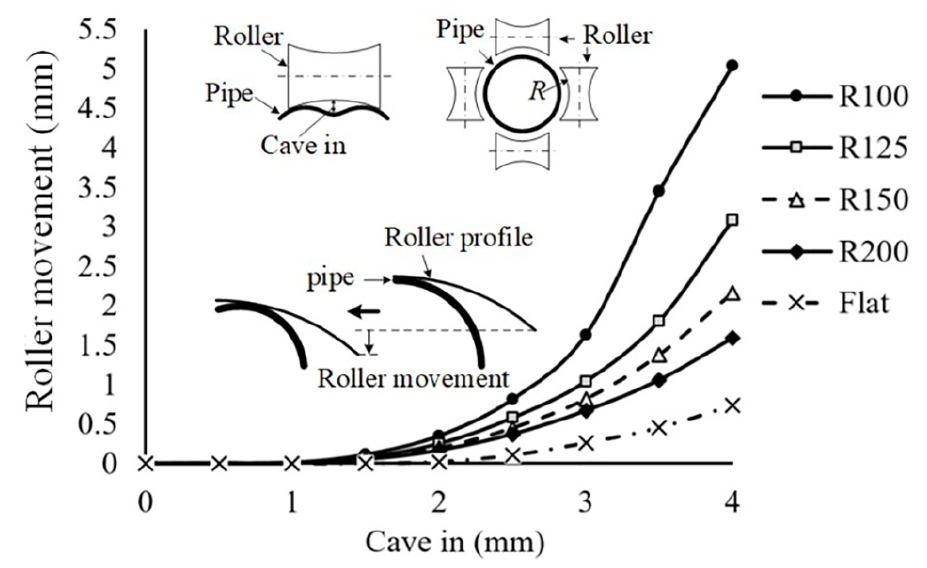
The effect of the roller radius on the maximum cave-in defect.
As shown in Figure 19 increasing the roll radius makes a decrease in the equivalent plastic strain. Consequently, the Von-Mises stress was increased with a decreasing roll radius. This subject is shown in Figure 20. However, the strain hardening effect was increased with increasing the Von-Mises stress and consequently, formability was extremely decreased.
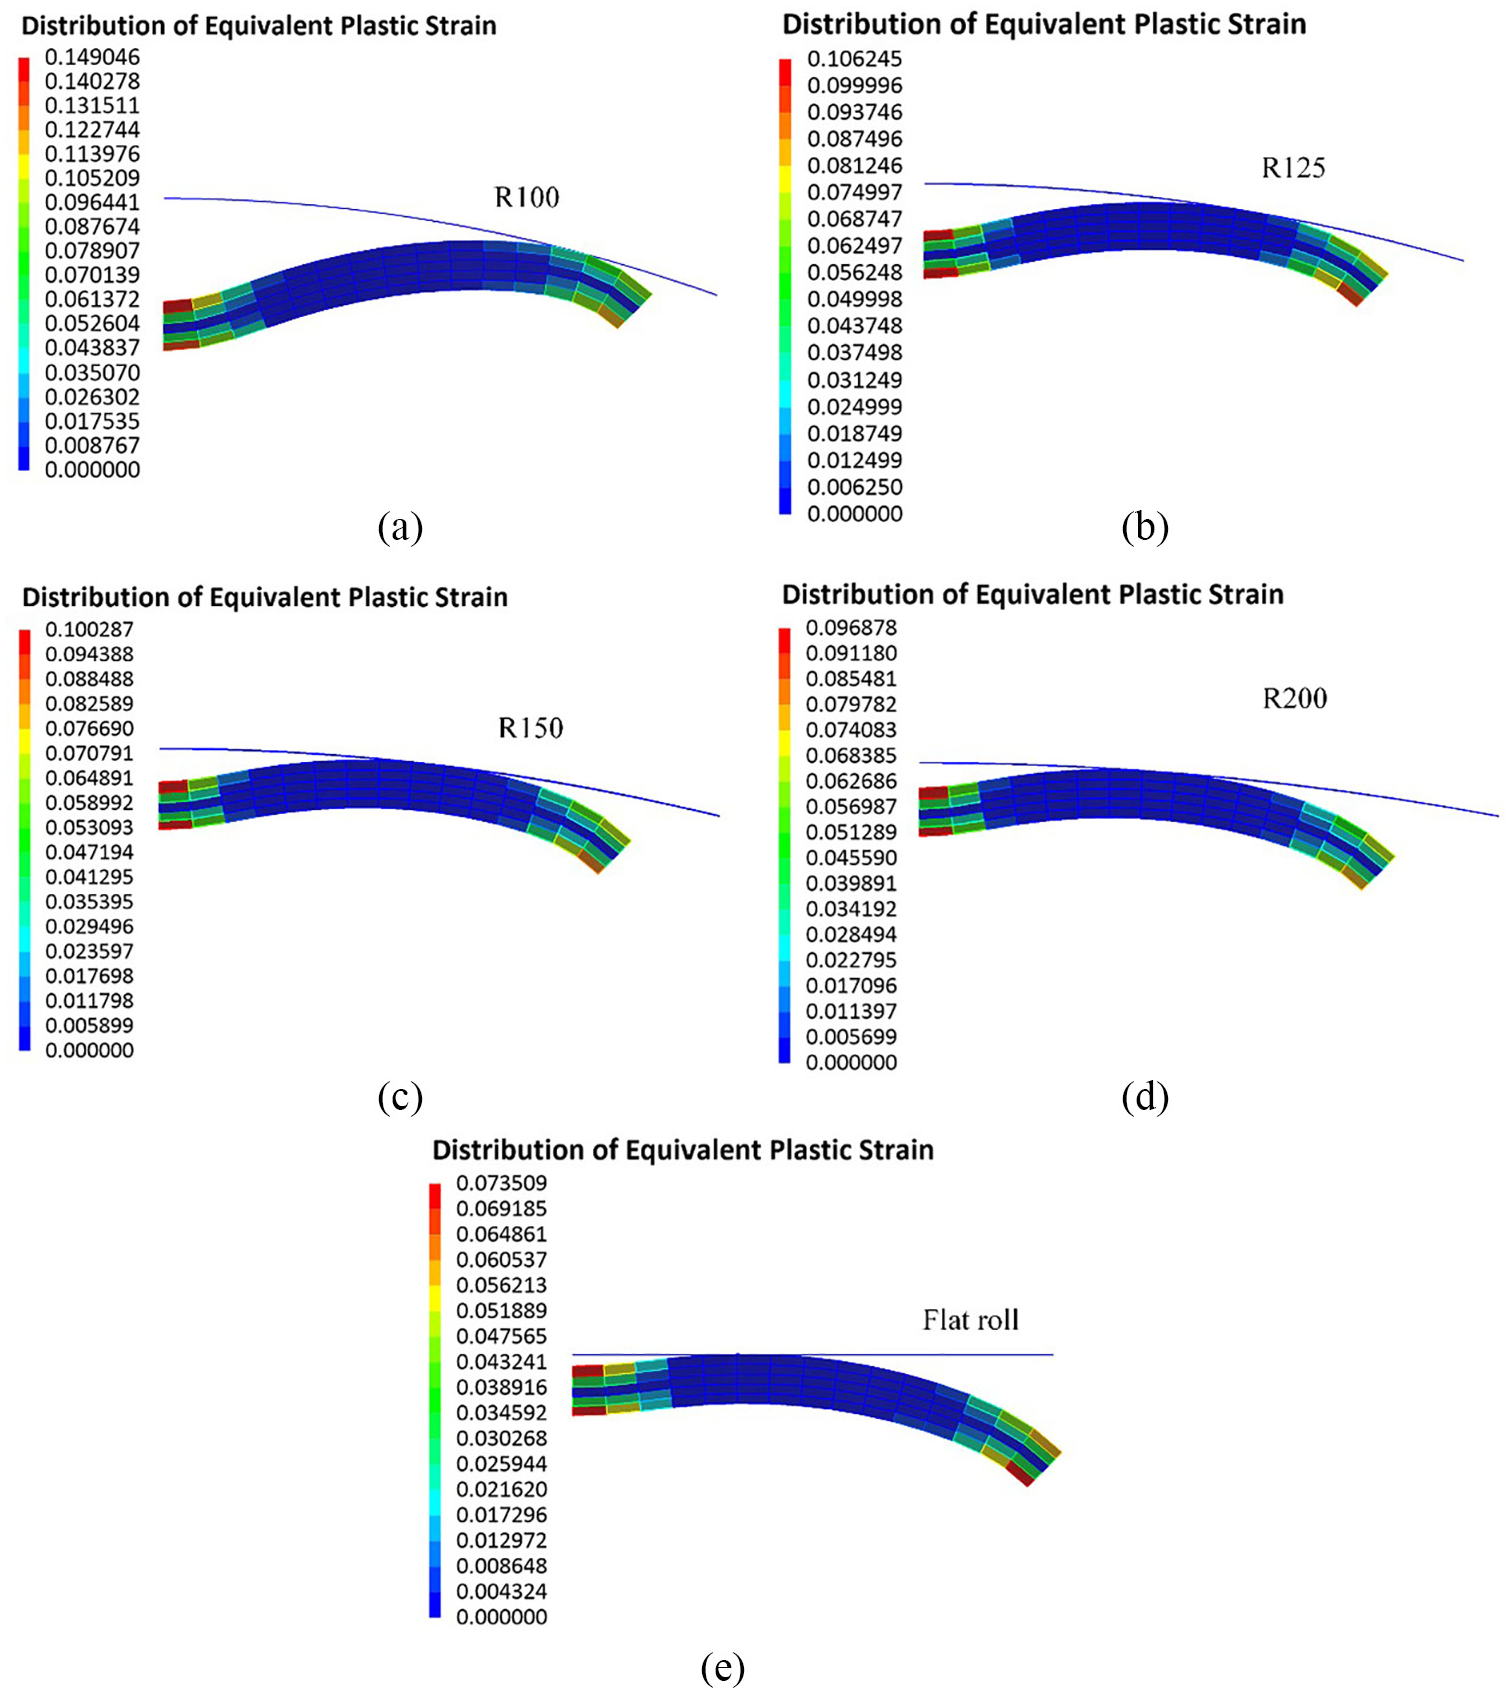
Plastic strain distribution for 4 mm roller movement for: (a) 100 mm roller radius, (b) 125 mm roller radius, (c) 150 mm roller radius, (d) 200 mm roller radius, and (e) flat roller.
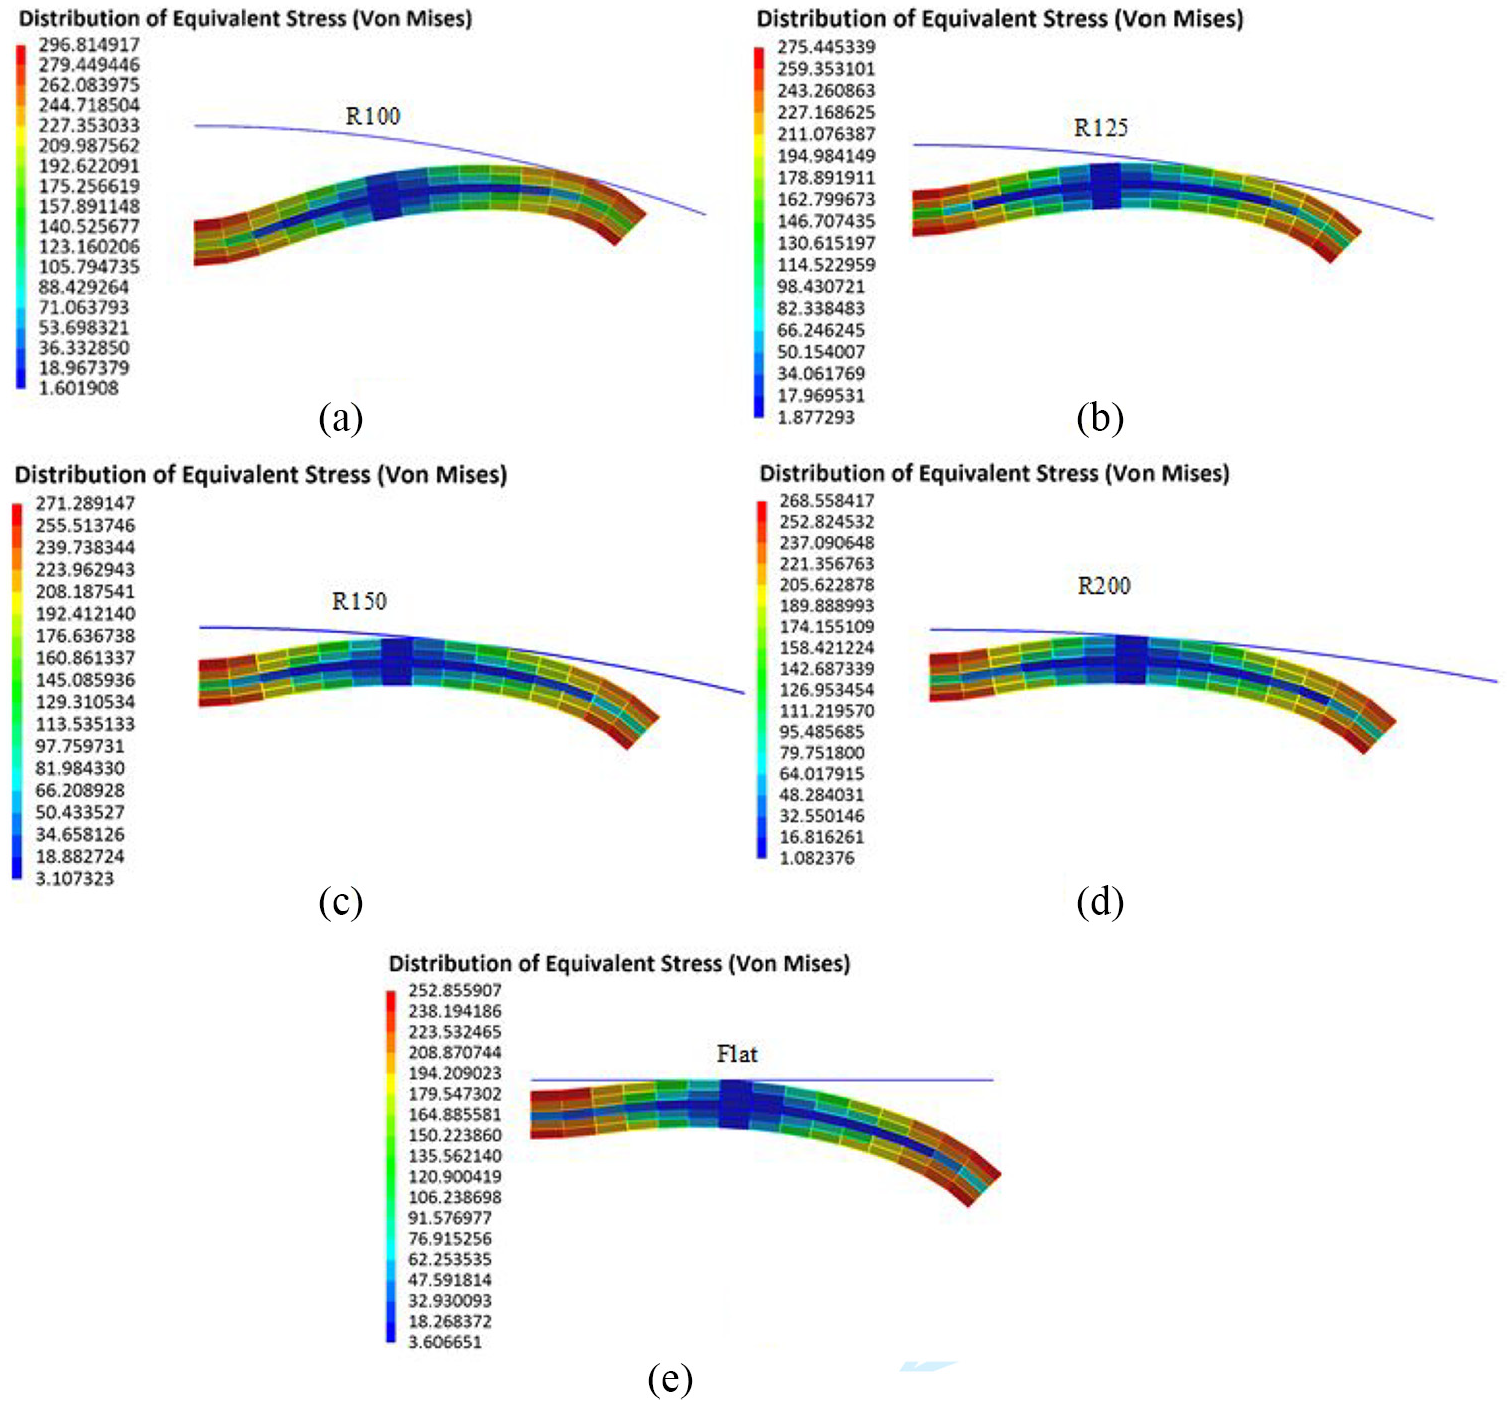
Von-Mises stress distribution in 4 mm roller movement for: (a) 100 mm roller radius, (b) 125 mm roller radius,(c) 150 mm roller radius, (d) 200 mm roller radius, and (e) flat roller.
Figure 21 shows the yield stress distribution in different roller radiuses. The roller movement in this figure remained 4 mm. According to this Figure, the strain hardening region decreased the formability and therefore, the forming region was transferred to the surrounding. The strain hardening region can be considered as a rigid bar and therefore, the forming of the surrounding region in a pipe can cause cave-in defects. These phenomena can justify a decreasing trend between roller movement and the cave-in defect creation and growth.
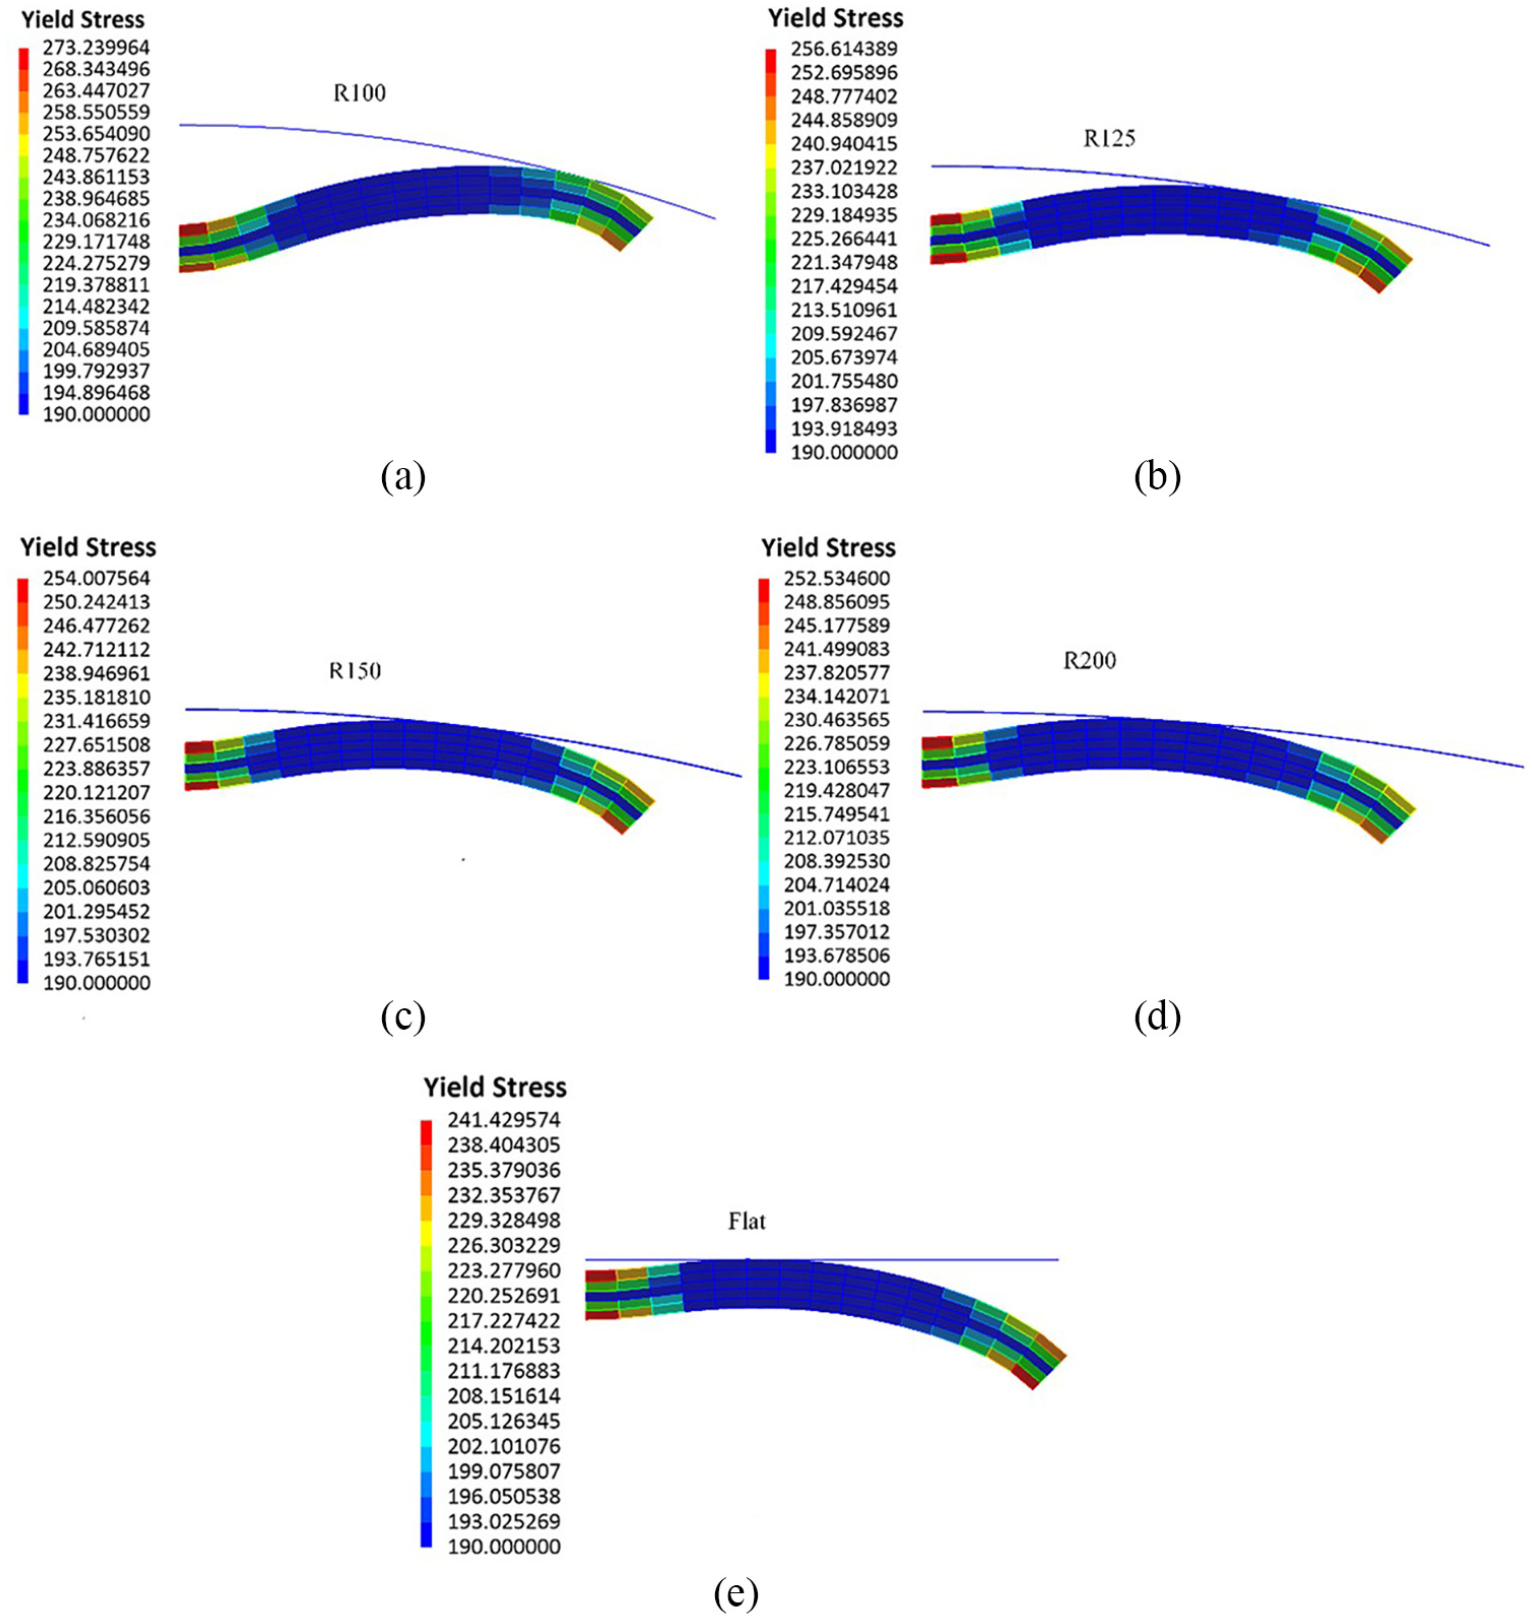
Yield stress distribution in 4 mm roller movement for: (a) 100 mm roller radius, (b) 125 mm roller radius, (c) 150 mm roller radius, (d) 200 mm radius, and (e) flat roller.
Regarding the cave-in defect consideration, a flat roller with the 2–4 mm movement was a good choice in the reshaping process. But, as it was shown in Figure 22, an increasing trend can be seen between the roller radius and the force. The high force was harmful to the bearings of stations. Therefore, it is better to plan more reshaping stations to have a suitable force and to avoid cave-in defects.
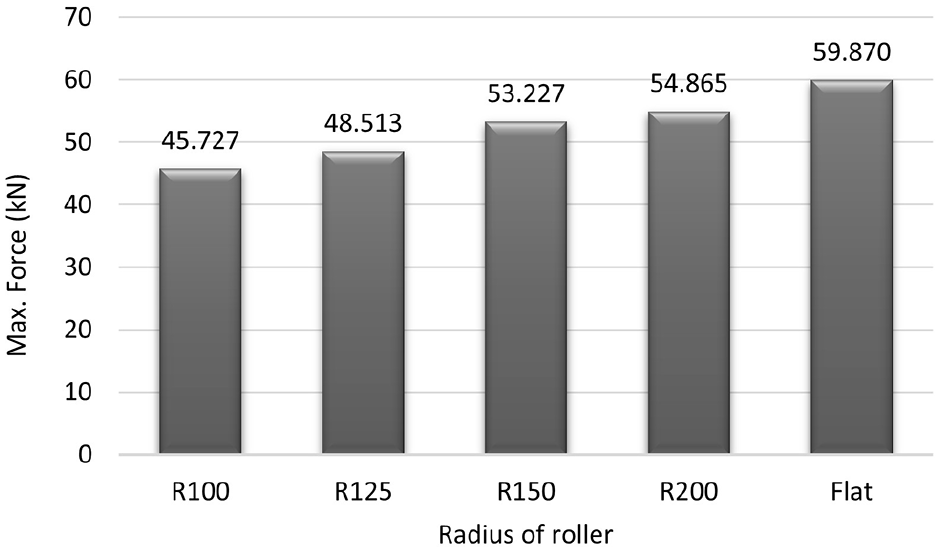
Reshaping force acting on roller in different roll radius.
Conclusion
Developing a method that, in addition to simplicity, has high accuracy and speed of calculations is one of the industrial needs. For this purpose, a method was developed to analyze the reshaping process using an approach with low computational cost and at the same time acceptable accuracy of the process. Cave-in defect is one of the most important defects in reshaping process. In the developed method, the contact detection equations were considered in such a way that the cave-in defect was predicted with higher accuracy. So, in this paper, an analytical study for the reshaping process was presented by considering the work hardening effect. The analytical method based on the slab method and a contact model capable of predicting the cave-in defect was considered in the model. In the employed contact model, the concept of element elongation was defined to increase the accuracy of the model to predict the cave-in defect. Nonlinear combines strain hardening model has been used for the correct prediction of the cave-in defect. The presented model has high accuracy to predict the cave-in defect because of considering an appropriate theory for the strain hardening effect. Based on this model, a software titled “DARF” was developed. Also, the effects of roll radius increase on the cave-in defect have been investigated applying “DARF” software. The results of this investigation are as the following:
Employing the concept of element elongation and calibrating it with the pipe crushing test causes the accuracy of the cave-in defect prediction to increase significantly compared to conventional contact models.
The presented software has considerably higher accuracy than Abaqus in predicting the cave-in defect based on comparing it with the experimental results.
The cave-in defect has an increasing trend with increasing the roller radius.
Reshaping force has been extremely increased with an increasing roller radius.
According to the result it can be deduced that if the circular pipe is less sensitive to the work hardening effect, the power work hardening index “n” would be smaller, and also the cave-in defect is smaller.
Footnotes
Acknowledgements
Authors thank Jahad Daneshgahi Institute for providing an experimental set-up that greatly assisted the research.
Declaration of conflicting interests
The author(s) declared no potential conflicts of interest with respect to the research, authorship, and/or publication of this article.
Funding
The author(s) disclosed receipt of the following financial support for the research, authorship, and/or publication of this article: This research was partially supported by Jahad Daneshgahi Institute.