
Abstract
Collaborative robots are becoming increasingly important for advanced manufacturing processes. The purpose of this paper is to determine the capability of a novel Human-Robot-interface to be used for machine hole drilling. Using a developed voice activation system, environmental factors on speech recognition accuracy are considered. The research investigates the accuracy of a Mel Frequency Cepstral Coefficients-based feature extraction algorithm which uses Dynamic Time Warping to compare an utterance to a limited, user-dependent dictionary. The developed Speech Recognition method allows for Human-Robot-Interaction using a novel integration method between the voice recognition and robot. The system can be utilised in many manufacturing environments where robot motions can be coupled to voice inputs rather than using time consuming physical interfaces. However, there are limitations to uptake in industries where the volume of background machine noise is high.
Keywords
Introduction
Since Bell Laboratories proposed a system for speech analysis and synthesis in the 1930s, the challenge of speech recognition has been improved progressively. In 1952, they built a system for isolated digit recognition for a single speaker. Then, in the mid-1970s, the basic ideas of applying pattern recognition technology to speech were proposed. This included Bridle and Brown developing the mel-based cepstral parameters for feature extraction from speech in 1976. 1 Research in the 1980s shifted from pattern recognition towards a more rigorous statistical modelling framework. This included the Hidden Markov model, Gaussian mixture models and the application of Artificial Neural Networks. 2 The technology’s commercial break came in 1990 when Dragon Co. released ‘Dragon Dictate’, the first speech-to-text software for the consumer market. This software relies on statistical analysis to convert its dictionary to a lexicon through corpus analysis to predict the words that may come next in a sentence. This reduces the computational load of speech recognition; however, the software is limited by processing power. It was not until 2010 that Google introduced the first personal assistant which used cloud computing to recognize human speech; these have rapidly increased in popularity since.
Voice control has been rapidly adopted for Human-Robot-Interaction (HRI) and can be found on a wide array of consumer products with implementation methods from across the development history of speech recognition. Despite commercial success the technology has never been widely accepted in industry. The weight of financial loss and risk deter the use of temperamental interfaces. The accuracy of machine control is paramount and with the trend for automation and data exchange in the manufacturing industry, it is apparent that effective collaboration between humans and robots is needed to increase productivity and quality. 3 When applied to robotic assembly operations, Human-Robot-Collaboration (HRC) allows the worker to operate near the robot. Several HRC robots have been developed, these robots use intelligent control technology, high-performance sensors and state-of-the-art software technologies. 4 HRC Models for the ‘trust’ between humans and robots have also been developed. 5 This is a promising application for a semi-autonomous voice-controlled system, as the combination of speech and haptic control has the potential to form an intuitive HRI. Gustavsson et al. 6 has proved this by making a HRC demonstrator which combines speech recognition and haptic control.
Currently, most HRI in industry utilize physical and graphical user interfaces. These can substantially burden the cognitive load of a worker. HRI through spoken dialogue aims to reduce this load: uttering a voice command is often simpler than entering data using a keyboard and does not engage the operator’s hands or restrict the operator’s movements. 7 In an industrial setting, noise from environmental factors can affect the accuracy of speech recognition.
This paper will test an algorithm based on a non-statistical model, allowing for a significantly lower implementation complexity. The chosen method of speech recognition reduces language from a nuanced message into a discrete command. The machine is not aware of the meaning of the words, but is associating a noise to an action. Additionally, the research will consider the environmental factors that could effect the accuracy of quasi-natural speech analysed using Mel Frequency Cepstral Coefficients (MFCC) 8 with Dynamic Time Warping (DTW). 9 Once recognized, the signals can be sent downstream to control other systems, in this case, a KUKA KR16 industrial robot with Robot Sensor Interface (RSI) software. The paper is organised as follows: the next section reviews different approaches to speech recognition with a consideration for industry application. Then, environmental factors that effect speech recognition are assessed and the experimental set-up used to investigate the capabilities of the identified algorithm and hardware is described. Finally, the experimental results of the voice output commands are presented and conclusions on the capabilities of the designed system are made.
Adoption of a voice activation system in an industrial setting
Industry application
HRI in industry are mostly realised through physical (buttons, switches and dials) and graphical user interfaces; these are regulated by DIN EN ISO 9241-110. 10 A graphical user interface can burden the cognitive load of a worker. HRI through spoken dialogue aims to reduce this by allowing the worker to concentrate on more critical aspects of the work. 11 Despite the benefits, voice control as an HRI is rarely utilised in controlling industrial devices. The requirements that must be met by industrial voice control systems are more stringent than those related to non-industrial solutions. 12 In the application of assistance robots, a field in which voice control has been more widely utilised, an accuracy of 95% or less is considered a risk. 13 This makes the accuracy of the input command paramount. Implementation has been attempted with three methods: push-and-hold, trigger phrases and long pauses. 14 Industrial robots are programmed infrequently by a small number of skilled operators. 15 It is expected that the regular users of the interface will be qualified machine operators trained to adapt themselves to a restrictive input structure. Therefore, instead of the natural language, a combination of commands that fit the input structure can be used to build the dictionary; a quasi-natural language. Users can be expected to practice discipline while speaking the defined utterances inputs. As the language used in engineering is rich in numerical values, 9 engineering applications do not lend themselves to being fully controlled by speech. Considering voice control is not an efficient mechanism for defining commands containing numerical values, the application of the technology is better suited to semi-autonomous systems. 16
Industrial drilling application
Drilling holes for the assembly of fasteners, like bolts and rivets is a major activity in the aerospace sector; a typical Boeing 747 has around 3 million fasteners. 17 This amounts to roughly 1.1 million holes per day 18 and, unlike the automotive industry, many drilling operations are performed manually. It is a challenge for a large workforce of drill operators to produce consistency throughout a working shift due to fatigue. In order to improve efficiency, automation levels within the automotive sector have increased from 20%–80% (2008) 19 and automated tasks showed an individual task time savings of 60%–85%. 20 Durham 20 identified that the optimal level of automation is a balance between decreasing manual touch time, improving production capacity and automation costs. A fully automated drilling system for an aerospace wing is unrealistic due to wing size and variation. However, a collaborative robot or cobot has the potential to provide a semi-automated solution. The human drilling operator works within the shared space of the robot and interacts with knowledge-based guidance. Cooperation in a drilling operation means the robot performs the ergonomic task that can deliver consistent hole quality while the human provides positional guidance and inspection. This is made possible in recent years due to vast improvements in 6-axis manipulator type robots. They have become increasingly stiffer which equates to higher accuracy levels compared to older generations of robots. This has allowed for machine spindles to be used as end effectors, thus allowing for highly flexible drilling operations. This study was conducted using a KUKA KR16 6-axis robot. This robot is highly accurate with a position repeatability of ±0.04 mm and a reach of 1610 mm – a precision suitable for drilling. The end effector is a Zimmer HFL04-103-01-A-00 Machine Spindle capable of speeds of >24,000 RPM.
In this study, voice activation will be limited to commands that align the robot and an 8 mm drill to a known target position. Automation to roughly position the robot to the target will be done via the main program. Once this is achieved the robot will wait for a dedicated set of positional commands from the human. These have been simplified to ‘Up’, ‘Down’, ‘Left’ and ‘Right’. The KUKA has macro functions that allow each positional command to increment at step intervals (0.1–100 mm). For example, a single command of Left can move the robot to a desired position by 0.1 mm, allowing the operator to align any positional errors from the initial position.
Approaches to speech recognition
To recognise speech, the features of an utterance must first be extracted. MFCCs are used to reduce an utterance to a vector of coefficients that represent its structure. The utterance is recorded in the time domain. This is split into windows and each window is converted to the frequency domain using a Fast Fourier Transform (FFT). The powers from the obtained spectrum are mapped onto the mel scale using triangular overlapping windows. The mel scale is a perceptual scale of pitches judged by listeners to be equidistant from one another. A discrete cosine transform is then applied to the logs of the powers (taken at each of the mel frequencies) as if it was a signal. The resulting amplitudes of the spectrum are the MFCCs; the features of the utterance. 21 The methods for comparing the inputs coefficients and a pre-recorded dictionary of coefficients to determine the closest match are where different methods of speech recognition diverge in approach and complexity. The Distance Comparison method is the most straight forward approach. It compares the distances between the coefficient vectors to determine the most likely match. The output is the utterance with the shortest distance. A Euclidean approach can be used to directly compare the coefficients, although DTW is better utilised as it accounts for temporal variability by finding alignment functions for the inputs coefficients and each set of coefficients in the dictionary. DTW has been utilised in numerous applications including the analysis for human motion, although as of 2017, hasn’t been utilised in an industrial setting. 22 DTW achieves reasonably accurate alignments for small dictionaries, even with large differences in speaking rates. Alternatively, Hidden Markov Models (HMMs) are a class of probabilistic graphical models that allow the prediction of a sequence of unknown (hidden) variables from a set of observed variables. HMMs are commonly used for Speech Recognition but can also be utilised in other pattern recognition applications. Their use in identifying assembly contact states 23 has already shown their potential to streamline HRC. In the application of speech recognition, the observations are the segments of the utterance and the hidden states are the words the program is looking to recognise from its dictionary. Most modern speech recognition systems use HMMs to deal with the temporal variability of speech and Gaussian mixture model (a probabilistic model for representing normally distributed sub-populations within an overall population) to determine how well the state of each HMM fits a frame of coefficients that represents the utterance. 24 While an HMM is more robust than DTW, it is more complex and therefore has a greater implementation cost for the increased accuracy. After comparing the approaches discussed above, MFCC and DTW were chosen for the algorithm.
Adoption of an algorithm for feature extraction
The algorithm that will be tested in this paper uses MFCCs for feature extraction and utilises DTW to compare the coefficients of the input with the dictionary of coefficients to determine the command. Figure 1 shows the order in which the algorithm interprets the recorded speech. The algorithm was written in Matlab R2018b with the Signal Processing toolbox. The parameters used for each function are detailed in their respective sections. For humans, the process of recognising speech can be categorised into four steps (Figure 2). The algorithm is designed to mimic these steps, converting a continuous waveform into distinctive sound features for comparison to a known dictionary. The segment is collected and once the utterance has been extracted the spectral conversion that takes place in the inner ear (Basilar Membrane Motion) is approximated by the algorithm using the Fast Fourier Transform (FFT). The frequency spectrum is then mapped from the linear frequency scale of the speech signal to the mel-scale. This makes the spectral frequency characteristics of the signal more closely correspond to the human auditory perception of sound (Neural Transduction). 25 Once the features of the utterance have been extracted, the algorithm uses DTW and Distance Comparison to deduce the word that has been said (Language Translation). After the input word has been identified, a corresponding output can be programmed, this gives the message a meaning and is the final step in the process.
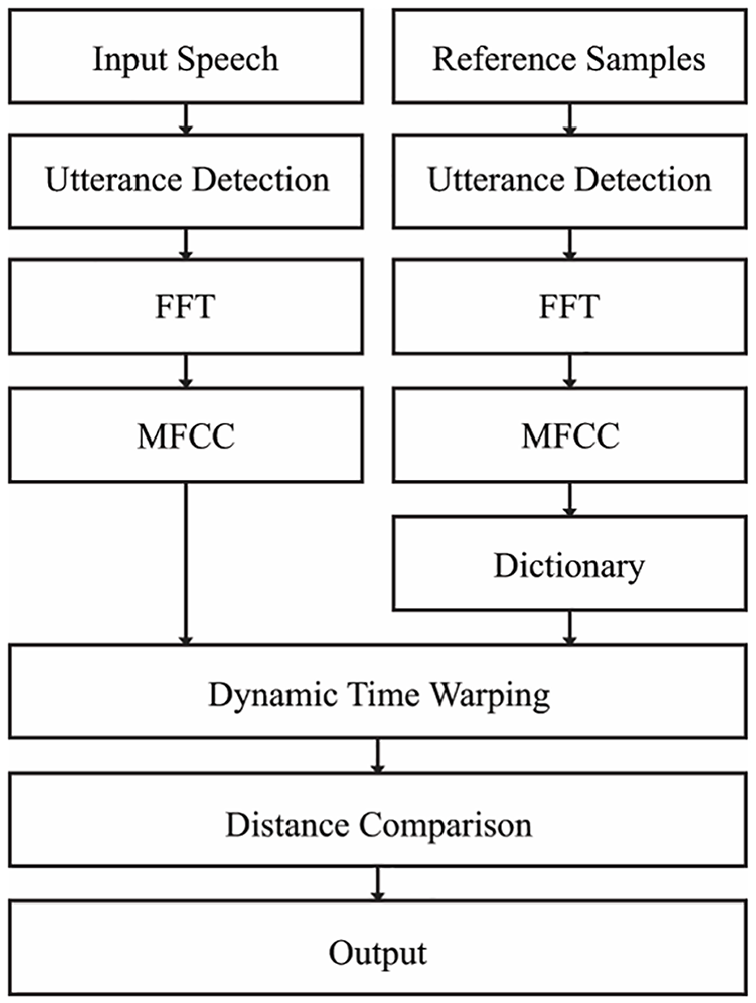
Algorithm flow chart.
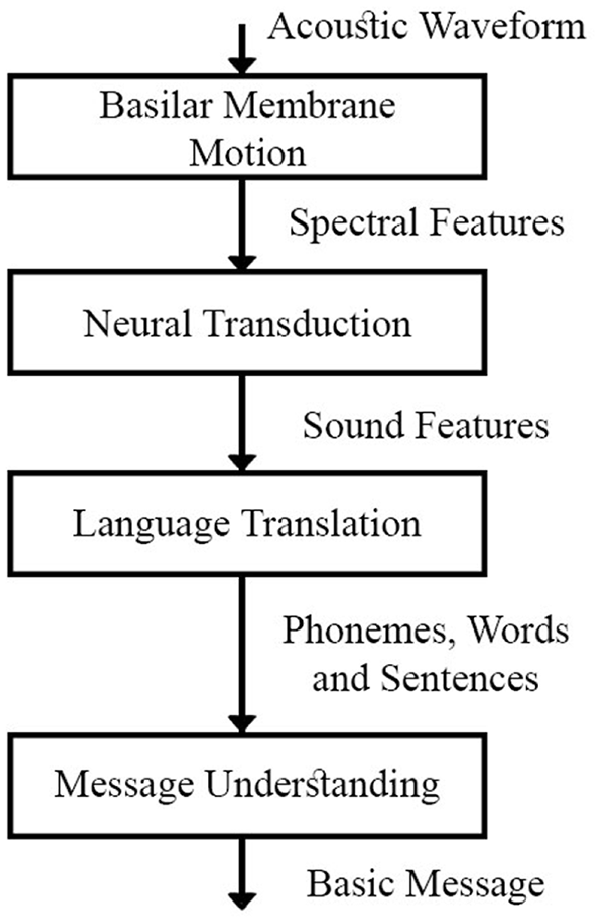
The steps in the human speech perception chain. 24
Segments are recorded in the Waveform Audio File Format (.wav) at 44,100 Hz. After ambient noise has been recorded at the beginning of the segment for 0.5 s the user is prompted to speak the command. The user has 2 s to speak the command before the recording stops. These segments are then compiled into a dictionary or are passed into the algorithm as the input to be evaluated. An example of a recorded segment is shown in Figure 3(a), the utterance can be seen around 1.5 s.
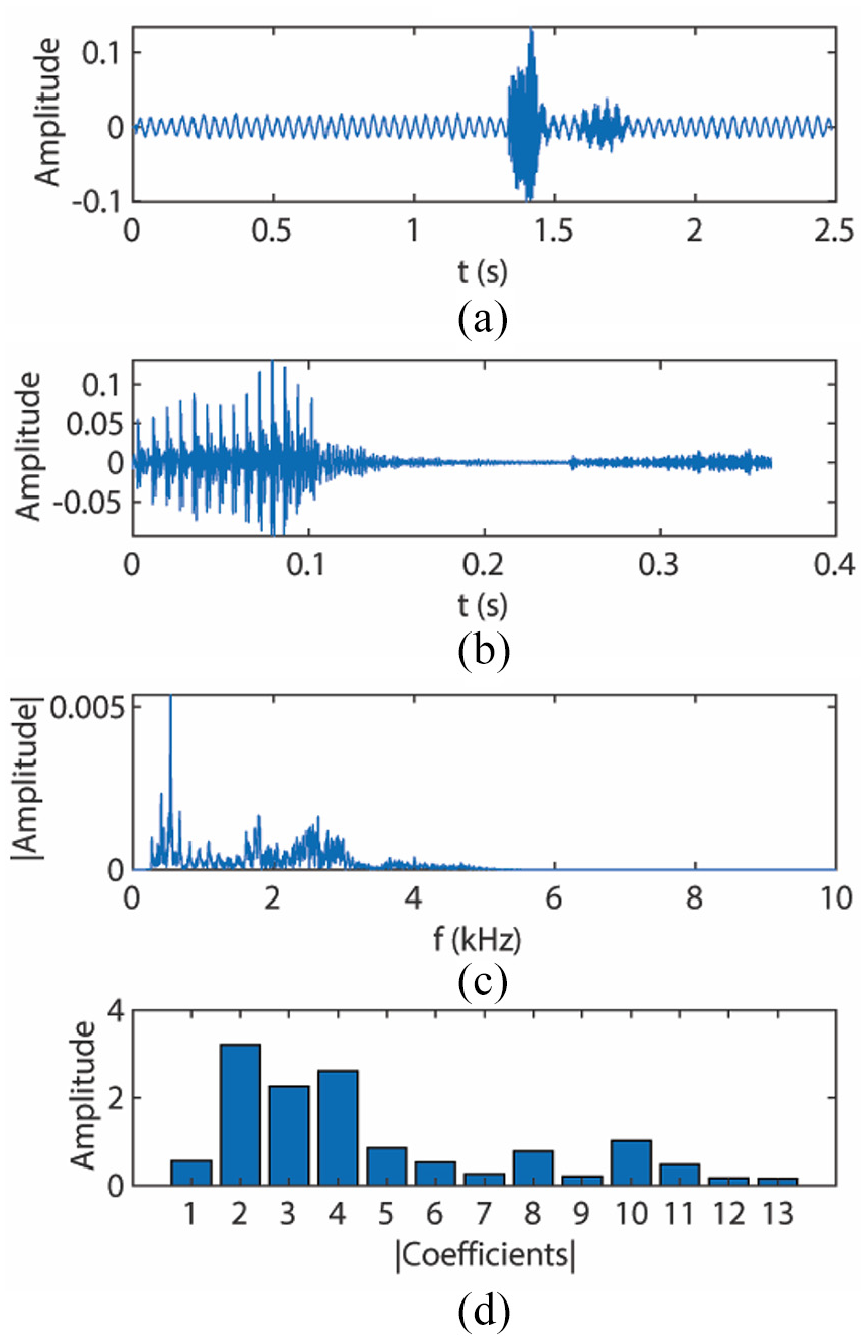
(a) Recorded segment, (b) extraction utterance, (c) frequency spectrum after FFT, and (d) representation of MFCCS.
For Feature Extraction and Utterance Detection, the algorithm sequentially applies a low-pass (3000 Hz) and high-pass (300 Hz) filter to the segment which isolates the frequencies of the human voice. Next, the ambient noise level of the first 1323 samples is evaluated and multiplied by 1.3 to establish a threshold. After the magnitude of the segment exceeds the threshold, the subsequent 0.36 s (16,000 samples) is extracted as the utterance. The extracted utterance from the example segment is shown in Figure 3(b). Fourier analysis converts a signal from its original time domain to a representation in the frequency domain. The utterance is divided into 1323 samples and FFT is then performed. An example of the domain change can be seen in Figure 3(c). Mel Frequency Cepstral Coefficients (MFCCs) are then used for feature extraction. Each window is converted into 13 coefficients and the first coefficient is replaced with the log energy of the signal. These coefficients are shown in Figure 3(d).
For feature comparison, DTW was used to calculate the distances between the input coefficients and the 40 sets of coefficients in the dictionary. As per Figure 4, DTW compares the distances of two vectors while accounting for temporal variability by mapping similar features to each other before evaluating distance. The distances calculated correspond to the four sets of ten commands in the dictionary. To determine the closest match whilst accounting for anomalies, all 9999 combinations of the dictionary commands are assembled. This process mirrors counting in base 10 from 0000 to 9999. The closest match (smallest value) in each combination is evaluated and the most frequently chosen command is outputted as the best match to the input. To compare the effects of the different environmental factors, a metric for assessing how ‘confident’ the algorithm is in its choice has been developed (equation 1). When the correct command has been identified, the confidence shows how close the algorithm was.

Where C is confidence, R1 and R2 are the top and second ranking results respectively and Acc is Accuracy. Accuracy is 1 if the result matches the input and 0 if it does not. Examples of 4 movement commands (‘Down’, ‘Left’’, Right’ and ‘Up’) with of high and low confidence are shown in Figure 5.
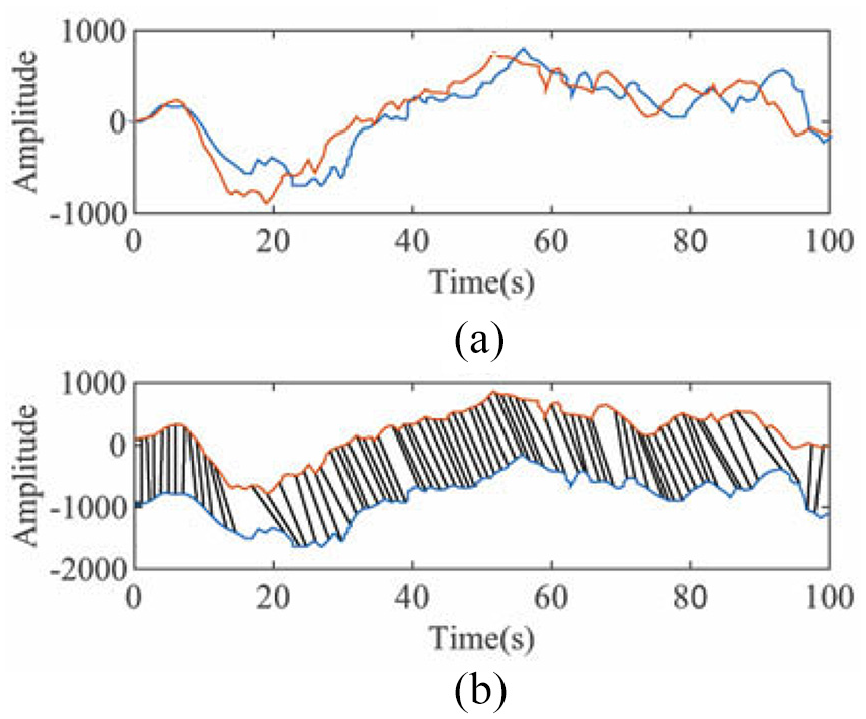
(a) Vectors to be compared and (b) visualisation of feature mapping between vectors. 26
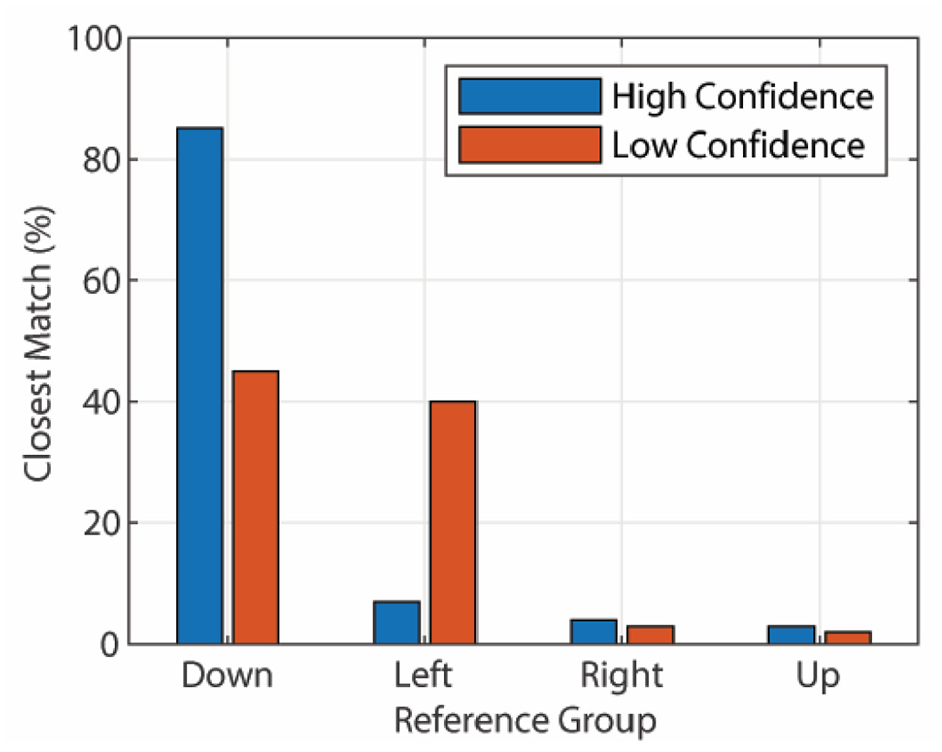
Results example with high (78%) and low (5%) confidence.
KUKA KR16 interface
Pre-defined outputs from the Matlab algorithm are processed into the Kuka RSI. The RSI is an advanced proprietary software package that expands the capabilities of the Robot Controller, enabling it to complete data exchange between a robot and sensor system via Ethernet or the I/O system of the robot. Thus, allowing sensory input to influence the motion of the robot or program execution. Configuration of the RSI signal flow is done through the visual software package. Through RSI Visual, it is possible to access a library of Objects which are used to configure the signal flow. Finally, it provides an online visualization of the RSI signals through the RSI Monitor. The Ethernet interface provides flexibility by allowing complete control of robot motion through introducing an external device that processes and corrects data sent from the C4 controller. In this instance, the external device is a laptop running the Matlab algorithm. Using a real-time capable network connection, data is transmitted via the UDP/IP protocol where no fixed data frame is specified. When using RSI, cyclical data transmissions from the robot controller to sensor system are run in parallel to the robot program execution. Position data and axis angles can be sent to the sensor system and data via cyclical data transmissions. This sends information in parallel to the Kuka program execution. Importantly for the voice activation, the RSI allows the user to exert continual influence over the motion of the robot. There are two types of sensor correction available, either Cartesian or axis-specific. Cartesian creates a Correction Coordinate System at the TCP where the BASE, ROBROOT, TOOL, WORLD or Tool-based coordinate frames can be used as a reference coordinate system. There are two correction modes, relative and absolute, where relative correction values are added together and the new position results from the offset of the starting position by the previous correction and the current correction value combined. Absolute correction results in an offset from the starting position by the correction value. Finally, there are two sets of correction methods available; superposed sensors correction and sensor-guided motion. In the former, corrections would be superposed over the existing programmed movement running on the Kuka C4 controller.
Experimental methodology
Audio signals
All audio signals were recorded at 44,100 Hz with a Rode NTG2 Shotgun Microphone, through External Line Return cables and a Scarlett 2i2 USB Pre Amp Audio Interface. These took place in a 7.7 m × 6.3 m room with painted concrete walls (Figure 6). The room also contained two KUKA KR16 Robots. The location and gain settings of the microphone were kept consistent across all recordings. A Shotgun microphone was used as the interface due to its directional sensitivity. The microphone is significantly more sensitive to noise in the direction it is pointing while attenuating surrounding sources of noise. A sound level monitor set below the microphone was used to evaluate dB level which allowed a reference volume to be associated with each recording.
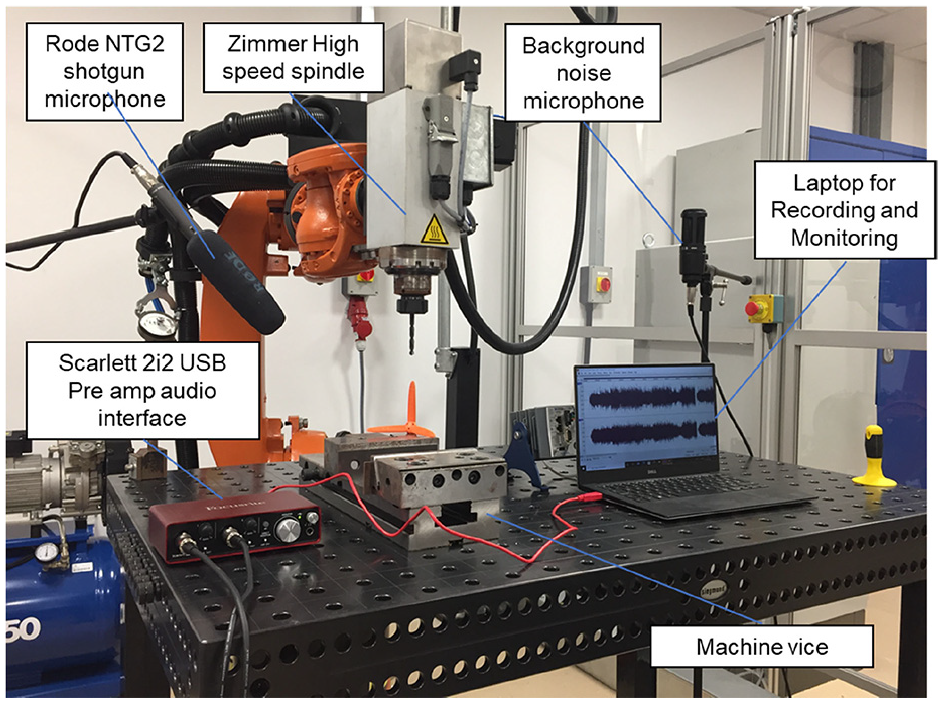
Kuka Robot setup.
For the voice commands three Female and three Male subjects each recorded a training dictionary. These consisted of 40 samples, 10 of each command: ‘Up’, ‘Down’, ‘Left’ and ‘Right’. This was achieved with a program which prompted the user on which phrase to say and when to say it. The subjects sat approximately 300 mm directly in front of the microphone and spoke authoritatively but did not shout, this same tone was used for the inputs. The average volume of the utterances was 68.5 ± 2 dB. All samples were run through the Utterance Detection and Feature Extraction. The coefficients for each sample were compiled into a dictionary (matrix of coefficients) unique to the subject.
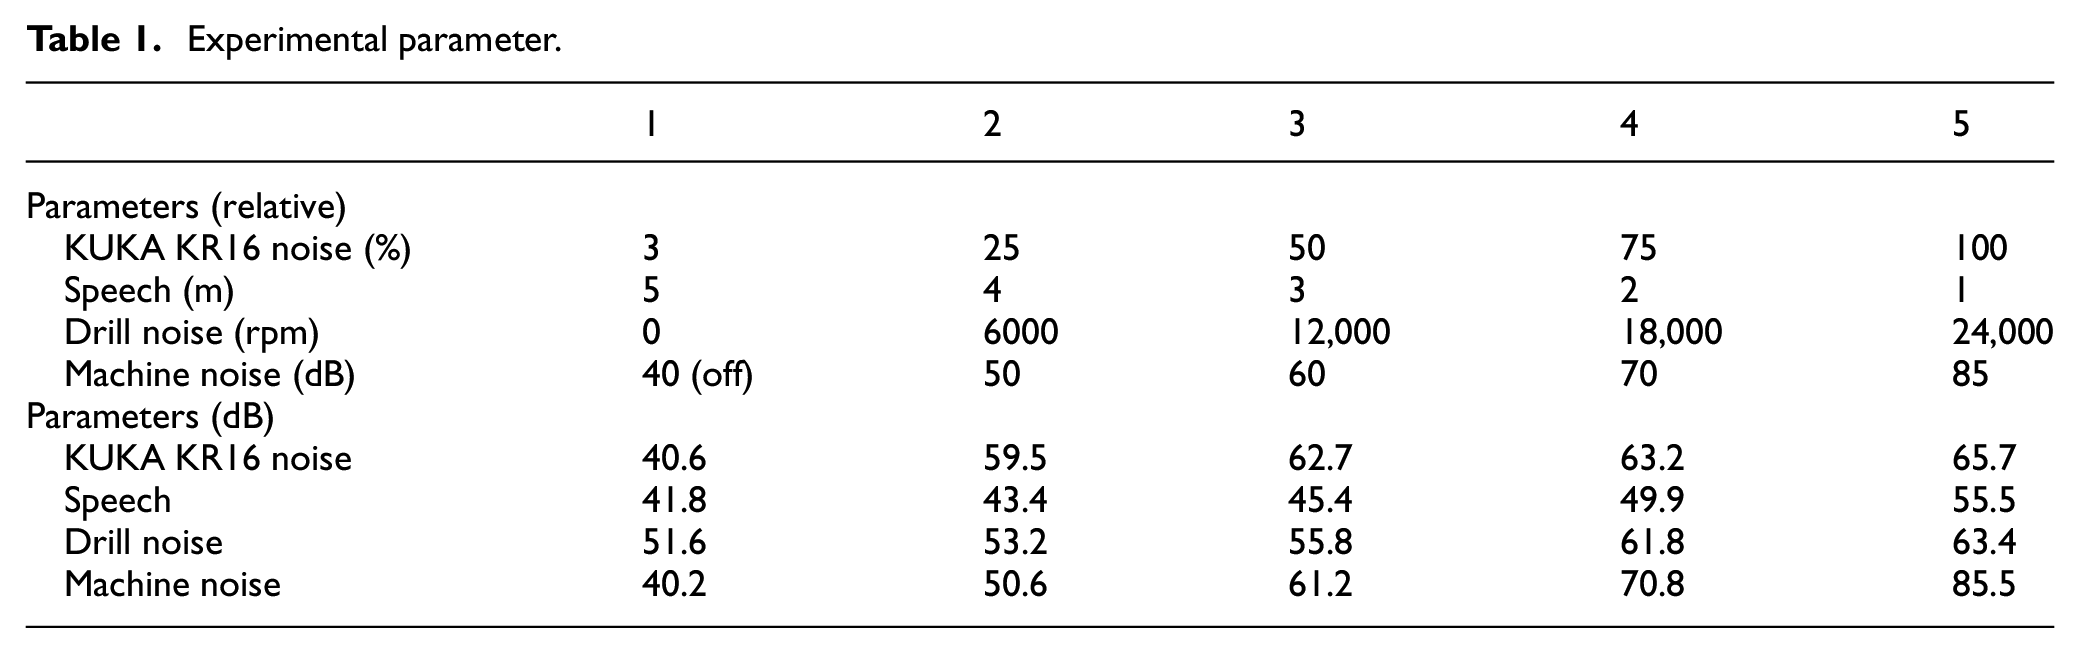
The environmental factors selected for testing were chosen by considering the proposed application and by assessing possible levels which could affect speech intelligibility. The intended operation of the software is to operate a KR16 6-axis robot, the speed of the movement produces different volumes of noise. To assess the full range of noise, samples of the robot movements at 0% speed, 25%, 50% and 100% were recorded. This had a volume range of 40.6–65.7 dB. The Machine Spindle for drilling was also tested, recordings were taken between 0 and 24,000 rpm producing a noise of 51.6–63.4 dB. In an industrial environment, the robot may be used in proximity to other machinery, therefore background machine noise is considered. To measure this, a recording was taken in an active workshop: the machines sampled were a lathe, milling machine, air compressor, wire EDM and multiple CNC machine centres. These were played in the room with an amplifier at different sound levels. When the recording was not being played, the ambient noise was 40 dB. As per the limits of UK law, 85 dB 27 was the upper limit for testing.
Human-to-human interference was considered, as conversations may be conducted near the system and unintended utterances may be registered by the microphone. The worst-case scenario would be that a word from the Dictionary is registered simultaneous to a command being issued. To test this scenario, a command from the dictionary (different to the test-command) was recorded. The command was recorded at incremental distances away from the microphone, 1–5 m. At the microphone the volume of the command ranged between 41.8 dB and 55.5 dB. The factors were recorded based on these parameters and each recording had its reference volume recorded. The parameters and references can be seen in Table 1.
Experimental parameter.
Full factorial design of experiments
To run the experiments, each factor had each level recorded separately. These were overlaid onto the input sample based on a 5^4 (625 level) full factorial array. Per subject each of their four command words were used as an input leading to 24 Full Factorial Design of Experiments (FFDoE). Every input was run through the algorithm and the confidence for that experiment was recorded. Minitab 18 was used to analyse the results of each FFDoE. Matlab R2018b was then used to run a t-test to the effect of each factor at each level for statistical significance. The FFDoE and following analysis was performed in Minitab 18.
Results
Main effects plots
The main effects-plots (Figures 7 and 8) show how each factor effects the mean confidence and accuracy. A main effect exists when different levels of a factor affect the characteristic differently. The FFDoE showed that the mean confidence for the KUKA noise, Speech and Drill Noise did not drastically change across the levels; however, Machine noise showed a drop off in confidence. This correlates with the inputs as the levels 1–5 for the machine noise is distributed linearly as opposed to the logarithmic decibel scale. Each increase of 10 dB is perceived as 2× as loud, and an increase of 15 dB is 2.8× as loud. The effect-to-mean accuracy follows a similar trend; however, Level 3 for Machine Noise does not show a drop in accuracy. This shows at Level 3, the Machine Noise is affecting the confidence. Due to this sensitivity, Confidence is used for further analysis.
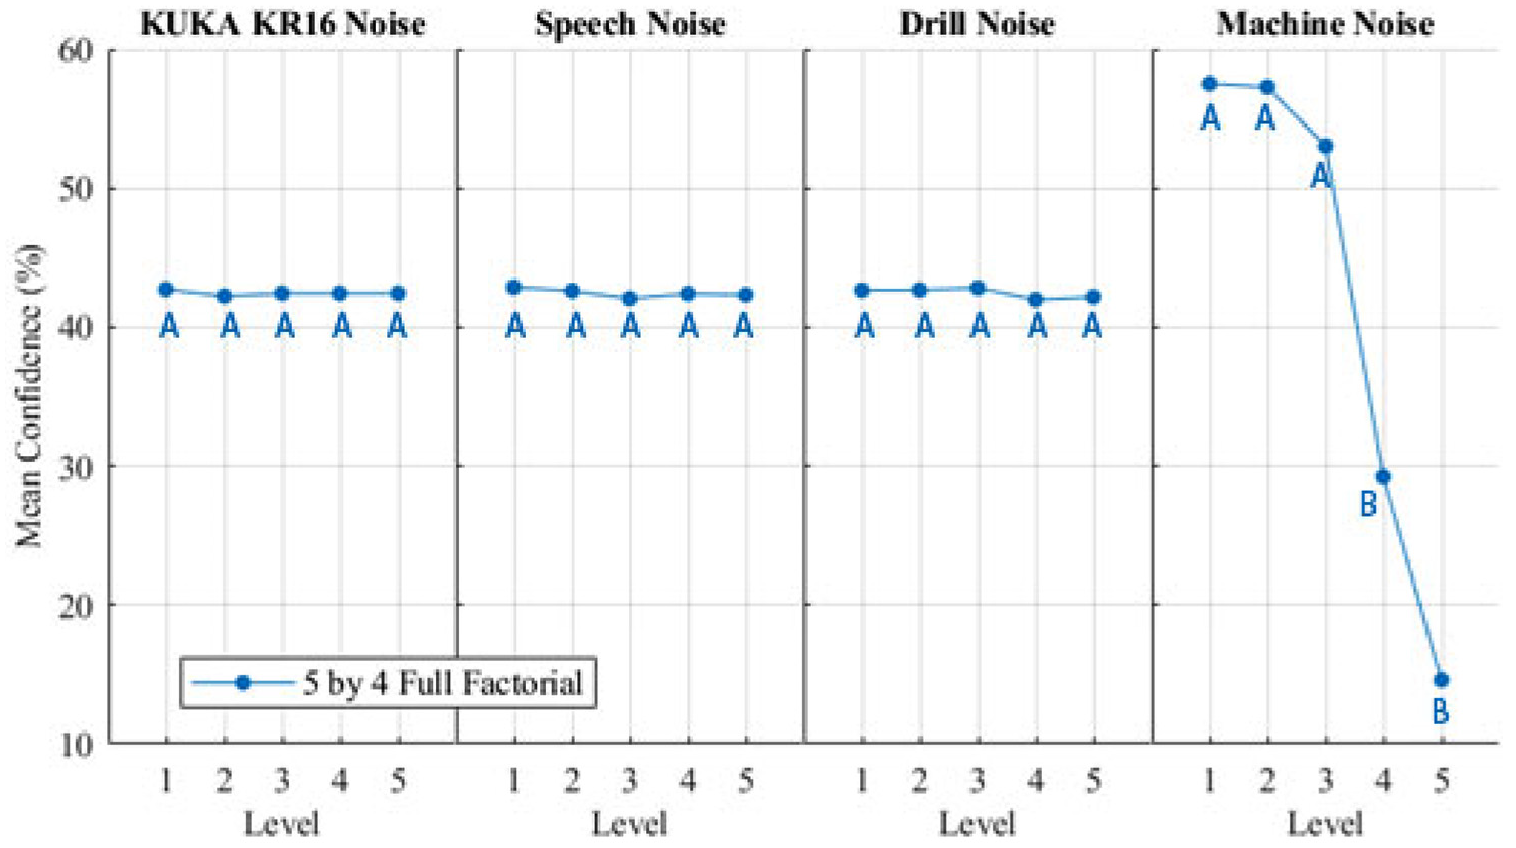
Main effects plot for mean confidence with Tukey pairwise comparison groups.
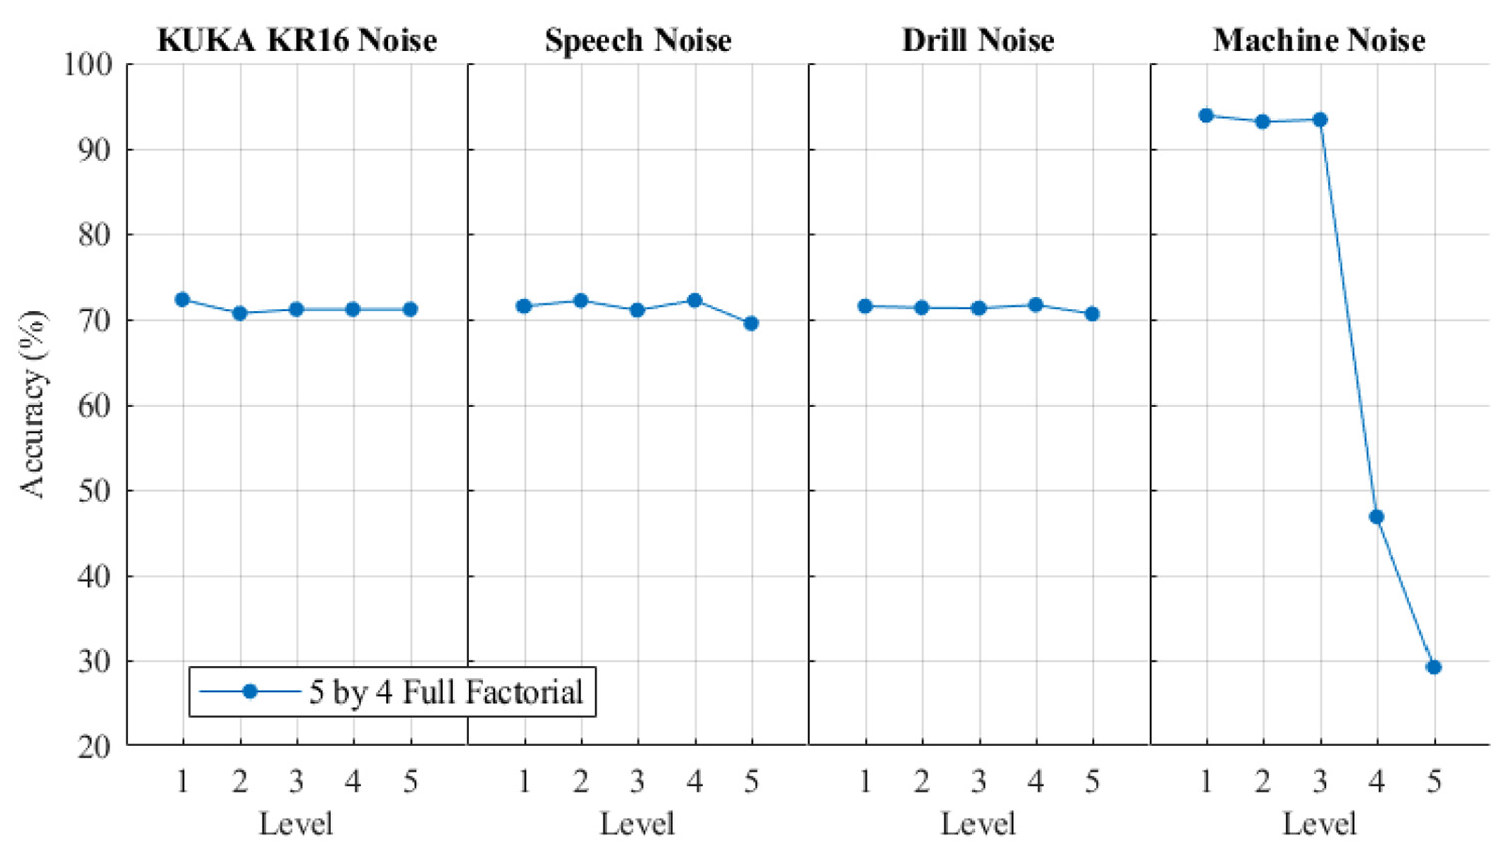
Main effects plot for mean accuracy.
ANOVA analysis
Figure 7 shows the results from a one-way ANOVA with Tukey Pairwise comparison performed on the results of the 24 FFDoE. An ANOVA evaluates the probability that the null hypothesis (the effect of the environmental factor is 0) is due to random chance to assess the statistical significance of the effect. Points on the graph which do not share a letter are statistically significantly different. The ANOVA showed Level 4 and Level 5 Machine Noise had a statistically significant effect on the confidence of the algorithm.
Factor interactions
The interaction-plot (Figure 9) shows interactions between factors. Nonparallel lines indicate interaction. The results show that there is minimal interaction between any of the factors as all the lines are near parallel.
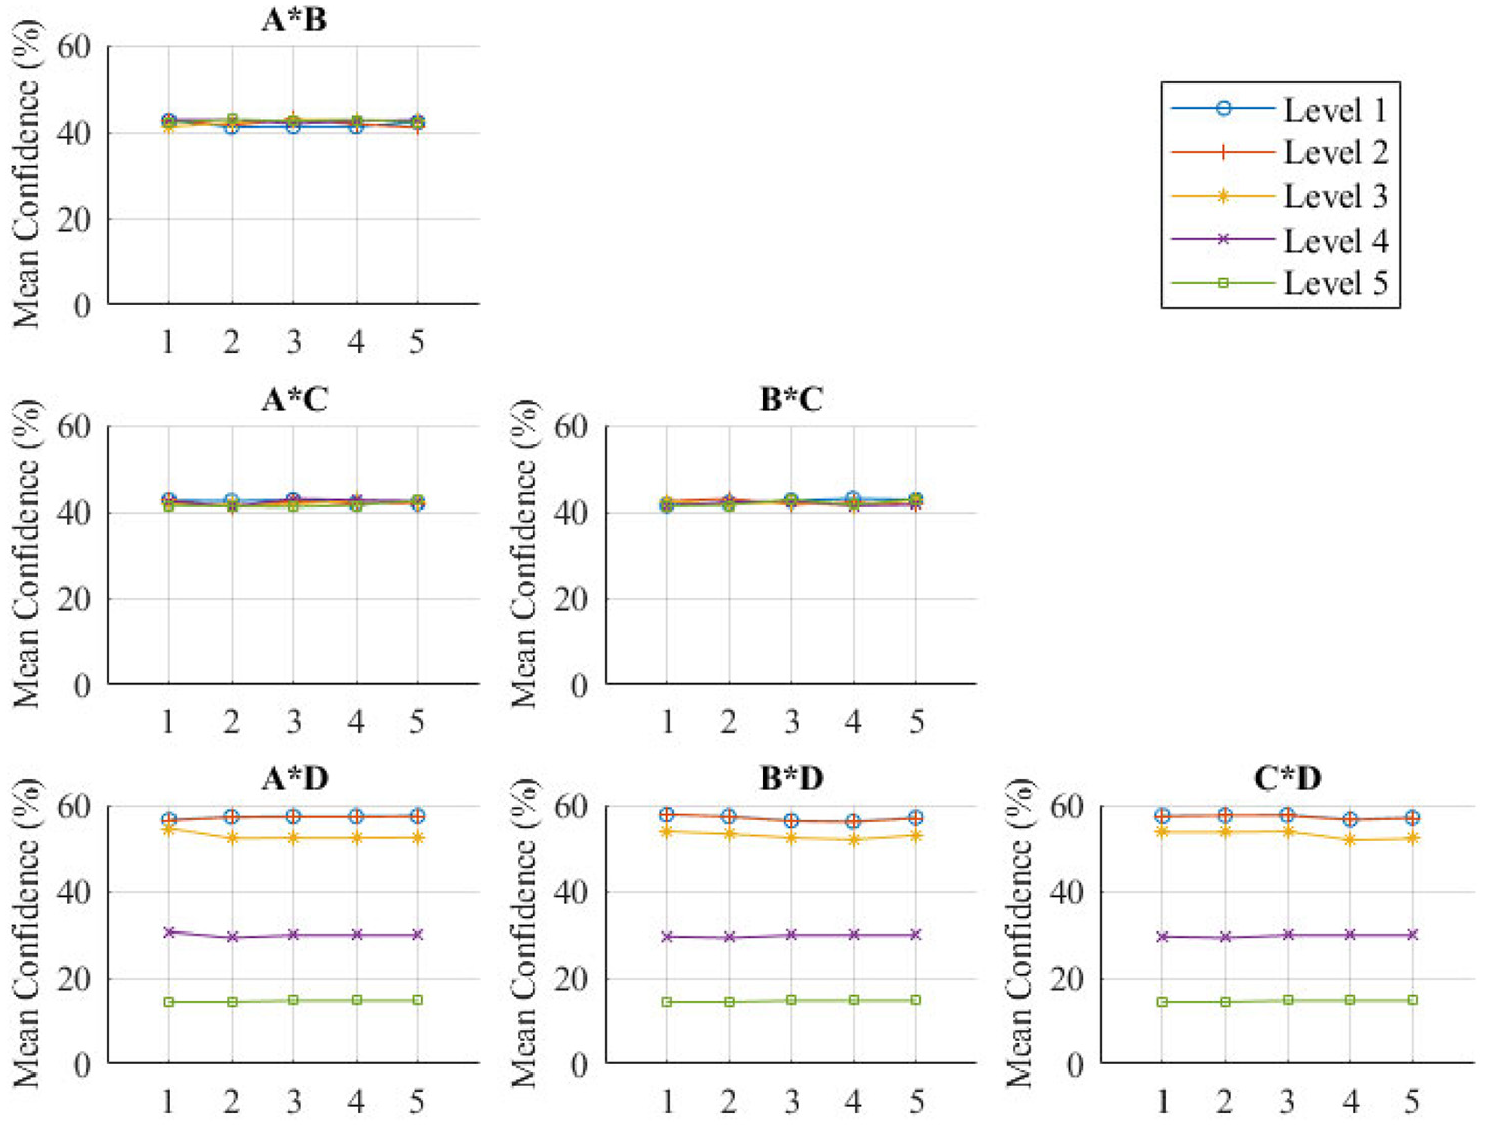
Factor interaction plot.
Failure modes
Across all 15,000 experiments, the accuracy of the algorithm was 71.31%. When machine noise is kept below 61.2 dB (Level 3) the accuracy of the algorithm increases to 93.51%. When volume is above 61.2 db the accuracy drops to 29.17%. There are multiple components that contribute to this significant drop in accuracy.
Volume
High volumes of noise could interfere with the extracted features of the utterance leading to a false identification. If there was a defined volume at which the algorithm was affected, then all factors louder than this volume would have a significant effect. As this is not the case, the drop in confidence cannot be solely attributed to volume as machine noise has a significant effect at 61.2 dB, which is a lower volume than the Level 5 setting of KUKA noise (63.2 dB) and the Drill noise (61.8 dB). Volume is therefore a contributing factor.
Frequency
Frequencies of the environmental noise can alter the extracted MFCCs and effects the accuracy. All the environmental factors tested have frequencies between 300 and 3000 Hz. These are not filtered by the algorithm, so could interfere with voice identification. Figure 10 indicates the higher influence of the Machine noise is likely due to the higher prevalence of frequencies between 300 and 3000 Hz. The Machine Noise is a recording composed of multiple separate machines, this leads to a higher range of frequencies which can interfere with the extracted features.
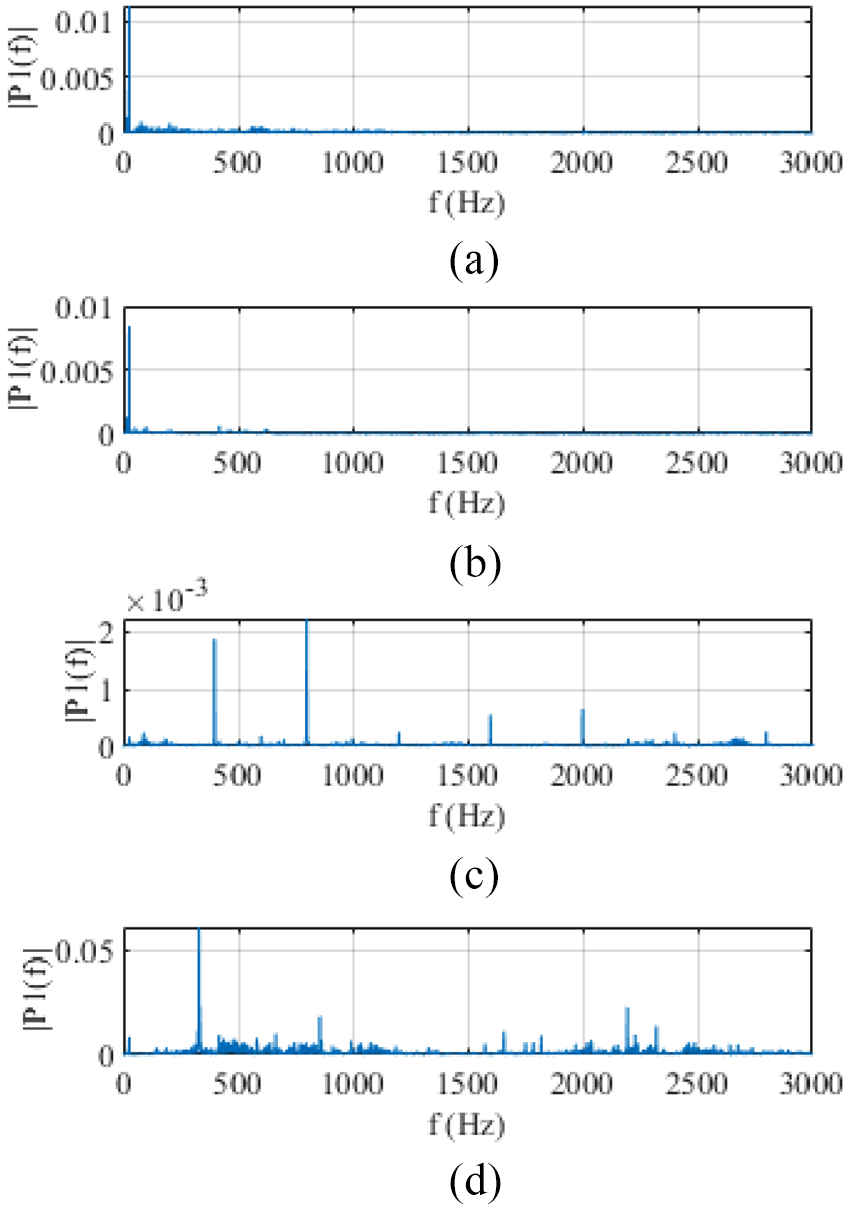
Frequency spectrum of: (a) KUKA KR16 noise, (b) speech noise, (c) drill noise: and (d) machine noise at level 5.
Implementation of the system in industry
The direction input via speech would supplement the buttons on the KUKA control pad. This could be expanded to include voice commands to interact with other KUKA technologies such as grippers. Robot safeguards can be configured in the RSI to prohibit any corrections greater than a predefined value. Any movements over this value would result in a program pause, safeguarding the user and the robot. The full system detailing the information flow from the user to the robot is outlined in Figure 11.
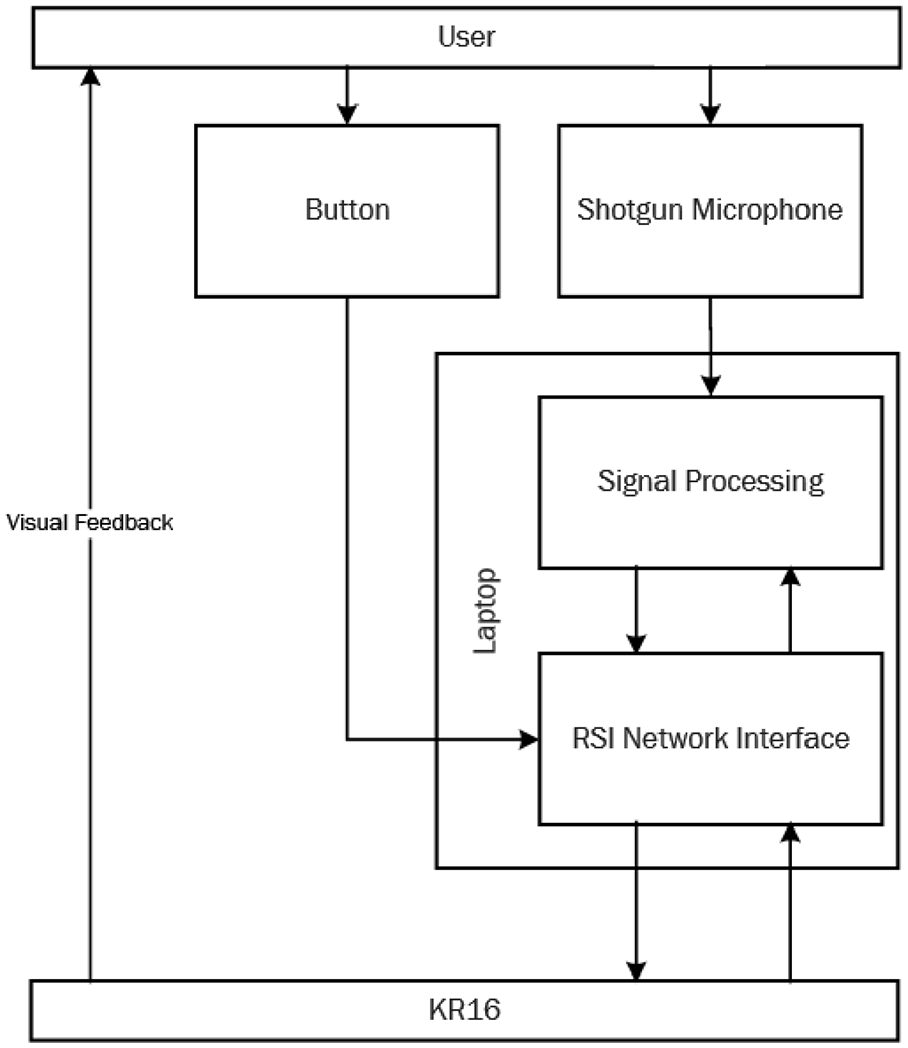
Proposed system diagram.
Conclusion
HRI in industry utilise physical and graphical user interfaces. These can substantially burden the cognitive load of a worker. Interaction through spoken dialogue aims to reduce this load. In this study, the voice activation is limited to four commands that align the robot and drill to a known target position. The noise from environmental factors are assessed based on the factors which affect speech intelligibility. The identification of the most relevant factors is necessary to allow voice activation solutions to be implemented efficiently. This research evaluated multiple approaches to speech recognition and a limited dictionary was chosen. The study concludes the following.
For cobots with voice activation interfaces, the external machine noise above 61.2 dB is the only statistically significant factor on voice recognition accuracy.
Machine Noise had an effect of −7.82% Confidence between 40.2 and 61.2 dB and an effect of -74.60% Confidence between 61.2 and 85.5 dB. At 85 dB the algorithm could only correctly identify the input with an accuracy of 29.17%.
In industrial applications where noise is <61.2 dB, the algorithm will not require modification to account for the environment.
HRI using a novel integration method can be utilised in manufacturing environments where minor corrections to the robot can be coupled to voice inputs rather than using physical interfaces.
If the environmental noise does exceed 61.2 dB, Utterance Detection filtering techniques to account for the noise will have to be developed for improved Feature Extraction.
Before the algorithm could be applied in industry, safeguards would have to be implemented and the accuracy would have to be evaluated in a less controlled environment.
The maximum accuracy achieved by the algorithm was 93.51%, further research will be required to improve this and additional noise control will be required for some industrial environments. Despite this, the application of voice control within a semi-autonomous industrial system remains a promising solution to streamline HRI.
Footnotes
Declaration of conflicting interests
The author(s) declared no potential conflicts of interest with respect to the research, authorship, and/or publication of this article.
Funding
The author(s) received no financial support for the research, authorship, and/or publication of this article.