
Abstract
Friction Stir Back Extrusion (FSBE) is a new sustainable manufacturing process capable of producing fine grained lightweight tubular shapes. The objective of this work is to investigate the impact of rotational speed and feed rate on the mechanical properties, cycle time and power consumption of friction stir back extruded Mg AZ31-B tubes and determine the optimal settings. FSBE experiments and tensile tests were performed to characterize the mechanical properties of the produced tubes. The investigation is conducted utilizing Response Surface Methodology (RSM) and desirability multi-response optimization technique. Results suggest that ultimate tensile strength and toughness are impacted by both rotational speed and feed rate and are more sensitive to speed. However, both process parameters did not show a significant statistical impact on elongation. Optimal parameters for mechanical properties were identified at a rotational speed of 1767 rpm and feed rate of 102 mm/min. The optimal settings to maximize mechanical properties, minimize power consumption, and maximize productivity were 2000 rpm and 116 mm/min.
Introduction
Friction Stir Welding (FSW) is a solid-state joining process developed by the Welding institute. 1 It uses non-consumable cylindrical rotating tool to create a weld joint by stirring the contact line between the two metal plates, therefore no melting is needed to create the joint. Such technique has proved itself with respect to many hard to weld metals such as aluminium alloys, resulting in high quality welds and more energy efficient process than traditional joining techniques. 2
Literature is rich of research related to FSW. For example, several researchers suggested that severe plastic deformation (SPD) associated with FSW process creates superior fatigue properties, improved formability, and equiaxed grain structure in the weld zone.3–8 Cavaliere et al. 5 indicated that average grain size of FSW AA 6056 alloy is from 4 to 5 μm whereas Hatamleh et al. 6 reported an average grain size of FSW AA 7075 alloy between 5 and 12 μm. Moreover, FSW has been used to refine the weld zone’s microstructure using a rotating stirring tool that crosses a single plate. 9 Several SPD processes were explored by researchers to manufacture materials with equiaxed grain structure. Such processes include cyclic extrusion compression, equal channel angular pressing, tube channel pressing and high-pressure tube twisting; however, only the earlier two are said to produce tubular shapes with ultrafine grain size.10–12
Other researchers focused on FSW process parameters’ effect on mechanical properties of welded material. Verma and Misra 13 studied the effects of the rotational speed, welding speed, and tilt angle on the temperature distribution and force during FSW. Two phenomenological models were utilized to evaluate the effect of process parameters on the force and temperature. Iqbal et al. 14 studied the influence of FSW process parameters on the physical properties of aluminum pipes. The temperature, axial force, torque and power have been investigated to select optimum combination of parameters and achieve superior welds. Jain et al. 15 studied the effect of pin shapes on temperature distribution, material flow and forces during FSW using simulation. Triflat, cylindrical, and square pin shapes were used in the simulations. The Triflat pin produced higher temperatures and strain rates which resulted in uniformly distributed material deposition. Rambabu et al. 16 investigated the impact of FSW process parameters on AA 2219 aluminum alloy corrosion rate. They concluded that tool profile, rotational speed, welding speed, and axial force has significant impact on corrosion rate. Similarly, Zhang et al. 17 investigated the effect of transverse speed, plunge depth, and rotational speed on corrosion rate, yield strength, ultimate tensile strength (UTS) and elongation for AA 2024-T351 and AA 7075-T651 dissimilar alloys. They also developed a mathematical model and verified it using Analysis of Variance (ANOVA) to determine the optimum set of process parameters to maximize tensile properties and corrosion rate. On the other hand, Kabiri and Ehsan 18 used Taguchi Orthogonal Arrays (OA) to investigate the impact of rotational speed, traverse speed, and shoulder surface diameter on UTS for pure copper. They suggested that all process parameters had similar contributing effect on UTS. Similarly, Kumar et al. 19 used Taguchi OA to optimize FSW process parameters for dissimilar aluminum alloys. Others including Abbasi et al. 20 utilized the previous optimization technique to optimize the traverse speed, rotational speed, and tool profile of FSW AA 5052 alloy for maximizing the tensile strength. They concluded that the squared profile is the dominant contributing factor among others besides having the probe shape as the most significant parameter. Additionally, de Castro et al. 21 utilized Taguchi OA optimization approach to study the effect of the welding time, rotational speed, and tool plunge depth of the weld’s strength for the Fiction Stir Spot Welding (FSSW) of AA 2198-T8 aluminum alloy. They concluded that tool’s plunge depth and spindle speed have a significant effect on the induced strength. Colmenero et al. 22 optimized the FSSW for AA 1050 and pure copper using RSM method which primarily depends on dwell time and rotational speed process parameters. They examined vibration signals’ energy and the welded joint strength. Finally, Babu et al. 23 used Artificial Neutral Networks with Genetic algorithm to optimize FSW process parameters for AA 2219 alloy.
Recently, a new SPD friction stir process that is considered a derivative of FSW known as Friction Stir Back Extrusion (FSBE) process is developed. FSBE is used to produce seamless tubular shapes with ultrafine grain structure and improved mechanicals properties. The FSBE process is depicted in Figure 1 where a non-consumable stirring tool rotates and plunges through a cylindrical metal billet inducing spiral material flow. The self-induced heat generated due to friction between the stirring tool and the specimen and plastic deformation softens the material aiding in the outward material flow and forming a tubular shaped structure. 24 Consequently, the load needed to force the stirring tool into the billet is remarkably less than other SPD processes such as cold extrusion. Such tubular shapes can be used in various industries including aerospace and automotive. 25 For instance, the processed seamless tubes can be used as roof trails and as structural members in compressive load bearing applications such as automotive frames. According to the sustainability assessment framework proposed by Saad et al. 26 that accounts for the environmental, social, and economic dimensions, FSW and FSBE processes are considered sustainable manufacturing processes.27,28
Several researchers used FSBE process to produce tubes with an equiaxed grain structure using different materials. For example, Abu-Farha 2 used FSBE to produce void free AA 6063-T52 processed tubes with highly desirable microstructure. Similarly, Milner and Abu-Farha 29 evaluated the microstructure and mechanical properties for different AZ31-B tube aspect ratios (tube length/outer diameter) and extrusion ratios (outer diameter/inner diameter). They concluded that FSBE tubes requires less energy to operate as it induces heat from within the process compared to other back extrusions methods. In addition, they confirmed that the AZ31-B FSBE tubes has an ultra-fine grain of around 5 μm compared to the base material of around 114 μm within the mixing zone. 29 Evaluation of mechanical properties indicated an increase in UTS, yield strength, and ductility. The same authors made a connection between the induced grain size and micro hardness values at different locations within the dynamically recrystallized zone for AZ31-B tubes. They found that measurements at the bottom center of the tube showed high micro hardness values which corresponds to finer grains relative to low micro hardness values at different sections within the tube’s wall.
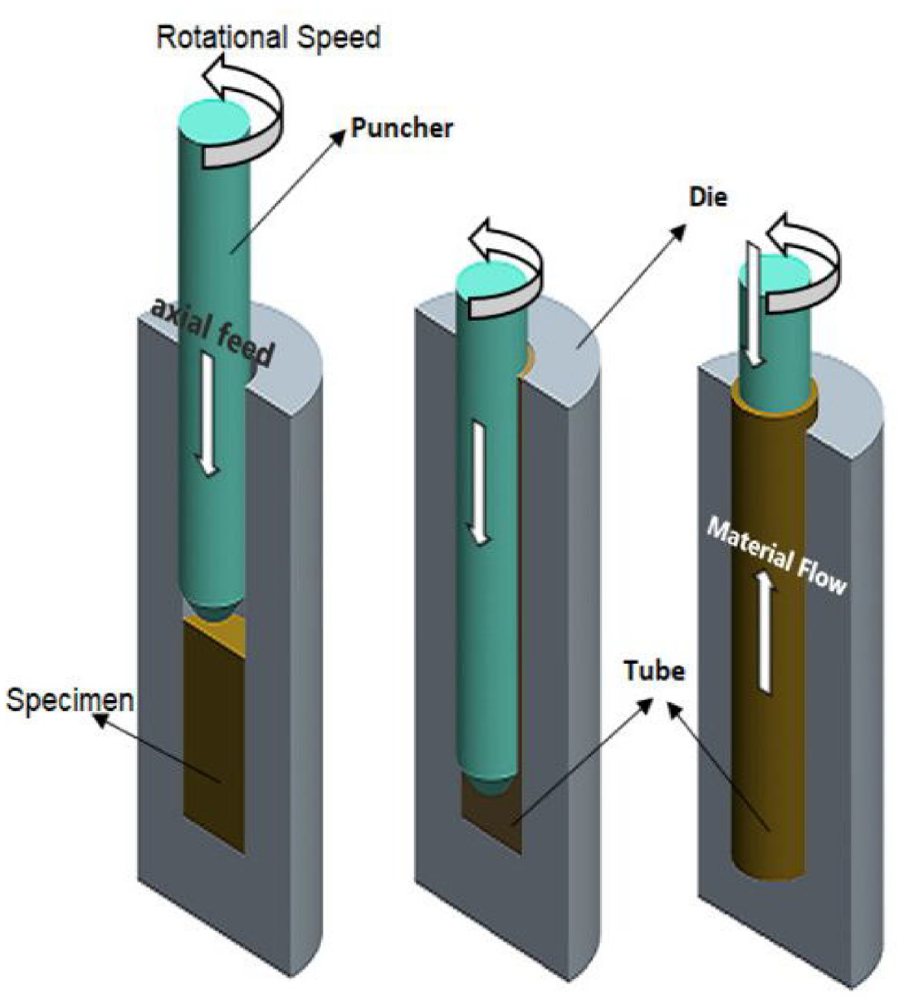
Schematic diagram of FSBE technique.
Mathew et al. 30 investigated AA 6061-T6 FSBE seamless tubes and showed that the process resulted in a continuous defect free tubes with an average grain size of 39 μm for multiple locations along the tube’s wall and 3.5 and 20 μm for the stir zone and parent alloy, respectively. They also reported that the lowest micro hardness value is at the stirring zone although it exhibits an equiaxed grain structure. 30 They attributed that to the increase in frictional heat and exposure time which reduces the effect of T6 heat treatment. The compressive behavior of AA 6061 processed tubes were also studied and showed a ring (concertina) failure type which is most favorable for aluminum tubes.30,31 This indicates that processed tubes will be able to absorb sufficient amount of energy before failure.
Emblom et al. 32 explored the miniaturization of FSBE for the applications of meso and micro scale tubing such as microscale heat exchanger. They focused on macro tooling for processed tubes of higher length to diameter ratios and successfully built tubes with 50 and 12.5 mm in length and outer diameter, respectively. Various stirring tool designs were also tested for different rotational speeds; however, the successful tooling design included a guide plate with brass bushing for alignment and dowels that are fixed to the split dies. 32 Such design reduced the tool’s end deflection as it pushes through the workpiece in addition to the increase in the buckling force.
It is clear that the available studies on FSBE mainly investigate the grain size and mechanical behavior at one fixed combination of parameters. There has been little research, if any, conducted to investigate and optimize FSBE process parameters. Moreover, there has been no work conducted to investigate the impact of rotational speed (N) and feed rate (f) on cycle time and power consumption. The objective of this article is to investigate the effect of FSBE process parameters on mechanical properties, power consumption and cycle time for AZ31-B magnesium seamless tubes. RSM will be used to build and optimize mathematical models for all of these properties.
Response surface methodology (RSM)
RSM is a mathematical and statistical approach used to optimize several process parameters that affect one or more response variables with fewer designed experimentations.33,34 Optimizing multiple responses simultaneously is a difficult task and involves three stages:
Experimentation
A minimum number of experiments are usually sought with enough information for modeling the response as a function of process parameters. Fitting and analyzing response surfaces are greatly influenced by the choice of the experimental design. Figure 2 depicts one of the most common RSM experimental plans referred to as face center cube (FCC) which includes three types of points; full factorial (FF), face centered (FC) or axial points, and center points (CP). The design space, represented by rectangle, is defined using two variables: length (L) with a range of 100–400 mm and height (h) with a range of 50–200 mm. While the FF points are placed at the corners of the rectangle, that is, corners of design space, axial points are placed in the middle of the boundary edges of the design space and the CP is in the center of the design space. The total number of experiments required in this two-dimensional design space is maximum 13 (four FF, four axials, and three to five CP’s).
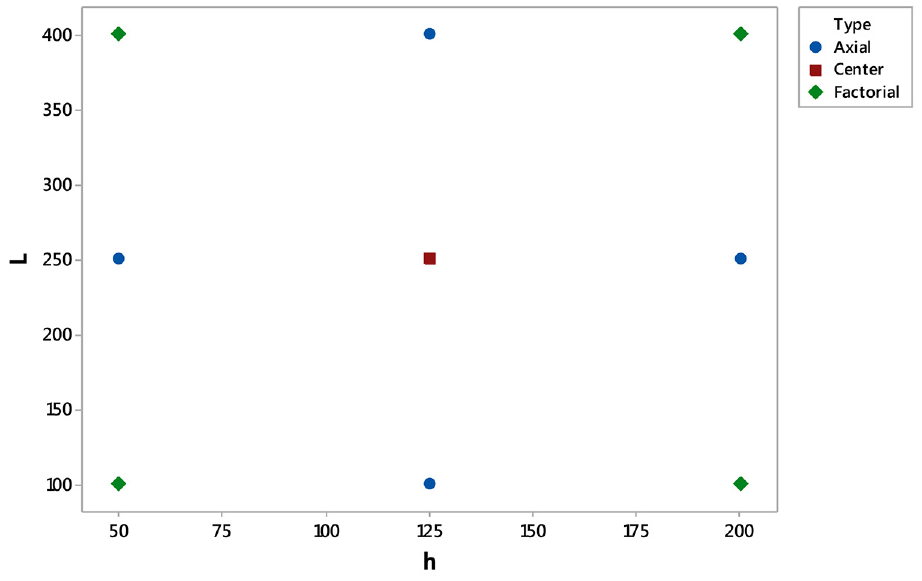
Face centered cube design.
Model construction
Depending on behavior of the response, a modeling technique such as polynomial regression or Neural network is used to describe the output response as a function of the process input variables.
Optimization
The output mathematical models of the responses are used along with constraints dictated by the range and physical nature of process parameters to find the best settings. Due to its simplicity and efficiency, the desirability function method35,36 is used in this article. The desirability function approach is one of the most frequently used multiple-responses optimization techniques in practice. The method makes use of an objective function D called the composite desirability function and transforms each individual response into scale free value
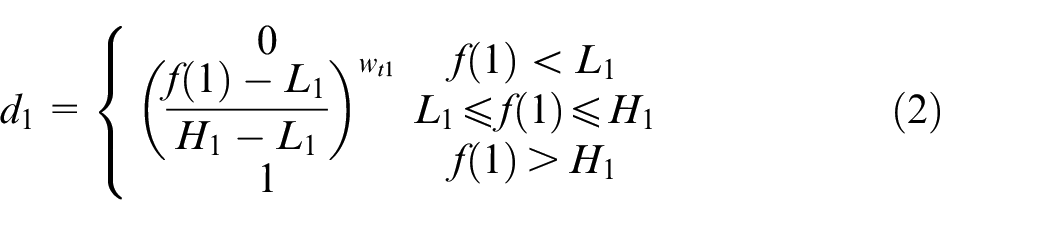
Individual desirability
Goal is to maximize f (1)
Goal is to minimize f (2)
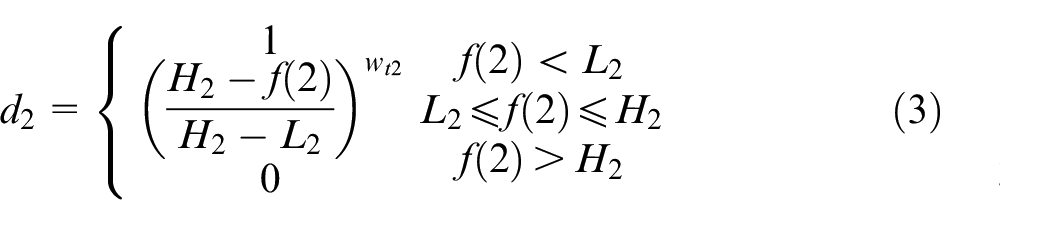
Goal is to set f (3) to target T
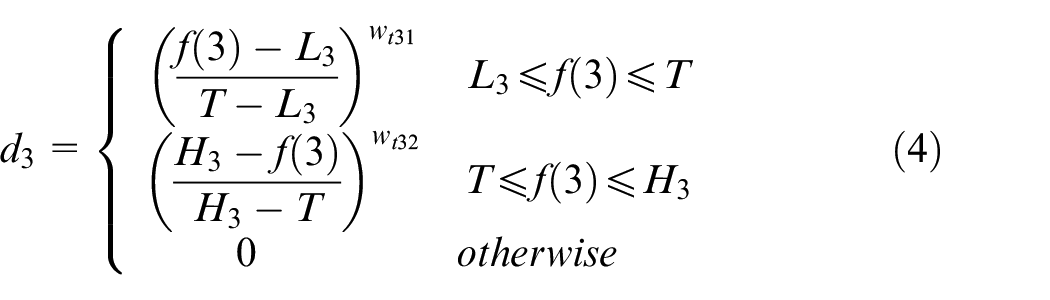
Where Li and Hi are lower and upper bound of response, f(i) is mathematical model, and
Methodology and experimental set up
To address the aforementioned objectives, the following steps are followed:
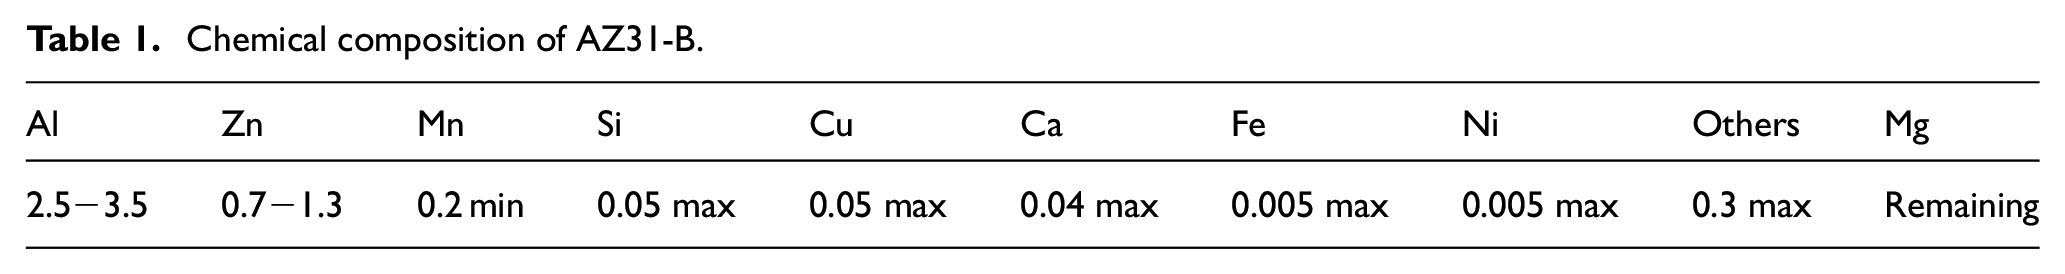
Determine control variables, that is, variables that can be controlled by experimenter. In our case, both rotational speed (N) and feed rate (f) are investigated. AZ31-B magnesium alloy is used in the FSBE experimentations that have a chemical composition in weight % summarized in Table 1.
Plan the experimental design: experiments are conducted using three stages. First, a face centered cube design (FCC) experiment is carried out to explore a small region where N ranges from 1400 to 2000 rpm and f from 60 to 120 mm/min. The experimental runs are represented by the solid circles in Figure 3 while design region is represented by the upper left solid line rectangle. The values in Figure 3 are the UTS values. Based on the results of the initial FCC experiment, there was a need to explore a wider region especially at higher f and lower N. As a result, additional experiments were conducted to extend f upper level to 150 and speed lower level to 1000 rpm. The extended experimental layout is represented by the dotted rectangle shown in Figure 3. Finally, response models were validated using additional points to investigate model prediction error. The three validation points are represented by X in Figure 3.
Perform FSBE experiments: the FSBE tests are conducted using a three-axis DOOSAN DNM 4500 vertical CNC machining center. Figure 4 depicts the manufacturing setup. The stirring tool used is 4037 steel alloy with 19 mm in diameter and 10° tapered end to ease material penetration. The extruding dies are prepared from 4140 steel alloy and made into two halves with a die cavity of 19.05 mm in diameter. The die cavity is drilled after fixing both dies together to ensure that the axisymmetric condition is met. Two setscrews from different sides are used at the bottom of the dies in order to prevent the initial sample rotation at the onset of contact due to the spinning of the puncher. In order to measure temperature during extrusion process, three small holes are drilled in the die and type K thermocouples are mounted at top, middle, and bottom of die. Temperature measurements are recorded using Pico TC-08 thermocouple data logger. All experiments are conducted in a dry environment while varying spindle speed and axial feed rate. The FSBE test begins as the puncher drives through the cylindrical specimen at a given f and N for 45 mm leaving 5 mm at the tube’s bottom in order to maintain a safe distance between the formed tube and the cavity’s bottom surface. Since the temperature can rise to temperatures greater than 200°C during the test due to self-induced heat generation, three extrusion dies were prepared so that three runs can occur in succession. During the tests, instantaneous power and cycle time readings were recorded using the three-phase PS2500 power logger. To ensure tests repeatability, the stirring tool and the extrusion dies cavity are slightly polished and honed, respectively after each test.
Conduct tensile tests to obtain mechanical properties such as UTS, toughness and % elongation. Since the AZ31-B processed tubes’ results in a rough surface finish due to the induced heat, tube diameter is reduced by 1 mm using turning in addition to honing the bore diameter. Next, the extruded tubes are machined to get a dumbbell shape specimen as shown in Figure 5. Since the workpiece is curved, sharp corners around the rear surface are sanded to achieve a smooth surface finish to prevent stress concentration points that can cause early fracture. Finally, the dog bone sample is spray-painted with white color to create a clear uniform background then it sprayed with black to have a speckle pattern. Tensile tests are conducted using Instron universal testing machine model 5982 equipped with 3D Digital Image Correlation (DIC) setup shown in Figure 6 in order to capture surface deformation.
Analyze data using ANOVA analysis and develop mathematical models for responses.
Find the optimal setting of FSBE using desirability multi-response optimization technique. Optimization is conducted twice: first find optimal settings for mechanical properties only, then include cycle time (CT) and power consumption (P) and find optimal settings that improve mechanical properties and minimize power and cycle time.
Chemical composition of AZ31-B.
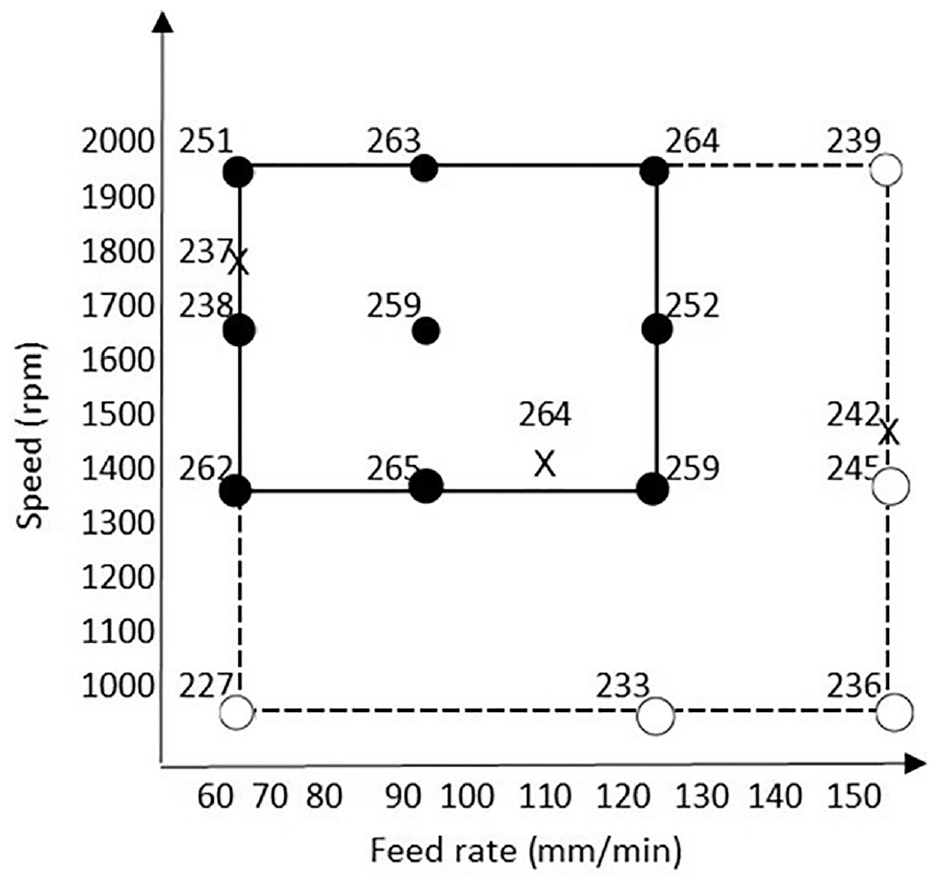
Experimental plan layout.
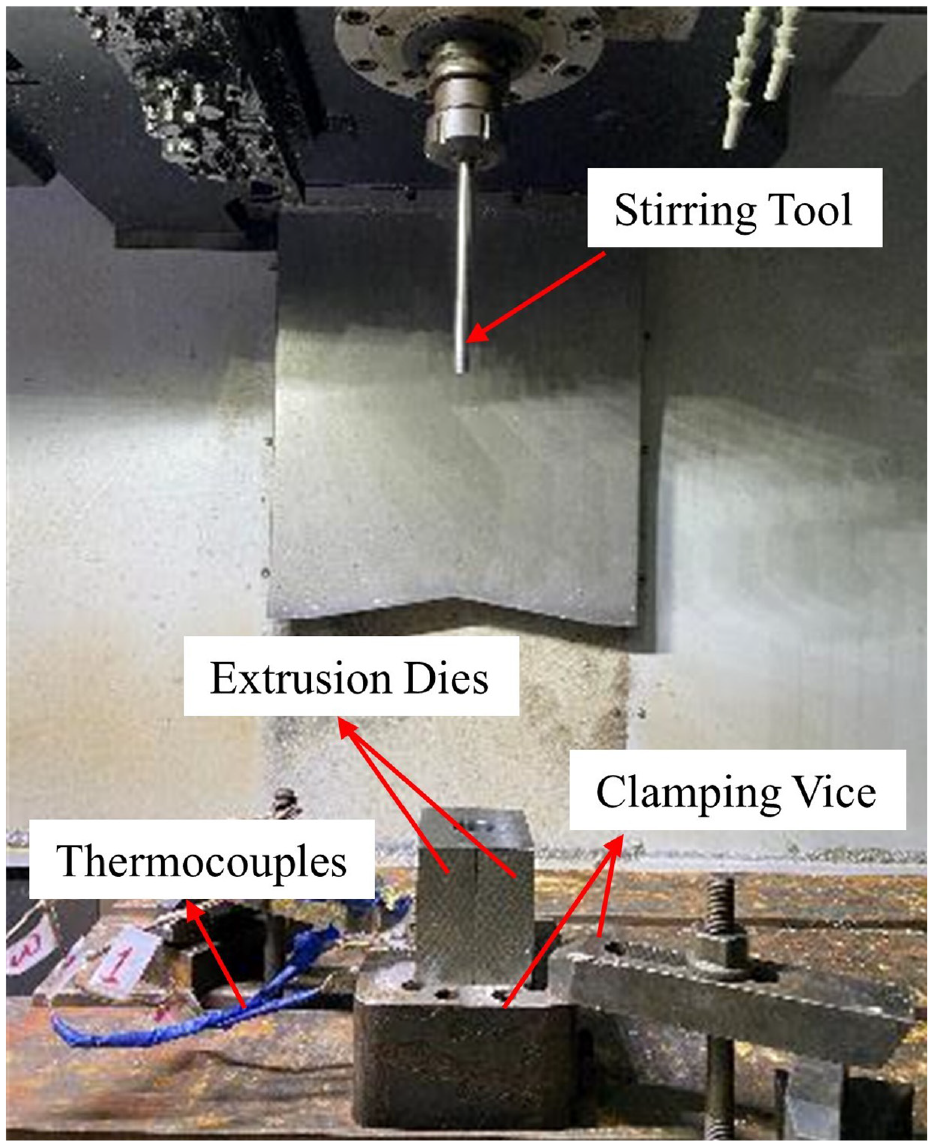
FSBE process setup.
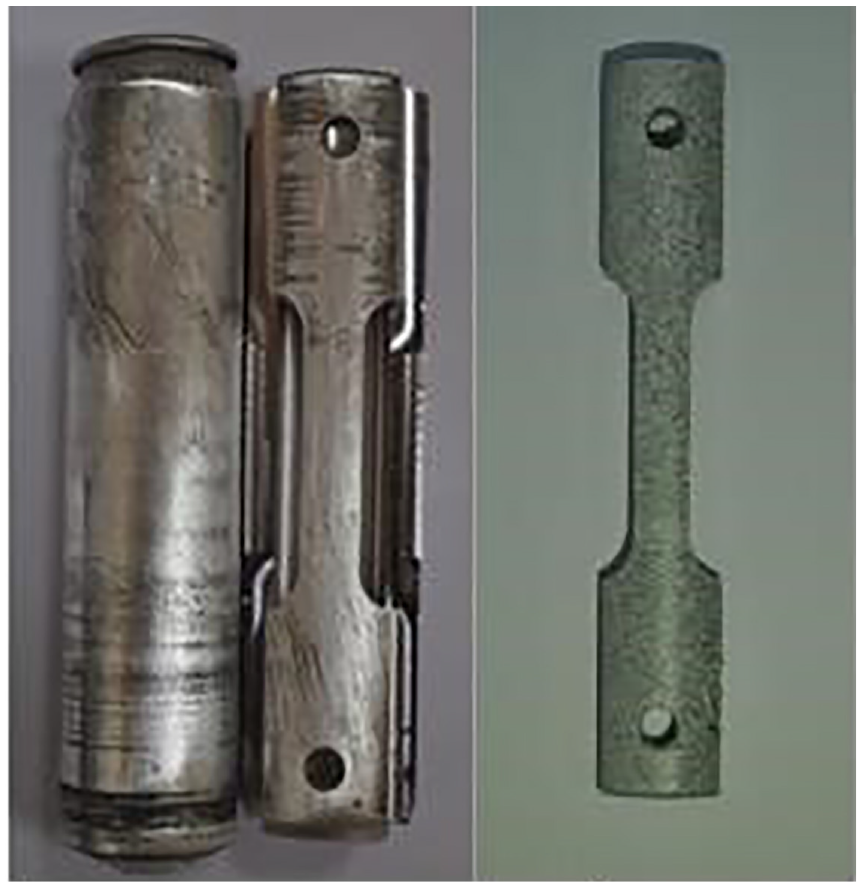
Extruded tube and tensile test specimen.
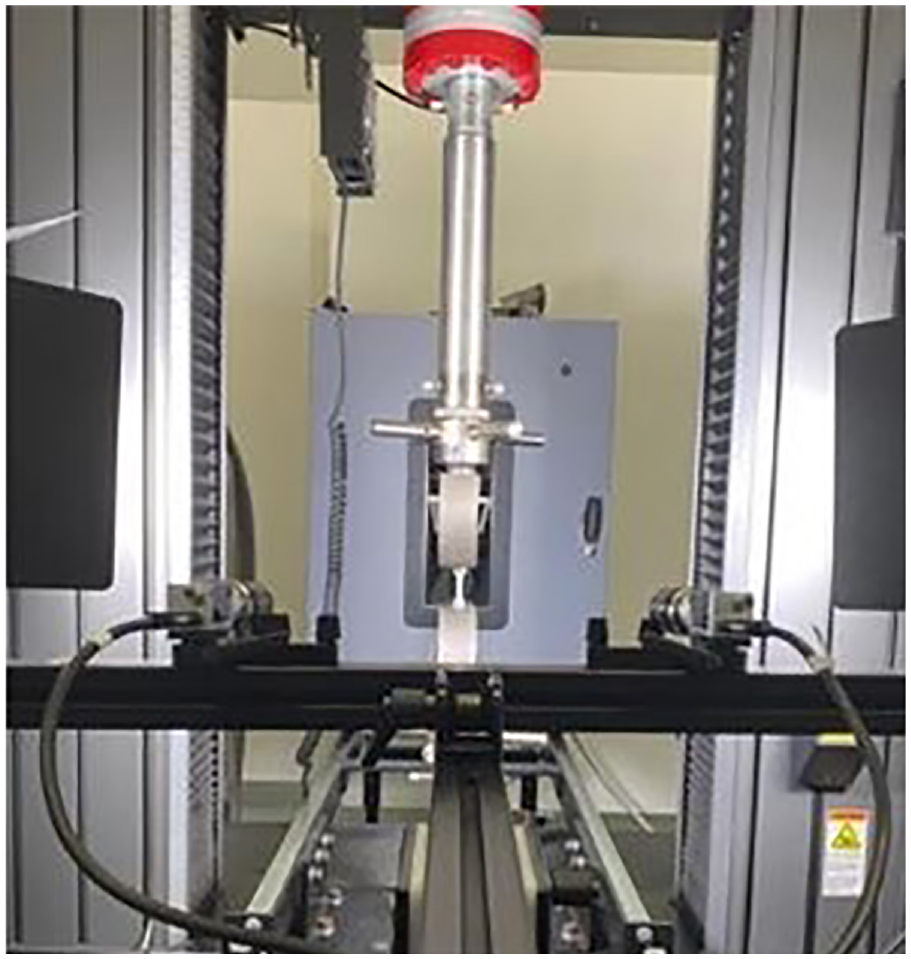
Tensile test setup with DIC system.
Results and discussion
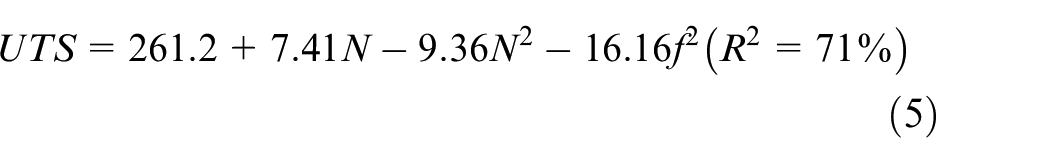
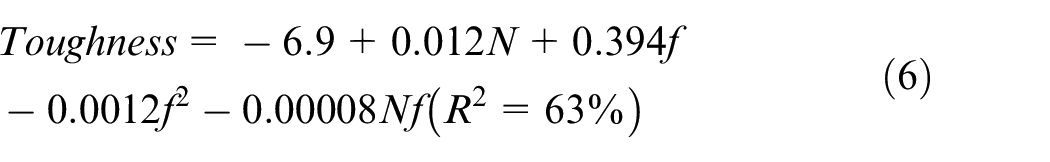
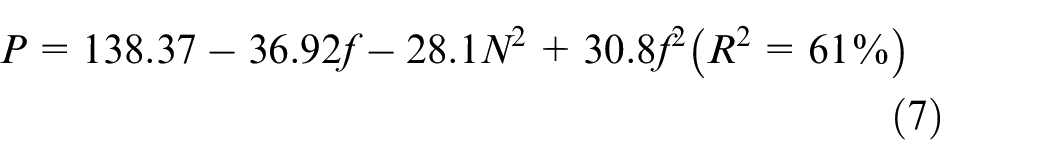
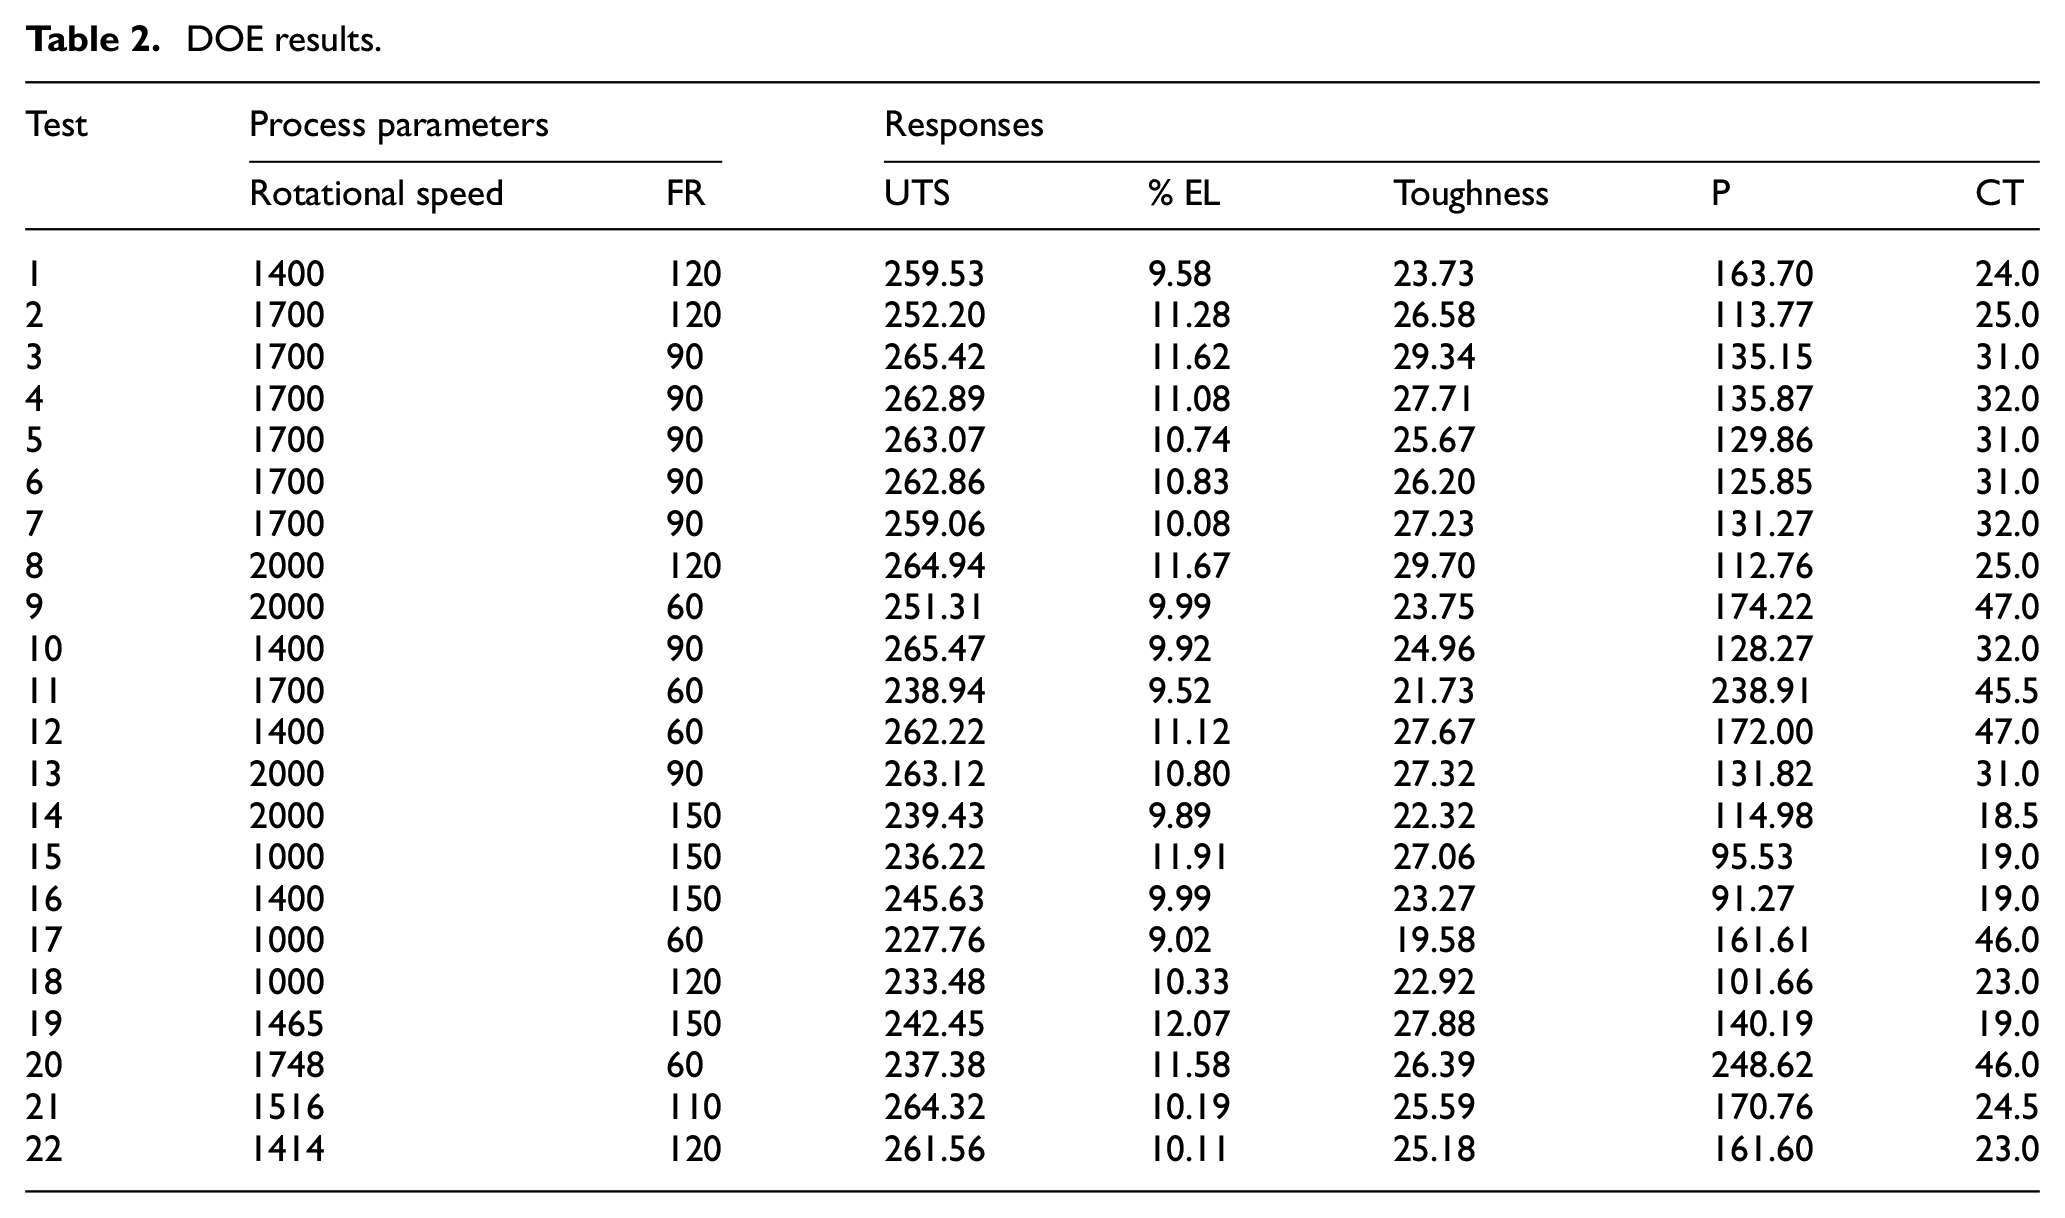
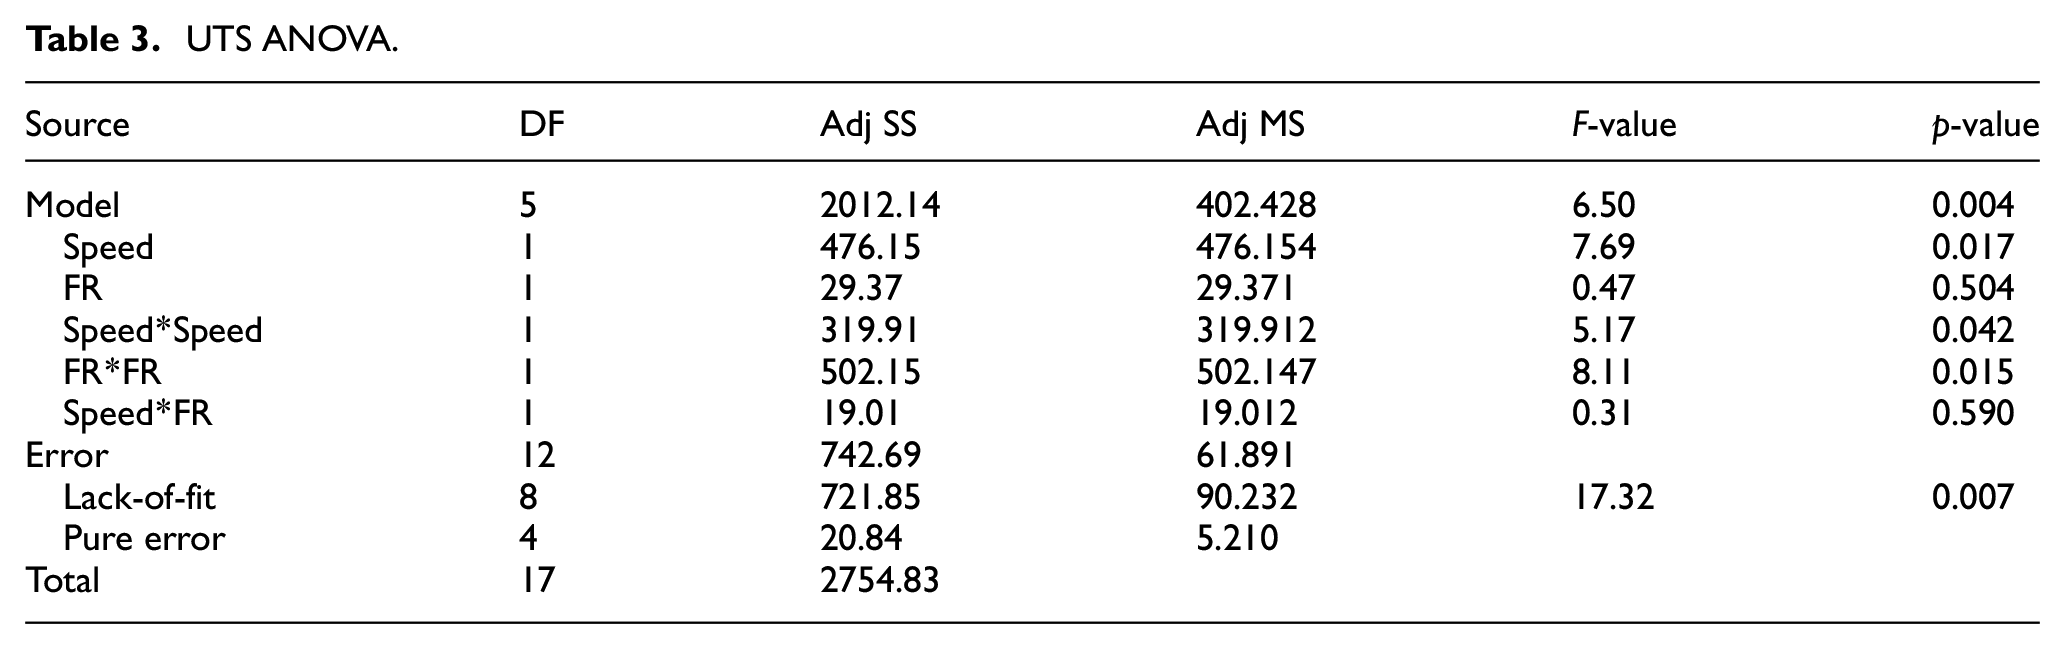
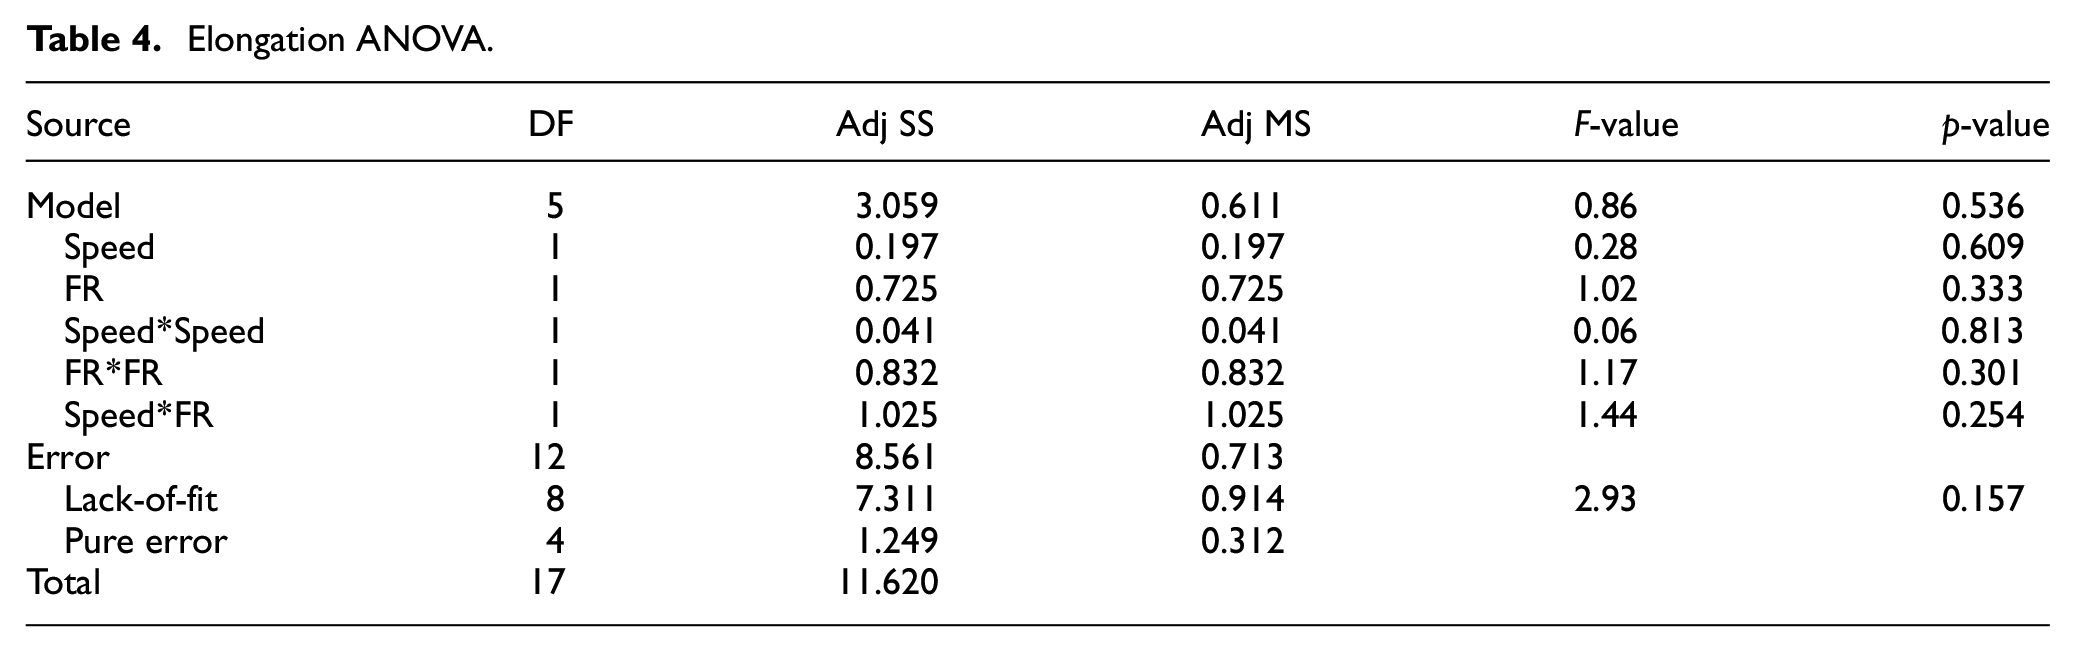
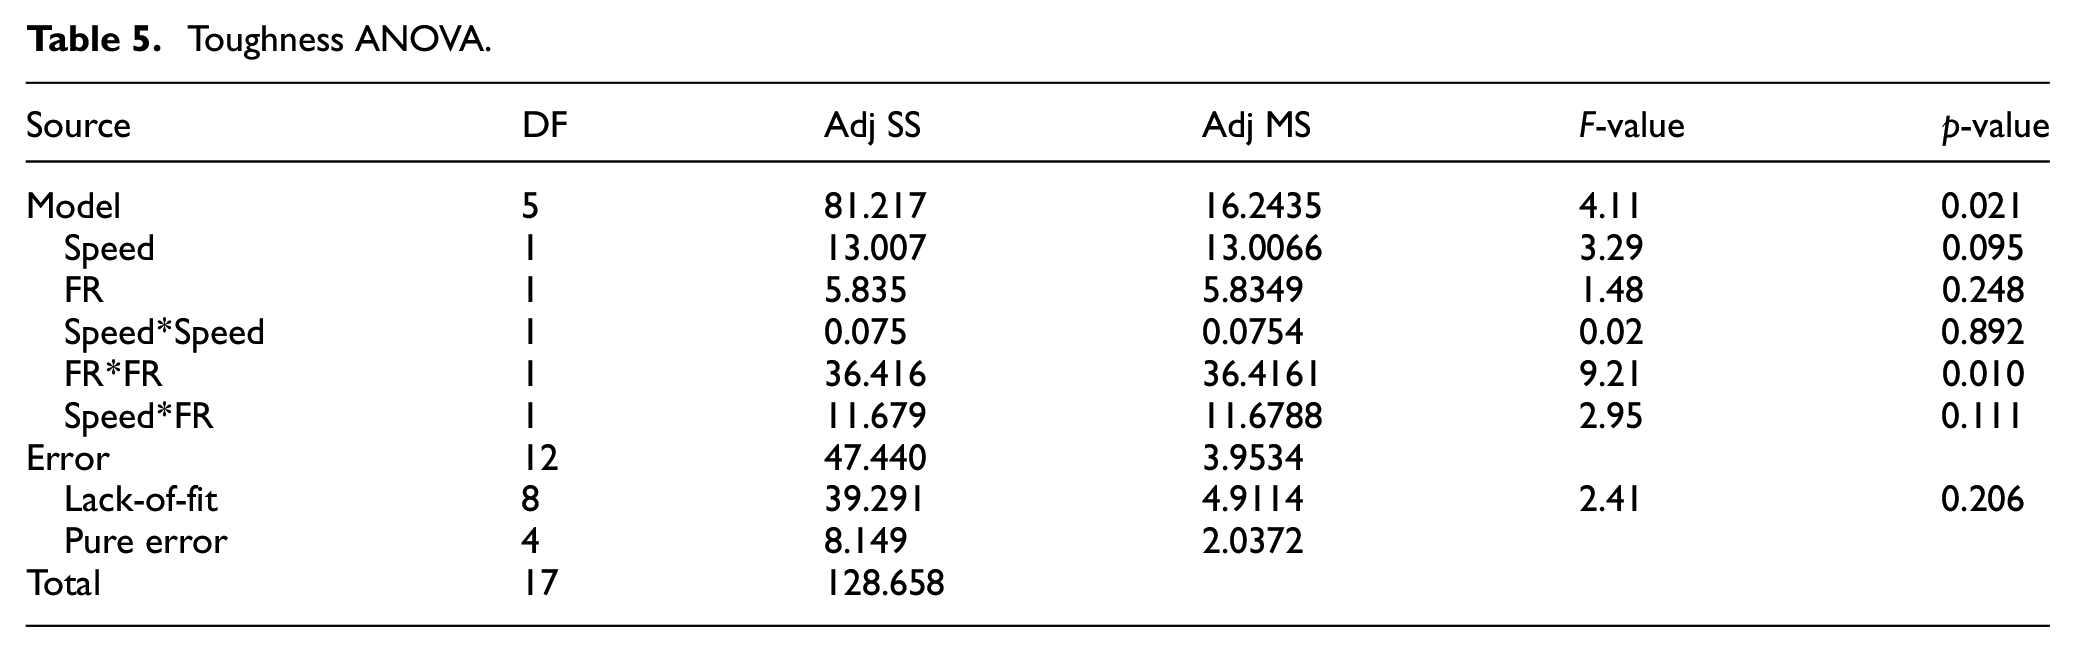
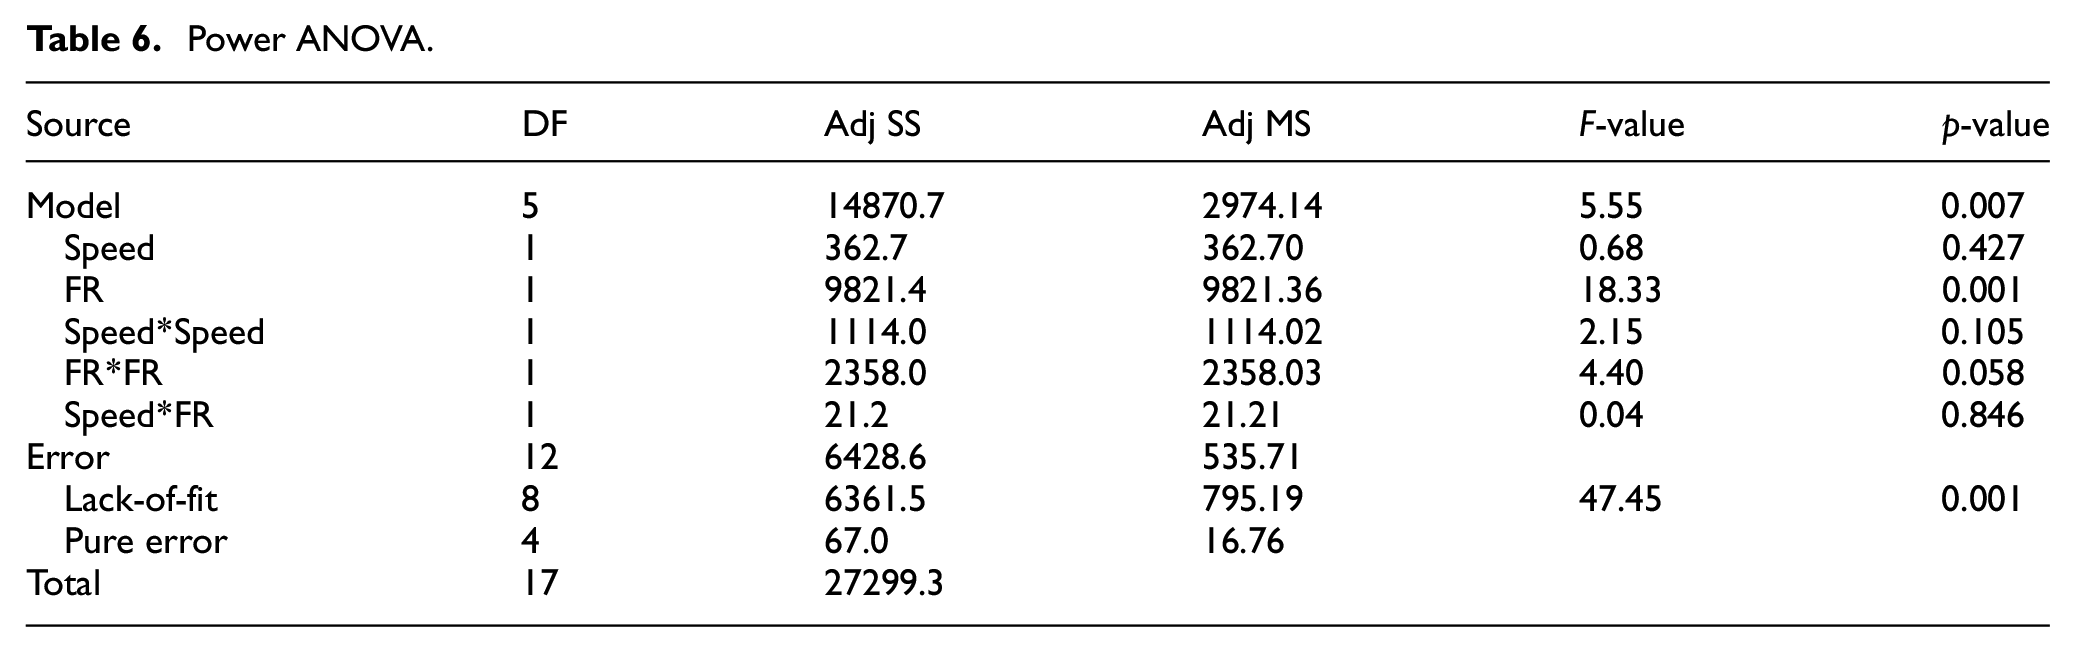
Results of experimental plan are summarized in Table 2 while sample of stress strain curves under different f and N conditions are depicted in Figure 7. The curves selected represent conditions resulted in lowest, average, and highest UTS. The range of UTS extended from 233 to 265 MPa which is considered statistically significant difference when compared to general error of experiment. In order to investigate the impact of process parameters on mechanical and production properties of FSBE process, each response is modeled and plotted using contour plots. ANOVA tables are summarized in Tables 3 to 7 while RSM models are summarized in equations (5) to (8) using coded format along with coefficient of determination R2 which provides an estimate of goodness of fit. For example, the UTS R2 of 71 suggests that 71% of experiments variability is explained by model suggested in equation 5. Moreover, the RSM models were verified by analyzing residuals/error which resulted in normally distributed residuals with an average of zero and constant variance. RSM analysis was conducted using Minitab software. Although UTS, toughness, CT, and P showed significant change due to changes in f and N, % elongation did not. % elongation ranges from 9.58 to 11.67 which is deemed not significant when compared to 0.9% mean square error of the experiments.

DOE results.
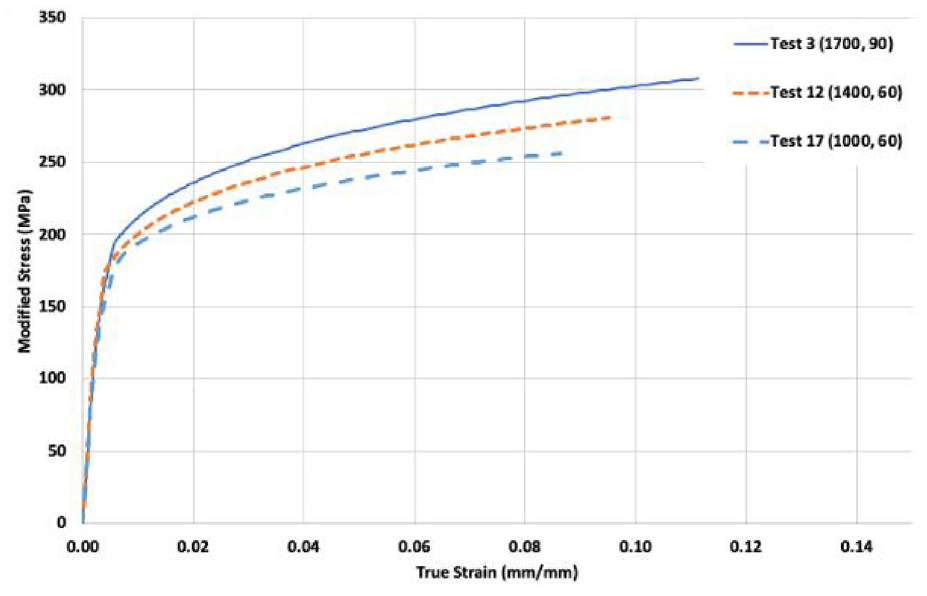
Modified stress strain curves.
UTS ANOVA.
Elongation ANOVA.
Toughness ANOVA.
Power ANOVA.
Cycle time ANOVA.
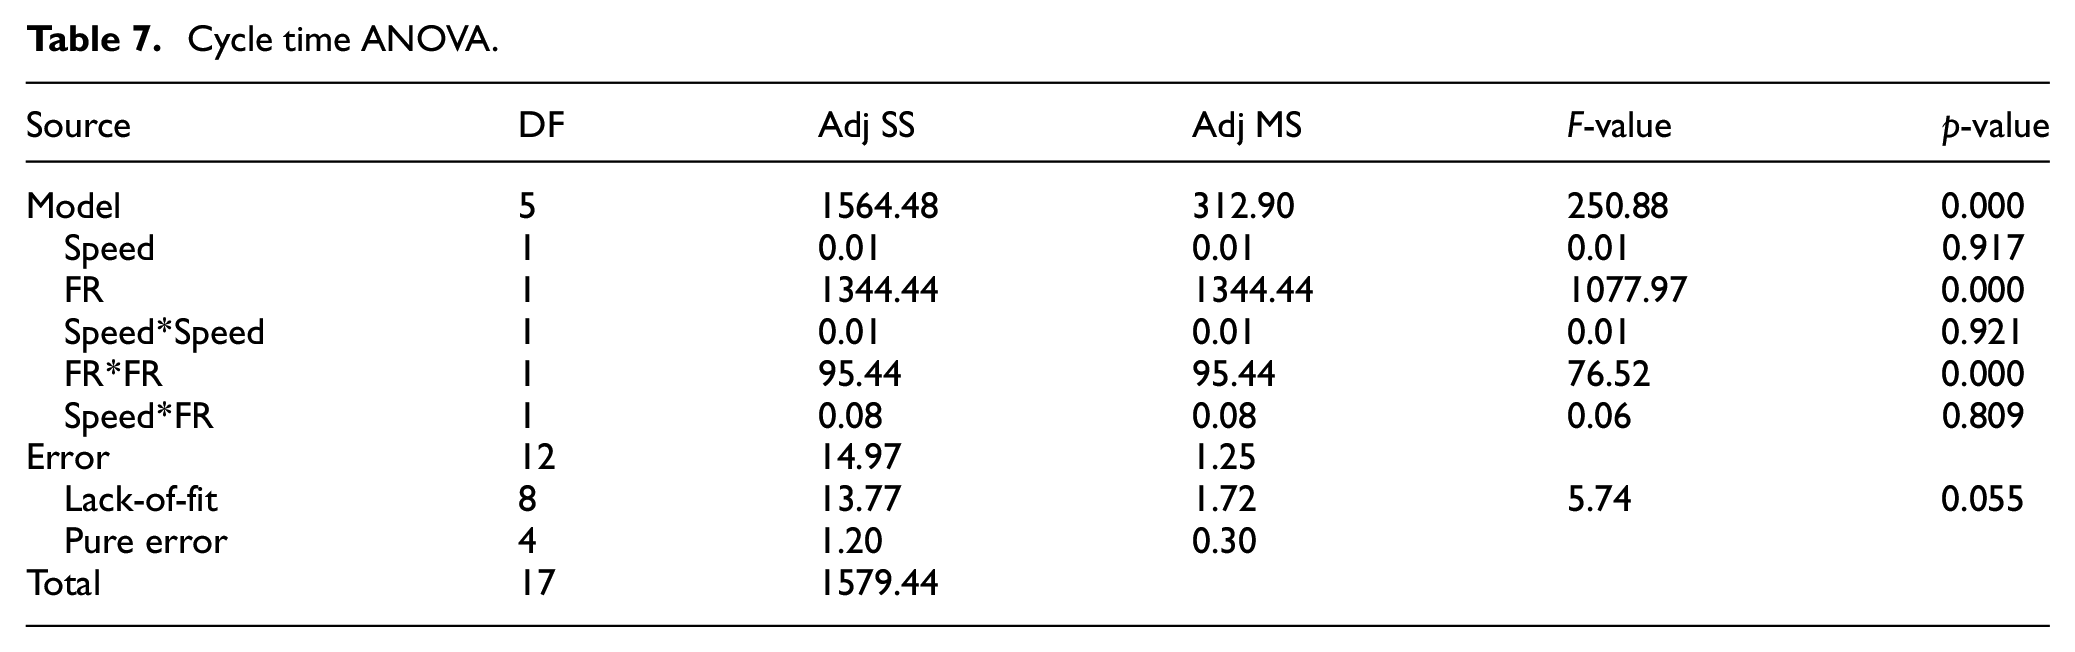
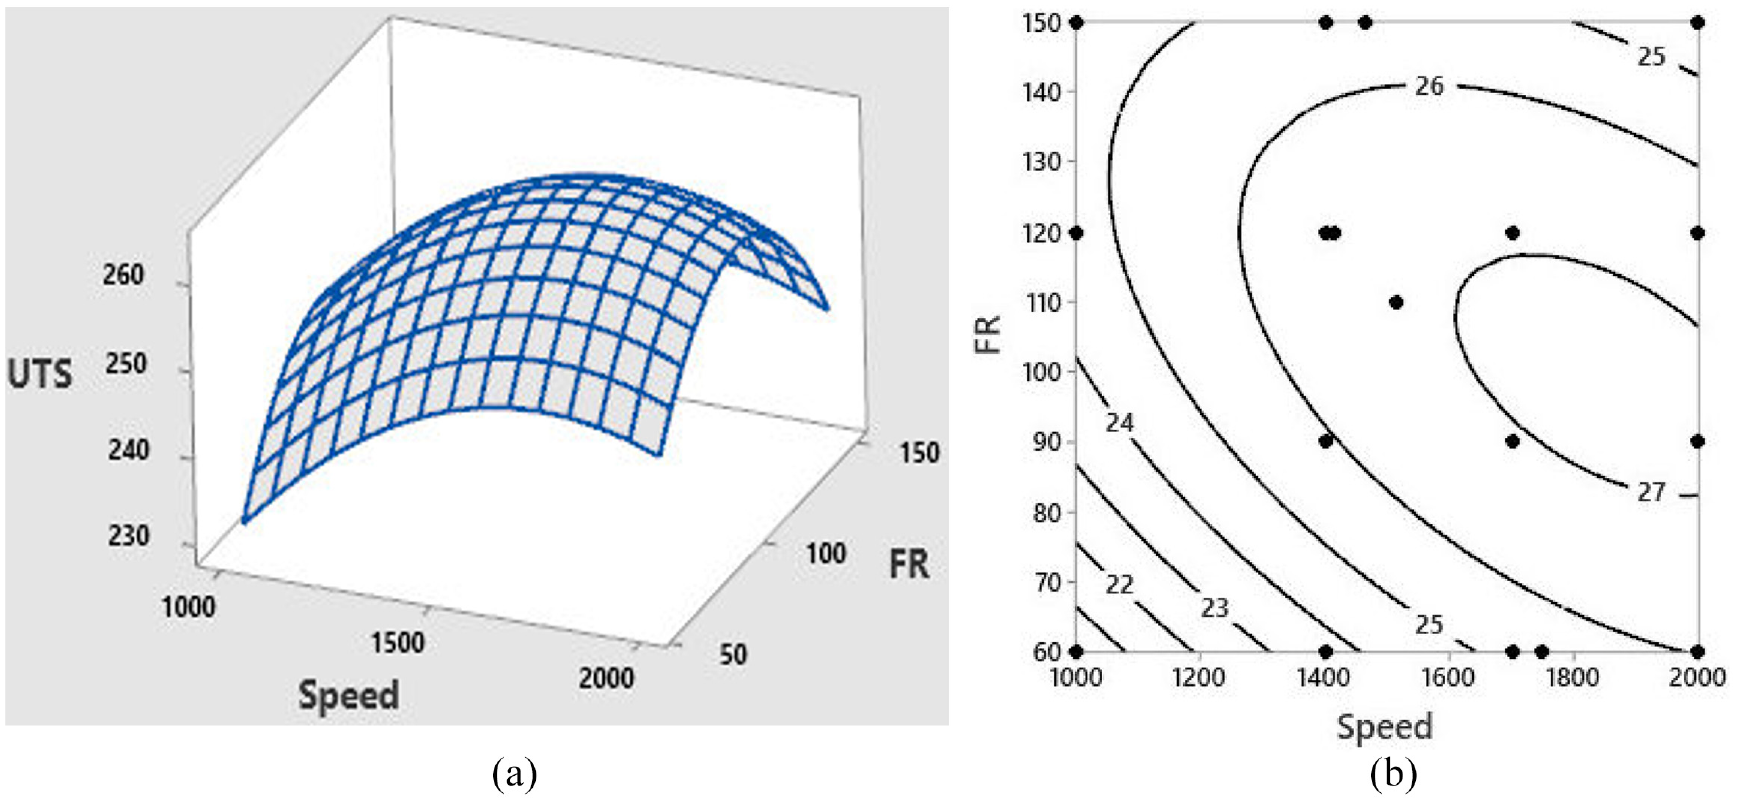
Figures 8 and 9 show the three-dimensional RSM plot and contour plots for the UTS and toughness, respectively in terms of f and N. Curved contours in the UTS and toughness demonstrate the nonlinear effect of f and N on responses represented by the quadratic and interaction terms in equations (5) to (8). UTS plots suggests that UTS increases as N and f increases until a certain value, roughly 1700 rpm and 105 mm/min, then UTS start to decrease. Toughness plots suggests similar behavior in terms of feed rate only. In terms of speed, toughness increases as speed increases. As a result, the maximum UTS can be achieved by setting N and f at 1700 rpm and 105 mm/min while maximum toughness can be achieved by setting N and f at 2000 and 96 mm/min respectively. This could be attributed to the relationship between UTS and toughness. Toughness is stress-strain area under curve, which is driven by UTS and % elongation. Since % elongation change is not significant, toughness will mainly follow UTS behavior. From examination of the UTS contour plot, we note that UTS is slightly more sensitive to changes in speed than changes in feed rate. We may also use canonical analysis
35
to conduct sensitivity analysis. Based on this analysis, two eigenvalues corresponding to N and f respectively,
(a) UTS RSM and (b) contour plots.
(a) Toughness RSM and (b) contour plots.
Contrary to hot and cold working processes, FSBE processed material undergoes heating and straining simultaneously. Recovery, recrystallization and grain growth are the three physical processes that occur during FSBE on the microstructural level. 37 Recovery and recrystallization during material stirring result in a refined grain structure. The strength of the friction stir processed material depends mainly on grain size. Finer grains result in improved strength. When recovery and recrystallization are completed, the reduction of the energy stored in the microstructure can only be achieved by grain growth. Grain growth will have a negative impact on strength that cannot be avoided. 37
Figure 10 shows temperature variation with time measured in the middle of the die. The peak temperature in this curve is an indication of heat generated by friction and plastic deformation. As peak temperature increases, higher heat is supplied to the processed material. The heat input plays a crucial role in determining the final grain size in the friction stir processed material. If the heat input is too high, significant grain growth will occur after the recovery and recrystallization processes are completed. Speed of 2000 rpm and 60 mm/min feed rate represent this case. If the heat input is too low, insufficient recrystallization and limited plastic flow will result in coarse grains. The two curves in Figure 10 that correspond to 2000 rpm and 150 mm/min and 1000 rpm and 60 mm/min are examples of insufficient heat input. In both cases, heat input is too high or too low with strength adversely affected. Referring to the UTS and toughness results provided in Table 2, the amount of heat generated at 1700 rpm and 90 mm/min will result in fine grains due to sufficient recrystallization and minimal grain growth that improve mechanical properties.
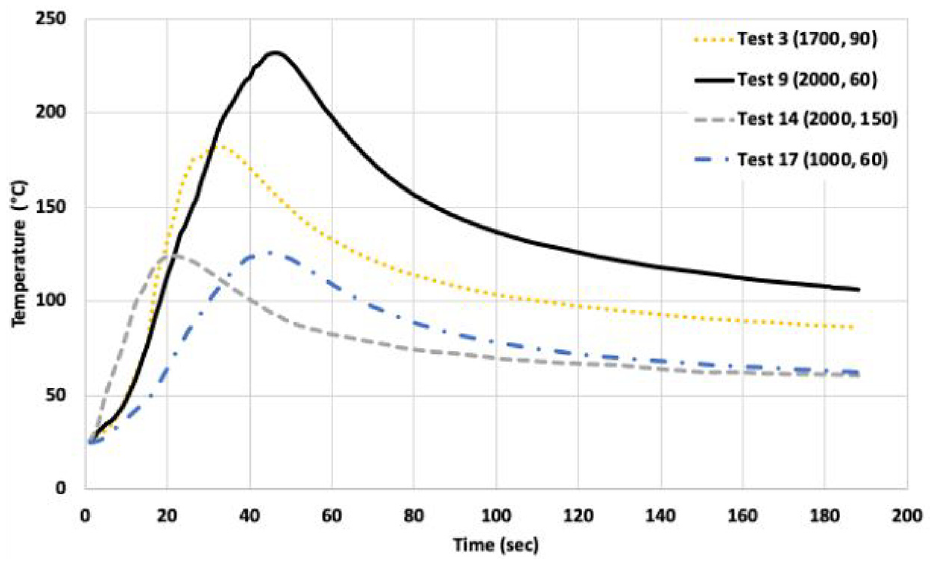
Temperature vs time in the die for different conditions.
Figure 11(a) and (b) depicts contour plots of power and cycle time. Cycle time is a function of feed rate only while power is affected by both parameters. Power increases as speed increases, then decreases after around 1600 rpm. In terms of feed, power decreases as feed increases.
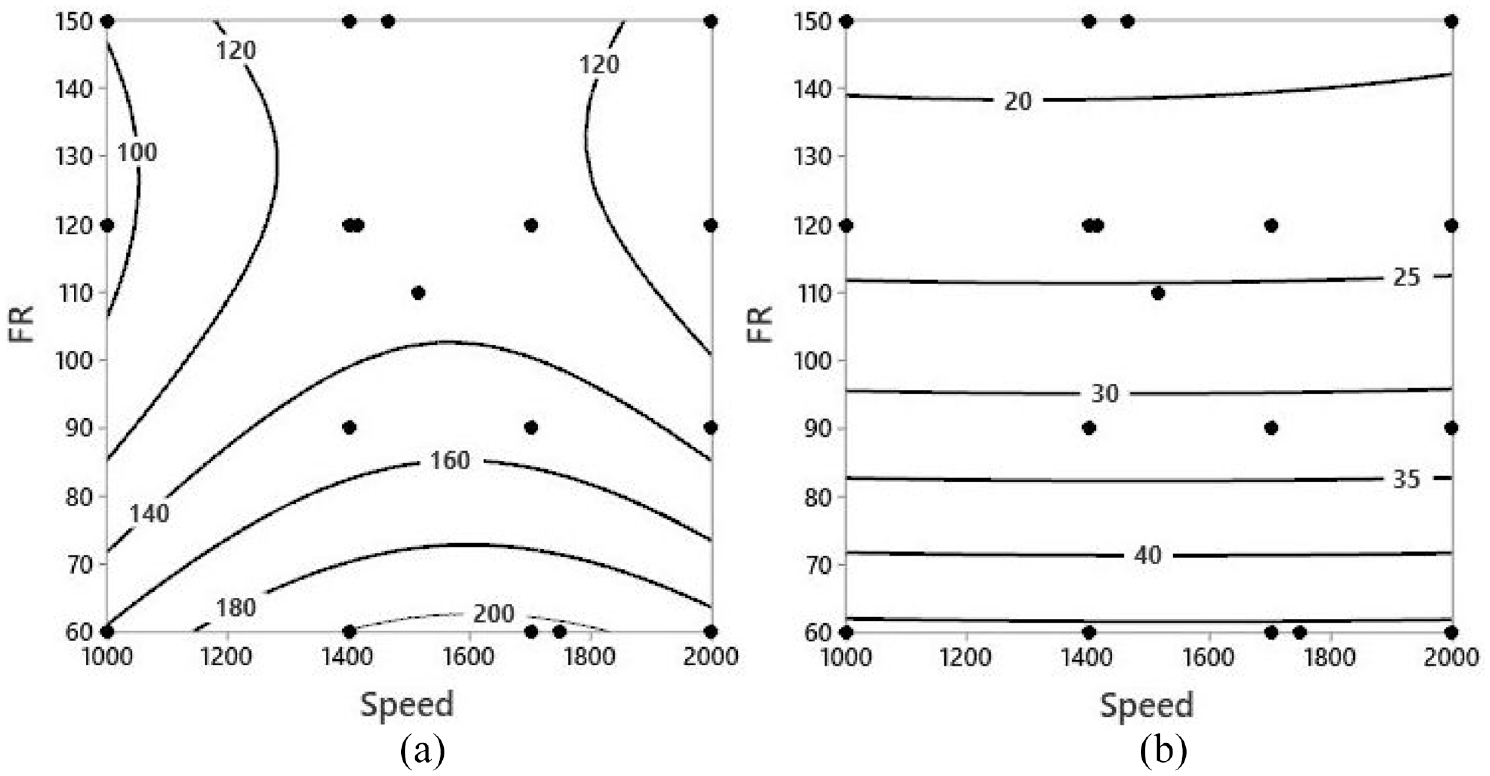
(a) Power and (b) cycle time contour plots.
Next, desirability multi-response optimization technique is conducted twice. First, objective is to maximize all mechanical properties - see Figure 12(a). In the second step, the objective is to maximize mechanical properties and minimize power and cycle time, see Figure 12(b). The optimal settings of the former case, assuming all properties have the same weight, is 1767 rpm and 102 mm/min. The optimal settings will result into a UTS of 262 MPa, toughness of 26.9 J/m3, and % elongation of 10.7. In the latter case, the optimal settings are 2000 rpm and 116 mm/min. The optimal settings in this case will result into a UTS of 258.6 MPa, toughness of 27.4 J/m3, % elongation of 10.7, power of 102.9 kW, and cycle time of 23.8 s. The individual desirability di indicates the amount of deviation from the individual response optimal value. For example, UTS di of 0.92 indicates a small deviation from the maximum UTS achieved (265 MPa).
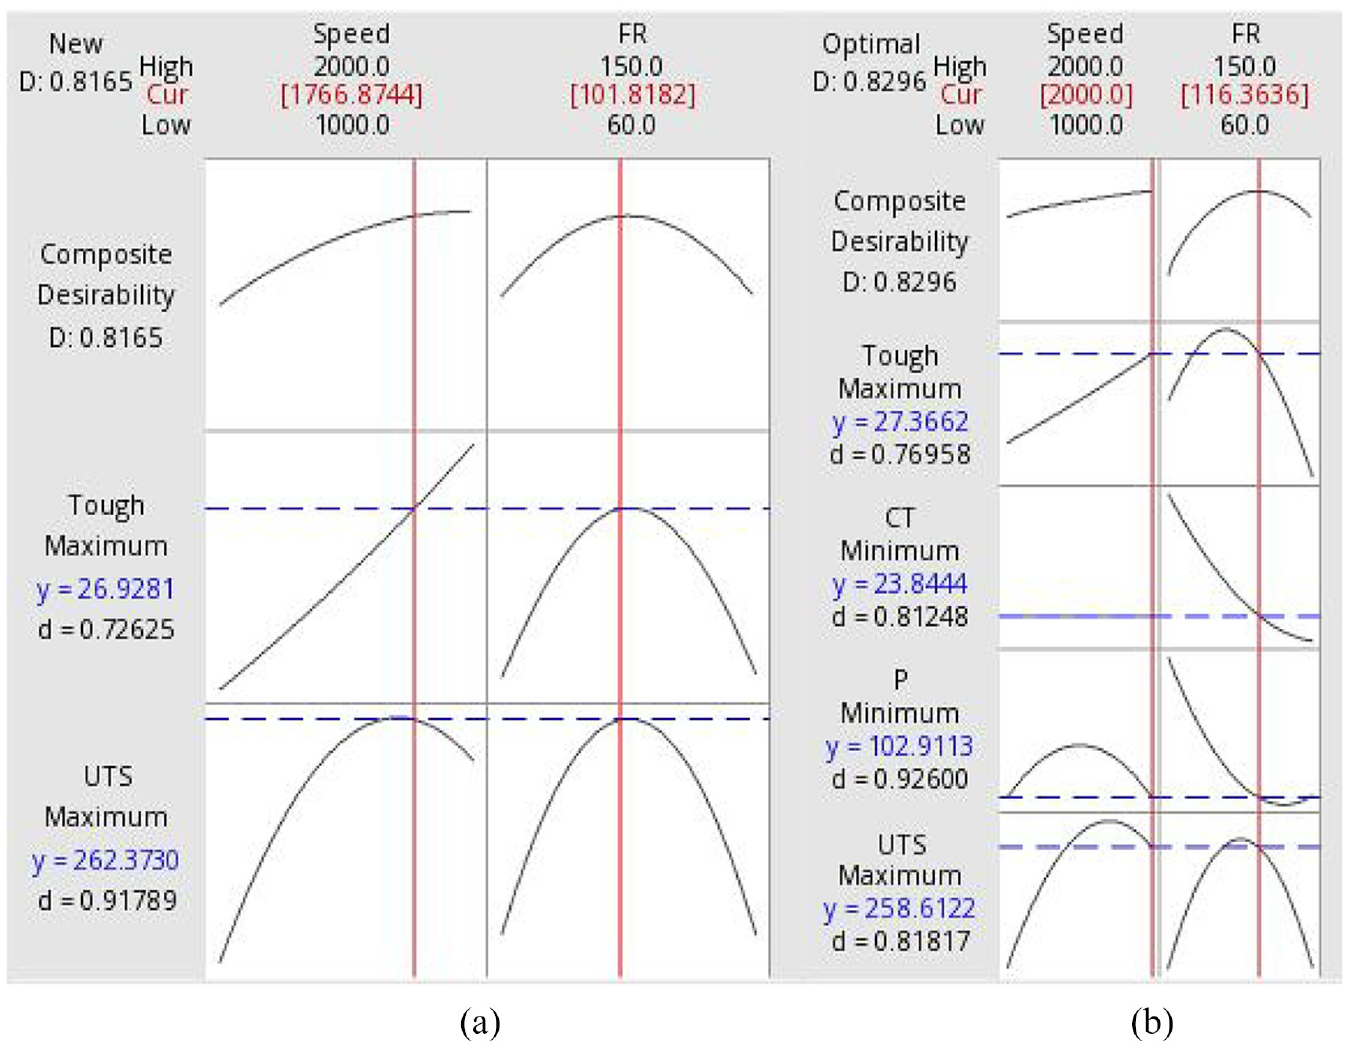
(a) Mechanical response optimization and (b) overall response optimization.
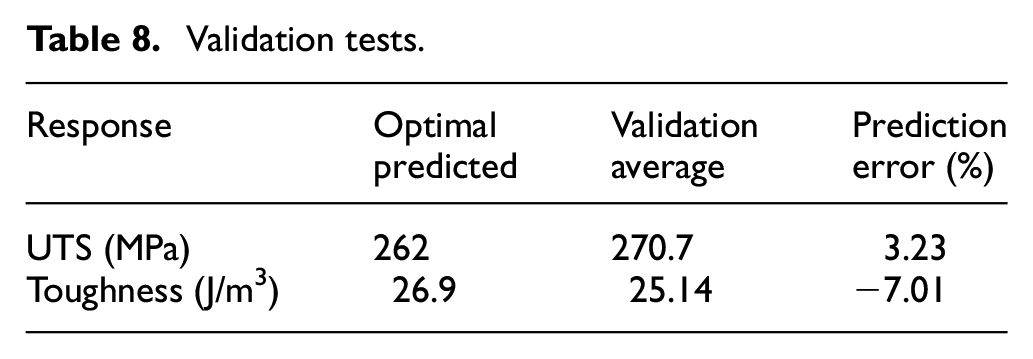
To validate optimization results of mechanical properties only, two experiments were conducted at the optimal settings, that is, 1767 rpm and 102 mm/min. The results are summarized in Table 8. The UTS and Toughness were within the 3% and −7% respectively of predicted optimal settings. These results are within the measurement variability and are deemed acceptable.
Validation tests.
Conclusions and future work
In this investigation, RSM statistical method is used to predict and optimize the mechanical properties namely, UTS, percent elongation and toughness in addition to power consumption and cycle time as productivity indicators. All the latter responses were examined for the FSBE of AZ31-B magnesium alloy. According to the results, the following were induced:
(1) The developed mathematical model incorporated the main process parameters, rotational speed and axial feed rate to predict UTS, toughness, power consumption and cycle time with a coefficient of determination of 71%, 63%, 61%, and 99%, respectively. The model was validated through ANOVA. The variation of FSBE process parameters had a non-linear influence on the responses.
(2) Using desirability multi-response optimization, the mechanical properties optimized in terms of their maximum are identified to be 1767 rpm and 102 mm/min. Optimizing the latter properties together with minimizing the power consumption and cycle time gives the optimal process conditions of 2000 rpm and 116 mm/min.
(3) The canonical sensitivity analysis confirms that UTS is more sensitive to changes in speed than feed rate. The eigenvalues corresponding to rotational speed and feed rate were −8.57 and −14.9, respectively.
(4) The recorded temperature profiles in the middle of the extrusion die during FSBE show that a peak temperature of 230°C is reached in the die for the conditions of 2000 rpm and 60 mm/min. This is an indication of high heat input that deteriorates the mechanical properties due to grain growth. Percent elongation did not change significantly by the change in feed rate or rotational speed. As a result, expanding the window of experimentations by possibly increasing feed rate and spindle speed might induce a considerable change in elongation. However, the authors were limited to the vertical CNC machining center capabilities. This is deemed an open area for future research.
Footnotes
Declaration of conflicting interests
The author(s) declared no potential conflicts of interest with respect to the research, authorship, and/or publication of this article.
Funding
The author(s) disclosed receipt of the following financial support for the research, authorship, and/or publication of this article: This work was supported by the American University of Sharjah under grants FRG19-M-E78 and EFRG18-MSE-CEN-26