
Abstract
Through-thickness reinforcement is a promising solution to the problem of delamination susceptibility in laminated composites. Modeling Z-pin–prepreg interaction is essential for accurate robotics-assisted Z-pin insertion. In this paper, a novel Z-pin insertion force model combining the classical cohesive finite element (FE) method with a dynamic analytical fracture mechanics model is proposed. The velocity-dependent cohesive elements, in which the fracture toughness is provided by the analytical model, are implemented in Z-pin insertion FE model to predict the crack initiation and propagation. Then Z-pin insertion experiments are performed on prepreg sample with metallic Z-pins at different velocities to identify the analytical model parameters and validate the simulation predictions offered by the model. Dynamics of Z-pin interaction with inhomogeneous prepreg is described and the effects of insertion velocity on prepreg contact force are studied. Results show that the force model agrees well with experiments and the fracture toughness rises with the increasing Z-pin insertion velocity.
Introduction
Fiber reinforced composite laminates have been widely used in aerospace industry due to their design flexibility and lightweight characteristics. However, they are prone to delaminate when loaded perpendicular to the laminate main plane, leading to performance degradation and structural failure.1,2 The development of through-thickness reinforcement in the form of Z-pinning, stitching, or 3D weaving can solve the problems. 3 Z-pinning is to insert solid rods with a certain volume density in the thickness direction of composite laminates.4,5 Z-pins are needle-shaped, with diameters of typically 0.1–1.0 mm, and consist of materials with titanium alloy, aluminum alloy, stainless steel, or fiber-reinforced resin matrix composite. 6 The delamination resistance and damage tolerance of composite laminates are greatly improved after Z-pins are inserted.
Accompanying the increasing application of Z-pinning, significant efforts have been made to analyze and predict the mechanical properties of Z-pin reinforced composites. In addition to the impact resistance, the effects of strengthening interlaminar fracture toughness of Z-pin composites in mode I, mode II, and mixed-mode loading were also studied.7–10 Some scholars have explored the reduction of in-plane mechanical properties caused by microstructural damage during the Z-pin insertion process. 11
However, the penetration mechanism during Z-pin insertion into prepreg is yet to be explored. Due to the force caused by Z-pin–prepreg interaction, the deformation of the prepreg, and the crimping of the laminate plies will occur. 12 The fibers in the uncured prepreg will be pushed aside by the Z-pin and a cavity will appear. These cavities are then filled with resin during consolidation, forming resin rich zones.13,14 The changes of structural characteristics during the Z-pin insertion process are schematically illustrated in Figure 1.
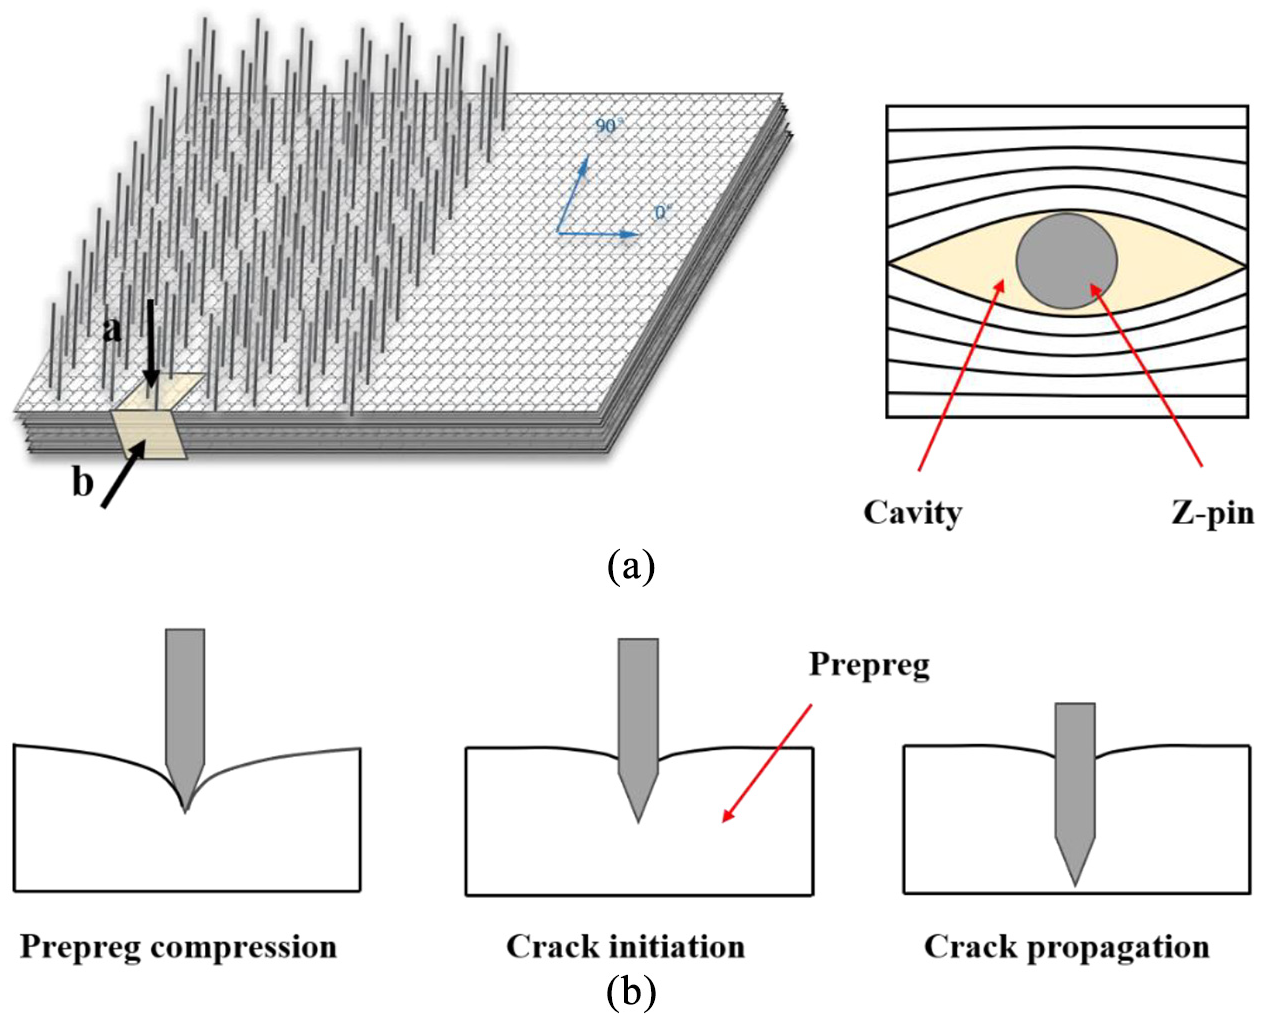
The changes of structural characteristics during the Z-pin insertion process: (a) top view and (b) front view.
The insertion force is not only related to the prepreg structure and mechanical properties, but also affected by the shape of Z-pin and insertion technology. If the insertion resistance is too large, Z-pin cannot penetrate the prepreg, which will directly lead to manufacturing process failure. Therefore, a good insertion force model can reveal the change rule of force and the main influencing factors in the insertion process, which provides theoretical basis for the design of insertion device and the optimization of insertion process parameters, in order to reduce the insertion resistance and improve insertion accuracy and success rate.
Based on the needle insertion model,15–18 we can divide the Z-pin insertion process into two phases, as shown in Figure 2:
Prepreg compression: The Z-pin tip is pressed against the prepreg surface, and with the increase of tip force, the deformation of prepreg gradually increases. In this phase, the prepreg only deforms without crack (region A).
Crack initiation and propagation: When the internal stress of the prepreg reaches the critical fracture stress, a crack is formed in the prepreg surface (i.e. Z-pin punctures the prepreg surface). The initiated crack propagates into the interior of the prepreg in response to the Z-pin tip displacement until it penetrates completely (region B).
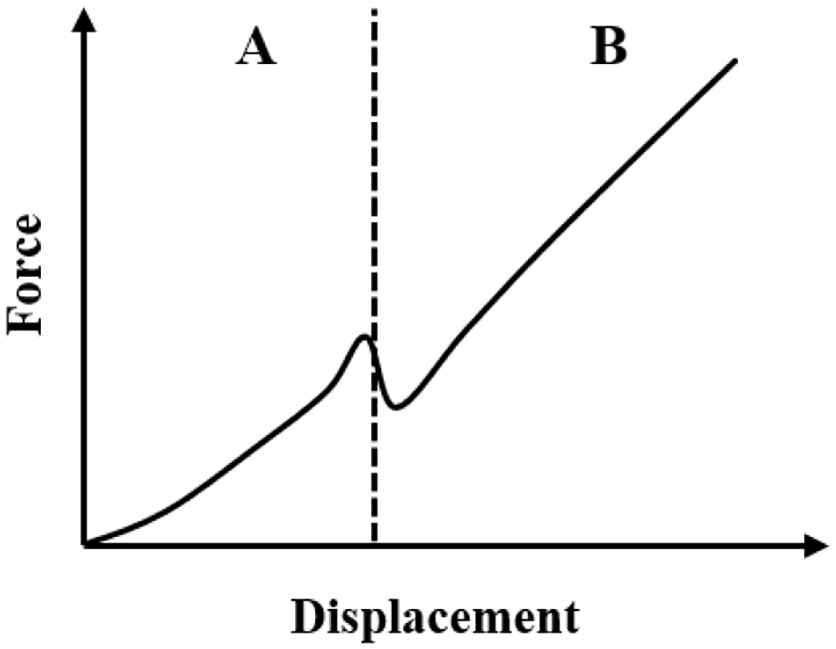
The two generic phases of needle insertion model.
Fracture mechanics approaches have been extensively used because it can predict well when failure will occur. In a linear elastic model, the fracture toughness, Gc, is an effective description to detail the mechanical concept of crack creation. 19 The insertion force is primarily governed by Gc, 20 which is strain rate dependent, and will cause the insertion velocity to vary the insertion force. Work has been done experimentally and theoretically to study the effect of velocity on needle insertion. Some ex vivo tests have shown that the force required to initiate penetration decreases with increasing needle velocity up to a critical velocity in the lamb heart, 21 porcine hearts, 22 and turkey breast. 23 However, Frick et al. 24 showed that the insertion force was independent of velocity when inserting the suture needle into the sheep skin. For prepreg, the fracture process is a complex process involving resin cracking and fiber rupture. Therefore, the relationship between insertion force and velocity during Z-pin insertion into prepreg needs to be determined experimentally with a dynamic force model to describe the velocity correlation phenomenon.
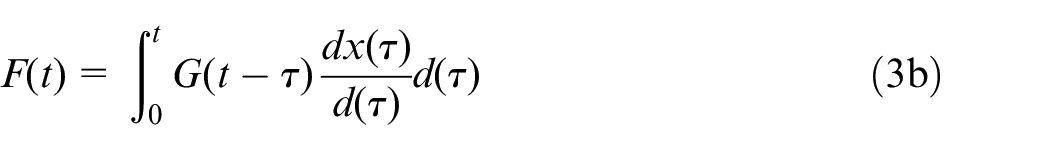
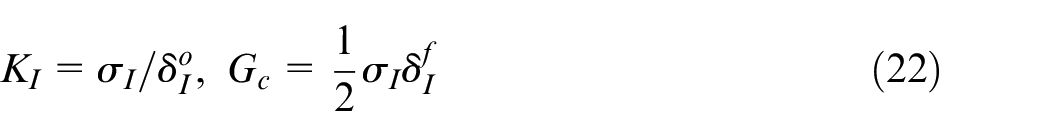
Utilizing Azar and Hayward’s 25 method inserting twice in the same position, we can obtain Gc by the following equation
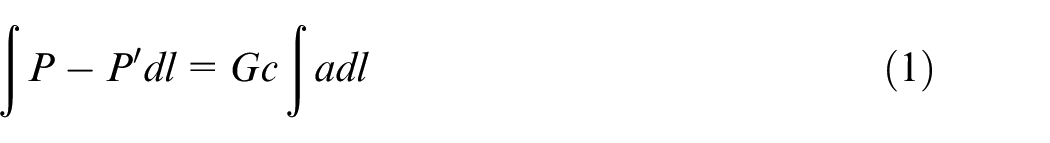
where P−P′ is the force difference between two insertions when the needle is in the stable penetration state (region B), as shown in Figure 3(a), and a is the crack length. In Figure 3(b), the slope of the line produces Gc.
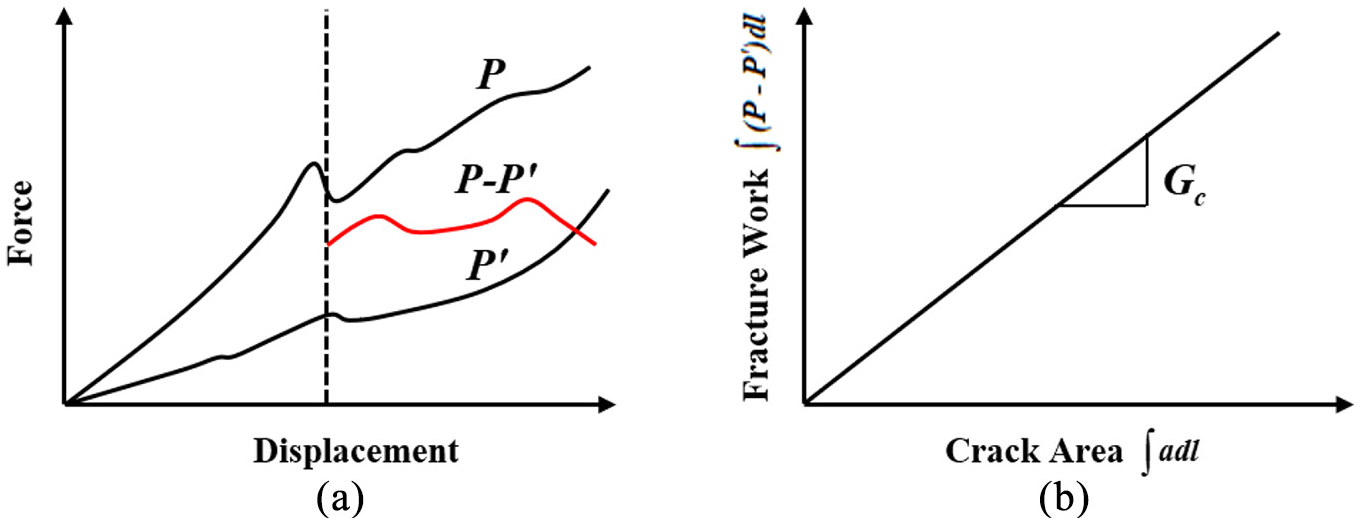
(a) Graph of first and second tissue insertion and (b) graph of how to determine Gc.
Two principal drawbacks of this method are as follows: 1. It is difficult to measure the internal crack of prepreg; 2. It is difficult to determine the limit of crack because the crack closes up after needle extraction. The instruments with high precision must be used to determine the internal crack and the limit of crack, which will be expensive and time-consuming. In this paper, a dynamic Z-pin insertion force model is proposed. This calculation strategy combines the classical cohesive finite element (FE) method with the dynamic analytical fracture mechanics model. The force and displacement at the time of crack initiation obtained from the experiment data are substituted into the analytical model to calculate Gc which is velocity-dependent. Then, Gc is incorporated into cohesive FE model and the results are verified by the experimental force-displacement curves. The modeling philosophy is presented in Figure 4.
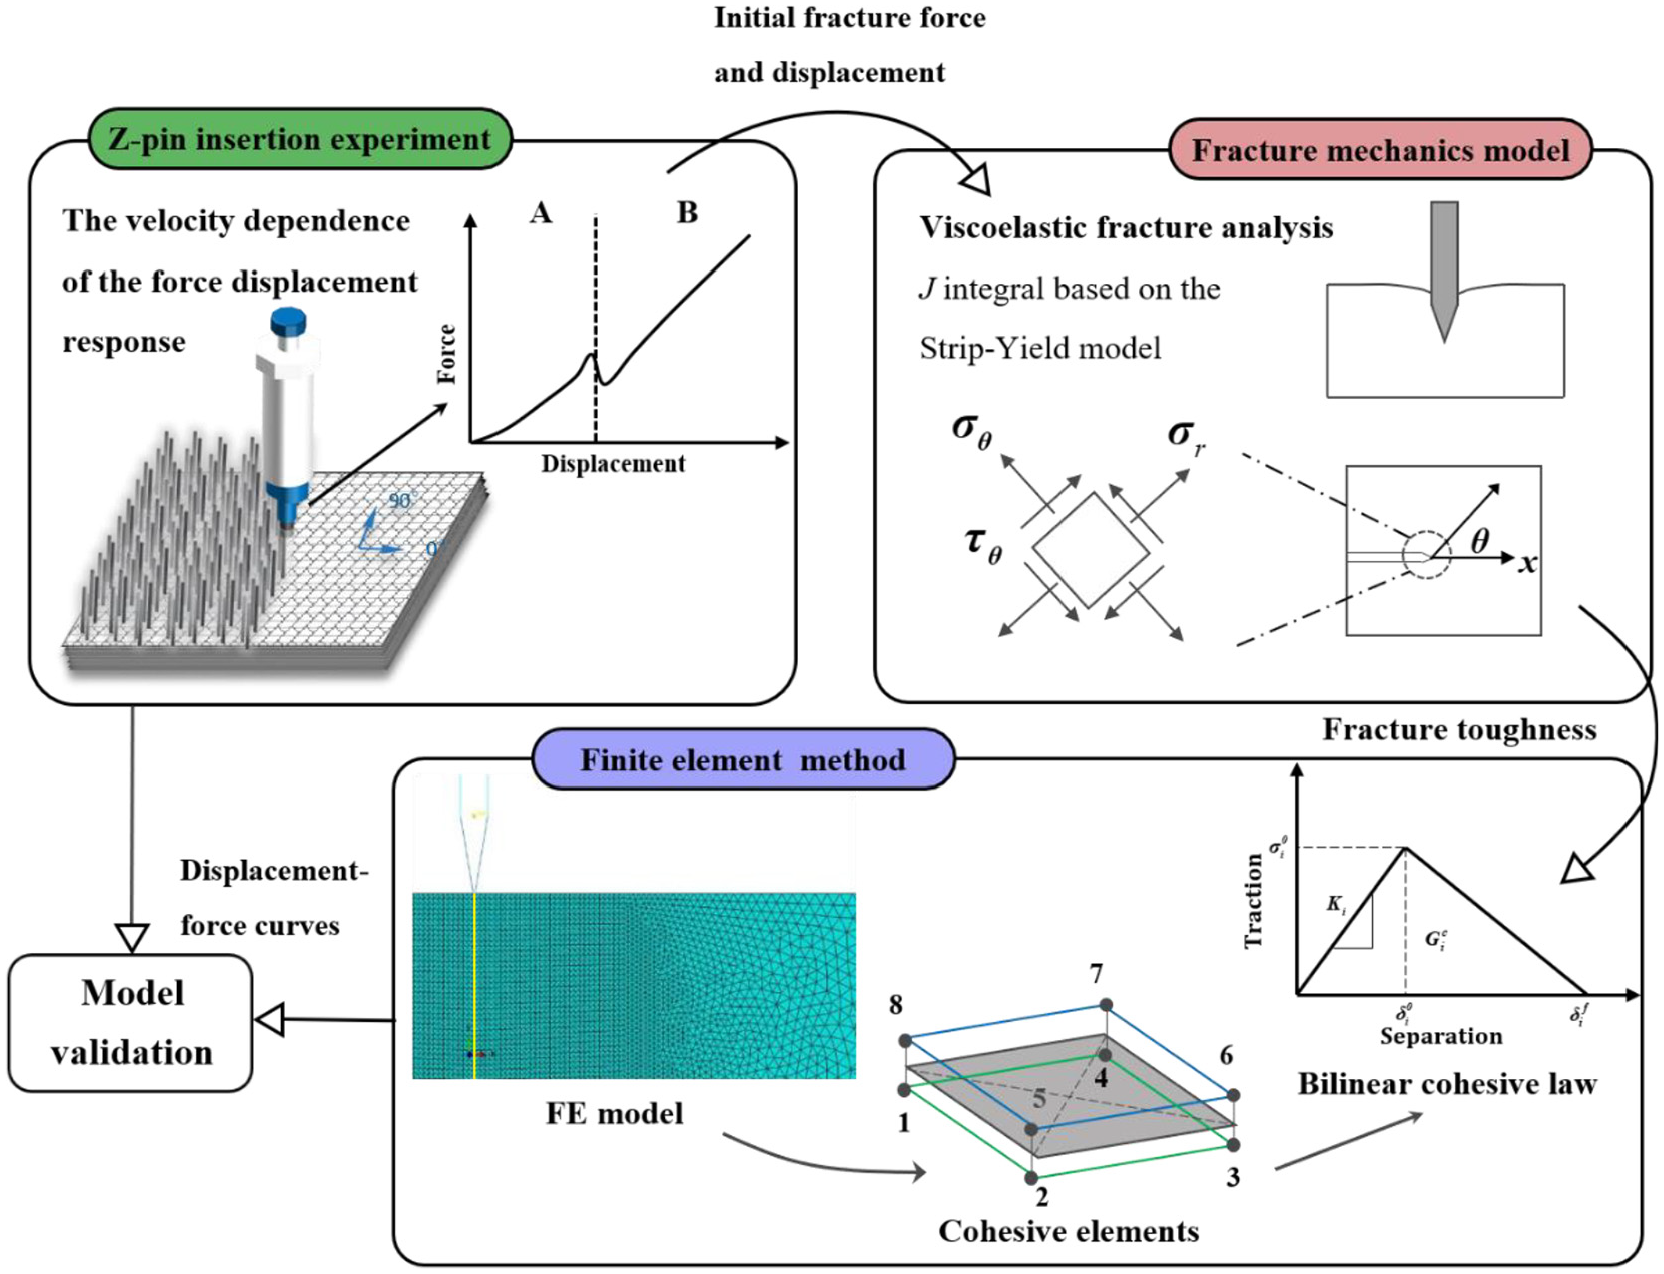
The modeling philosophy for Z-pin insertion.
Fracture mechanics model
The fracture mechanics model 26 of orthogonally inserted Z-pin subjected to different velocities is formulated to characterize the contact force and corresponding displacement relation during the compression phase and estimate the maximum puncturing force when crack initiates. Gc is determined by fitting the model to the experimental data by an inverse approach.
Prepreg compression
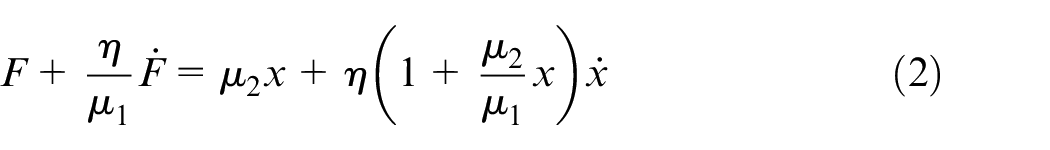
The standard linear solid model, which is composed of a Newtonian damper and two Hookean springs, one in parallel and one in series, is employed to predict force-deformation response of Z-pin in contact with prepreg during the compression phase, as shown in Figure 5. The model can be expressed as a first order differential equation
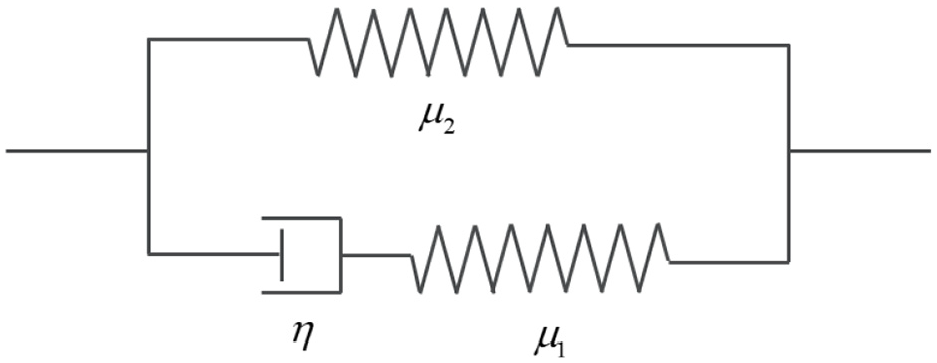
A schematic of the standard linear solid model.
where F is the contact force, μ1 and μ2 are prepreg stiffness, η is the prepreg damping coefficient, x is the Z-pin tip displacement, and dot denotes differentiation with respect to time t. Using the convolution integral, the contact force and displacement can be calculated with respect to time as 27
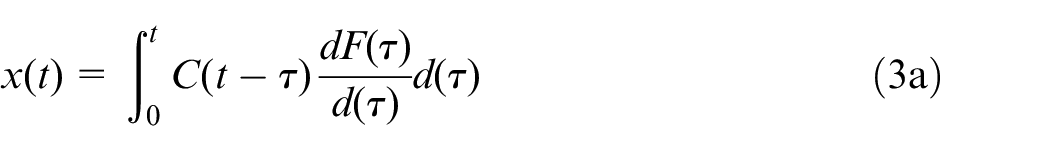
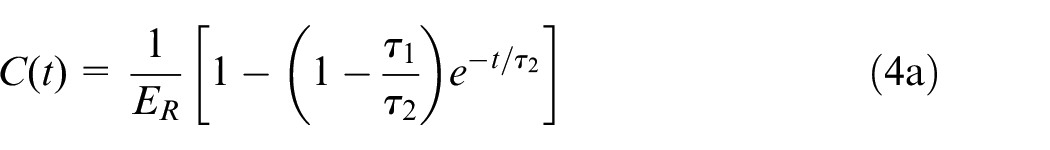
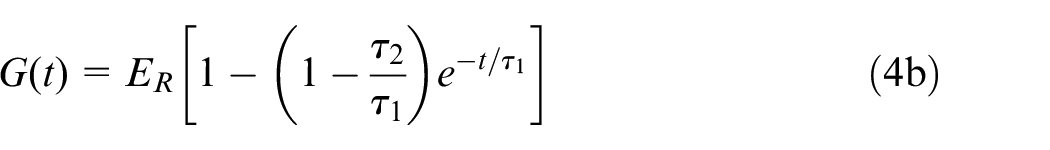
where C(t) and G(t) are creep compliance and relaxation modulus, respectively, and are given by 27
where

where x is the prepreg deformation at the contact point.
Crack initiation
Next, we use the Correspondence Principle 28 to extend the definition of J integral and crack-tip-opening displacement (CTOD) to model time-dependent crack initiation in viscoelastic materials. CTOD and J integral can be defined and estimated using the strip yield model first introduced by Dugdale. 29 Figure 6 shows the strip yield zone with length ρ, corresponding CTOD δ, and the closure yield stress σy. In the compression phase, when the puncture force reaches the maximum, a crack is formed.
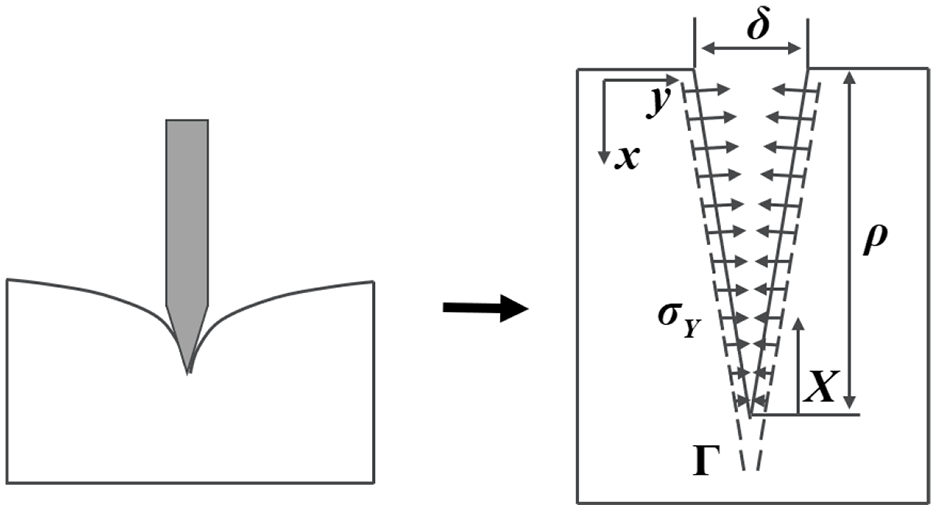
A schematic of the Strip-Yield zone model.
Now we use J integral and CTOD to determine the relationship between the fracture toughness and the fracture force, displacement of viscoelastic materials. Considering an arbitrary counterclockwise path (Γ) around the crack tip, the J integral is given by
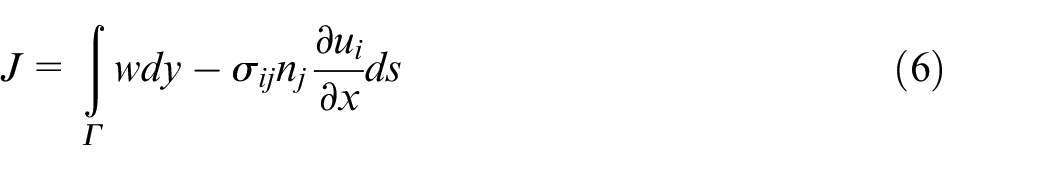
where w is the strain energy, σij are components of the stress tensor, nj are the components of the unit vector normal to Γ, ds is a length increment along Γ, and ui are displacement vector components.
Based on the Correspondence Principle, if the stresses and strains in the elastic body are
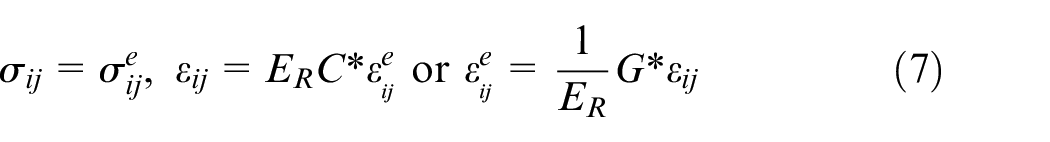
where ∗ is the mathematical shorthand for the convolution operation, ER is the long-time modulus of stiffness, and C and G are given by (4). We can write the generalized time-dependent J integral using the Correspondence Principle
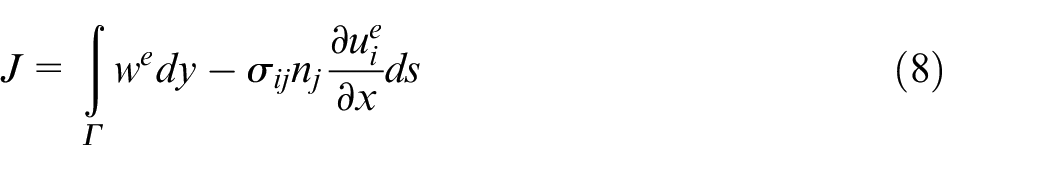
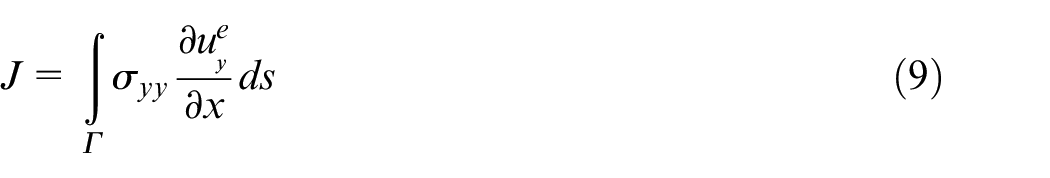
where e denotes pseudo values related to the elastic reference problem. Now, we compute the J integral for contour Γ. Considering δ is relatively small, the first term in the integral in (8) vanishes because dy = 0. Also, the only surface tractions are in the y direction (ny = 1 and nx = nz = 0), thus
Let us define a new coordinate XY at the crack tip with
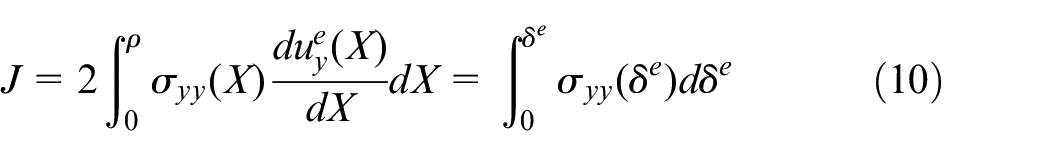
For simplicity, it is assumed that σyy exerted on crack tip is uniformly distributed, 26 we obtain

Based on the Correspondence Principle,
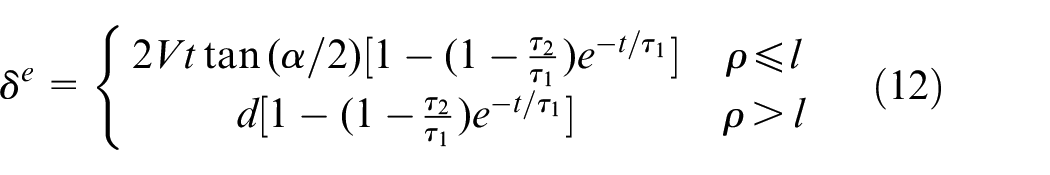
where d is the Z-pin outer diameter, t is the total time for insertion of the Z-pin tip into the prepreg, V is the Z-pin insertion velocity, α is the Z-pin tip angle and l is the Z-pin tip length. We can calculate J as
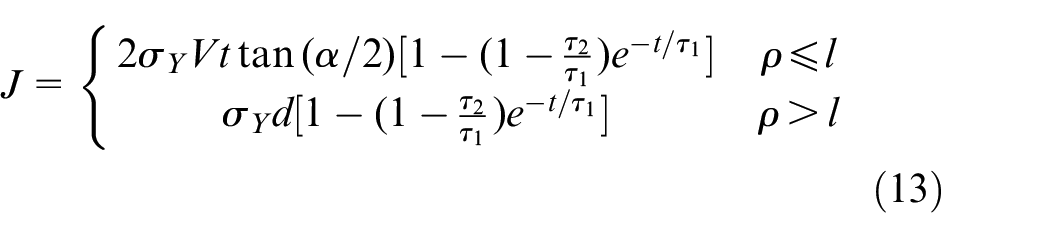
Fracture occurs when:
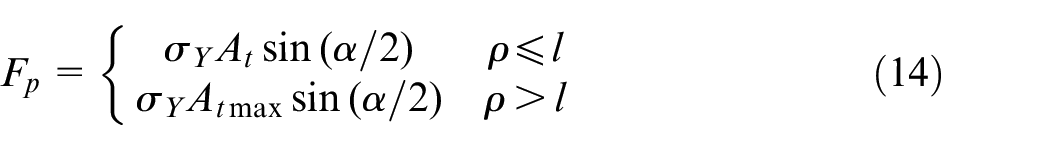
where At is the contact area between Z-pin tip and prepreg, and Atmax is the area of Z-pin tip, which can be expressed as

Finally, we can estimate the fracture toughness using (13) and (14)
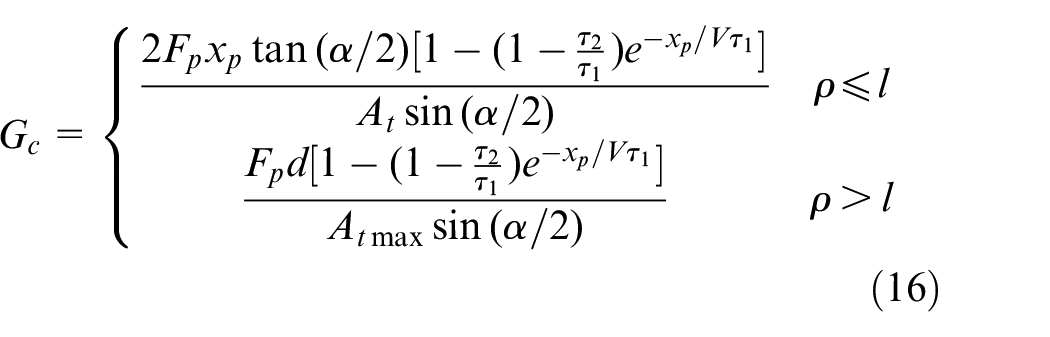
where xp is the displacement during crack initiation. The parameters related to Z-pin geometry are priori, however, the dynamic parameters τ1 and τ2 are unknown and need to be calibrated according to the Z-pin insertion experiment. Combined with the force and displacement during crack initiation in the experiment, Gc can be finally determined.
Experimental validation
In this section, a series of insertion experiments were carried out on the prepreg to (1) determine the parameters utilized in (16), (2) provide the force and displacement at the time of crack initiation for the calculation of fracture toughness, and (3) validate the dependency of the puncturing force on the velocity during the insertion process.
Z-pin insertion experiment
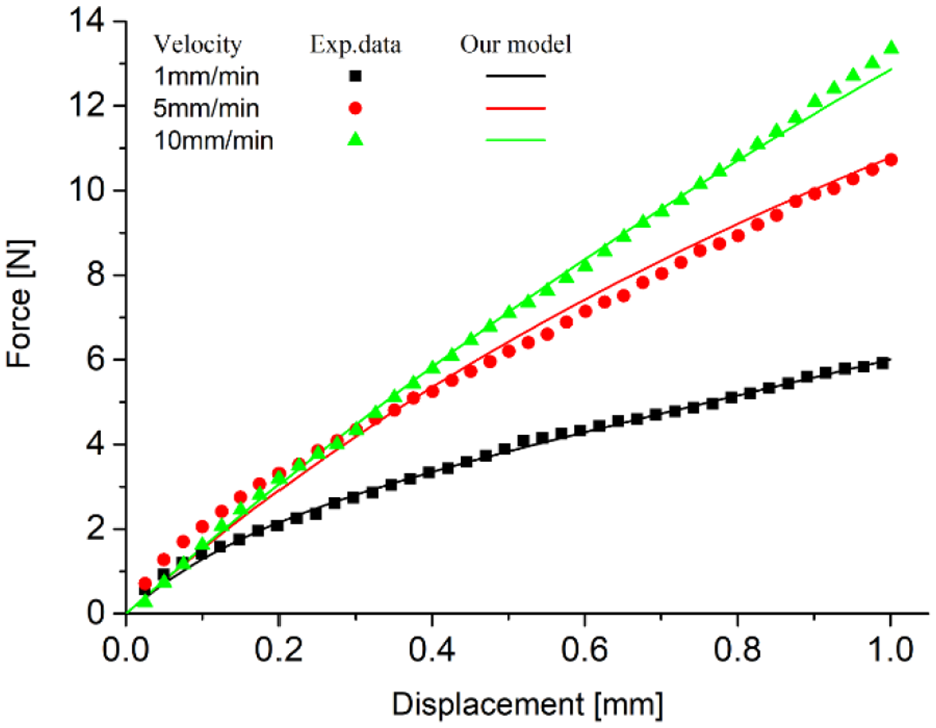
The stainless-steel Z-pin was chosen to perform insertion experiment, with diameter of 0.55 mm and tip length of 1.6 mm. The specimen was made of 44 plies of unidirectional USN12500/7901 prepreg, for a total thickness of 5.5 mm. It was 100 mm long by 60 mm wide, and was inserted with Z-pins arranged in a square grid pattern, as shown in Figure 7(b). Sufficient distance was reserved between the puncture positions to ensure no mutual influence. In order to perform Z-pin insertion into prepreg, the setup shown in Figure 7 was used. The Z-pin was fixed on UTM2102 universal testing machine (SUNS, Shenzhen, China), which has a maximum load capacity of 100 N, by clamping device in Figure 7(a). The test was carried out at a constant velocity, and the load displacement track was recorded. Limited by the fact that composite laminates are usually thin and the measurement accuracy of testing machines, the insertion velocity used in the experiment was lower than industrial insertion velocity to obtain more reliable results. Experiments used three different velocities (1, 5, and 10 mm/min), which were representative in the low velocity range, with each parameter set run at 5 trials for a total of 15 trials. The velocity dependence of the force-displacement response was determined through the Z-pin insertion experiments at different velocities. The experimental results show that there are obvious differences between different velocities. The influence of velocity on the insertion force can still be discussed based on the lower velocity insertion.
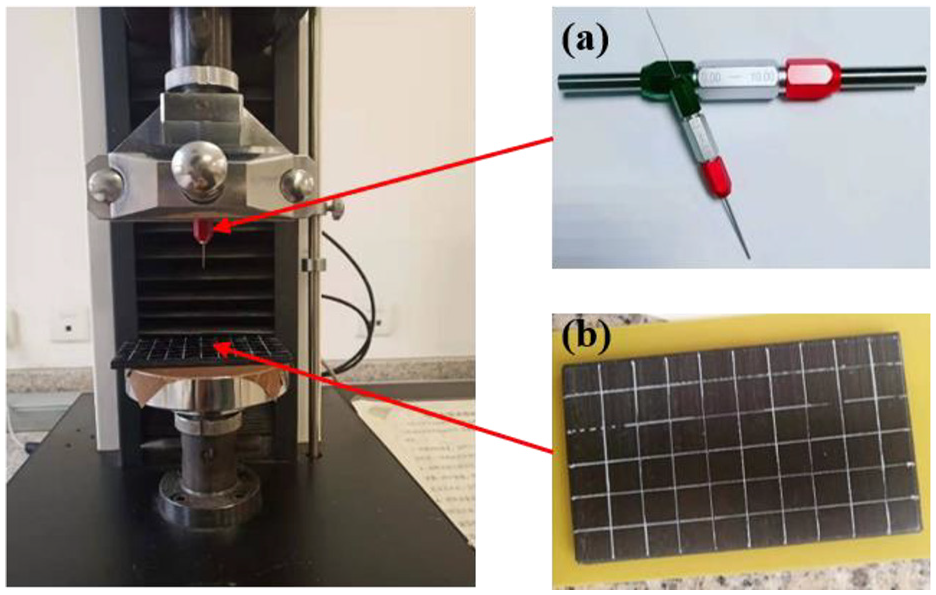
The principal experimental components: (a) clamping device and (b) square grid pattern.
Figure 8 shows the Z-pin force versus displacement curves for different insertion velocities. It can be seen that when the Z-pin is inserted slowly, the prepreg is in the elastic loading stage before penetration. Once the critical penetration force is reached, there will be a small force drop (at about 1 N). After steady penetration, the force continues to increase with the displacement. The scatter between the tests characterized by the same velocity can be attributed to the inhomogeneity of prepreg at different locations. In comparison, the insertion force increases about 100% by increasing the insertion velocity from 1 to 10 mm/min. With increasing Z-pin insertion velocity, the force needed to puncture the prepreg is increased. This increased penetration force shows that the prepreg has a positively sloped curve of the penetration force versus the velocity. The velocity has little effect on the value of the displacement necessary to initiate penetration.
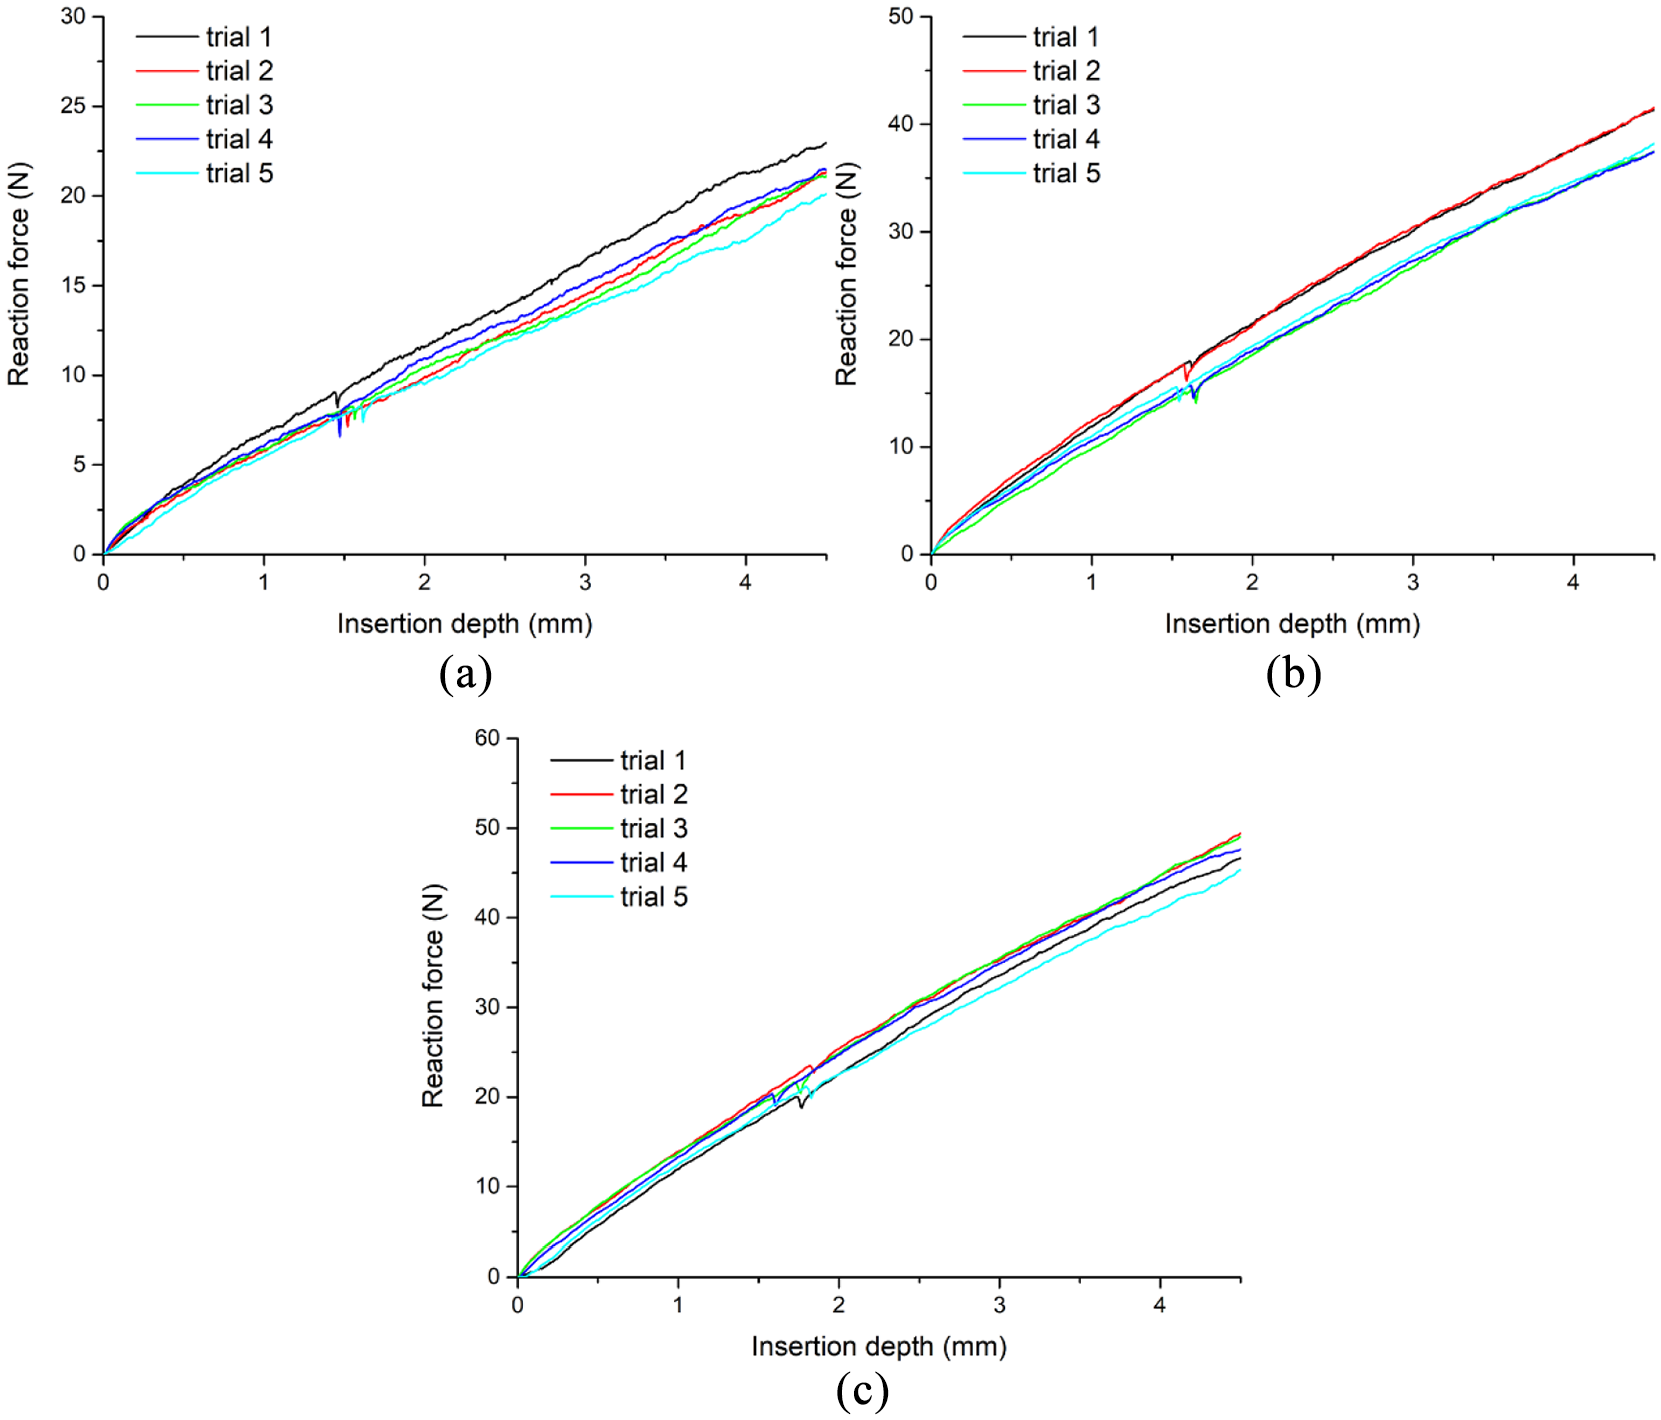
Comparison of the experimental force-displacement curves at different velocities: (a) 1 mm/min, (b) 5 mm/min, and(c) 10 mm/min.
Model implementation and calibration
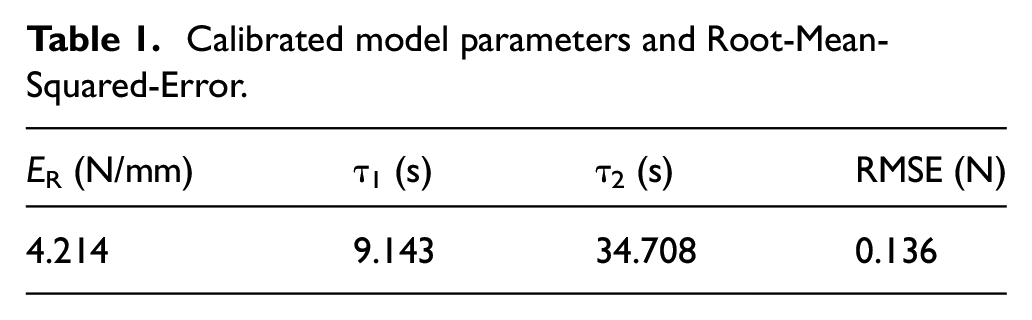
The unknown parameters in (16) can be determined by fitting the average experimental force versus displacement curves in the compression phase at different velocities to the viscoelastic model in (5). The nonlinear multi-variables optimization method, namely the global generic algorithm (GA), is used here for its fine global search capability. The cost function to be minimized in the GA optimization is defined as follows
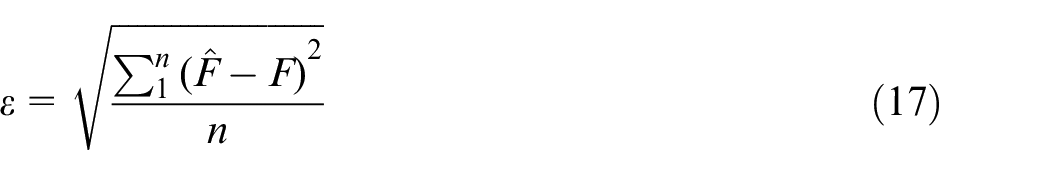
where ε is Root-mean-square error (RMSE), which is used as a measure of the differences between values predicted by the identified model,
Calibrated model parameters and Root-Mean-Squared-Error.
Comparison of model descriptions and experimental data of the force-displacement curves in the compression phase for Z-pin insertion at different insertion velocities.
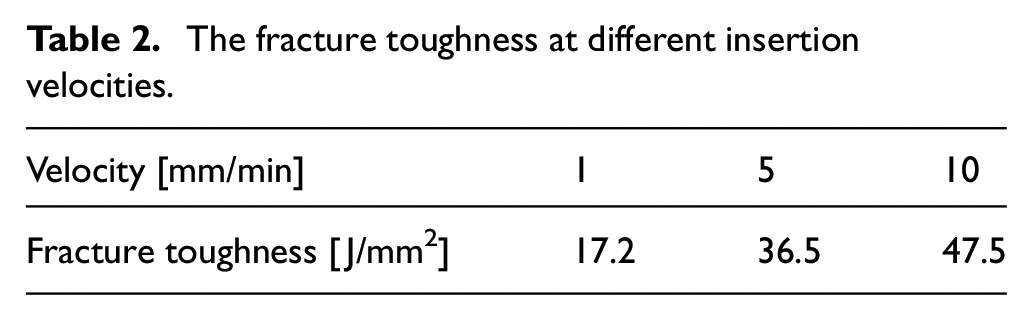
The fracture toughness at different insertion velocities.
Finite element simulation methodology
Cohesive constitutive law
The cohesive zone model (CZM) used to simulate crack growth is based on the mixed-mode bilinear constitutive formulation.30,31 It is defined by the traction-separation law (TSL) which characterizes the relationship between the traction force σ and crack opening displacement δ across the element, as seen in Figure 10. The bilinear cohesive law assumes the initial linear elastic behavior followed by damage initiation and stiffness degradation.
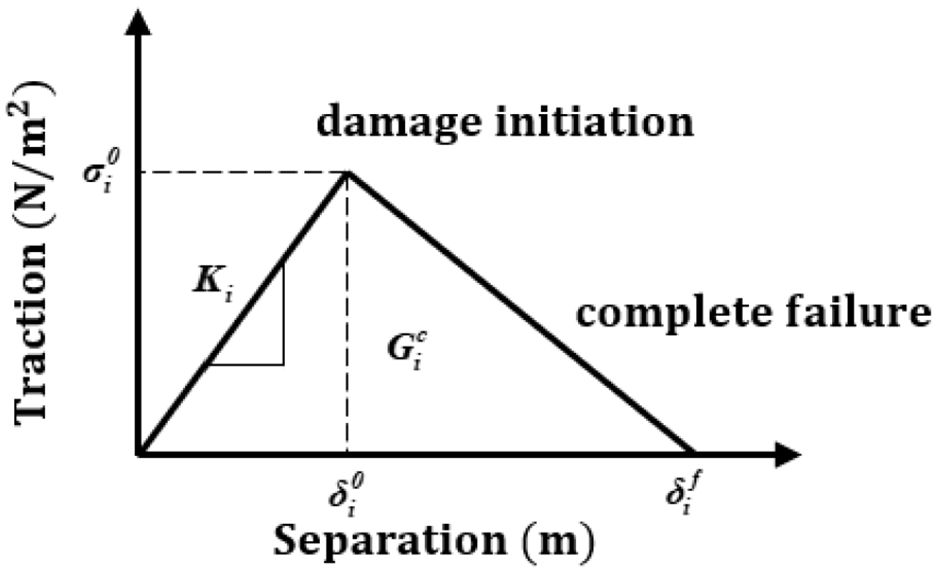
Bilinear cohesive constitutive law.
Initially, the stress increases linearly with the crack opening displacement. The traction force
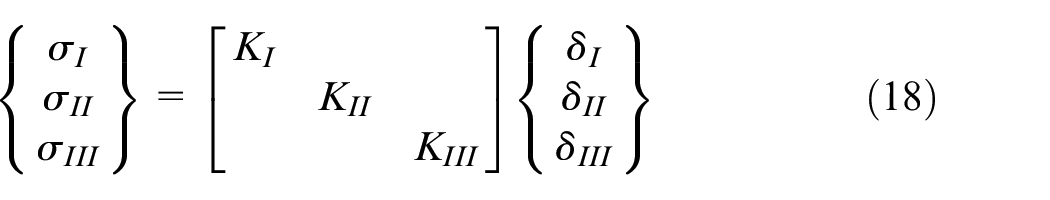
where KI, KII, and KIII respectively define the elastic loading stiffness of TSL in mode I, mode II, and mode III.
Once the cohesive element satisfies the damage initiation criteria, progressive degradation of stiffness will occur. In this paper, a quadratic nominal stress criterion is used
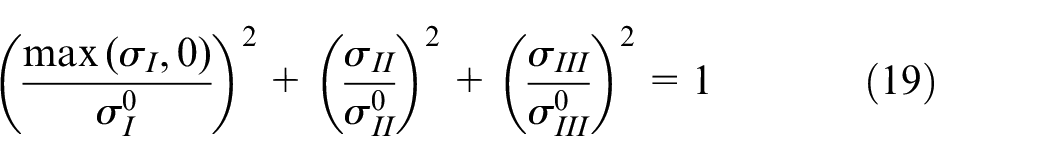
where

When the stiffness is reduced to zero, complete failure of the cohesive element occurs. The well-known Power Law is implemented to predict crack propagation
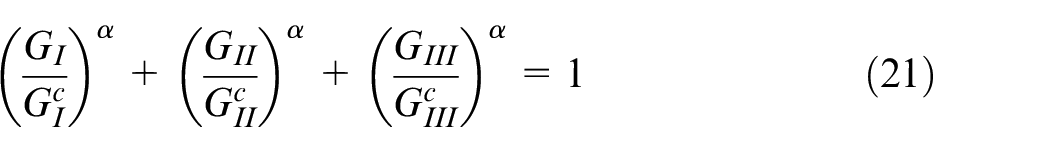
where α is an empirical parameter, and here we set it to 2.
By inserting the cohesive elements into the FE model, it is possible to simulate the continuous crack propagation of the prepreg, where the fracture toughness comes from the analytical fracture model. Only Mode I is involved here based on the assumption that the Z-pin tip edge applies the tensile tractions to open the crack during the insertion process, as shown in Figure 11. According to the CZM criterions, in order to ensure that the transverse shear loading will not affect the fracture of the prepreg, two relatively large values are determined for the mode II and mode III toughness and strength. Calculated insertion force versus displacement relation under different velocities is correlated with the experiment data in order to calibrate two constants used in the cohesive constitutive law:
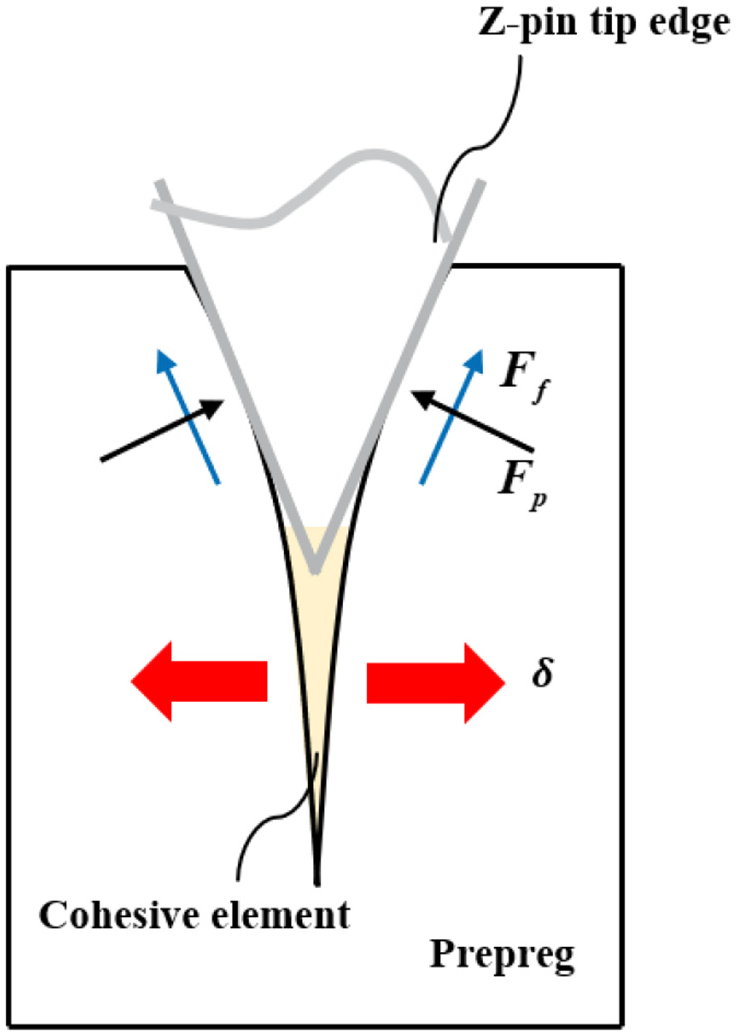
Fracture mechanism of cohesive element in our finite element model.
The crack path here is pre-assumed to follow the Z-pin insertion path due to the symmetry of the Z-pin and boundary conditions. It is therefore sufficient to add a layer of cohesive elements to the Z-pin insertion path.
Modeling process
A plane-strain model is presented in this paper, as shown in Figure 12. The geometrical characteristics are determined according to the cross-section shape of a single Z-pin inserting into the prepreg along the predetermined crack path. The Z-pin, which is set as a rigid body due to its relatively higher stiffness, has a diameter of 0.55 mm and a tip length of 1.6 mm to correspond with the dimensions of the Z-pin used in the experimental test. The prepreg is 30 mm wide and 5.5 mm deep. Cohesive elements are distributed over the middle of prepreg with the wide of 0.05 mm. A steel plate, 40 mm long and 2 mm deep, is placed under the prepreg. It only supports the structure but has no failure criteria and interaction with Z-pin. An initial crack of 0.1 mm length is made to enable initial separation across the crack surface. The out-of-plane depth dc is taken to be the same order of magnitude as the diameter of the Z-pin (i.e. dc = 0.55 mm).
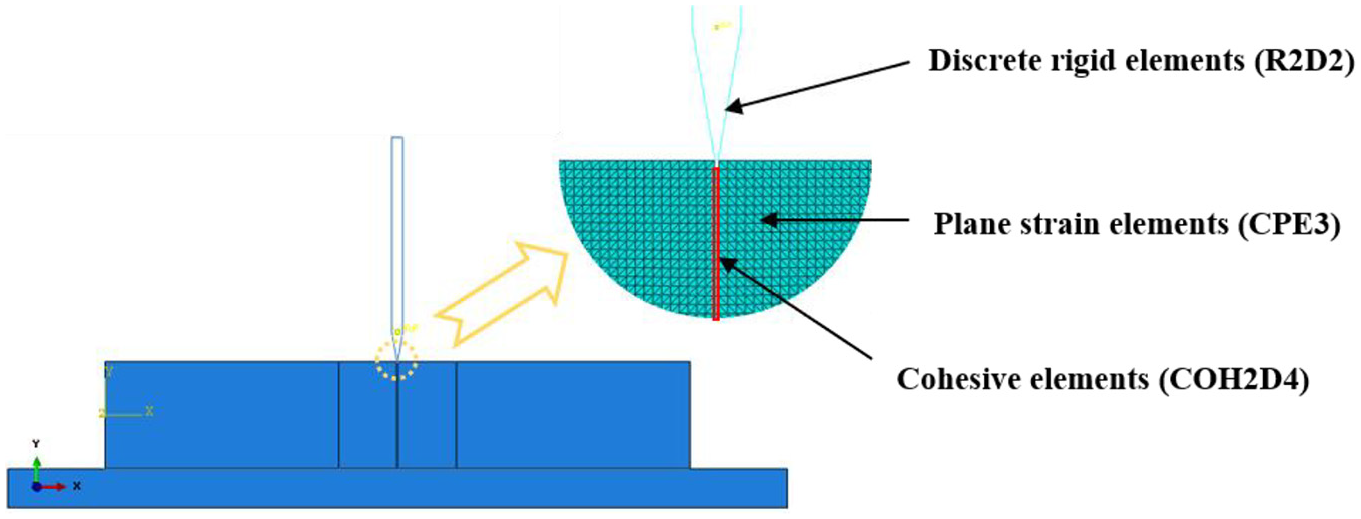
A 2D plane-strain numerical model.
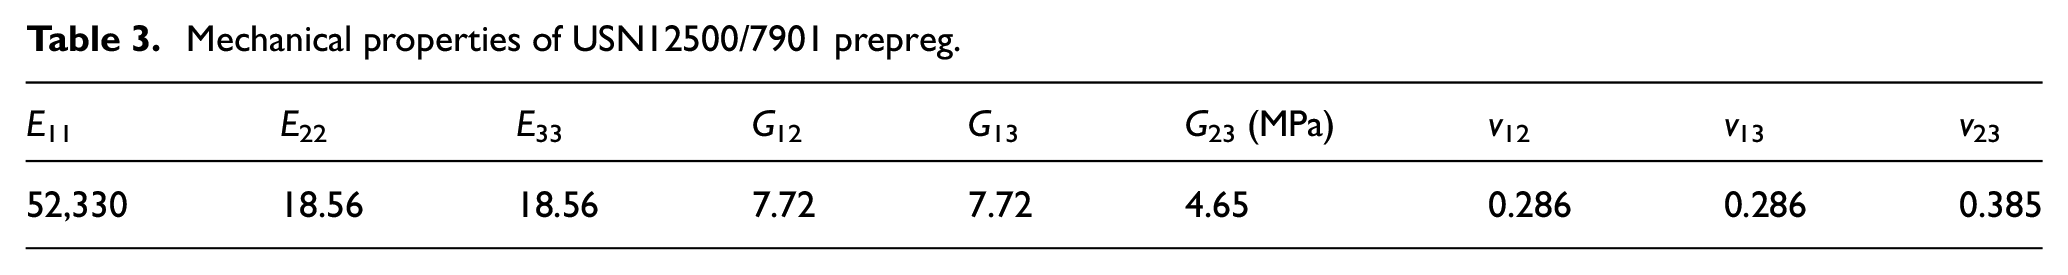
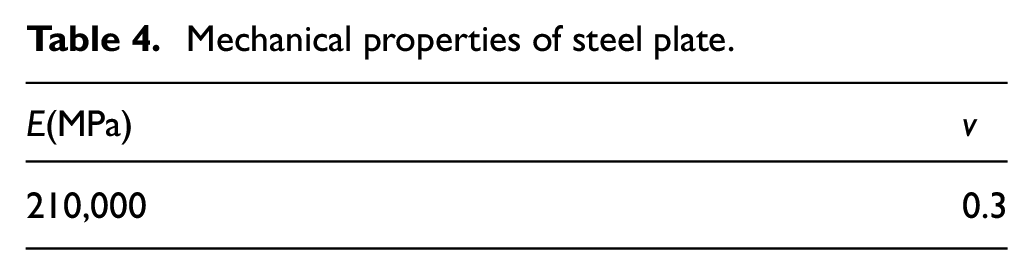
Material properties used in the analysis are given in Table 3 (USN12500/7901 prepreg) and Table 4 (steel plate). 32
Mechanical properties of USN12500/7901 prepreg.
Mechanical properties of steel plate.
The prepreg is meshed with three-node plane strain elements (CPE3). Finer mesh is created around the insertion axis as it is subject to high stress concentration. A relatively coarse mesh is used to discretize the steel plate with CPE4R elements, because it has less influence on the final result. The Z-pin is modeled using discrete rigid elements. Finer mesh can be used to better define the Z-pin tip. The rupturing of the prepreg is simulated by the cohesive zone model. The crack path in this model has been sketched with red line in Figure 12. Four-node two dimensional cohesive elements (COH2D4) are used in this model. In total, there are 13,313 elements generated for a geometric non-linear model in ABAQUS 6.14.
The model uses a surface to surface algorithm to calculate the normal contact stress and the Coulomb friction. The Z-pin has frictional contact with the prepreg, with friction defined using a Coulomb friction law. Frictionless contact interfaces are defined between the faces of the prepreg and the steel plate. Contact algorithm is not set on the surface of Z-pin and the cohesive element. The cohesive element edges are free to be penetrated resulting in the Z-pin tip advancing into the cohesive part of the model before failure and subsequent cohesive element removal. We set a series of μ values to compare the experimental force-displacement curves with the simulation force-displacement curves, and finally find that the simulation results and the experimental curves can be agreed well when μ = 0.15.
The boundary conditions are adopted as closely as possible to the experimental environment. The steel plate is simulated as a fixed boundary condition during insertion. The sides of the prepreg are also fixed since this represents regions that are far away from the crack path, so they do not affect the deformation of the area near the Z-pin.
The simulation is performed with an explicit solver. For the unidirectional fiber composites, at the low strain rate level (
Numerical result
The simulation results for prepreg compression phase and crack propagation phase are shown in Figure 13. For prepreg compression phase, the Z-pin tip penetrates through the cohesive elements and the material deforms greatly before initial crack formation. Then, the prepreg rupture process is simulated as the failure and subsequent cohesive element removal shown in Figure 13(b). Moreover, the finite element model facilitates diagnostic information that cannot be established experimentally, like stress concentrations along the Z-pin tip in the prepreg.
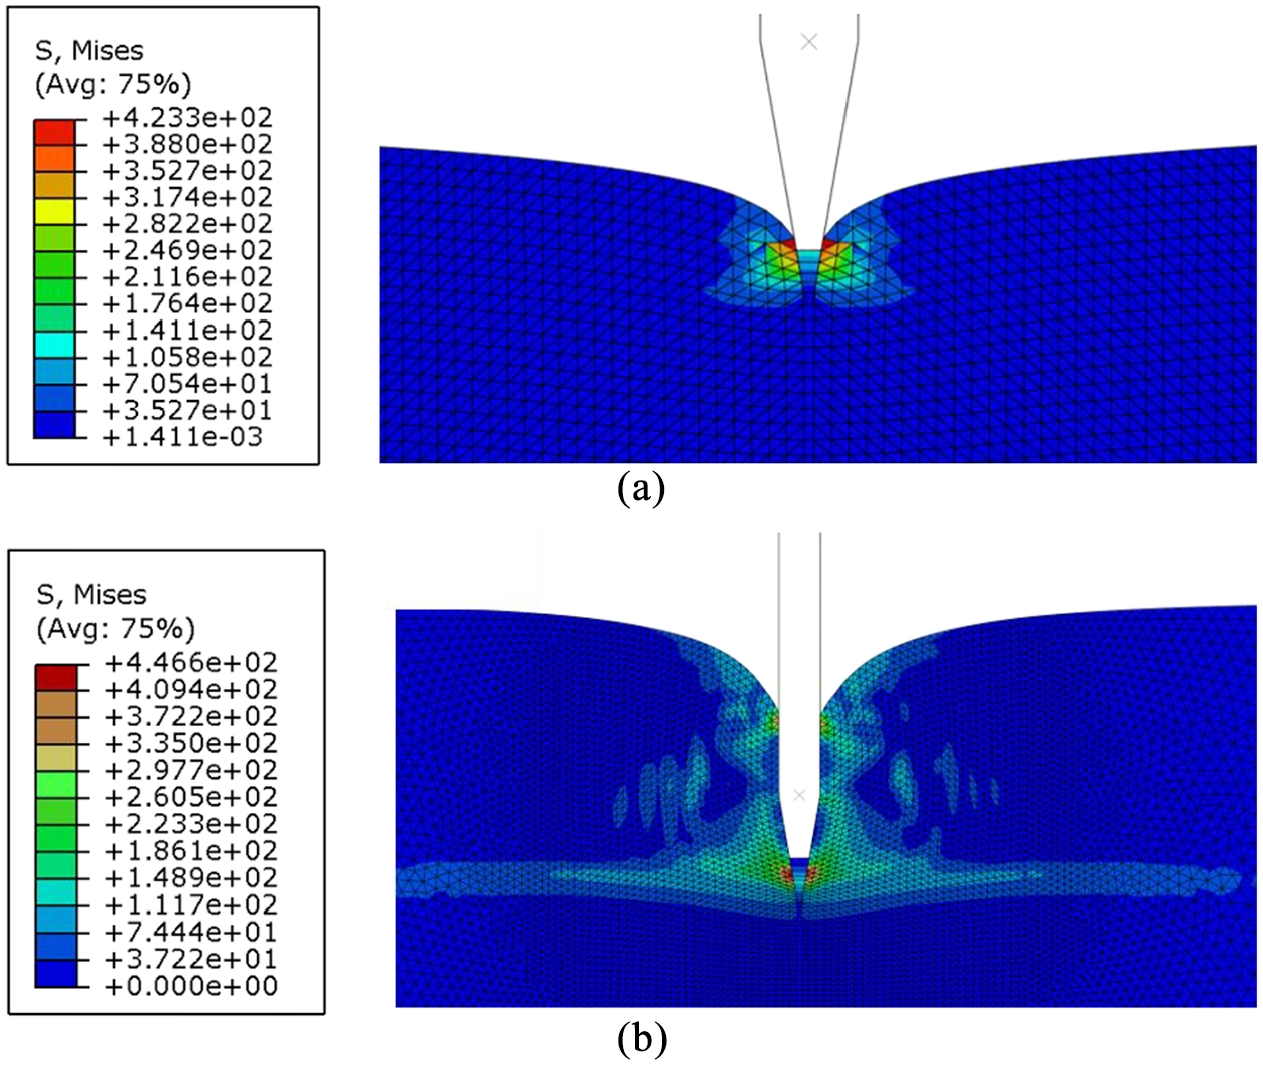
Deformation and Mises stress distribution in the finite element model in two phases: (a) prepreg compression and (b) crack propagation.
A comparison of the numerically calculated force versus applied displacement from the Z-pin insertion model with the experimental results is presented in Figure 14. First, an initial linear elastic response is observed in experiment results, whereas the slope of force versus displacement curve increases gradually as the increase of displacement before penetration in finite element model. This difference may be explained by the different contact mode between Z-pin tip and prepreg in the compression phase. In the simulation model, the Z-pin tip penetrates the cohesive element, and the contact area between Z-pin tip and prepreg is increasing, which leads to the rise of the slope. In fact, there is a great depression in the contact area due to the crimping of the prepreg plies, and the edge of the Z-pin tip may not fully contact with the prepreg, which makes the force model in the compression phase more inclined to a single force act on the prepreg. The maximum prediction error can reach 29.1% due to the different initial slopes.
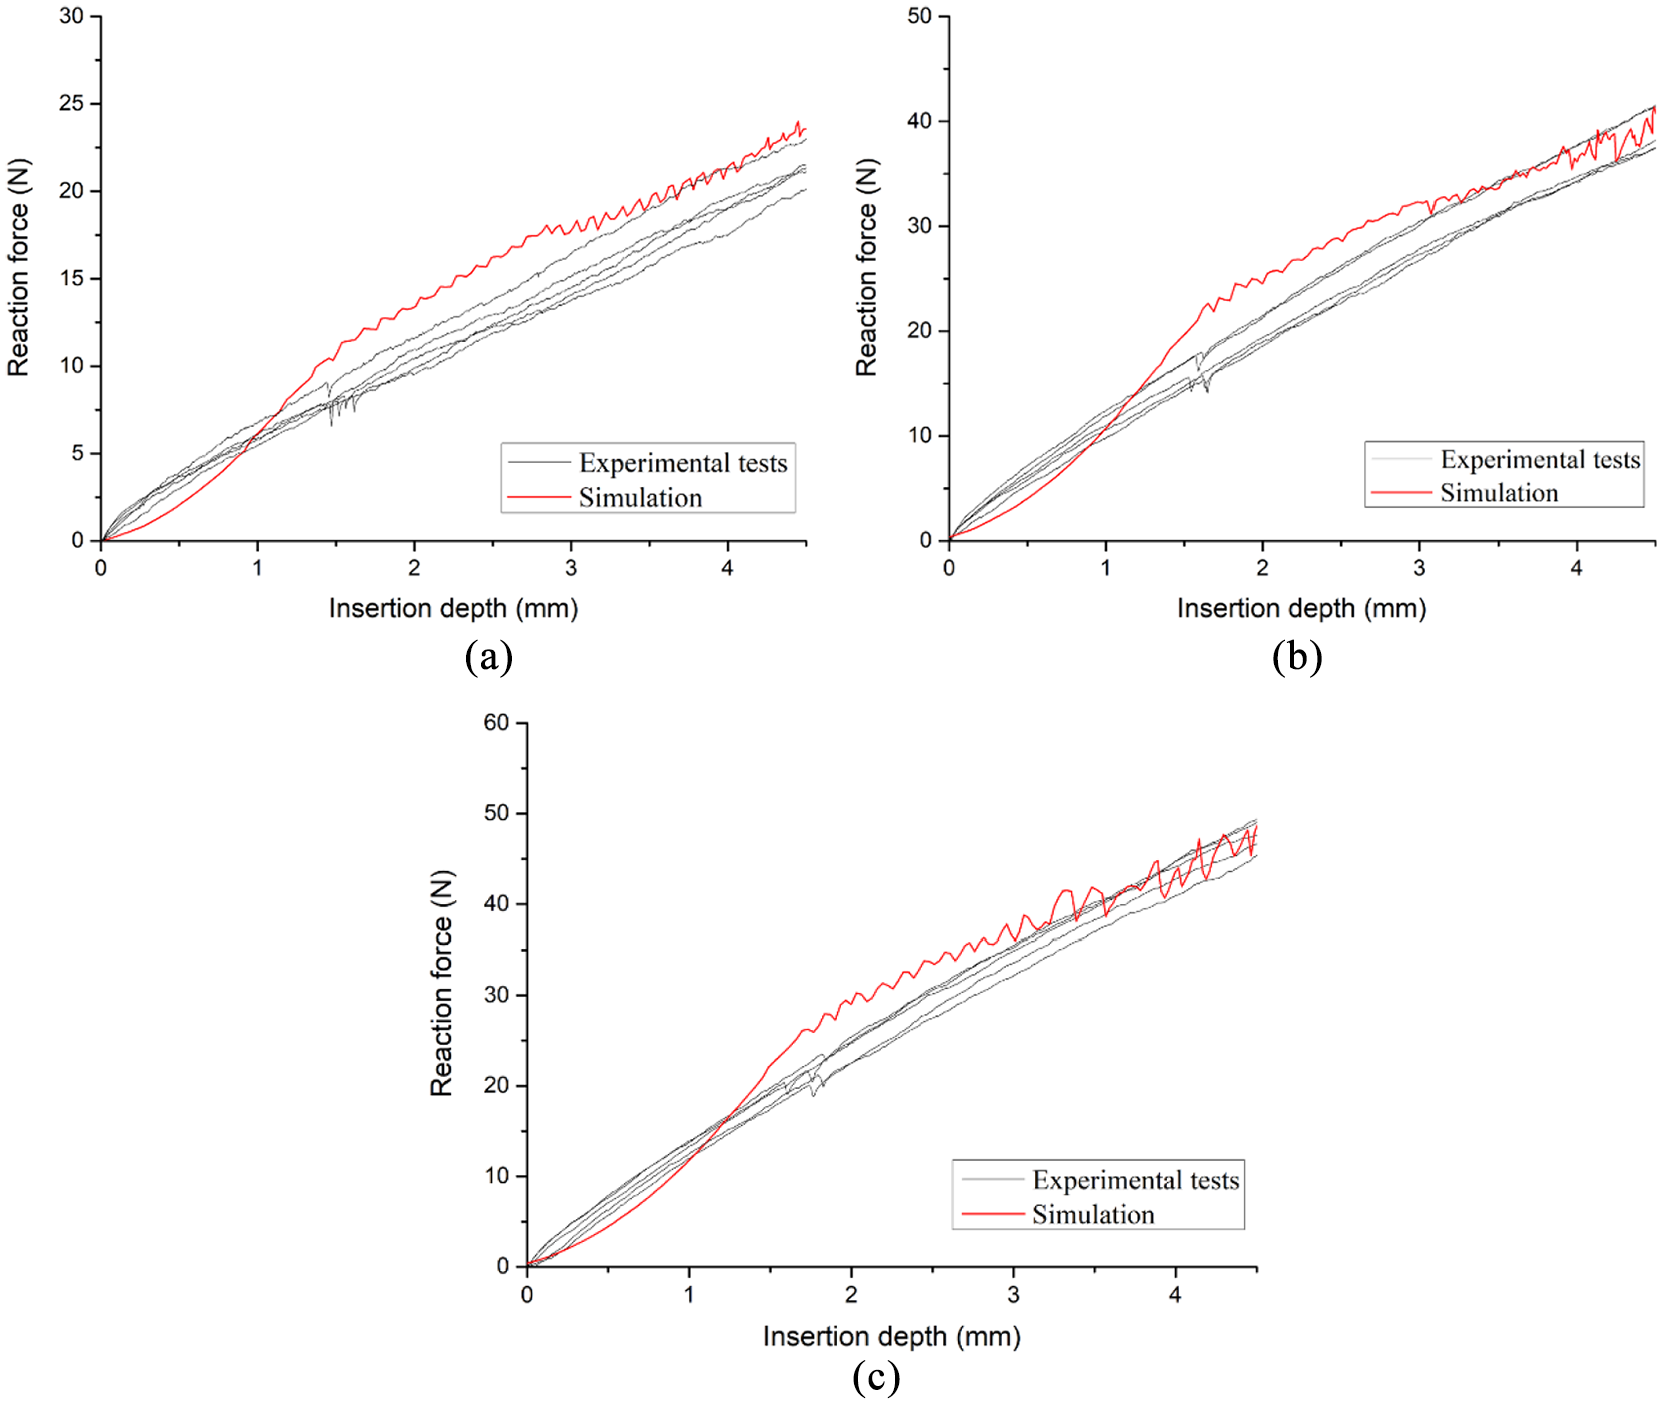
Comparison of the experimental and simulated force-displacement curves at different velocities: (a) 1 mm/min, (b) 5 mm/min, and (c) 10 mm/min.
Second, for the crack extension prediction, the model and experimental results are in reasonably good agreement. The tensile stress in cohesive elements increases rapidly as the displacement increases, resulting in the drop of load when the in-plane tensile stress reaches the failure criteria, which indicates that the crack begins to expand. The next cohesive element bears tensile load, and the load increases further. With the continuous failure of cohesive elements, the Z-pin insertion force increases steadily with the displacement in a stepped way, which is mainly due to the elastic load and stiffness degradation of cohesive element. Following crack initiation, the modeled force becomes much closer to the experimental response. The increase rate and magnitude which the force model predicts are in good agreement with the experimental results during the crack propagation phase. The error is larger at the beginning, and then decreases, which is basically within 20%.
With respect to force versus displacement curves at different insertion velocities, the model can capture all of the phases of Figure 2 with reasonable accuracy, although the increasing trend of the simulated force in the compression phase is not consistent with the experimental results. Despite these discrepancies, the current results are sufficient to demonstrate the method introducing the velocity dependent fracture toughness into the cohesive elements to achieve Z-pin insertion force prediction has been successful.
Conclusion
In this paper, a dynamic insertion model is proposed to simulate the crack initiation and propagation of the prepreg during the insertion process by using the velocity-dependent cohesive elements. This is achieved by successfully integrating a dynamic analytical fracture mechanics model into the cohesive zone methods.
The fracture mechanics model, which is valid for viscoelastic materials, describes the compression phase and crack initiation phase with the Strip-Yield zone. It uses the concept of the J integral and CTOD for viscoelastic fracture based on the Correspondence Principle. Three independent parameters are calibrated by the global generic algorithm (GA) to accurately capture the trend of the facture toughness of the prepreg against the insertion velocity. We can see that the fracture toughness is positively correlated with velocity.
Combined with the fracture mechanics model, special cohesive elements which are capable of describing the velocity dependence of fracture toughness are developed. The velocity-dependent cohesive elements are embedded into the plane strain model for predicting the force-displacement response of Z-pin insertion. The validity of the finite element model is verified by Z-pin insertion experiment of unidirectional prepreg at different velocities. The experiment results show the effects of insertion velocity on interaction forces. It is observed that the contact force increases with increasing velocity, while the displacement of initiate penetration changes only slightly for different velocities. Good agreement with experimental data is obtained, thus demonstrating the comprehensive numerical framework capability of predicting contact force between the Z-pin and the prepreg and its relation to velocity. The force model developed and knowledge of velocity effects can be used in the planning and execution of robot-assisted Z-pin insertion, and design of Z-pin insertion device, showing a good engineering applicability.
Future work will focus on the influence of Z-pin diameter and ply orientation to the insertion force. In addition, prepreg materials are prone to insert when heated, which is temperature sensitive. By establishing a complete model, we can further study more influencing factors and reveal the insertion mechanism.
Footnotes
Declaration of conflicting interests
The author(s) declared no potential conflicts of interest with respect to the research, authorship, and/or publication of this article.
Funding
The author(s) disclosed receipt of the following financial support for the research, authorship and/or publication of this article: This research was supported by Zhejiang Provincial Natural Science Foundation of China under Grant No. LQ20E050019 and the National Natural Science Foundation of China under Grant No. 51975520.