
Abstract
Ni-based alloys are widely used in aerospace because of their high strength and high temperature oxidation resistance. CBN tool is suitable for precision machining of Ni-based alloy. Diffusion wear is an important wear form of CBN tool in the process of cutting Ni-based alloy. Therefore, it is of great significance to study the diffusion phenomenon in the process of cutting Ni-based alloy with CBN tool. In this paper, the cutting model of Ni-based alloy containing γ′ phase (Ni3Al) with CBN tool is established based on the molecular dynamics (MD) simulation method. The self diffusion activation energy of all kinds of atoms in the workpiece and the formation energy of several point defects in the tool are calculated, so as to study in depth the atom diffusion mechanism according to the simulation results. The results show that the atoms in the crystal boundary of the workpiece are the most easily diffused, followed by the atoms in the phase boundary, and the atoms in the lattice are the most difficult to diffuse. When the workpiece atoms diffuse into the tool, it is easier to diffuse into the tool grain boundary than to form interstitial impurity atoms or displacement impurity atoms. It is more difficult to form the substitutional impurity atom than to form the interstitial impurity atom.
Introduction
Ni-base alloys are widely used in aerospace because of their excellent strength, toughness, and corrosion resistance at high temperature. However, it is also a kind of hard-to-processed material. 1 Its internal structure is complex and contains a large number of strengthening phases. In the cutting process, the cutting force is large, the cutting temperature is high, and it is easy to produce problems such as work hardening and tool wear.2,3 CBN tool has high hardness and chemical inertness, 4 which is suitable for precision machining of Ni-based alloy. However, CBN tools are difficult to manufacture, the preparation process is complex, the cost is high, and the price is expensive. 5 In the cutting process, the element of workpiece diffuses into the tool, which changes the composition and structure of CBN tool material and accelerates the tool wear. Diffusion wear is one of the important wear forms of CBN tool. Therefore, it is of great significance to study the diffusion mechanism in the process of cutting Ni-based alloy with CBN tool.
Through experiments, a lot of researches have been done about the diffusion wear of cutting tools in the machining process. Costes et al. 6 used CBN tool to cut Inconel 718 and found that diffusion is one of the main wear mechanisms of CBN tools in cutting process. The atom diffuses in the contact area between workpiece and tool. Thamizhmanii et al. 7 studied the relationship between the tool surface roughness and the tool wear resistance through the cutting experiments of high speed (100 m/min) and low speed (20 m/min) cutting Inconel 718 with CBN tools. The results showed that the smooth tool surface can prolong the tool life in high speed cutting Inconel 718. In high-speed cutting, the diffusion caused by high cutting temperature is the main factor to produce crater wear. Wang et al. 8 study the wear mechanism of tools made of cubic boron nitride without binder (BCBN) in the process of milling Ti-6Al-4V titanium alloy. The results showed that diffusion-solution is one of the main wear mechanisms of the tool. In order to study the diffusion wear and oxidation wear of PCBN tools, Shao et al. 9 used PCBN tools to cut workpieces of different materials (titanium alloy, nickel, aluminum alloy, 35 steel, stainless steel, cast iron) at different temperatures. The results showed that diffusion wear occurs in different materials. The higher the temperature, the more serious the diffusion wear. Li et al. 10 studied the inter-diffusion of elements between the tool and the workpiece during the turning of aluminum bronze using high-speed steel and cemented carbide tools. The results showed that the diffusion of C and Co elements in the tool resulted in the decrease of the tool surface strength. Diffusion played an important role in tool wear mechanism.
Compared with the experimental method, the molecular dynamics (MD) simulation method which is used to study the diffusion mechanism in the cutting process, can clearly track the motion track of each atom and analyze the diffusion mechanism from the micro point of view. MD simulation is implemented by lammps (large scale atomic/molecular massively parallel simulator). 11 The dynamic simulation model, temperature, and other analysis data as well as various energy solutions can be obtained by programming and running the relevant programs in the model. The diffusion of atoms can be clearly observed by using the visualization software Ovito. 12 The main difficulty of MD simulation technology lies in the preparation of various related programs and the processing of output data.
Researchers, through using molecular dynamics method, have made a series of studies on diffusion in metal and diffusion wear of cutting tools. In order to study the diffusion of FCC surface, Shiang et al. 13 used molecular mechanics technology to establish several models to calculate different surfaces of iridium, and compared with the experiment results. The results showed that the estimated random walk experimental predictors and activation energies do exhibit Arrhenius behavior. The activation energies of the adatoms on the three low index (00l), (110), and (111) surfaces were carried out static calculations, and the results were in good agreement with the experimental results. Based on the above results, it is concluded that molecular dynamics with a good potential function model is a technology that can analyze the properties of diffusion process closely and accurately. Bai et al. 14 studied the diffusion behavior of Co/Ti interface at the atomic level with molecular dynamics method, in order to further understand the wear mechanism of the tool used to cut titanium alloy. The results showed that the diffusion degree at Co/Ti interface increases with the increase of cutting speed. The interface is amorphous in high speed cutting. At the same time, due to the large gap between Co atoms, Ti atoms are easier to penetrate the Co side. The crater wear on the rake face is caused by the diffusion between Co and Ti. In order to study the micro mechanism of tool wear, Xuesong 15 established a molecular dynamics model for cutting single crystal aluminum. The results showed that the tool wear increases with the increase of cutting depth. The temperature of the cutting area increases due to the chip accretion generated by the diffusion wear, which further intensifies the diffusion wear.
Molecular dynamics method was used to study the causes and influencing factors of tool diffusion wear in cutting process, and some progresses have been made. However, the specific process and reasons of the diffusion of workpiece atoms into the cutting tool in the cutting process are not discussed. In this paper, molecular dynamics method is used to study how the workpiece atoms diffuse into the tool-chip interface and where the workpiece atoms diffuse in the tool during the process of cutting Ni-based alloy with CBN tool. Combined with the calculation of energy, the causes are further analyzed.
In this present study, a simplified model of CBN tool cutting Ni-based alloy in which Ni-Fe-Cr alloy was used as matrix and contains Ni3Al phase is established using molecular dynamics (MD) method, and the atomic motion is observed. The diffusion activation energy is calculated by using a special MD program, and the diffusion difficulty of atoms in each region of the workpiece is compared to reveal the diffusion process of atoms from the workpiece to the tool-chip interface. By observing and analyzing the diffusion depth of workpiece atoms at CBN tool grain boundary and grain boundary in the cutting process, the difficulty degree of workpiece atoms diffusion at grain boundary and crystal lattice of CBN tool after entering the tool-chip interface was compared. The first principle software, in order to compare the difficulty of workpiece atoms entering CBN lattice gap and replacing CBN normal lattice atoms, is used to calculate the formation energy of doping atoms, self-gap atoms and vacancy atoms, etc.
Establishment of cutting model
Workpiece
The workpiece model is a multi-phase simplified model containing γ phase (Ni-Fe-Cr) and γ′ phase (Ni3Al). The γ phase in the model is a polycrystalline alloy with FCC lattice structure containing Ni, Fe, and Cr elements. The γ′ phase is a crystal solid block of Ni3Al with L12 lattice structure.
Figure 1 is the polycrystalline model of Ni-Fe-Cr alloy obtained by software Atomsk. 16 The crystal directions of each crystal are randomly selected, and its lattice constant is 0.352 nm. Figure 2 is the semi-sectional drawing of the workpiece model in the Z-direction, and the FCC and L12 lattice are identified by using the visualization software Ovito. It can be seen from Figure 2 that the workpiece is a polycrystalline model, and four Ni3Al blocks are added into the four grains. Ni3Al block is a single crystal cube with size of 3.12 nm × 3.12 nm × 3.12 nm. The crystal orientations of [100], [010], and [001] are in the positive direction of X, Y, Z axis respectively, and the lattice constant is 0.356 nm. The proportion of each element in the model is set according to the proportion of chemical composition in Inconel 718. The mass percentages of Ni, Fe, Cr, and Al in the workpiece model are 50.47%, 31.75%, 17.01%, and 0.77% respectively.
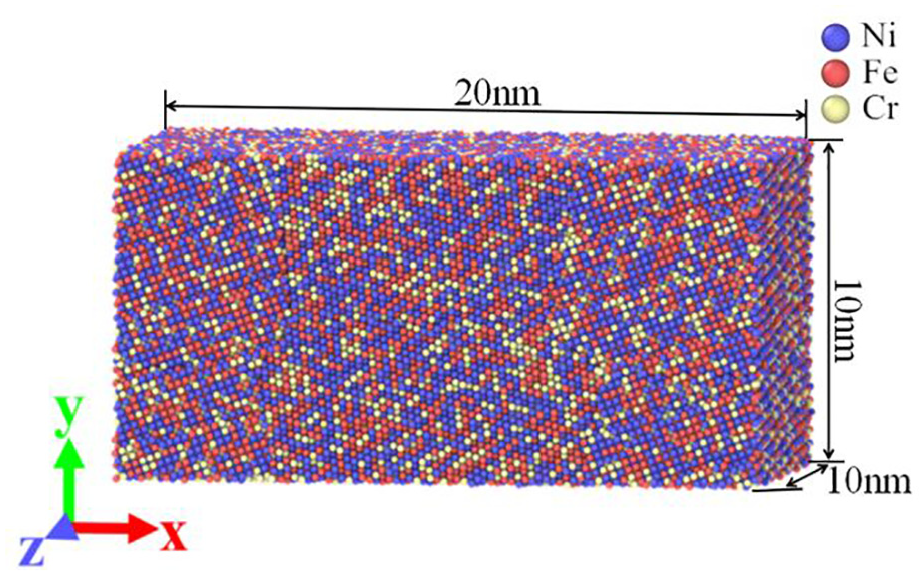
Polycrystalline model of Ni-Fe-Cr alloy.
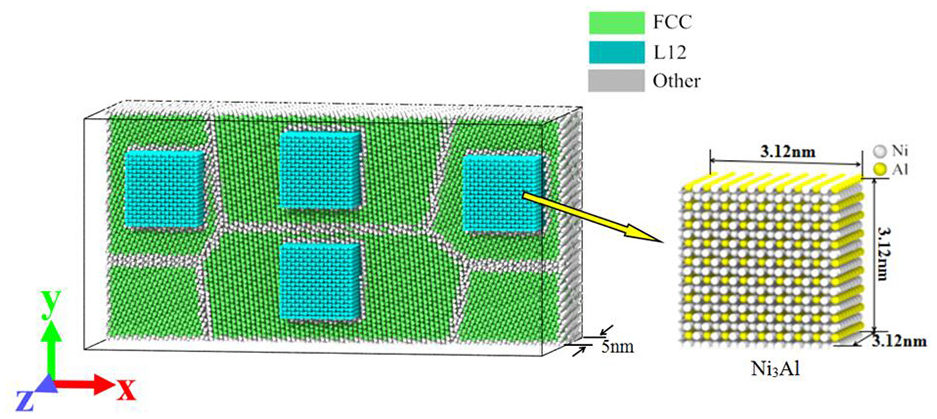
Semi-sectional drawing of the workpiece model in the z-direction.
Using the software Ovito to delete the atoms with FCC and L12 lattice structure, the remaining atoms are grain boundary, phase boundary, and surface atoms, and then using the “defect mesh” function to get the interface surrounding these atoms, as shown in Figure 3. According to Figure 3, a clearer presentation of the workpiece structure in this model can be seen.
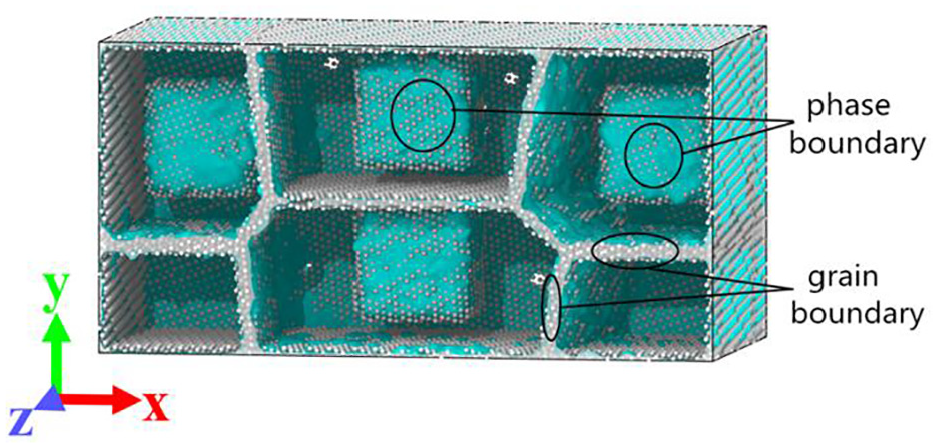
Grain boundary and phase boundary in workpiece.
Tool
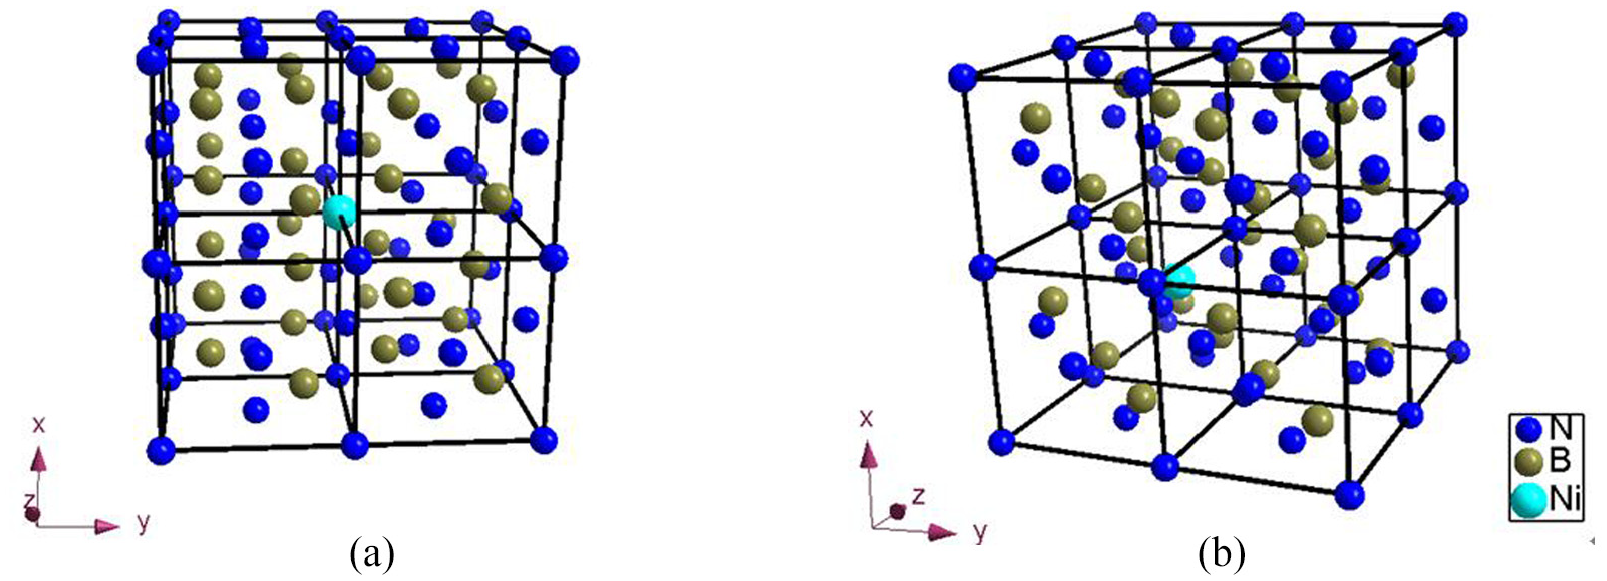
The tool material in the simulation is cubic boron nitride (CBN), as shown in Figure 4(a) and (b). The tool is composed of B atom and N atom. In CBN tool model, the crystal directions of each grain are random. The crystal lattice structure of the tool is sphalerite, and the crystal lattice constant is 0.362 nm. The rake angle of the tool is 6°20′23, the flank angle is 11°18′36″, the tooltip radius of the tool is 2 nm, and the length in Z-direction is 10 nm, as shown in Figure 4(b).
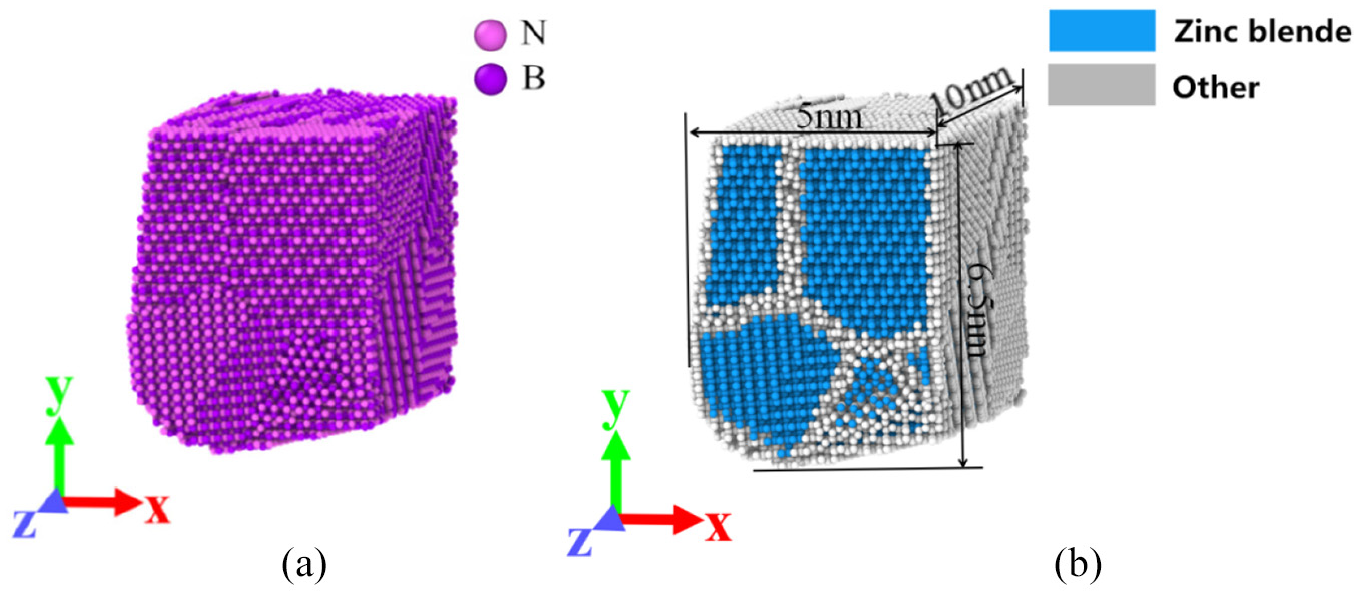
CBN tool model: (a) tool element and (b) polycrystalline tool.
Cutting conditions
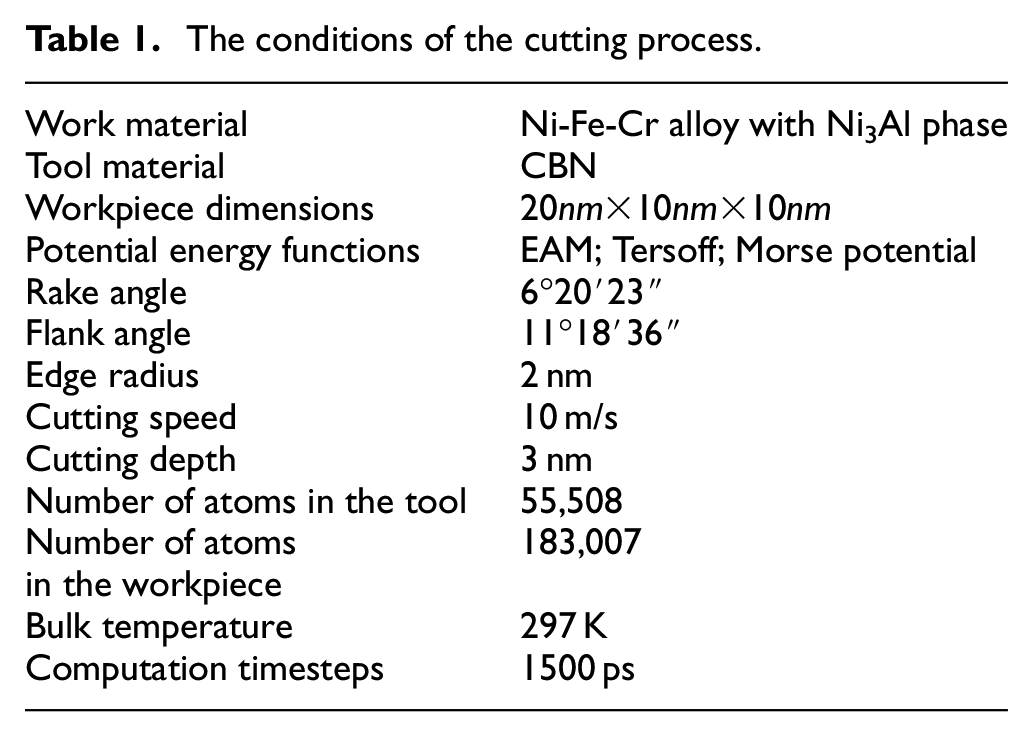
The length of the workpiece in X-direction is 20 nm, and the tool cuts the workpiece in the negative direction of X axis at the speed of 10 m/s. The timestep is 0.001 ps, the cutting distance is 15 nm, and the cutting depth is 3 nm. Table 1 shows the conditions in the cutting process.
The conditions of the cutting process.
The workpiece is divided into boundary layer, temperature layer and Newton layer, and their thickness is 0.5 nm, as shown in Figure 5. The boundary layer is the substrate layer of the workpiece. The temperature layer is used to simulate the heat taken away by chips and coolant, so that the temperature in the system is close to the reality. The atoms of Newton layer follow the Newtonian dynamics and are controlled by the motion equation generated by Hamiltonian operator. In the system, there is periodic boundary condition in Z-direction. There are non-periodic and shrink-wrapped boundary conditions in X-direction and Y-direction respectively.
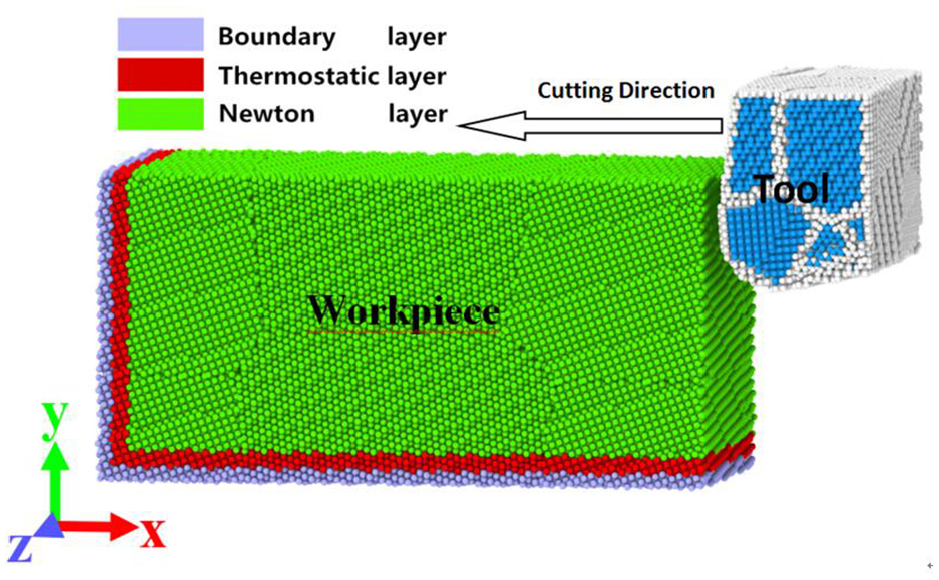
Layers distribution diagram of the workpiece.
The temperature of MD simulation system is defined by the total kinetic energy of the system, 17 which is calculated by the equation (1).
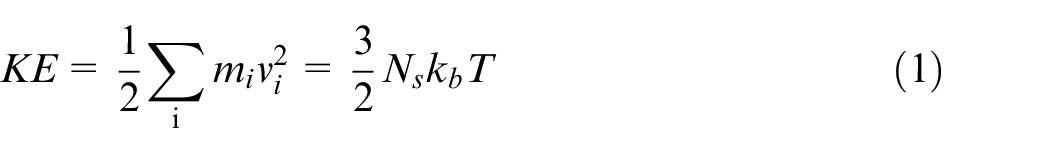
Where KE is the total kinetic energy of the group of atoms.T is the temperature.
Potential function
Tersoff potential function of CBN
Tersoff potential function is a three body potential function. It is used to characterize the interaction between atoms in CBN crystal. E is the total energy of the system. It’s equal to the sum of the energy of each atom.
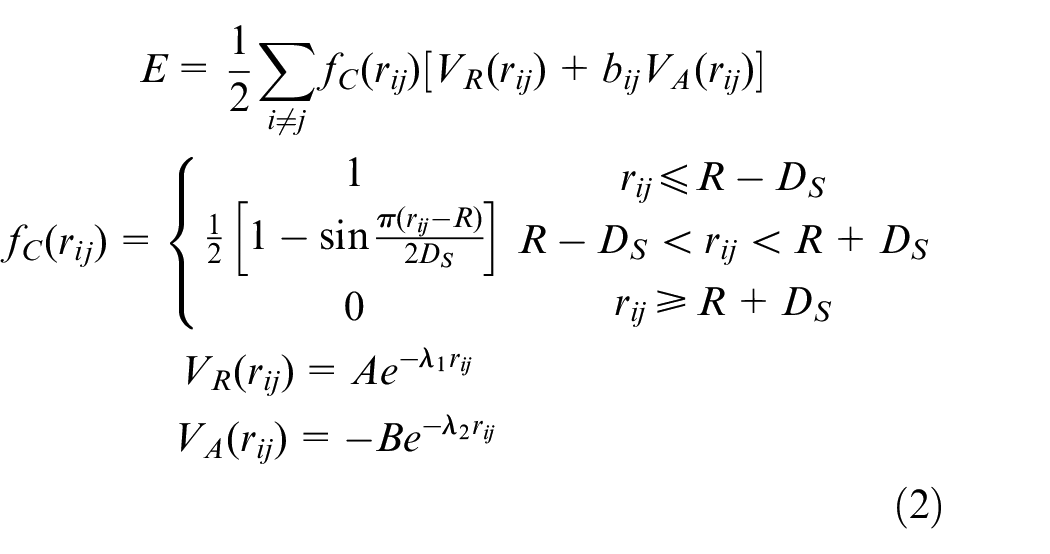
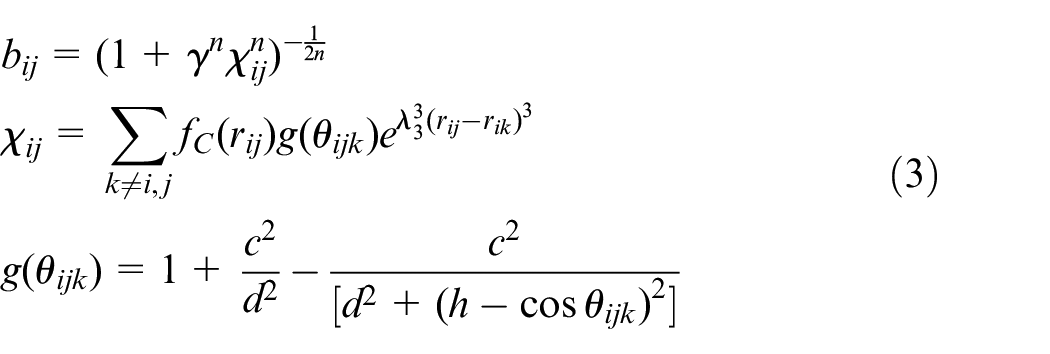
Where
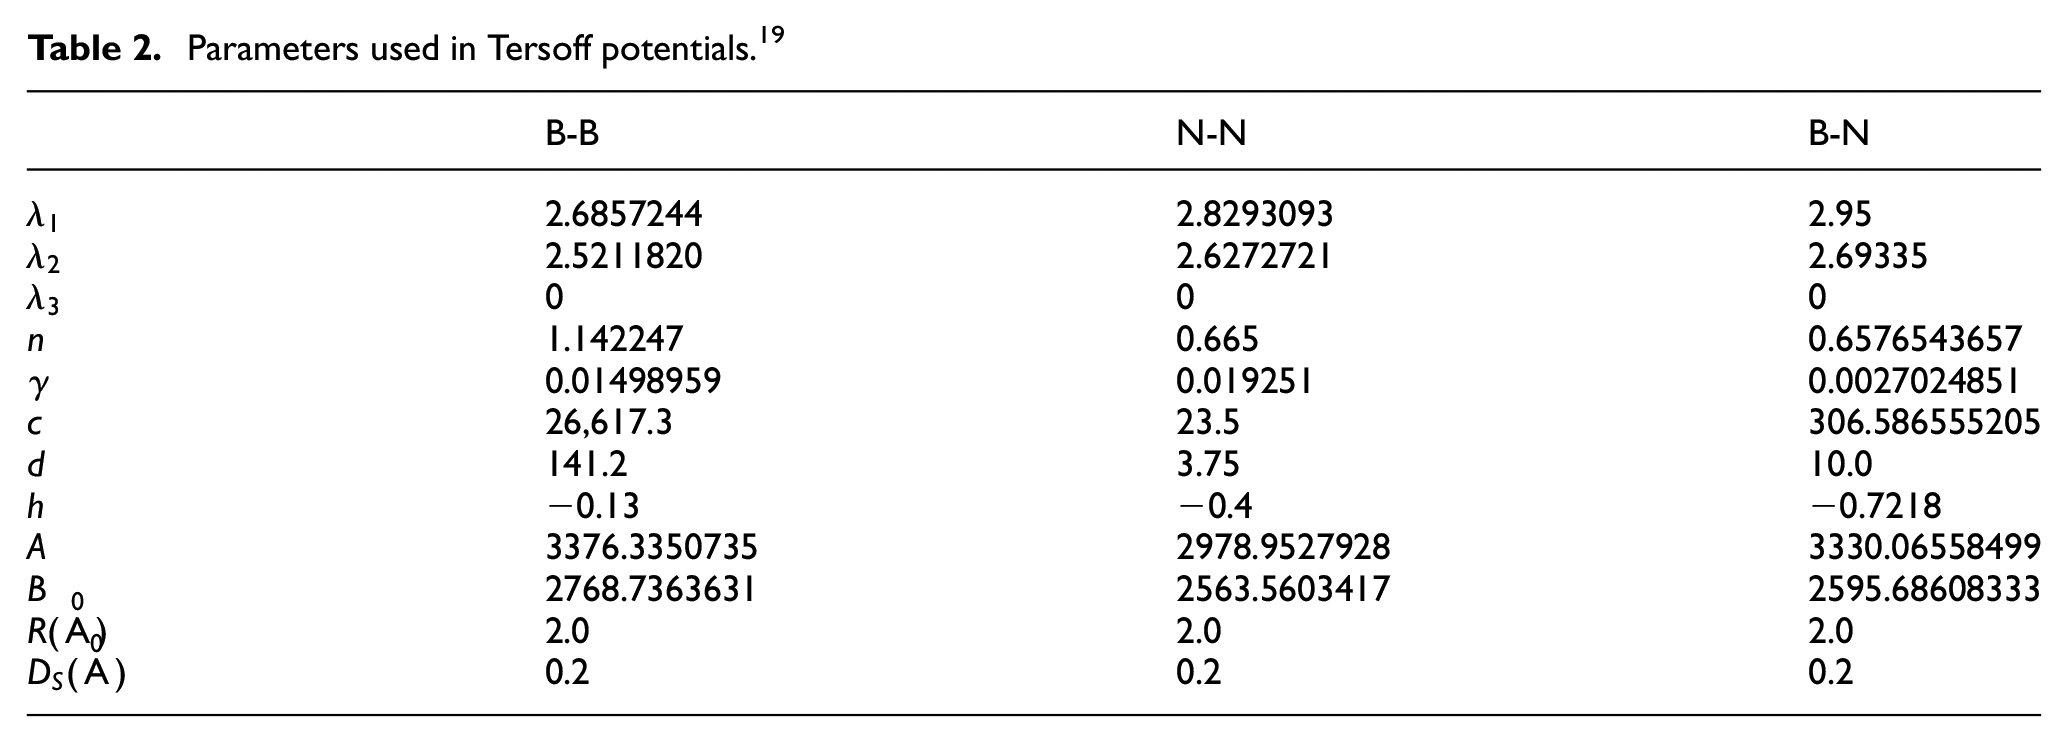
Parameters used in Tersoff potentials. 19
Morse potential function
The interaction forces between tool atoms and workpiece atoms, and the interaction forces between atoms in Ni-Fe-Cr phase and atoms in γ′ phase are expressed by Morse type potential function. The formula of Morse potential function is shown in equation (4).

Among them,
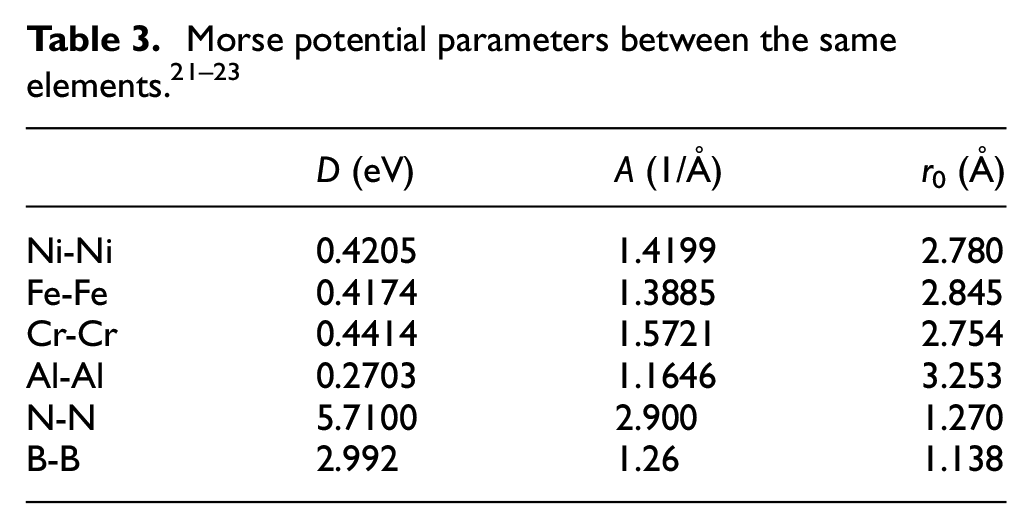
Its equivalent form are usually used.
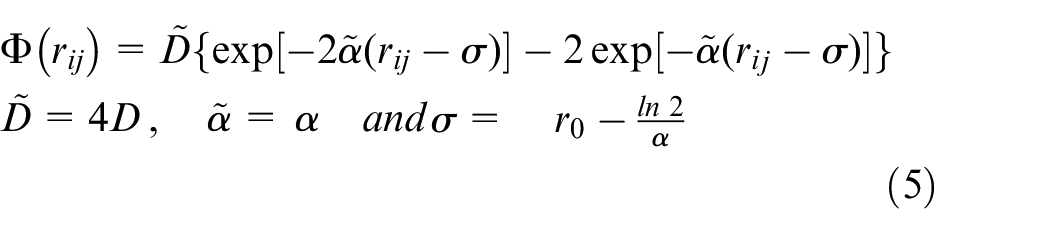
In equation (5),
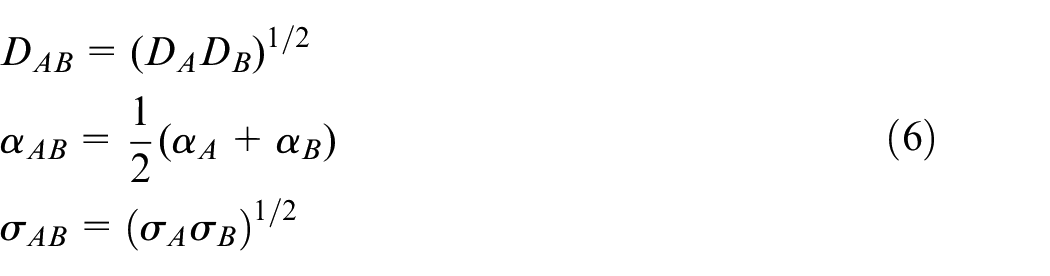
The parameter

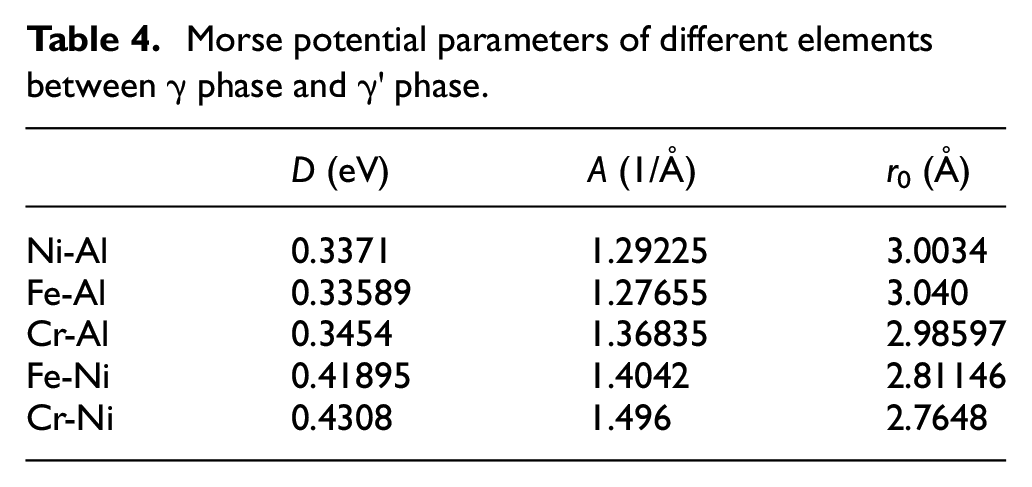
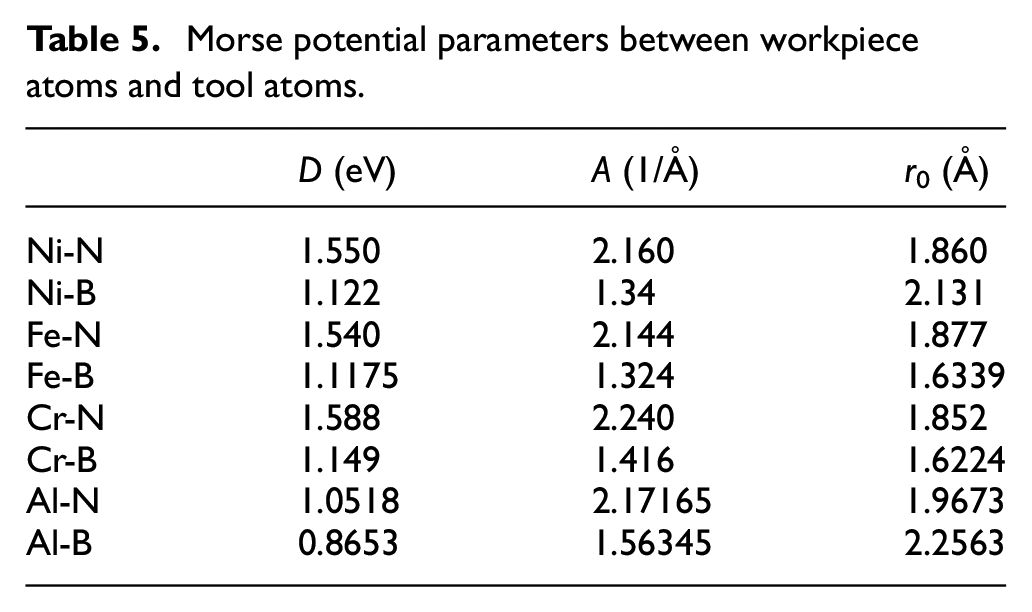
Tables 4 and 5 are the parameters of Morse potential function obtained by this method.
Morse potential parameters of different elements between γ phase and γ′ phase.
Morse potential parameters between workpiece atoms and tool atoms.
EAM potential function
EAM potential function is suitable for describing the interaction among atoms in metal system,
24
which is a kind of multi-body potential. The interaction among atoms in Ni-Fe-Cr phase and among atoms in Ni3Al phase is characterized by EAM type potential function.25,26 The total energy of the system composed of N atoms is
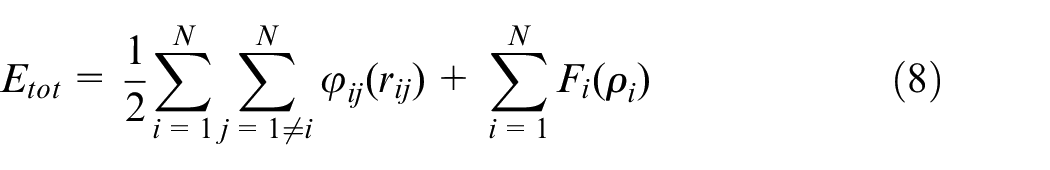
Where,
The first part of equation (8) is the potential term. Where
Results and discussions
Stress and strain of workpiece
Figure 6 shows the curve of temperature change of cutting area and tool during cutting. According to Figure 6, the tool does work on the workpiece at the beginning of cutting, and the temperature of the workpiece and the tool rises sharply. Subsequently, because the heat generated is balanced with the heat emitted from the constant temperature layer, the temperature of the tool is stable at about 350 K, while the temperature of the cutting area is stable at about 400 K. The cutting deformation zone of the workpiece is heated by the tool-chip heat source and the internal friction heat source of the workpiece material deformation, while the temperature of the tool is only heated by the tool-chip friction, so the temperature of the workpiece deformation zone is higher than that of the tool.
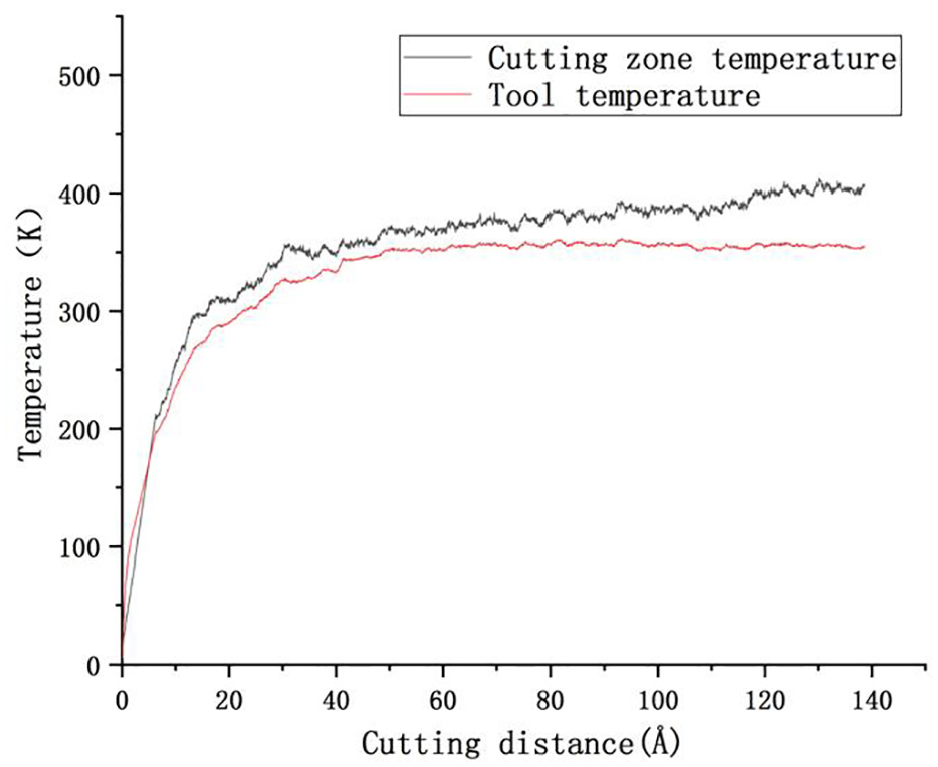
Temperature curve of cutting area and tool.
Figure 7 shows the change curve of the normal stress in the three directions of X, Y, and Z in the cutting area of the workpiece. According to Figure 7, their change trends are the same. At the beginning of cutting, with the increase of the contact area between the tool and the workpiece, the deformation in the cutting area of the workpiece increases, the cutting force increases, and the stress in the cutting area rises sharply. Then the cutting force and the stress in the cutting zone tend to be stable when the tool is in full contact with the workpiece. 27 However, because the workpiece is polycrystalline, the grain orientation and structure of the workpiece varies with the cutting distance. Therefore, the stress in the cutting zone rises slightly again, and then tends to be stable again. Because the tool moves along the X axis, the cutting area of the workpiece mainly receives the force in X-direction, the normal stress in X-direction of the area is the largest. The boundaries condition at the two ends of Z-direction of the model are set as periodic boundaries. Because the tool works, the workpiece in this direction receives extrusion force, the normal stress in Z-direction is second only to that in X-direction and larger than that in Y-direction.
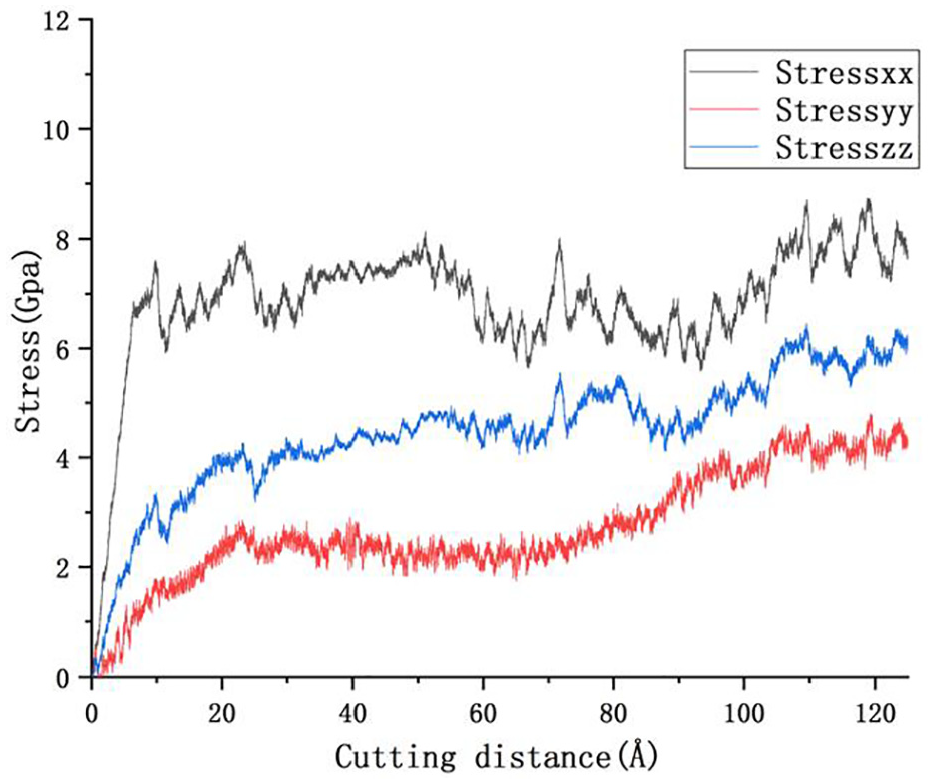
Stress change curve in cutting area.
In the process of cutting, plastic deformation occurs under the action of cutting force of CBN tool. Figures 8 and 9 are the shear strain nephogram and the atomic displacement nephogram of the semi-section (z = 5 nm) along the Z-direction when the cutting distance is 12 nm. It can be clearly seen from Figure 8 that the cutting area of the workpiece forms obvious shear band during the cutting process, and the obvious stratification of the adjacent area can be seen from the corresponding part of Figure 9. After the tool atoms are set to black, it can be seen from the two figures that some workpiece atoms diffuse into the tool.
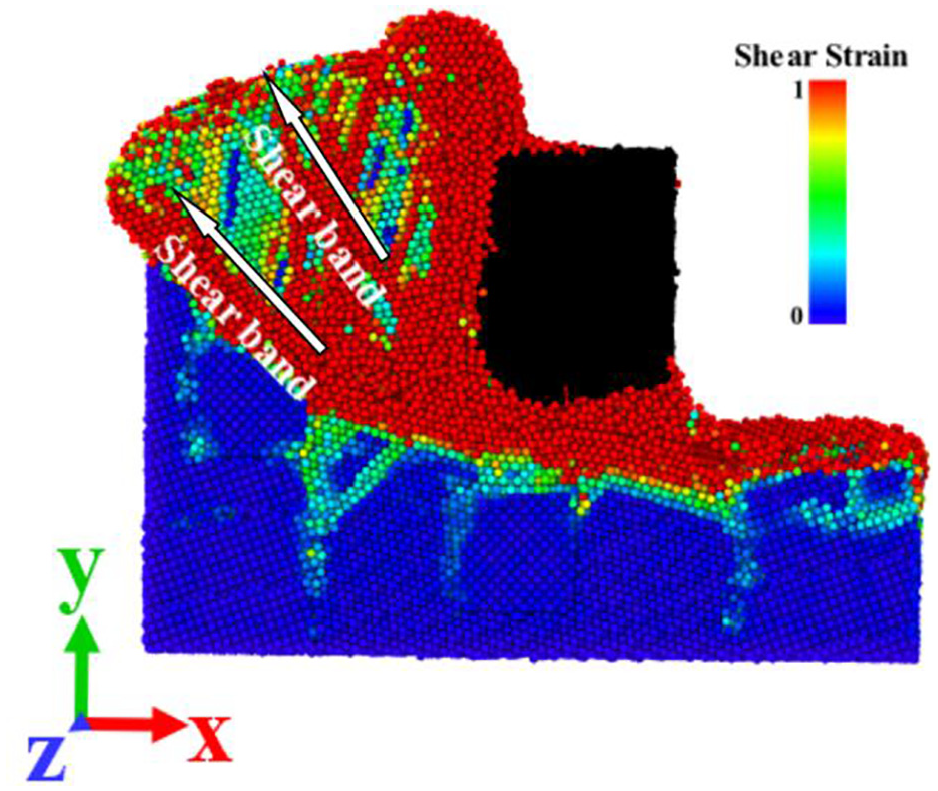
Nephogram of shear strain of workpiece.
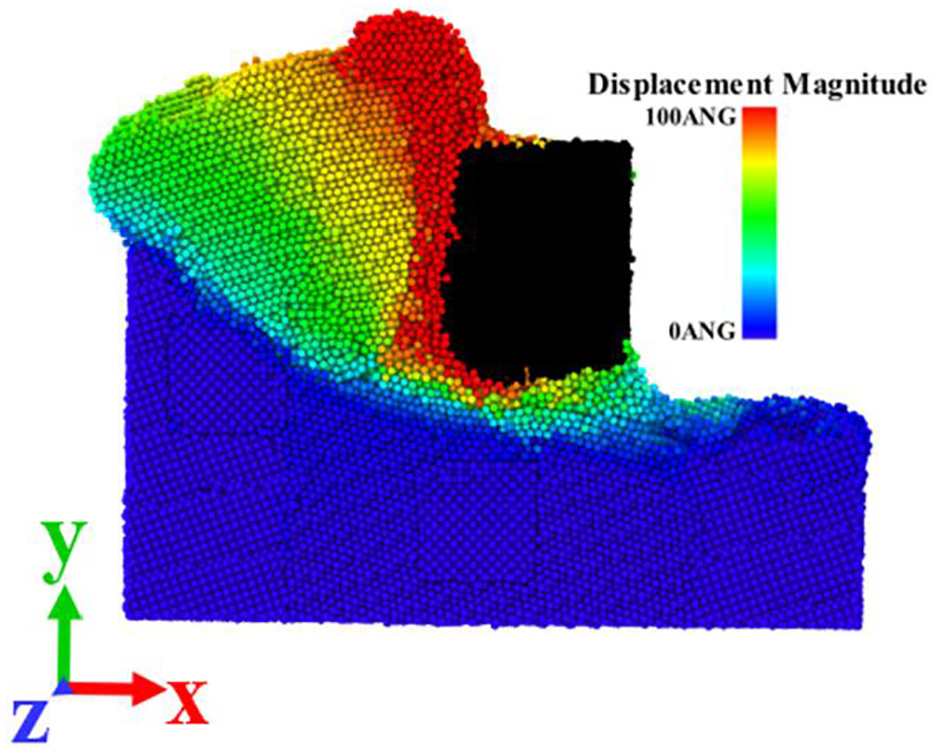
Nephogram of atomic displacement of workpiece.
Diffusion activation energy of workpiece atoms
Diffusion is the migration of atoms. When the tool cuts the workpiece, the stress and temperature of the workpiece rise, and some atoms in the workpiece get enough energy to overcome the potential barrier, so that they can get out of the equilibrium position and reach another equilibrium position, forming diffusion.
When the atoms in the workpiece diffuse into the tool, the first step is to obtain the energy to diffuse to the tool-chip interface, and then to diffuse into the tool. In this paper, the self diffusion activation energy of atoms in different regions of the workpiece is calculated to study the difficulty of diffusion of atoms in different regions to the tool-chip interface. Then, by observing the atomic motion of the workpiece and calculating the formation energy of various atoms in the tool, the difficulty of different kinds of atoms entering different positions of the tool is studied.
Vacancy formation energy
The vacancy formation energy formula can be shown as equation (9). 28

Where
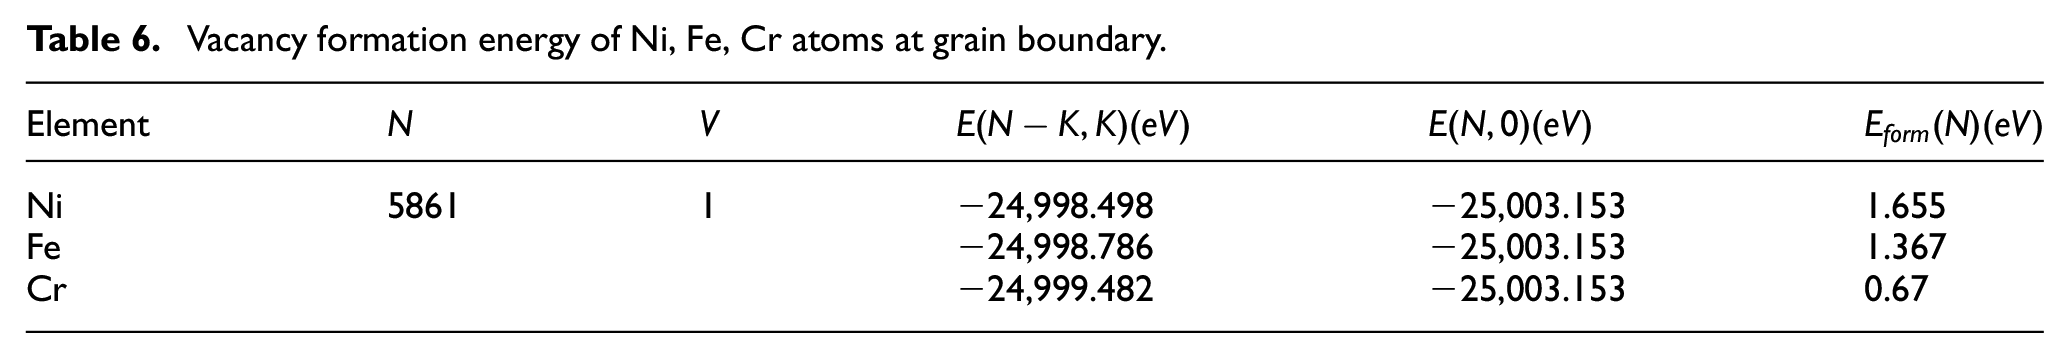
Vacancy formation energy of grain boundary in Ni-Fe-Cr
In this paper, the polycrystalline model of Ni-Fe-Cr was established using the external modeling software Atomsk. When the energy is minimized, the total energy
Vacancy formation energy of Ni, Fe, Cr atoms at grain boundary.
Vacancy formation energy of atoms in Ni-Fe-Cr alloy lattice
In reality, all kinds of elements in Ni-based alloy matrix are randomly distributed. Even if the same proportion of components, the energy is difficult to be the same. In this paper, the Ni-Fe-Cr is simplified. The atomic position of each element is fixed to make a crystal cell with size
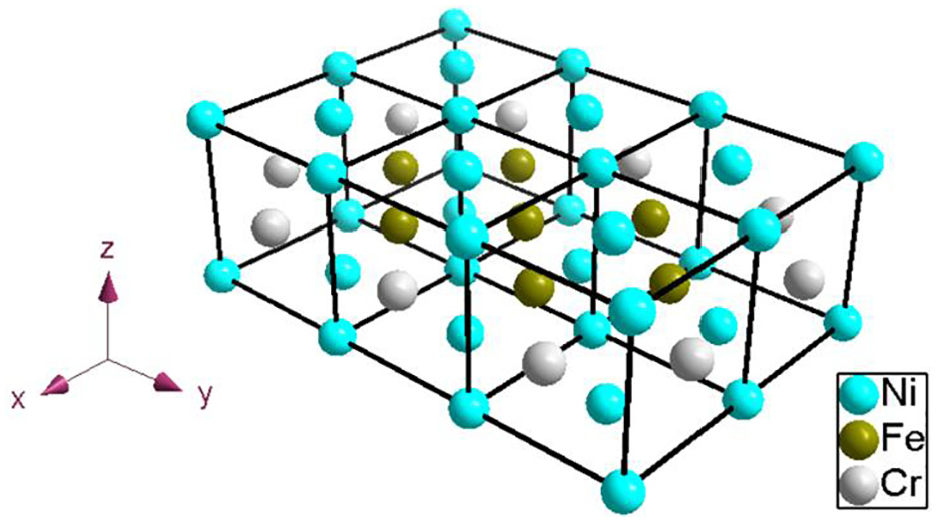
A lattice structure of Ni-Fe-Cr alloy.
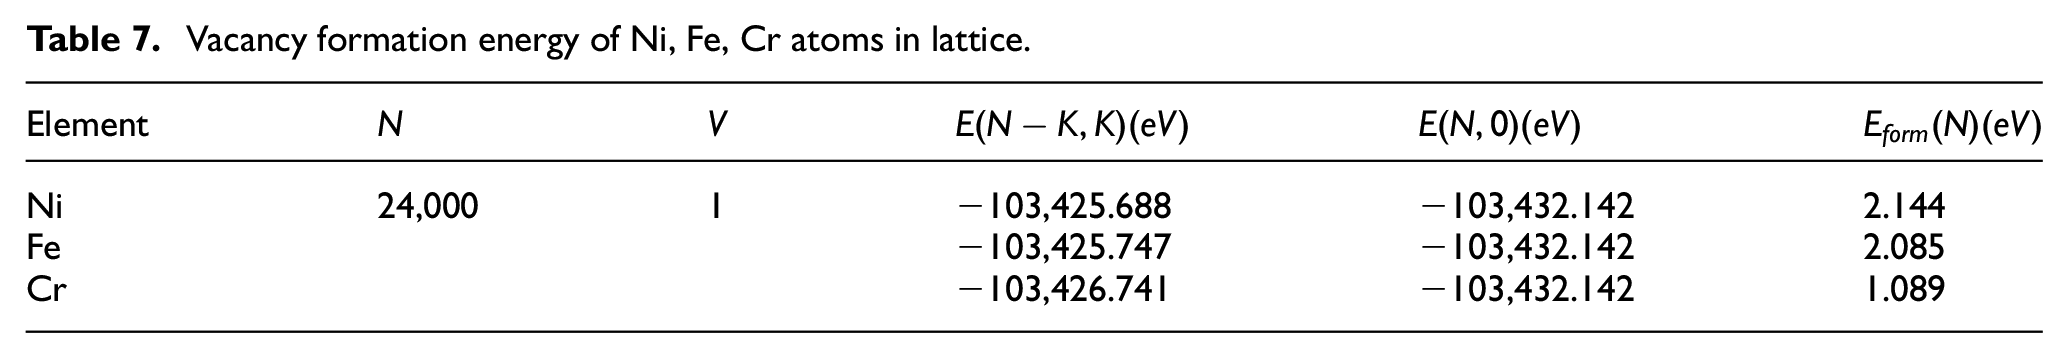
A perfect crystal with 24,000 atoms has been made using this crystal cell mentioned above. By removing an atom and introducing a vacancy, the vacancy formation energy of various elements in Ni-Fe-Cr alloy can be obtained. The results are shown in Table 7.
Vacancy formation energy of Ni, Fe, Cr atoms in lattice.
Vacancy formation energy at phase boundary
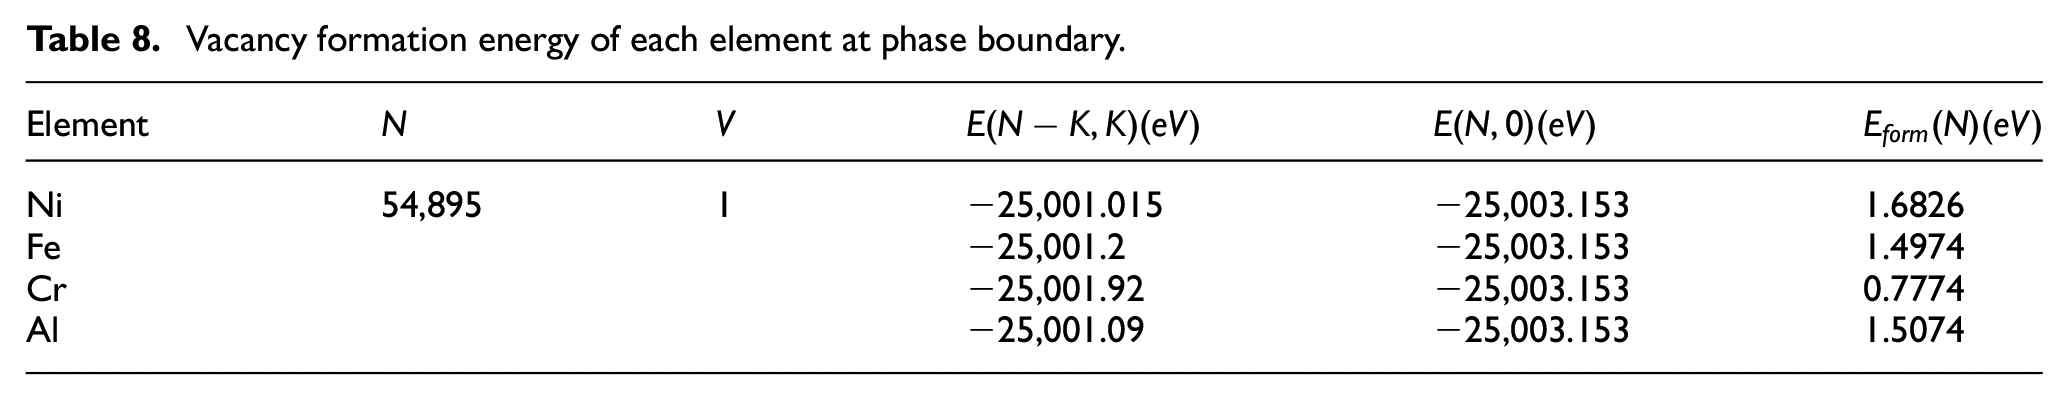
The part of the cutting model whose distance in X-direction is less than 6 nm is used as the model to calculate the vacancy formation energy of each element at the phase boundary. By comparing the total energy before and after introducing a vacancy after energy minimization, the vacancy formation energy of each element at the phase boundary of γ and γ′ is obtained. The results are shown in Table 8.
Vacancy formation energy of each element at phase boundary.
Vacancy formation energy in γ′ phase lattice
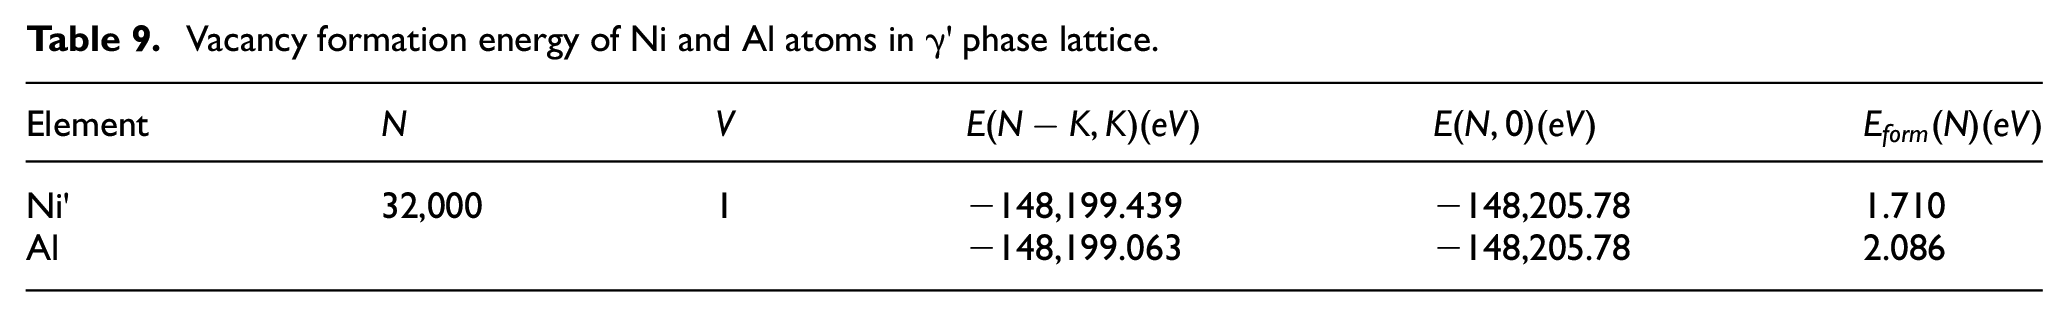
A perfect Ni3Al crystal with 32,000 atoms is established. The vacancy formation energy of Ni and Al atoms in γ′ phase lattice is obtained by introducing a vacancy. The results are shown in Table 9. Ni′ is the element in Ni3Al.
Vacancy formation energy of Ni and Al atoms in γ′ phase lattice.
Vacancy transfer energy
In the process of cutting, the atoms in the workpiece will migrate after forming the vacancy, and the energy needed for migration is the vacancy migration energy. In this paper, the vacancy transfer energy is obtained by formula derivation and fitting. 29
The workpiece model is put into the compression model, which is compressed to 80% of the original length along the X-direction, so that a large number of point defects are produced in the crystal. The compression model adopts NPT ensemble. The boundary of model in the X, Y, and Z directions are set as periodic boundary conditions. The pressure in the Y and Z directions is set to 0. Before compression, simulation process was run for 20 ps to stabilize the model temperature, and then the simulation process is run using the compressed model for 20 ps again to make the model reach a stable temperature T. The mean square displacement (MSD) of various elements in each region can be calculated by changing the NPT ensemble into NVT ensemble. The number of point defects in the simulation model can be obtained by using the software Ovito. The mean square displacements of various atoms at eight temperatures of 200, 250, 300, 350, 400, 450, 500, and 550 K are calculated respectively. The vacancy transfer energies of various atoms are obtained through calculation and fitting.
The equation (10) is the diffusion coefficient formula.
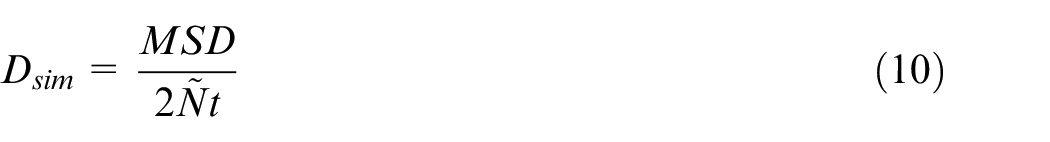
Where
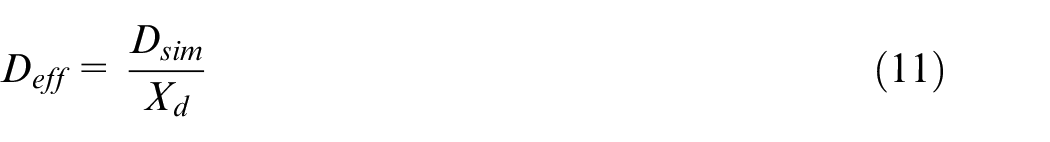
According to the diffusion coefficient
According to Arrhenius equation:
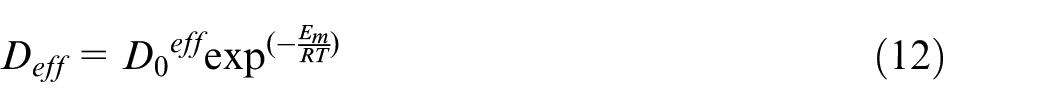
Where
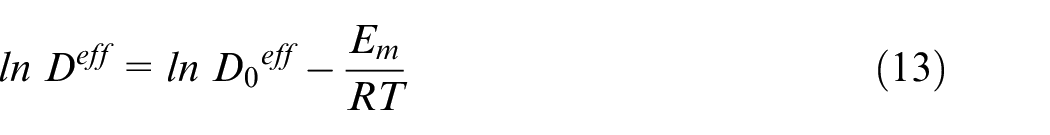
In equation (13),
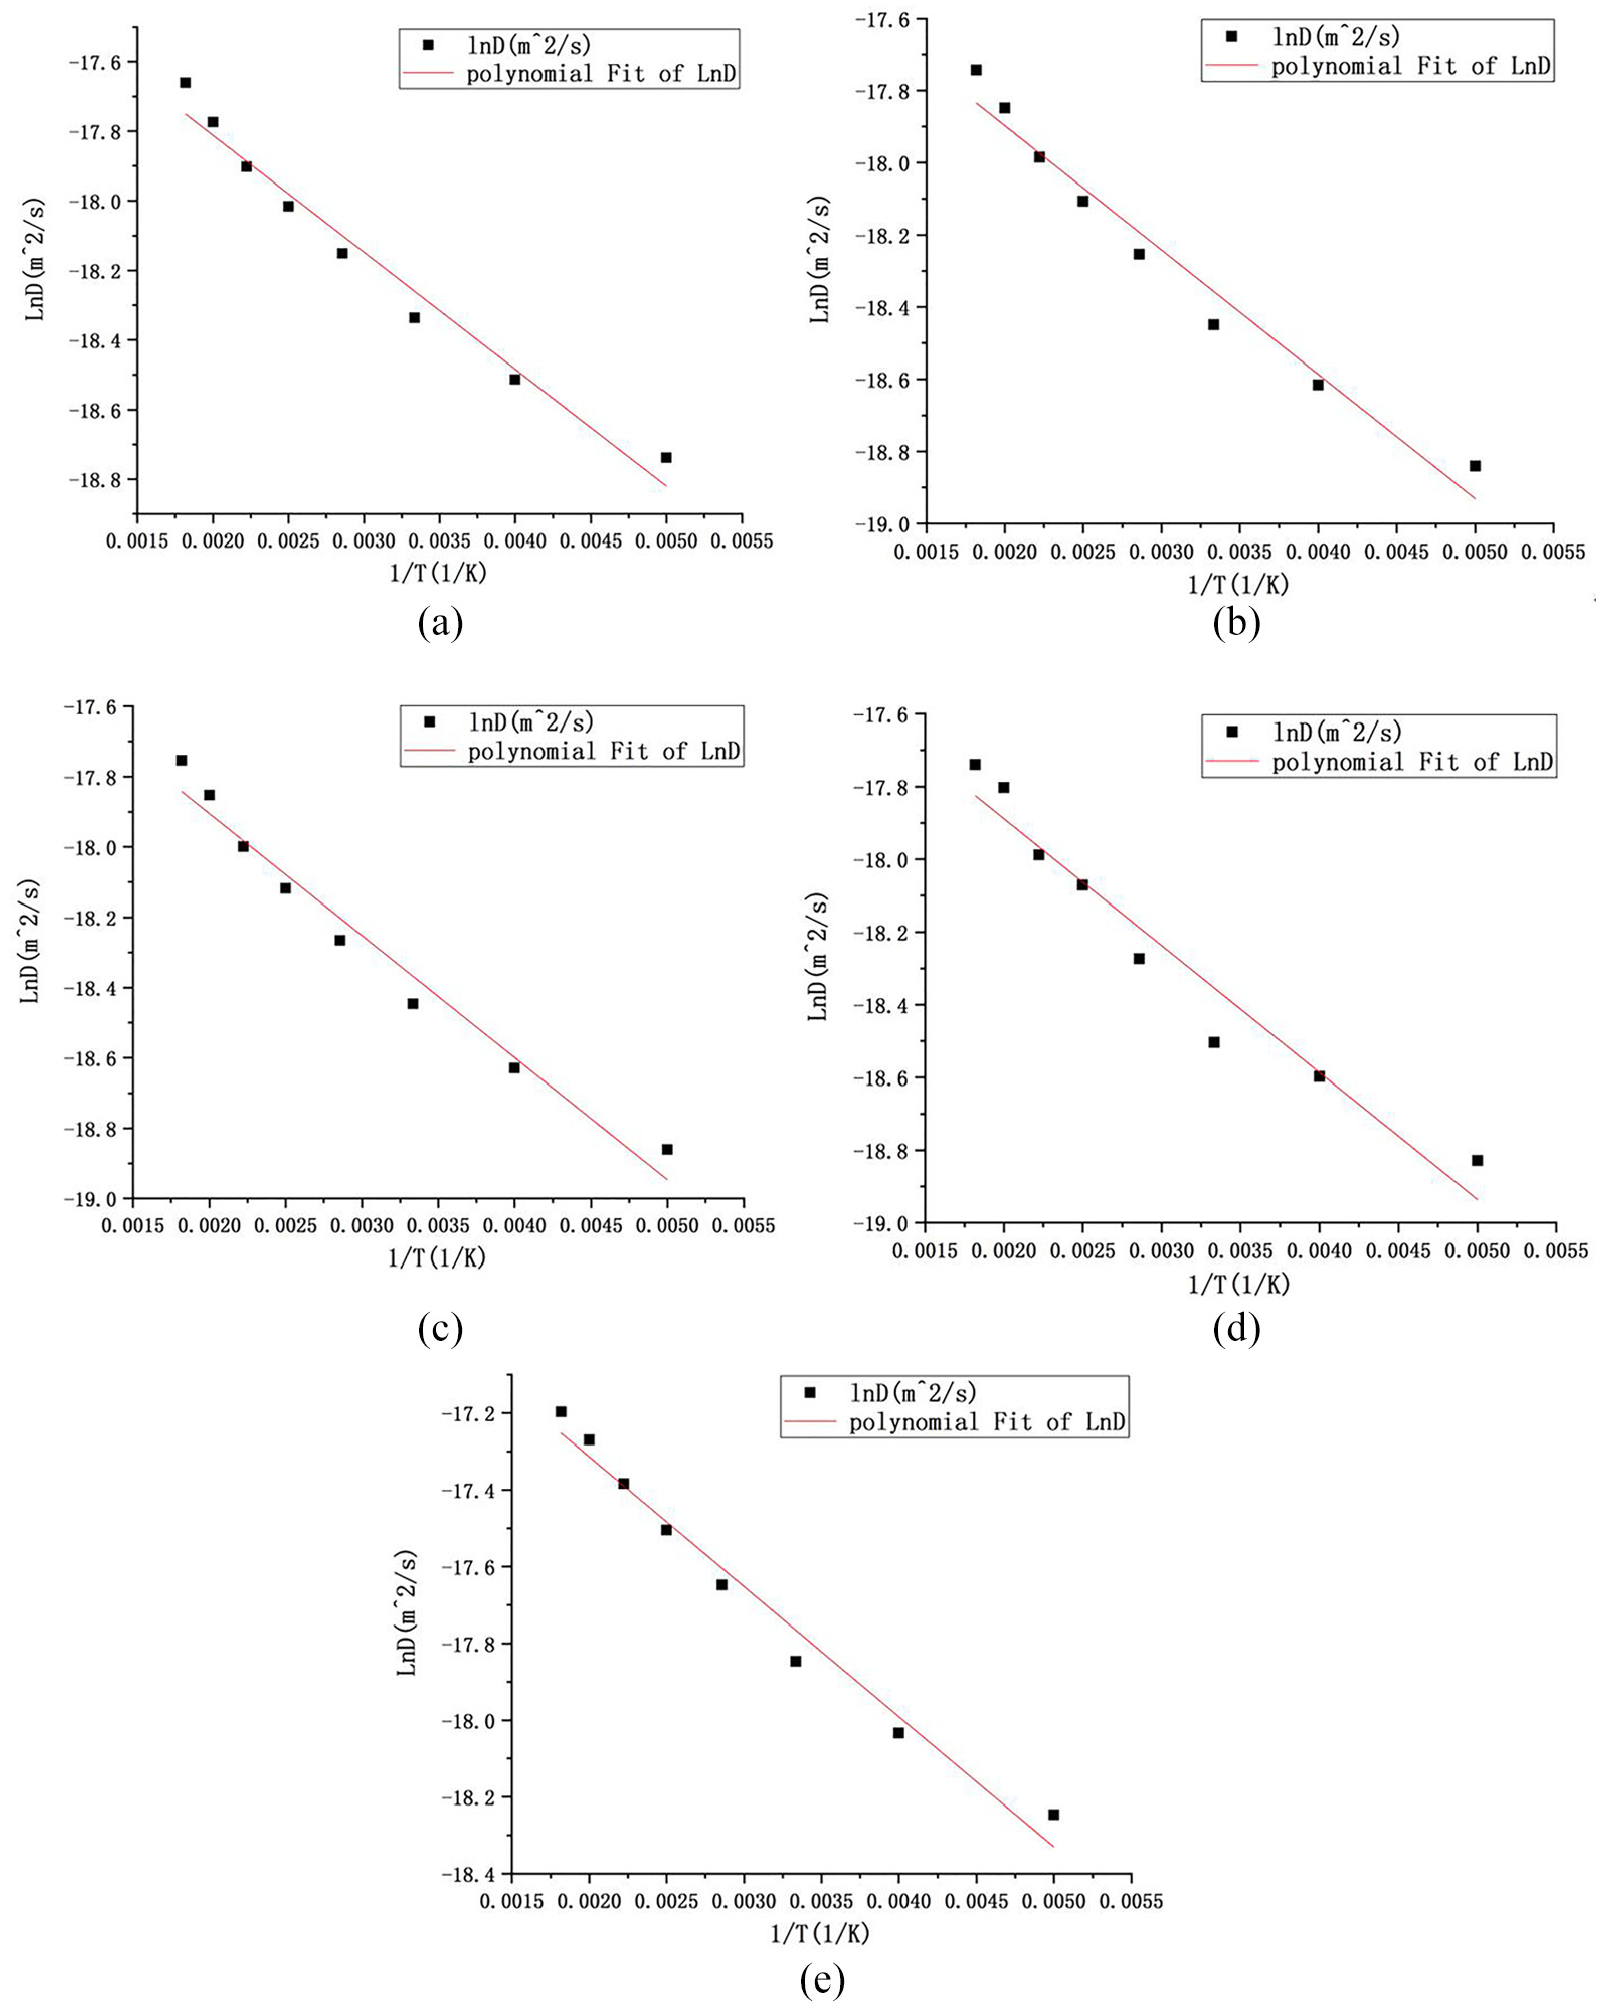
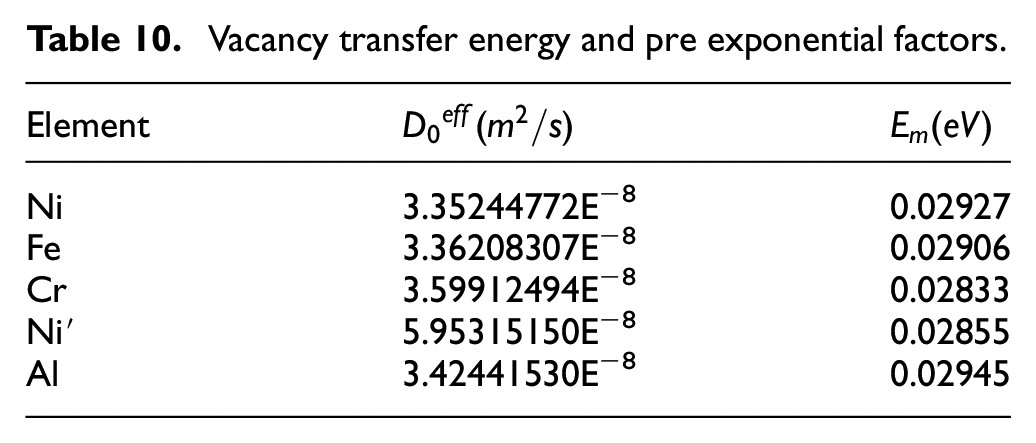
Fitting diagram of
Vacancy transfer energy and pre exponential factors.
Diffusion activation energy of workpiece atoms
The diffusion activation energy Q of atoms is calculated by equation (14). 18

Where
Q1 represents the atomic diffusion activation energy in Ni-Fe-Cr alloy lattice, Q2 represents the diffusion activation energy of atoms in Ni3Al lattice, Q3 represents the diffusion activation energy of atoms at phase boundary, and Q4 represents the diffusion activation energy of atoms at grain boundary respectively. They are obtained through the calculation. Furthermore, in the calculation of the diffusion activation energy at the phase boundary, the vacancy migration energy of Ni atom in Ni-Fe-Cr alloy is used to approximate the diffusion activation energy of Ni atom at the phase boundary. Figure 12 is diffusion activation energy of each element.
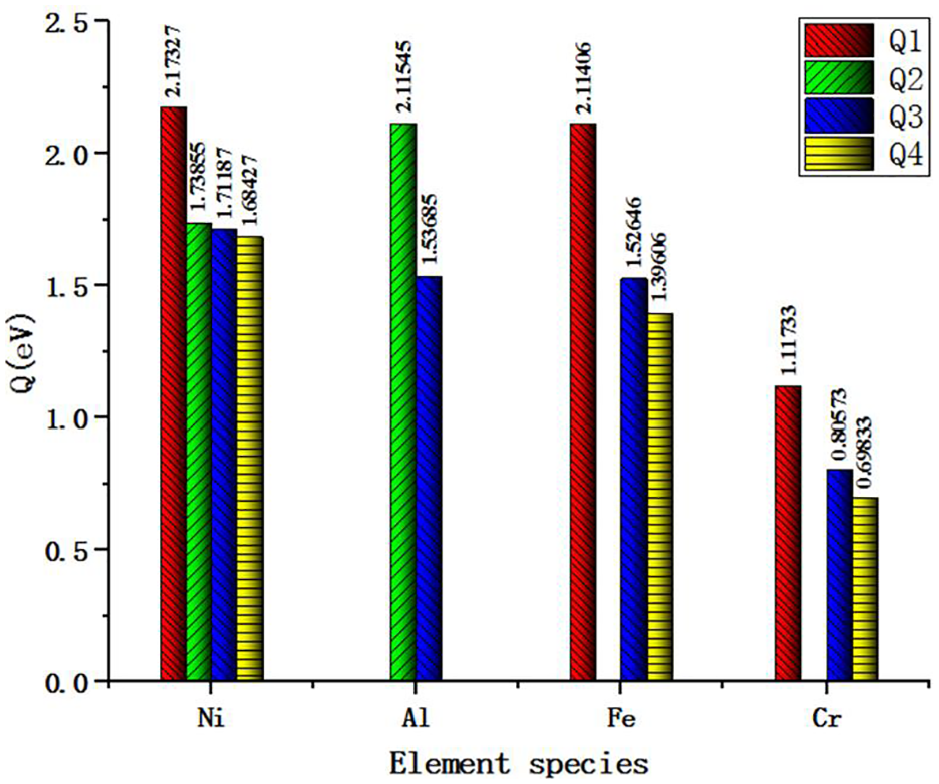
Diffusion activation energy of each element.
According to the data of Q1 shown in Figure 12, it can be seen that in the Ni-Fe-Cr alloy lattice, the diffusion activation energy of Ni atom is the largest and that of Cr atom is the smallest, which indicates that in the Ni-Fe-Cr alloy lattice during the cutting process, compared with Ni and Fe atoms, the Cr atoms is the easiest to obtain the kinetic energy to form the diffusion. The difficulty degree of diffusion is Ni > Fe > Cr. According to the data of Q2, Ni atoms are more easily diffused than Al atoms in Ni3Al lattice.
According to the data of Q4 in Figure 12, it can be seen that the diffusion activation energy of Ni atom is the largest, followed by Al atom, and that of Cr atom is the smallest in the phase boundary. It shows that in the cutting process, compared with Ni, Fe, and Al atoms, Cr atoms in the phase boundary are most likely to obtain kinetic energy and form diffusion, and Ni atoms are the most difficult to diffuse. Similarly, according to the data of Q4 in Figure 12, at the grain boundary, Cr atoms are the most easily diffused, followed by Fe atoms, and Ni atoms are the most difficult to form diffusion.
The diffusion activation energy Q1 of Ni element in the crystal lattice of Ni-Fe-Cr alloy is significantly higher than that of Q2, Q3, and Q4, and the diffusion activation energy Q4 of Ni is the smallest, which indicates that compared with the Ni atom in the crystal lattice and phase boundary, the Ni atom at the crystal boundary is most likely to obtain kinetic energy in the cutting process and form diffusion. On the contrary, Ni atoms in the lattice of Ni-Fe-Cr alloy are the most difficult to form diffusion. Compared with the diffusion of Al atom in Ni3Al lattice, the diffusion of Al atom at the phase boundary is much easier. Compared with Fe atoms, the diffusion of Fe atoms at the boundary and the phase boundary is easier than that of Fe atoms in the lattice, because Q1 > Q3 > Q4. In the same way, the Cr atom in the lattice is more difficult to diffuse than that in the phase boundary and the grain boundary. It can be seen from the above results. The diffusion activation energy of the same atom in the crystal lattice of Ni-Fe-Cr alloy and Ni3Al alloy is greater than that of the atom at the boundary or phase boundary. In the cutting process, the atoms in the workpiece first diffuse to the tool-chip interface through the grain boundary and phase boundary.
Diffusion of workpiece atoms into tool
After the atoms in the workpiece diffuse into the tool-chip interface, they may enter the grain boundary of CBN tool or the tool atom lattice. The workpiece atoms entering the lattice may form the substitution impurity atom, or the interstitial displacement atom. In this paper, through the observation of atomic motion in molecular dynamics model and the analysis of various formation energies obtained by the first principle calculation method, the difficulty of diffusion of workpiece atoms into different positions of tool is studied.
Diffusion of workpiece atoms at tool boundary
Figure 13(a) to (d) are section diagrams of the tool area perpendicular to the Z-axis and 2, 4, 6, and 8 nm away from the origin respectively, when the cutting distance of the simulation model is 12 nm. It can be seen from these section diagrams that some workpiece atoms diffuses into the grain boundary area in the tool-workpiece interface, while there are fewer workpiece atoms diffused into the grain.
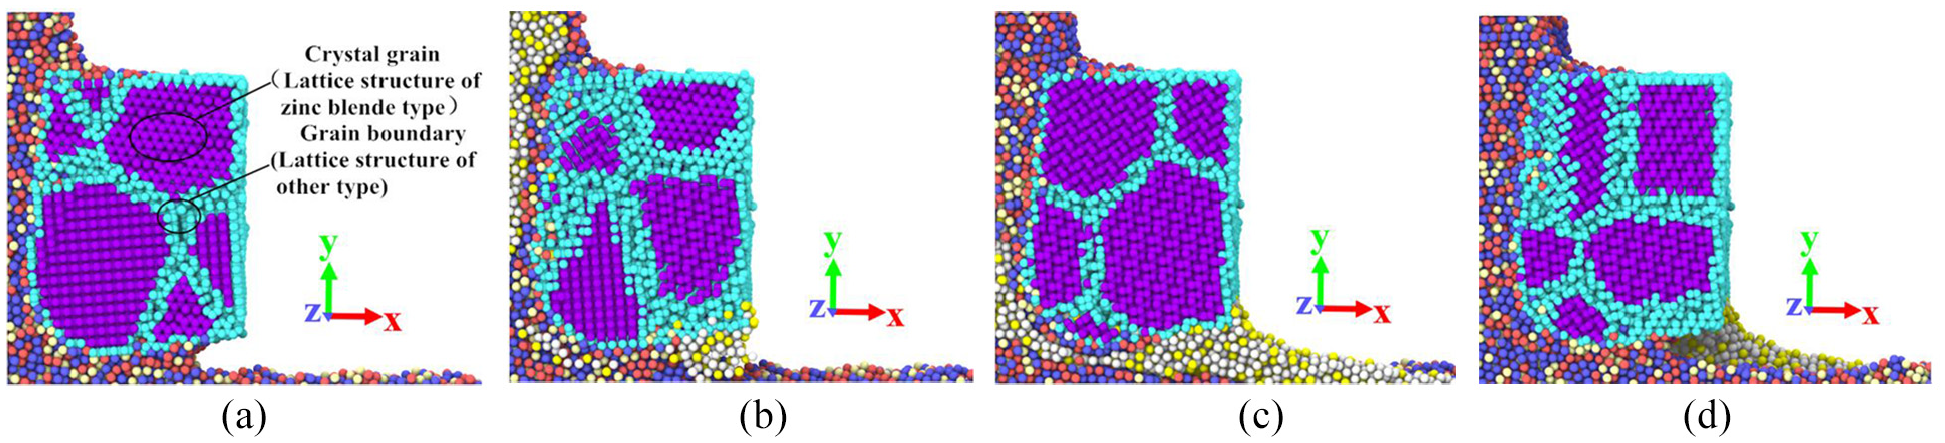
Section diagrams of the tool area perpendicular to the Z-axis and 2, 4, 6, and 8 nm away from the origin when cutting distance is 12 nm: (a) D = 2 nm, (b) D = 4 nm, (c) D = 6 nm, and (d) D = 8 nm.
Figure 14 shows the potential energy distribution of atoms in a section of the tool. It can be seen from Figure 14 that the potential energy of atoms at the grain boundary is greater than that of atoms in the grain. There are many defects in the grain boundary, such as vacancy, large lattice distortion, and high energy. The potential energy of atoms in the grains is smaller and the structure is more stable. It takes more energy for the workpiece atoms to enter the tool lattice to form doped atoms. Therefore, it is much easier for the atoms to diffuse into the grain boundary than into the lattice.
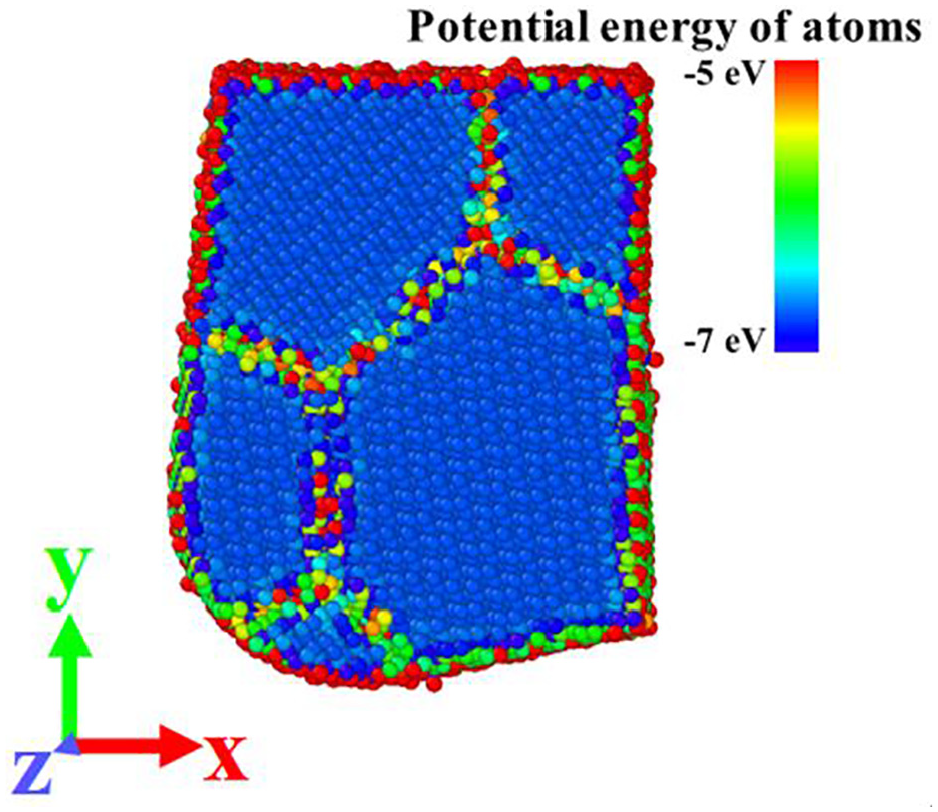
Potential energy distribution of atoms in a section of the tool.
Formation energy calculation
In the cutting process, there are two ways for the workpiece atoms to enter the CBN lattice. One is to form the substituted impurity atom, the other is to form the interstitial impurity atom. If there is a vacancy around the workpiece atoms diffused into the CBN lattice, two kinds of point defect formation energies (interstitial impurity atom formation energy and substituted impurity atom formation energy) can be calculated and compared directly to study the difficulty of two kinds of point defect formation.
However, there is no vacancy around the workpiece atom squeezed into CBN lattice. In this case, to form the substituted impurity atom, the B and N atoms must enter the lattice gap to form the self-gap atom, and form the vacancy at the original lattice point. In this paper, the energy needed for this process is simplified as the sum of formation energy of the substituted impurity atom, the self-gap formation energy of the substituted atom and the vacancy formation energy of the substituted atom. The sum of the three is compared with the formation energy of interstitial impurity atom to study the difficulty of forming interstitial impurity atom and substituted impurity atom. Therefore, the formation energy of two kinds of point defects, the self-gap atom formation energy and the vacancy formation energy of B and N atoms are calculated.
The first principle software, Vienna Ab-initio Simulation Package(VASP), 30 is used to calculate the density functional. The interaction between electrons and nuclei is described by projection plus wave (PAW). The interaction energy is described by generalized gradient approximation (GGA-PBE). In order to obtain the formation energy of doping atom, self-gap atom and vacancy in CBN lattice, a 2 × 2 × 2 CBN cell have been created, as shown in Figure 15. In the process of calculation, the structure optimization is carried out by using the conjugate gradient method. The cutoff energy of plane wave (Ecut) is 550 eV, and the Monkhorst-Pack method is used to generate the K-point mesh with size 7 × 7 × 7.
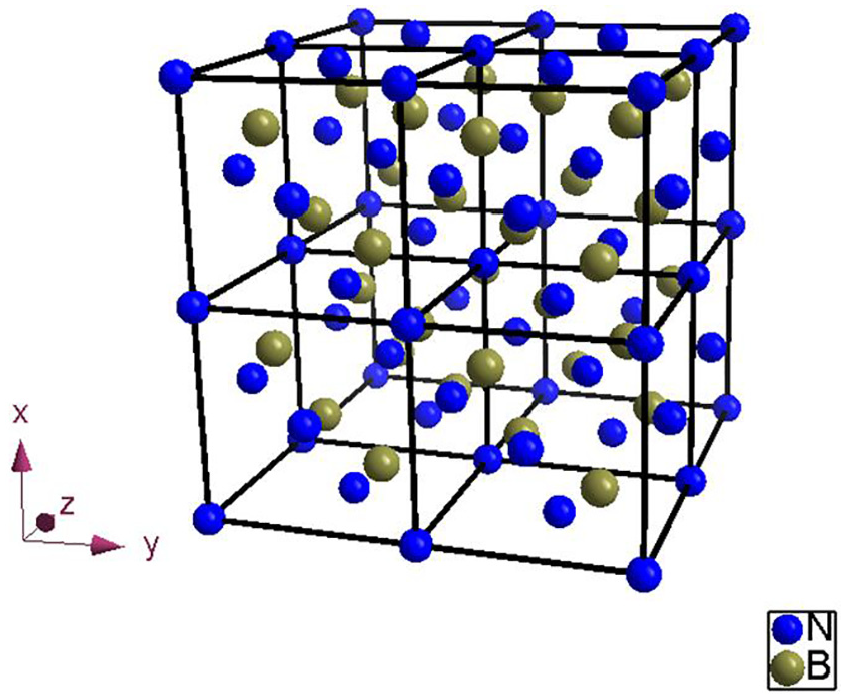
CBN supercell.
Formation energy of substituted doped atom
In the equation (15),
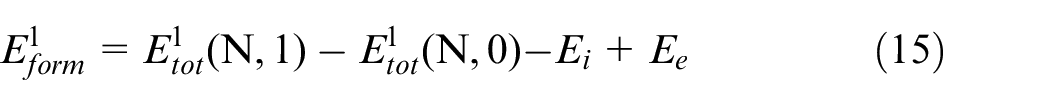
One N atom and one B atom are replaced with one Ni atom respectively, as shown in Figure 16.
An atom in CBN supercell is replaced: (a) one N atom is replaced and (b) one B atom is replaced.
In equation (15),
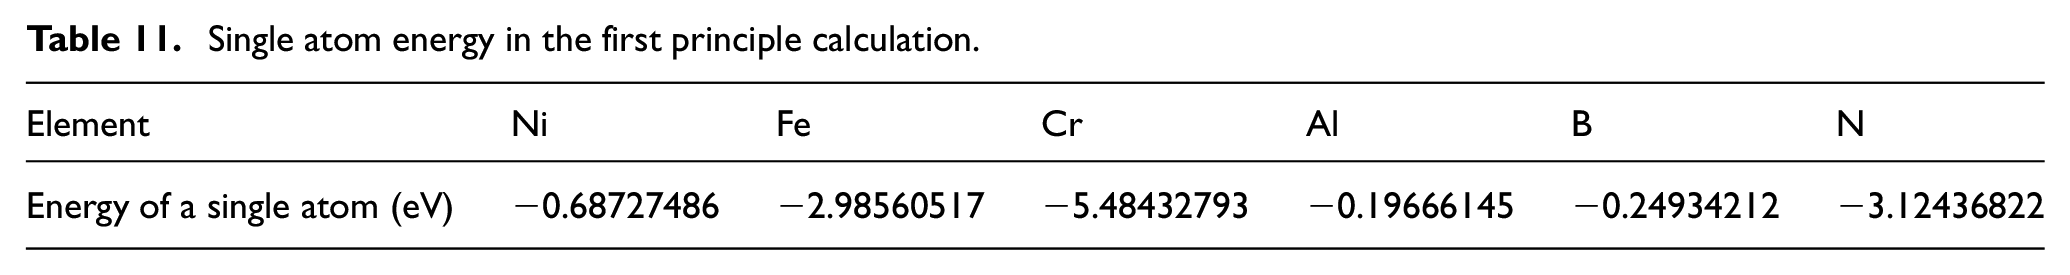
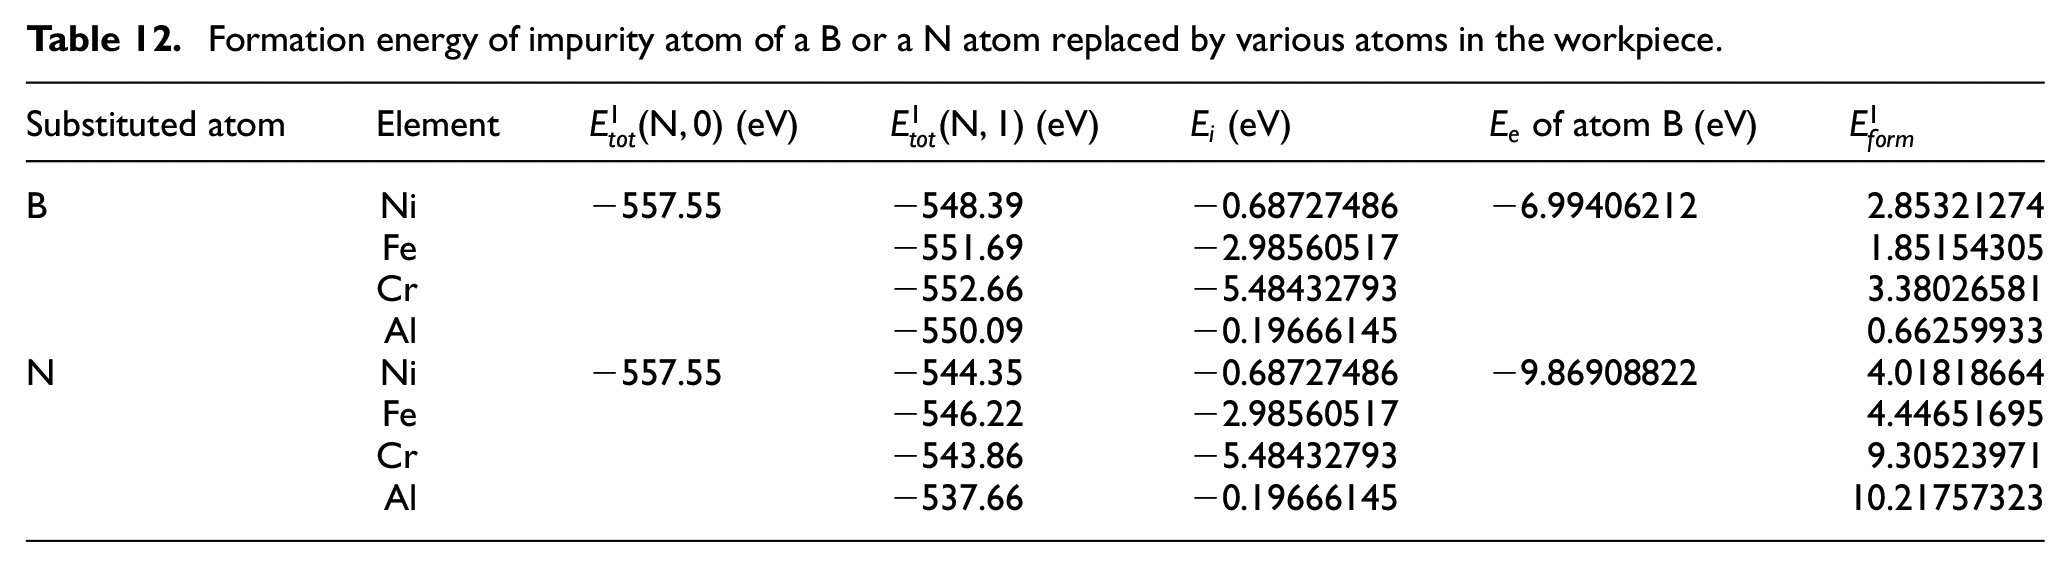
In the first principle calculation, if the energy of a single atom is taken as a reference point, the difference between the total energy of the system and the energy of a single atom is equal to the binding energy. 32 In this paper, the average potential energy of a single atom in the lattice calculated in MD software is added to the energy of a single atom calculated in the first principle software. Their sum is used to approximate the average total energy of each such atom in the lattice of the first principle software. The average potential energy of B or N atom in CBN lattice in MD is −6.74472 eV. The monatomic energy of all kinds of atoms is shown in Table 11. Adding the average potential energy (through MD) of an atom to its single atomic energy (through first principle calculation), the total energy of an atom (first principle calculation) can be got. The total energies of B and N atoms are −6.99406212 and −9.86908822 eV, respectively. Table 12 shows the formation energy needed for replacing one B atom or one N atom .
Single atom energy in the first principle calculation.
Formation energy of impurity atom of a B or a N atom replaced by various atoms in the workpiece.
Formation energy of interstitial doped atom
The equation (16) is the calculation formula of formation energy of interstitial doped atom 31 :
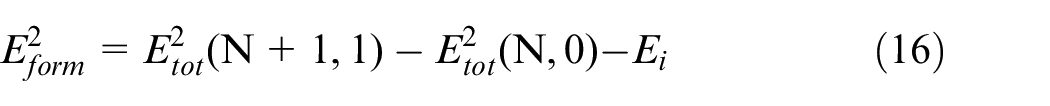
Where
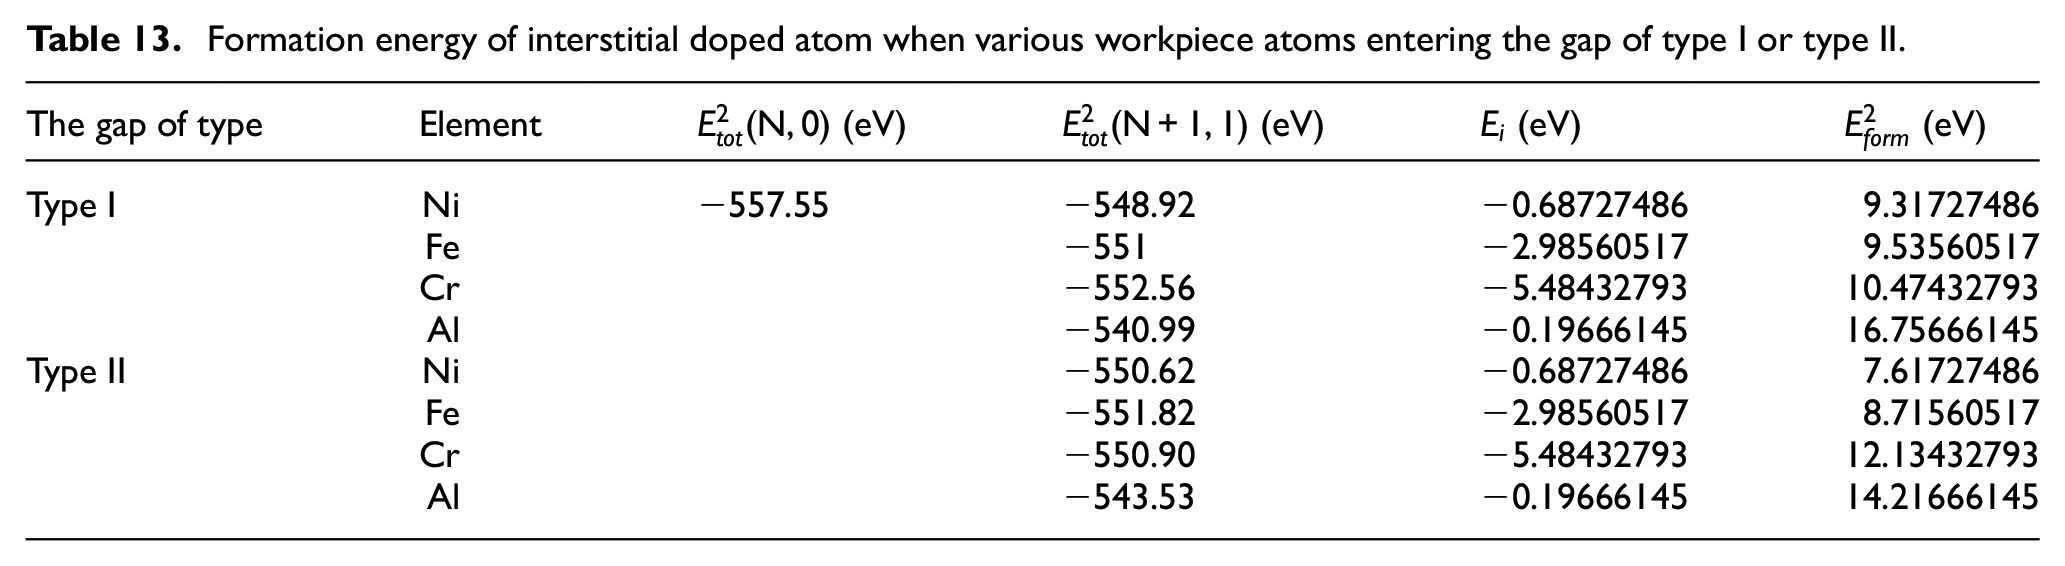
The lattice type of CBN is sphalerite, which has two main gap types, as shown in Figure 17. We put a Ni, Fe, Cr, or Al atom into the gap of one unit cell of the supercell, and then optimize the structure by VASP, and then optimize the electron. Table 13 shows formation energy of interstitial doped atom when various workpiece atoms entering the gap of type I or type II.
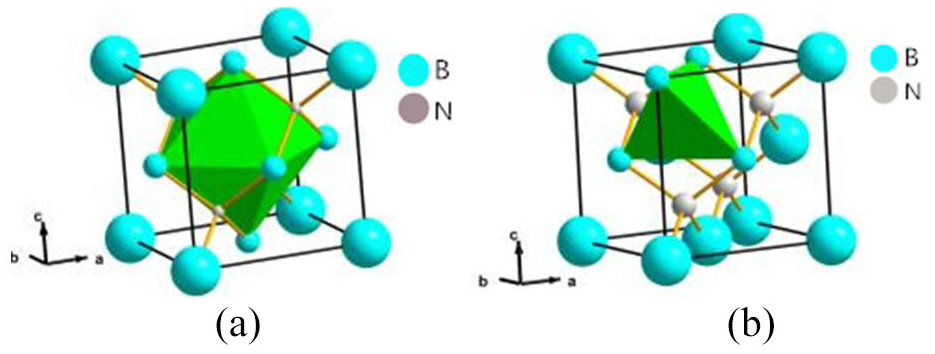
Two types of gap in sphalerite structure: (a) type I and (b) type II.
Formation energy of interstitial doped atom when various workpiece atoms entering the gap of type I or type II.
Self-gap atom formation energy and vacancy formation energy
The equation (17) illustrates the self-gap atom formation energy.
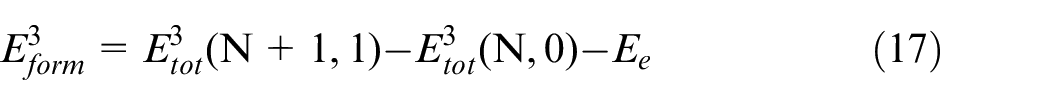
Where
Formation energy of interstitial atom when B and N atoms are doped into type I or type II lattice gap.
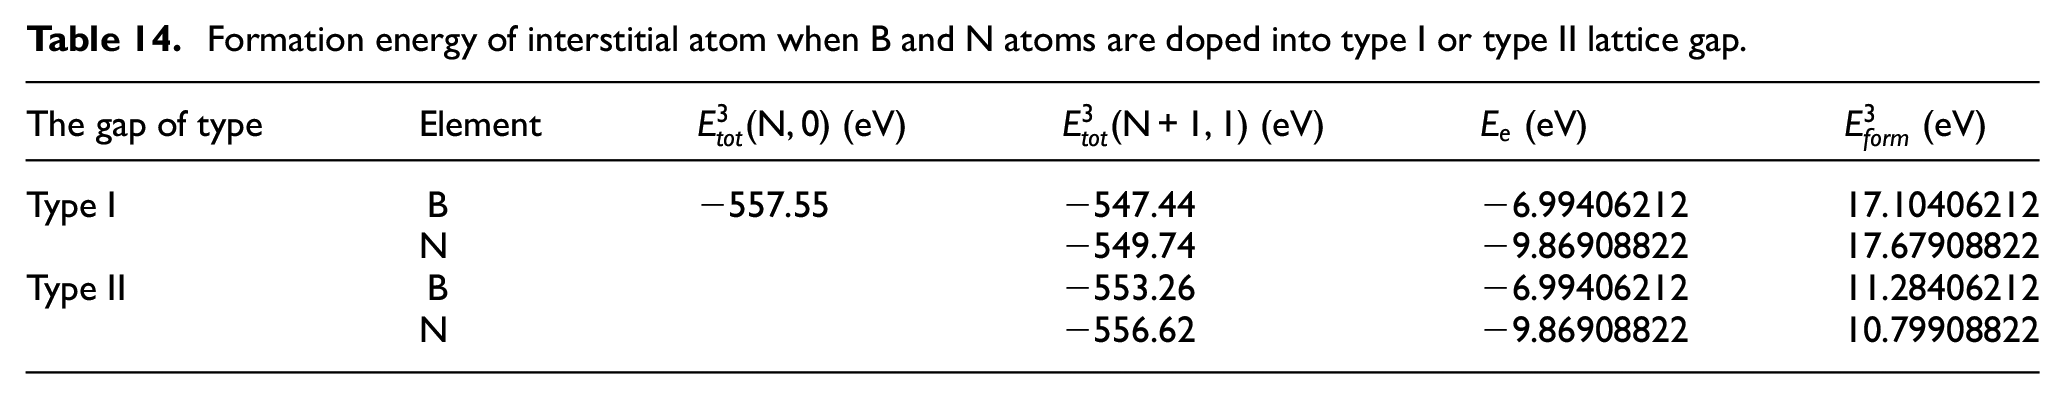
It can be seen from the dates in the tables that it takes a lot of energy for B and N atoms to enter the CBN lattice gap atoms. This is larger than the formation energy of atoms in the workpiece diffused into the lattice gap of CBN tool to form gap atoms.
The formation energy of vacancy of B and N atoms in CBN lattice is calculated by the formula (18). 33
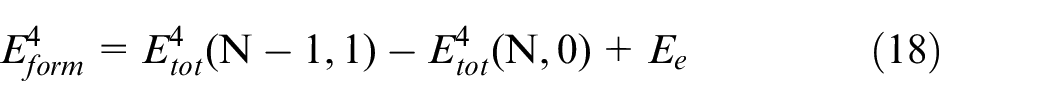
Where
Vacancy formation energy of B and N atoms in CBN lattice.
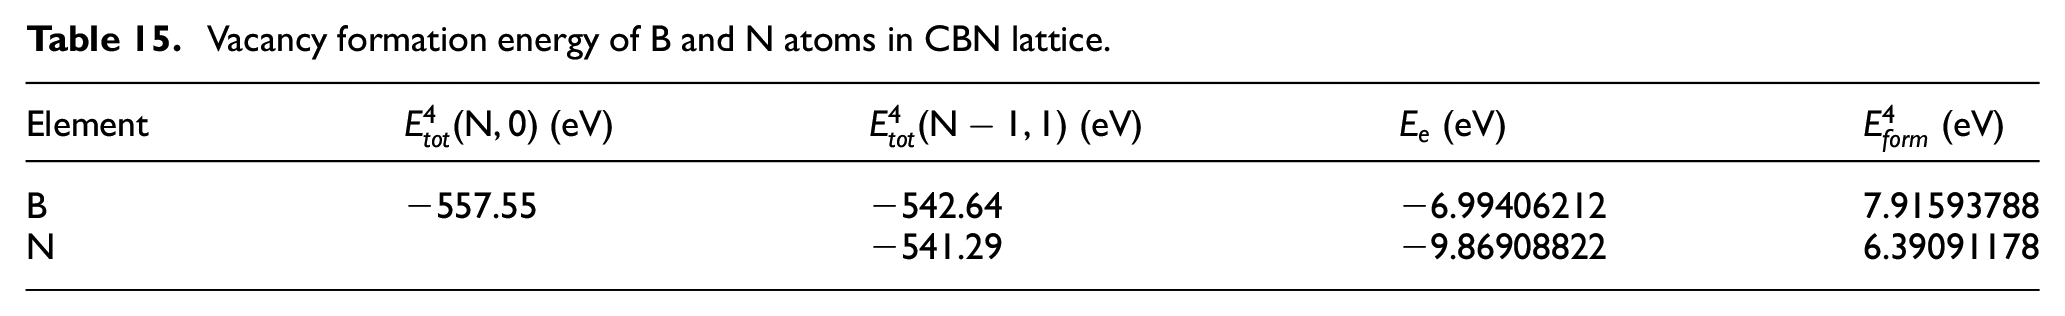
According to the dates shown in these tables above, although the formation energy of vacancy of B atom and N atom is much smaller than that of their interstitial atoms, it is much larger than the diffusion activation energy of atoms in the workpiece. Therefore, it is much more difficult to form vacancy in CBN tool lattice than that in the workpiece, which requires more kinetic energy. Under the same conditions, B and N atoms in the tool lattice are more difficult to diffuse than those in the workpiece.
Comparison of the difficulty of formation of substitution and interstitial doped atoms in CBN lattice
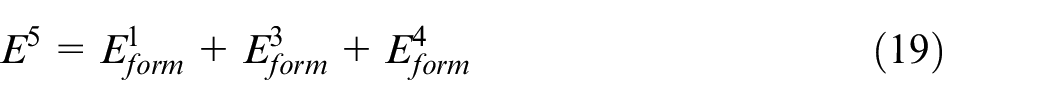
The energy required to form the substituted impurity atom is calculated by formula (19), and the result is shown in Figure 18. Figure 18(a) and (b) are the energy required for the workpiece atom, B atom and N atom to enter the CBN lattice type I gap and the type II gap respectively. The interstitial atom formation energy
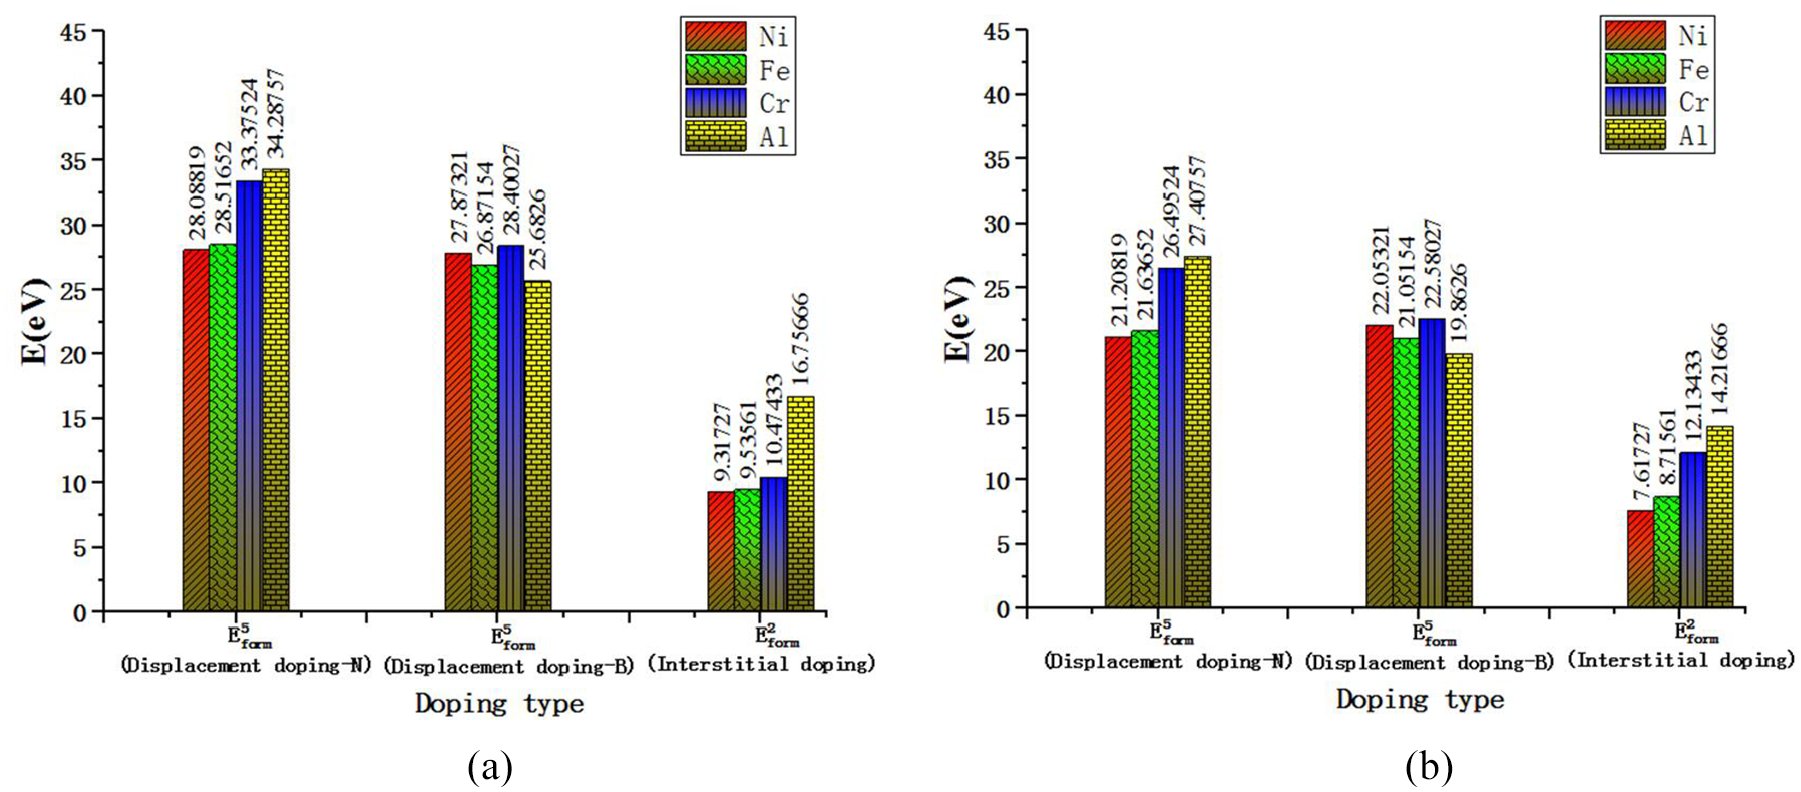
Comparison of the calculation results of
According to Figure 18, it can be seen clearly that compared with the workpiece atoms entering the CBN lattice gap, it is much more difficult for the workpiece atoms to replace the B and N atoms at the normal lattice point, and the energy required is very large, almost difficult to complete. In most cases, replacing B atom is easier than replacing N atom.
Conclusions
In this paper, a simplified model of CBN tool cutting Ni-based alloy in which Ni-Fe-Cr alloy was used as matrix and contains Ni3Al phase is established using molecular dynamics (MD) method. The atomic diffusion mechanism of workpiece in the cutting process is studied by observation, analysis, and energy calculation. The conclusions can be drawn as:
(1) The self diffusion activation energy of all kinds of atoms in different regions of the workpiece is calculated by molecular dynamics method. The results show that the self diffusion activation energy of the same atom in the crystal lattice of Ni-Fe-Cr phase and Ni3Al phase is greater than that of the atom at the grain boundary or phase boundary. In the cutting process, the atoms in the workpiece gain energy, which accelerates the diffusion. However, the activation energy of the self diffusion of the atoms at the phase boundary or grain boundary of the workpiece is relatively low, which is a fast channel for the diffusion of atoms. The atoms are more likely to diffuse to the tool-chip interface through the grain boundary and phase boundary.
(2) By comparing the self diffusion activation energy of different elements in different regions, it can be seen that the diffusion difficulty of different kinds of atoms in the lattice of Ni-Fe-Cr alloy is Ni > Fe > Cr. In Ni3Al lattice, Ni atoms are more easily diffused than Al atoms. The diffusion difficulty of different kinds of atoms at the phase boundary is Ni > Al > Fe > Cr. At the grain boundary, Cr atoms are the most easily diffused, followed by Fe atoms. Ni atoms are the most difficult to form diffusion.
(3) Through the visual analysis of the atomic motion in the cutting model and the atomic potential energy in the cutting tool, it is found that the Ni, Fe, Cr, Al atoms in the workpiece are more easily diffused into the tool grain boundary during the cutting process, while the diffusion into the tool lattice is relatively difficult. It is found that it is more difficult to form interstitial impurity atom than substituted impurity atom.
Footnotes
Appendix
Declaration of conflicting interests
The author(s) declared no potential conflicts of interest with respect to the research, authorship, and/or publication of this article.
Funding
The author(s) disclosed receipt of the following financial support for the research, authorship, and/or publication of this article: This work is supported by Natural Science Foundation of Jilin Province (20200201064JC) and National Natural Science Foundation of China (51605043).