
Abstract
This paper aims to solve the problem of laser cladding for complex parts, a trajectory planning method for complex parts is proposed. First, the part model is transformed into stereolithography (STL) files, the plane groups are established where the spacing of plane groups is determined by the overlap ratio, and the direction is perpendicular to the laser scanning. Further, to obtain the excellent cladding performance, a search algorithm based on the height error of adjacent cladding is proposed to select effective points. After this, adjacent points are clustered to a dataset according to the relative position that decided by the angle. Meanwhile, the position and the attitude of all points are calculated by the geometrical characteristics and then stored. The cooperate work of positioner and robot is adopted, the attitude of the current point is adjusted using the positioner, that is, the molten pool of the current point is in a horizontal state, which can ensure the forming accuracy of curved parts after cladding. Finally, the cladding experiment of curved surface parts is carried out. The results of the analysis showed that the coating had a smooth surface and a compact structure without defects. This method can be applied in other curved parts.
Introduction
With the rapid development of the modern manufacturing industry, the failure rate of complex parts working in a harsh environment is increasing every year.1,2 Laser cladding is an interdisciplinary technology that combines laser technology with computer-aided design and manufacturing, robot technology and powder metallurgy, which is applied in the repair of various parts.3–6 Complex surface parts are a kind of high value-added parts. In the process of laser cladding, due to the change of the surface curvature, the laser head needs to rotate continuously with a variable attitude. In laser cladding process, path planning has a great influence on the quality of cladding layers for complex parts.7–9 Currently, the existing research methods for cladding path planning of complex curved parts mainly focus on the following aspects:
Zhang et al. 10 have proposed an adaptive slicing method to generate layers of variable thickness, and the slices are merged according to the step width variation and minimum layer thickness. The method reflects variations in the profile contour curvature. Zheng et al. 11 optimized the stereolithography (STL) model for the turbine blade by the discrete Laplace mesh deformation method, and their experimental results of turbine blades STL model revealed that the smoothness of the layer shape and the uniformity of the model are both improved. Liu 12 proposed a cladding path method for free-surfaces based on the cutter path generated by computer numerical control (CNC) machines; They found that the feasibility of the robotic laser cladding system is improved. Yong et al. 13 proposed a constant arc increment interpolation method for laser cladding manufacturing, designed a Newton iteration algorithm based on Romberg integral, and experimentally demonstrated the effectiveness of the method. Tabernero et al. 14 and Calleja et al. 15 planned various kinds of laser cladding trajectories on a hemisphere based on the five-axis numerical control experimental platform.
The laser cladding process parameters play an important role in coating quality.16,17 To date, most studies have focused on the optimization of the laser scanning sequence, and most of the laser cladding path adopts the numerical control (NC) processing method. However, the process parameters of the NC and laser cladding are different. Thus the quality of the cladding coating prepared by NC path is not high and has difficulty in meeting the remanufacturing requirements of complex surfaces.
In this paper, to improve the machining efficiency, the intersection points are obtained by slicing the STL model of the curved part, according to the characteristics of laser cladding machining, the effective points are obtained by using the height error of adjacent cladding. Additionally, the path points on the surface with large curvature are clustered according to the relationship of adjacent points, which control the positioner to make the current point in a horizontal state. This method not only achieves the laser cladding path planning of complex curved parts but also improves the quality of the cladding layer.
Generation of the cladding trajectory
Slices of the surface and STL model
The three-dimensional model represented in STL format is referred to as the STL model, which is one of the industry standards of modern computer-aided design interface files. 18 The STL model includes normal vector and vertex coordinate data of triangles. In this study, a slicing algorithm based on a triangular meshes model is proposed. First, the three-dimensional model is transformed into STL files, and the vertex coordinates of each triangle are stored and checked. Duplicate data will affect the efficiency of calculation; only one valid data is retained. If not, the search is continued until all triangles are calculated, as shown in Figure 1.
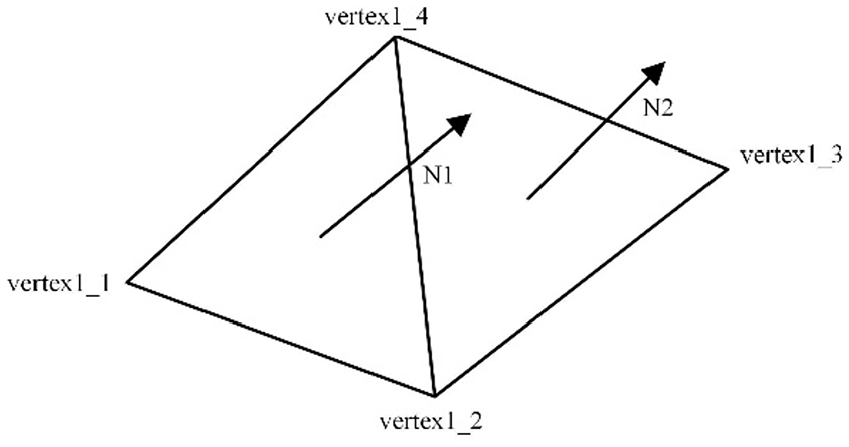
Schematic illustration of the triangular data.
To ensure the accuracy of the cladding trajectory, adjusting the position relationship between the part and the coordinate system according to the actual situation before executing the program. Generally, the initial position of the slice plane is determined by the minimum value after comparing the x, y, and z values of all vertices. Two parameters are affecting the plane group: direction and distance. The direction of the slice plane can be perpendicular to the laser scanning direction.
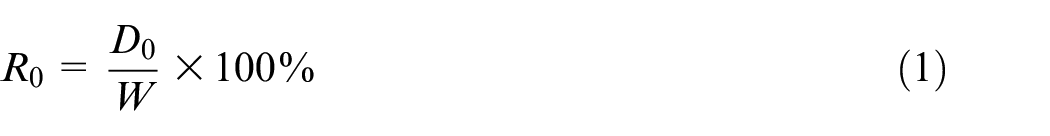
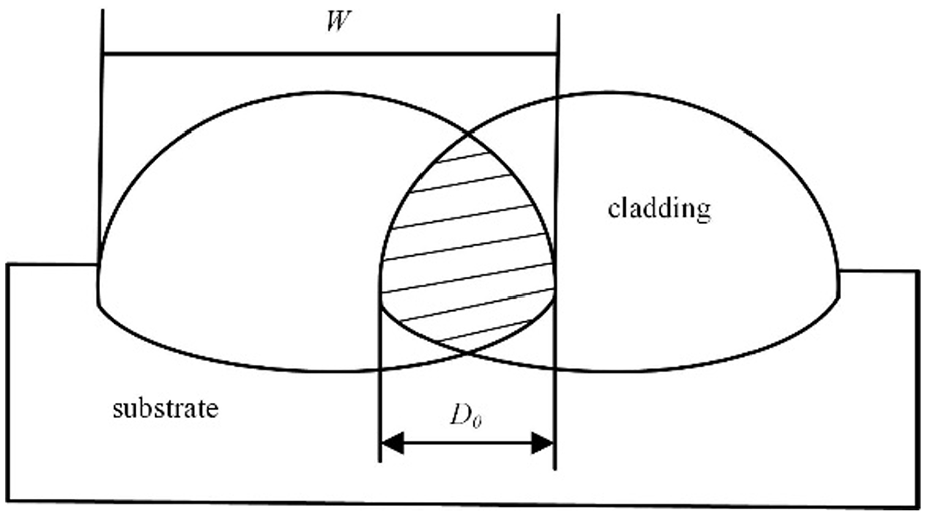
The lapping rate of cladding is calculated by the formula (1). As shown in Figure 2, the width of the overlap between two adjacent paths is D0, the width of the single cladding layer is W, and the ratio of D0 to W is the overlap ratio. 19 According to the existing literature, a 33% lapping rate is the most suitable for actual processing. 20 Therefore, the intersect model of the bias surface group with the STL model is presented in Figure 3.
Lapping rate of cladding.
STL slices: (a) diagram and (b) model.
Generation of trajectory interpolation points
The points obtained from the above method are too dense to be used in the actual laser cladding process because it will lead to low efficiency and huge thermal stress.
21
However, if the distance between adjacent points is too large, the laser energy cannot be distributed uniformly. Therefore, it is necessary to select a reasonable number of interpolation points from the intersection point set. The path points are searched using the limit value of the cladding height error
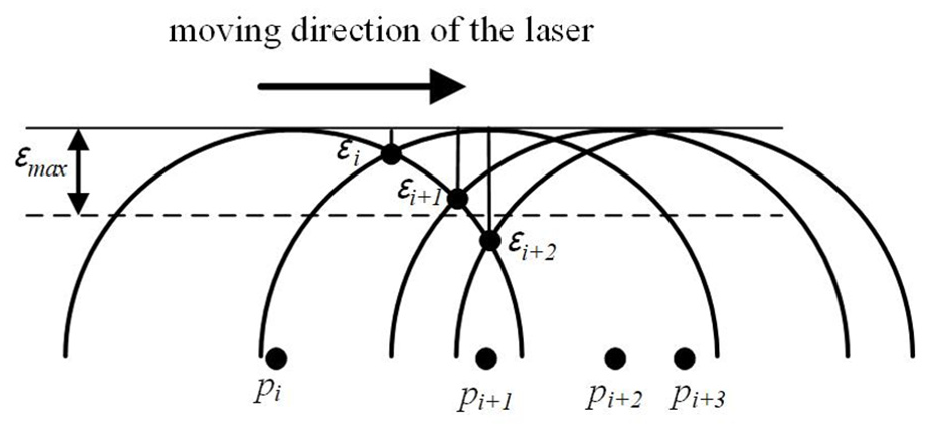
Search for cladding processing points.
Trajectory planning
Cluster analysis of trajectory points
Curved surface parts have the characteristics of wide curvature range and complex shape. 23 The curvature is the internal feature of the surface, and it does not change with the movement and rotation of the surface. If using the traditional laser trajectory planning method in the cladding process, some problems, such as the heavy workload of the robot, the poor forming quality will arise. To solve this problem, clustering the point set is proposed, and the seventh axis strategy of the robot is adopted, which combining the positioner and laser robot and controlling the positioner effectively.
As shown in Figure 5, P1, P2, P3, … Pn are the path points, Li (i = 1,2,3…n) are the connecting line of the two adjacent points, the angle θ i (i = 1,2,3…n) of the adjacent lines is calculated, and the correlation relationship is judged. It can be seen that θ1–θ 5 is a clockwise relationship, then the corresponding P1–P5 are classified as RS1. θ6–θ 8 is a counter-clockwise relationship, then the corresponding P6–P8 are classified as RN1; According to the above steps, all the track points are divided into RSi (i = 1,2…n) or RNj (j = 1,2…n) and stored respectively. The clustering results are shown in Figure 6, x is set to the direction of the slice group, and y is set to the scanning direction of the laser, red points represent RS, and blue points represent RN.
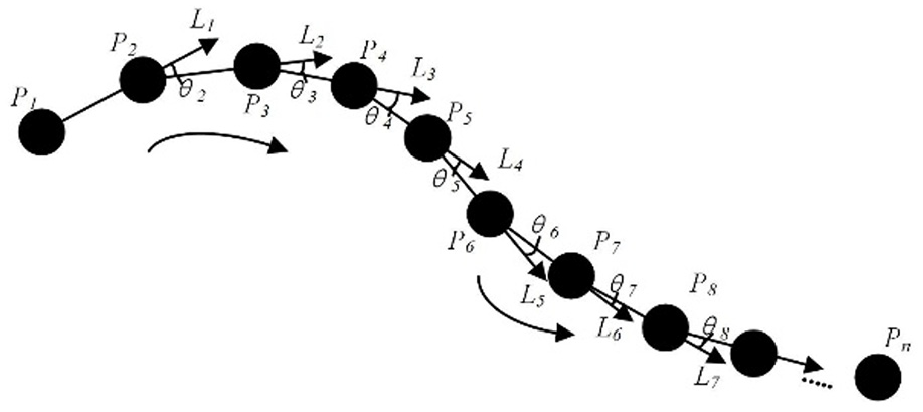
Schematic diagram of track point division.
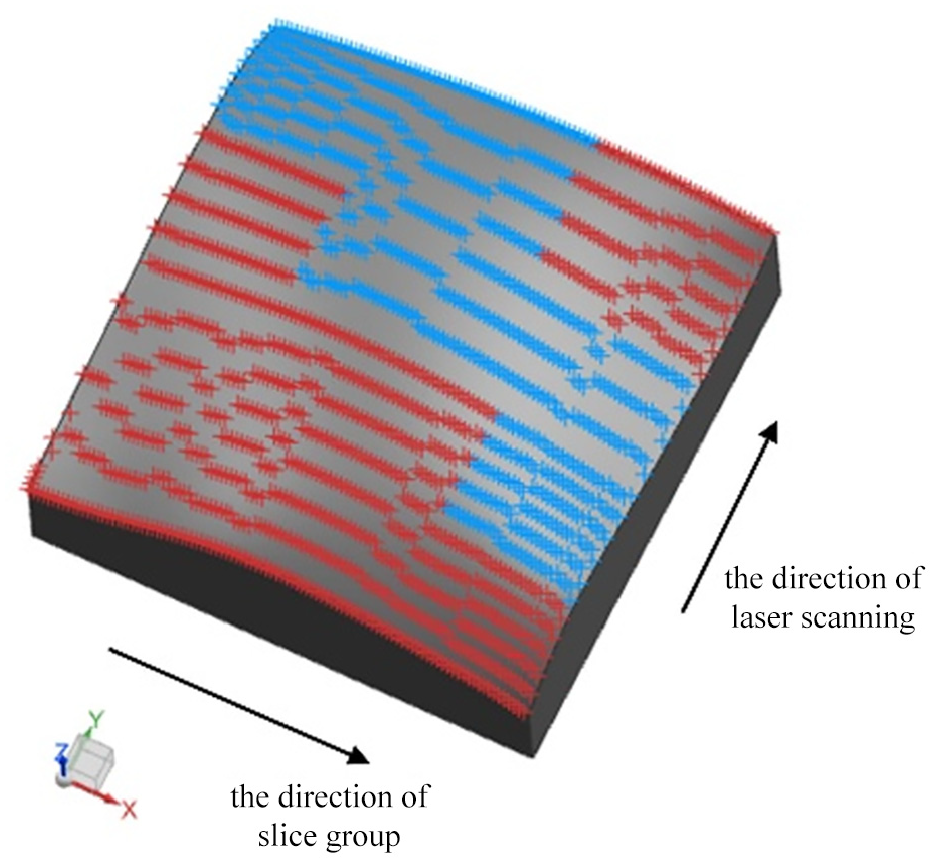
Clustered path points.
Generally, an ideal cladding quality can be obtained when the laser attitude coincides with the normal vector of the current point. According to the differential geometry of the surface, the partial derivative to u of a cladding point on the surface is the u-tangent vector
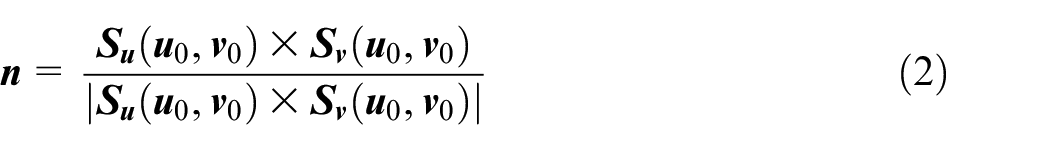
Finally, all normal vector of path points on the surface are calculated as shown by the yellow arrow in Figure 7.
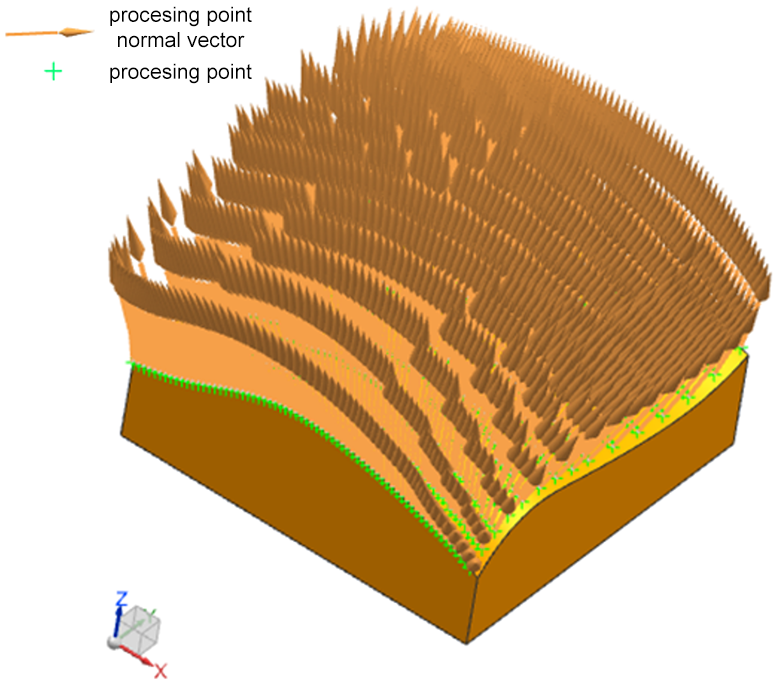
The normal vector of the path points.
The attitude of the laser head at each point is obtained by moving the surface points a certain distance along the vector.
The coupling model of the robot-positioner
When repairing curved surface parts, it is difficult to obtain the required cladding quality without a positioner. Still, the application of a positioner can not only ensure the performance of the cladding layer but also protect the laser equipment. The current processing point is adjusted to the ideal position by the positioner, that is, the molten pool is in a horizontal state, which reduces the change of the laser attitude.
The positioner coordinate system with components and joints, as shown in Figure 8. The coordinate system of the positioner is constructed with the joint coordinate system P1X1Y1Z1 and joint coordinate system P2X2Y2Z2.
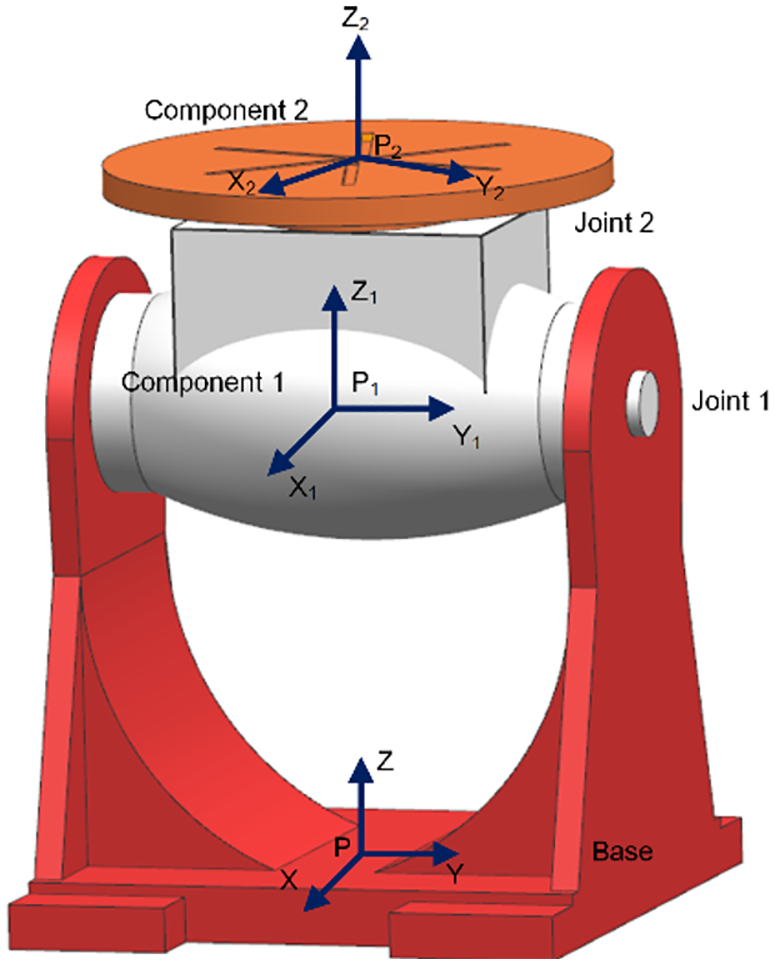
Positioner coordinate system.
The posture of the workpiece in the base coordinate system is as follows:
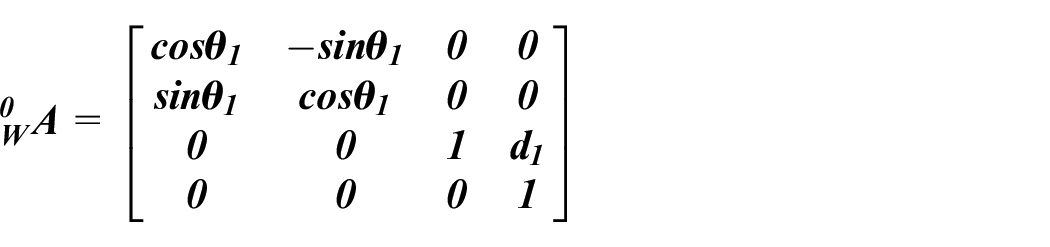
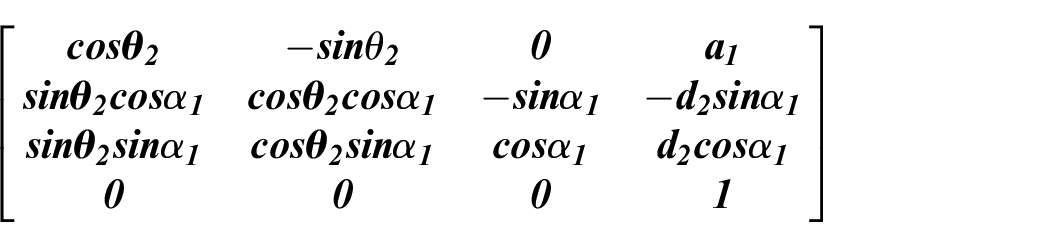
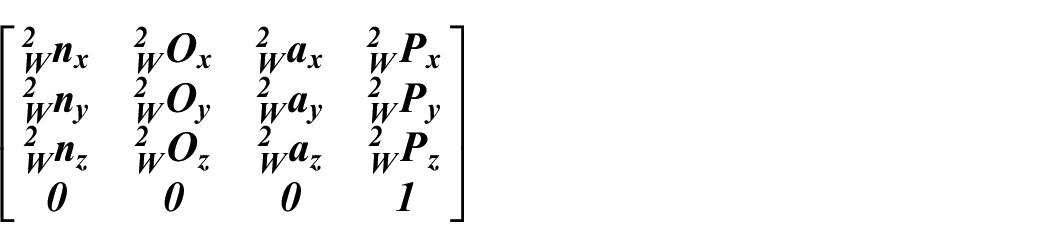

where
At the interpolation point, the workpiece coordinate system

The attitude of the beam can be obtained with the tool coordinate system (TCP), as shown in Figure 9. Besides, the transformation between the tool coordinate system and the common coordinate system can be expressed as:
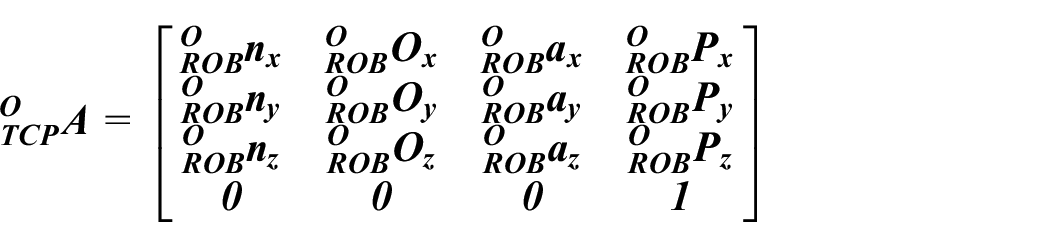
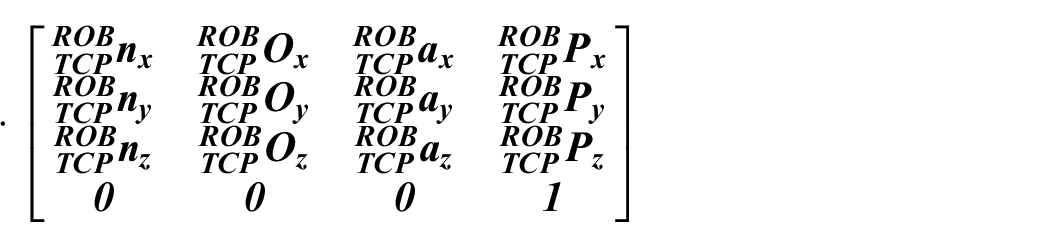

where
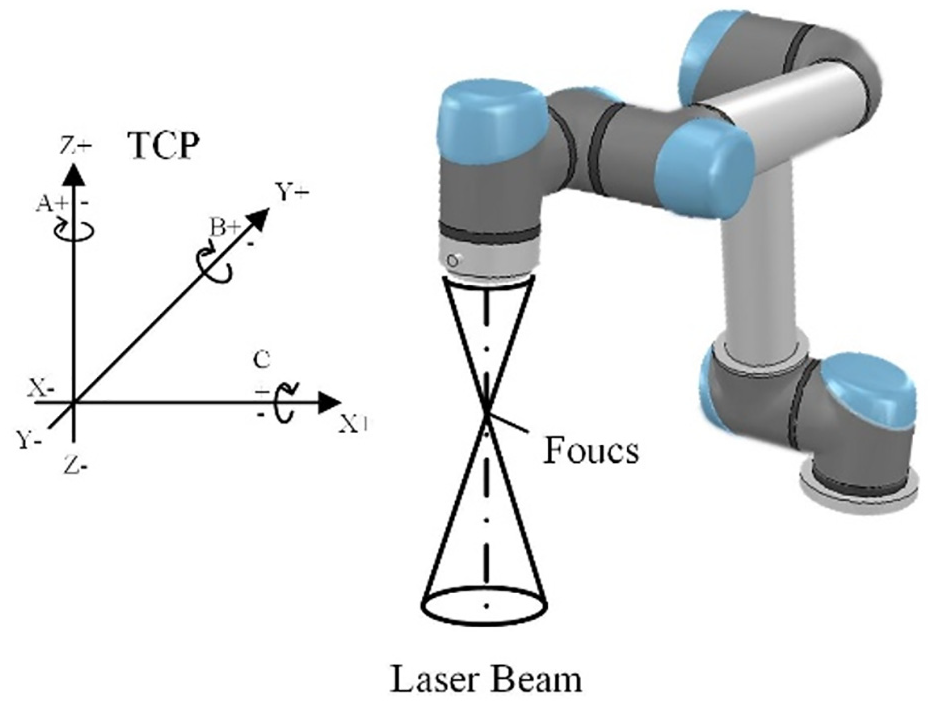
Robot tool coordinate system.
According to the relationship between the trajectory interpolation point on the rotary joint of the positioner and robot end tool, the kinematics model of the positioner and the robot is also established. Increasing the distance along the interpolation point vector can meet the requirements of the laser remanufacturing process. In contrast, the laser head coincides with the interpolation point vector. Based on this requirement, the coupling model in the common coordinate system is as follows.


Combining the above formulas and information of interpolation points, when the molten pool of trajectory point is in the horizontal state, the robot angle can be obtained by the robot controller.
Experiment results and analysis
Experimental equipment and process parameters
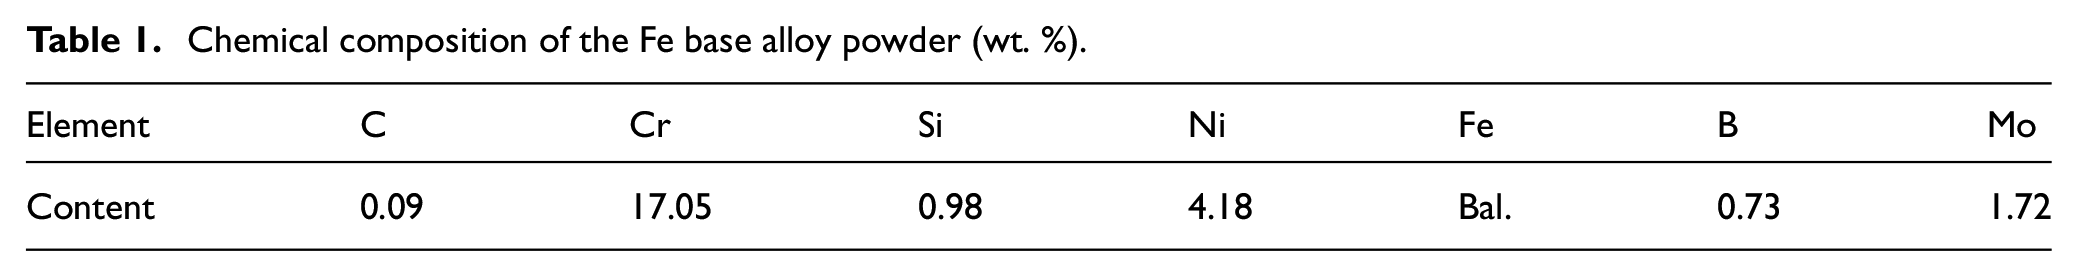
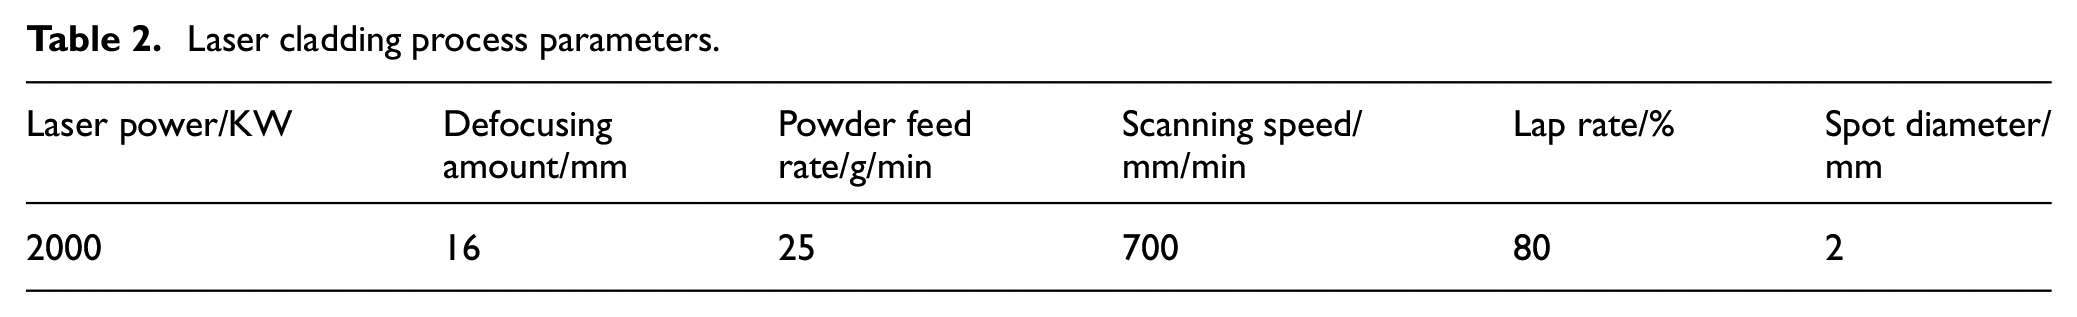
A laser cladding experiment is performed on a complicated part. As shown in Figure 10, the experimental equipment included the fiber laser, coaxial powder feeder, and shielding gas (argon). The substrate material of the component is 45# steel, and the cladding material is Fe-based powder, whose chemical composition is shown in Table 1. The laser cladding parameters are given in Table 2.
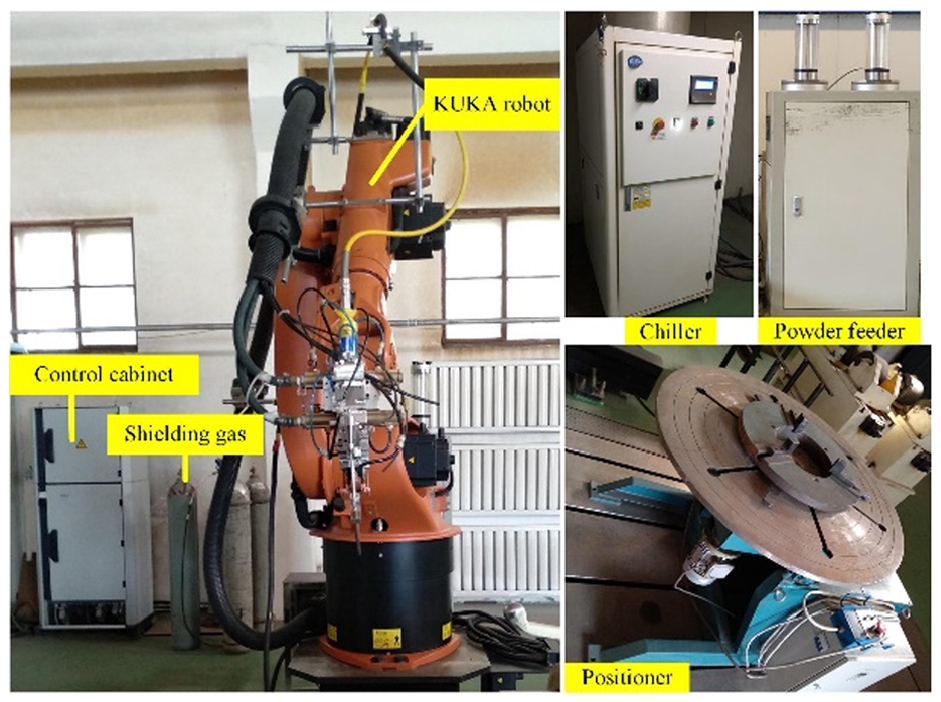
Laser cladding system.
Chemical composition of the Fe base alloy powder (wt. %).
Laser cladding process parameters.
Analysis of morphology and thickness
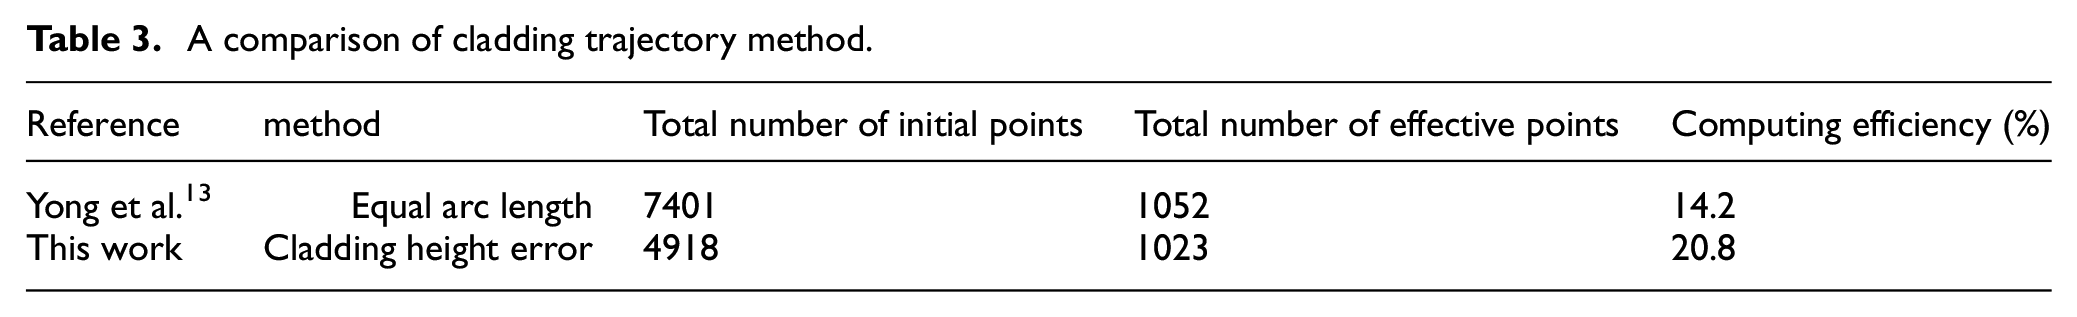
To verify the feasibility of the proposed algorithm. Table 3 is a comparison between the algorithm in this paper and that in Yong et al., 13 which shows that the method can reduce the complexity of point cloud data and improve the search efficiency of actual path points. Figure 11 shows the contrast of the curved surface parts before and after cladding. It is clear to see that the algorithm can obtain a smooth cladding layer without cracks or other defects.
A comparison of cladding trajectory method.
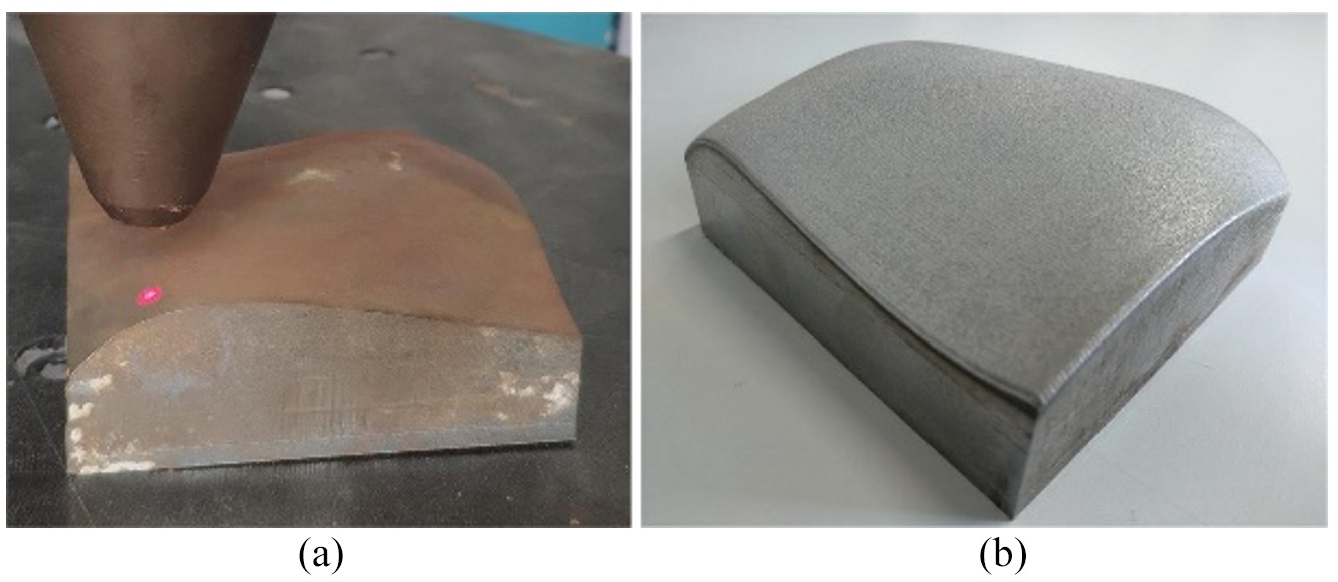
The contrast of the curved surface parts: (a) before and (b) after cladding.
To measure the thickness of the coating, we defined the 10 cladding layers from the left end of the curved part are sample1, and 10 cladding layers from the right end of the curved part are sample2. Take the overlapping area of adjacent cladding as the measurement object, that is, there are 9 measurement objects in 10 cladding layer, each object are measured three times, and take the average value as the thickness of the object as shown in Figure 12. Figure 12(a) is the thickness of sample1, and Figure 12(b) is the thickness of sample2. It can be seen that the thickness of the coating surface has little change range, indicating that the smooth coating with high forming quality can be obtained by this method.
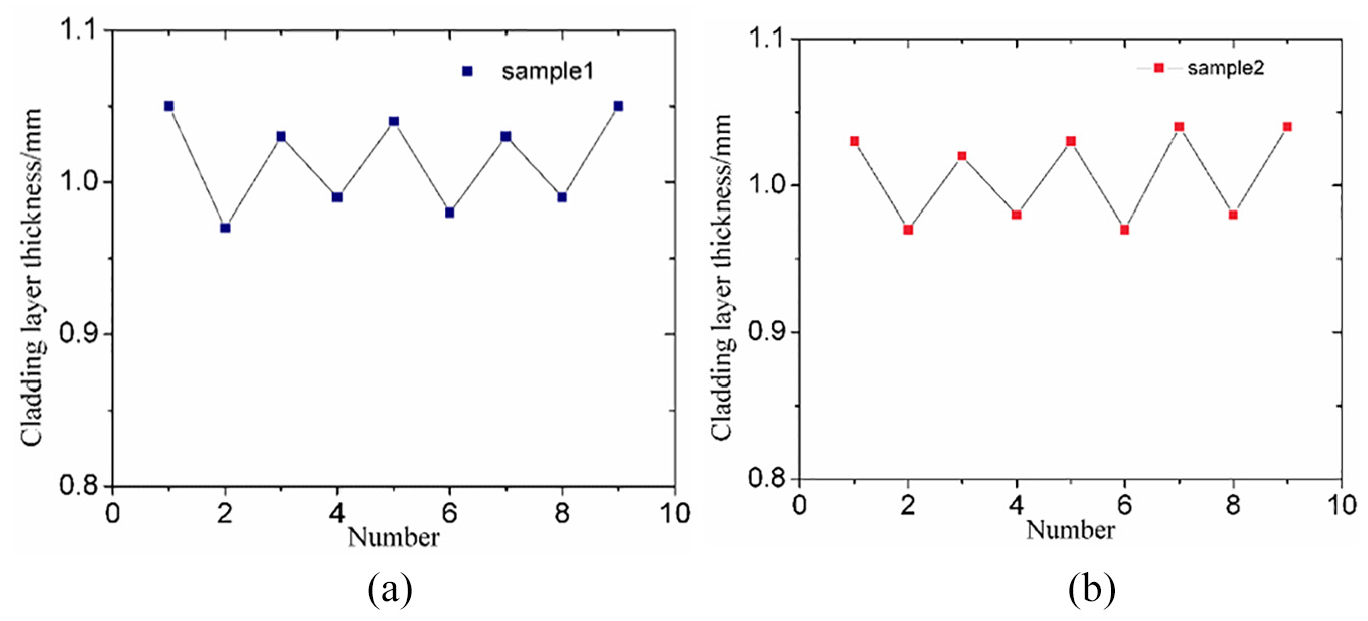
Thickness distribution of cladding layer: (a) sample1 and (b) sample2.
Analysis of the macrostructure and microstructure
The microstructure of the cladding layer was studied. The samples were cut perpendicular to the laser scanning direction, and the cross-sections were polished. Then, the samples were corroded with aqua regia for 10–15 s. Figure 13 shows the optical microscopy images of the microstructures of the cross-section.
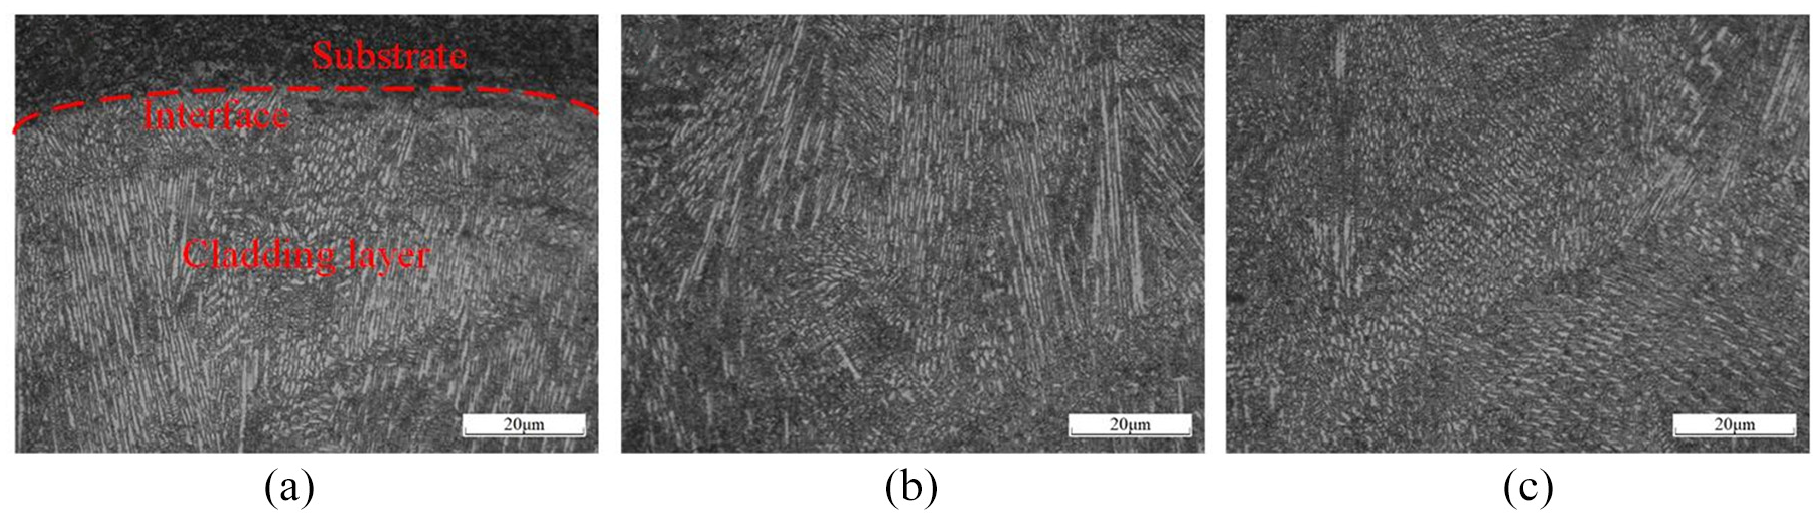
OM micrograph of the cladding layer.
It can be seen that a great metallurgical bonding between the substrate and coating is formed. Meanwhile, the coating has a tight structure and uniformly distributed particles.
The scanning electron microscopy (SEM) images of the coating are presented in Figure 14. It is clear that the microstructure from bottom to top areas are different. In the bonding zone, there are large temperature gradients, and the crystallization rate is relatively low, which is beneficial to maintain the balance of the solid-liquid interface. Accordingly, planar crystals are developed, as shown in Figure 14(a). With the progress of solidification, the temperature gradient decreased, and the crystallization rate increased. At this moment, the balance of the solid-liquid interface was broken, leading to the growth of cellular crystals and columnar crystals along the direction perpendicular to the interface, as shown in Figure 14(b). As time passed, the undercooling degree of the component is significantly increased, and as a result, the nucleation rate is high. Therefore, numerous non-directional equiaxed dendrites are formed at the top of the coating, as shown in Figure 14
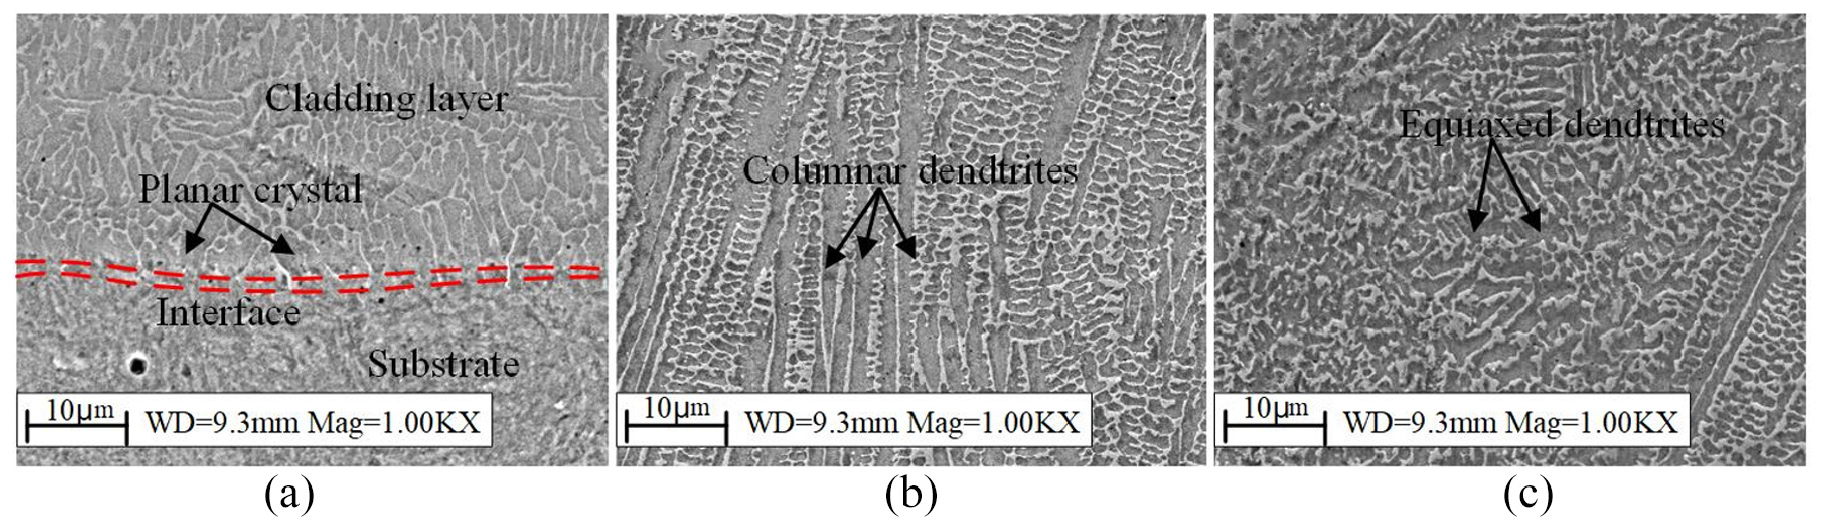
Cladding layer microstructure of bonding zone: (a) bond zone (b) middle zone and (c) top zone.
Microhardness
For microhardness measurements, eight melting channels were selected on the curved surface, and 10 points were selected on each channel. The first test point was selected at the top of the cladding layer, then 9 points were evenly measured along the direction perpendicular to the interface. The distribution of the microhardness of the cladding layer is presented in Figure 15. The coating hardness fluctuates in the range from 640 to 680 HV and significantly higher than that of the substrate. Meanwhile, the hardness of each cladding layer exhibits the same trend, indicating that the cladding quality of the curved surface part is excellent.
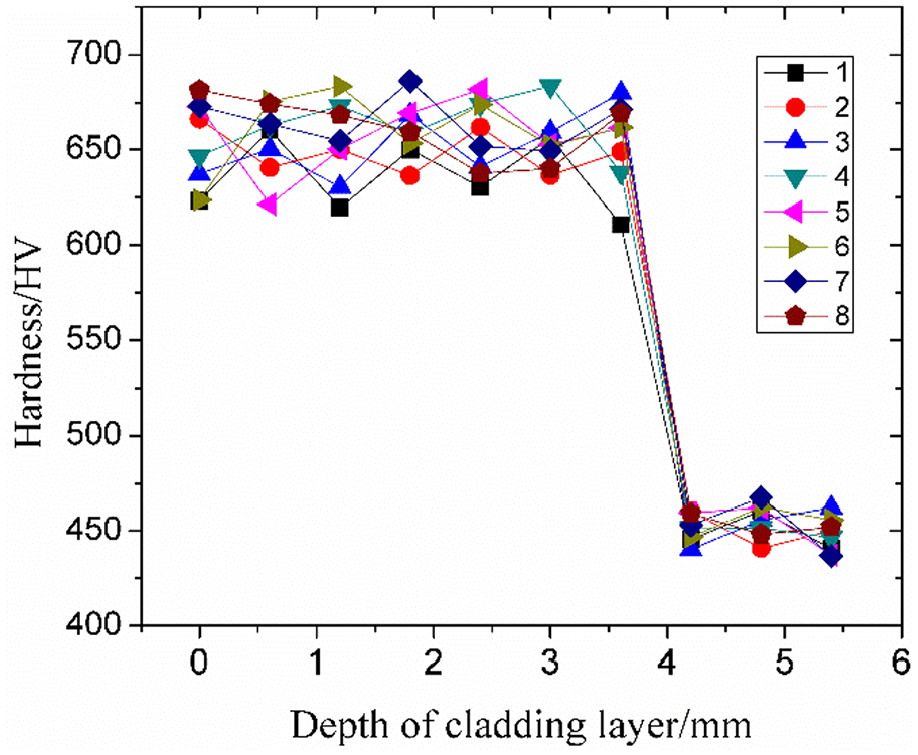
Distribution of the microhardness along the depth direction.
Conclusion
In this paper, the trajectory planning method of laser cladding for a curved surface is investigated, and the experiment for curved parts is carried out to verify the effectiveness of this method. The following conclusions are drawn:
A method of the plane group is used to slice the STL model, the spacing of the adjacent plane is determined by the overlap ratio, and the intersections of the STL model with the plane group are calculated. In order to improve the accuracy of the scanning trajectory, a searching method is proposed. The effective process points are obtained according to the maximum cladding height error.
An algorithm for clustering the point set is proposed. The angle between adjacent points is calculated, when the angle has a similar change, considering the corresponding points into one class. Then, the position and attitude of trajectory points are calculated, which enables the positioner to adjust the molten pool attitude of the current point to the horizontal state. The method can reduce the rotation frequency of the robot and obtain a coating without defects.
There is a good bonding between the substrate and the cladding layer, the microhardness value of the coating is clearly higher than that of the substrate, which proves the reliability and feasibility of the method. Therefore, the method can especially be used in parts that greatly changed curvature.
Footnotes
Declaration of conflicting interests
The author(s) declared no potential conflicts of interest with respect to the research, authorship, and/or publication of this article.
Funding
The author(s) disclosed receipt of the following financial support for the research, authorship, and/or publication of this article: This work was supported by the Major Science and Technology Special Subsidy Projects in Karamay City, Xinjiang (No. 2018ZD002B); Research projects of universities in Xinjiang Uygur Autonomous Region in 2019 (XJEDU2019Y064); The Natural Science Foundation of Xinjiang Uygur Autonomous Region (Grant No. 2017D01C062).