
Abstract
Wire and arc additive manufacturing (WAAM) is a promising technology for manufacturing large-sized metal components. However, the material shortage region (MSR) at the edge of each slicing layer can influence the forming precision and surface flatness of components. To solve these problems, this paper proposes a shape follow-up edge cycle compensation (SECC) method and model for predicting the weld width and weld height to improve the efficiency of the WAAM process. First, the prediction model was used to determine the weld width and weld height for various welding parameters. The predicted width was then used to obtain the optimal overlap distance, and the filling path of each layer was generated. The same weld height was used for slicing of the 3D model and the tool path compensation cycle was generated. Second, the influence of the MSR on the morphology of multi-layer multi-bead (MLMB) components was analyzed. The MSR results in a height difference between the edge height and the middle height of every deposited layer, and the height difference increases as more layers are added and the height of the component increases. Furthermore, the influence of the MSR gradually extends from the edge to the middle, such that the upper surface presents a parabolic shape. Finally, a mathematical model was established to determine the height difference based on the area of the MSR. When the height difference reaches the weld height, an edge compensation weld is added to eliminate the height difference. Our experimental results show that the proposed forming control strategy improves forming precision and surface flatness. The method is highly feasible and can be applied to a wide range of WAAM applications.
Introduction
Wire and arc additive manufacturing (WAAM) is a direct manufacturing technology that synchronously melts wires to form the metal part layer by layer on a substrate. Compared with traditional manufacturing methods, WAAM has several advantages including a simple device, short production cycle, high material utilization, low manufacturing cost, and the ability to produce large components from a wide range of materials. Thus, WAAM technology is widely used in the aerospace, automotive manufacturing, defense, and other manufacturing fields.1–3
In WAAM, the most important performance parameters are forming ability and forming quality of complex components. A great deal of research has been performed on three aspects, in particular: (1) equipment and process control, (2) welding parameters and method optimization, and (3) thin-walled component path planning methods.
To achieve equipment and process control, industrial robots and computer numerical control (CNC) systems are widely used in additive manufacturing owing to their flexibility, maneuverability, and high forming accuracy.4,5 Zhang et al. developed a rapid manufacturing system comprised of an RP system of industrial robots, an arc welding system, and path planning software. Path planning software realized 3D model slicing, path planning, and process control, while the system controlled the surfacing process in real-time by detecting the droplet size and transition frequency. 6 Karunakaran et al. applied positioners in the additive manufacturing process and developed a slicing algorithm for thin-walled components that can realize rapid manufacturing of variable curved surfaces and complex spatial geometries. 7 The distance between the welding torch and the substrate was found to have a large impact on the forming accuracy and surface quality. If the distance is too great, spatter is generated. Xiong and Zhang developed a visual sensing system to monitor and adjust the working distance between the welding gun and the substrate in real time, thereby reducing spatter. 8
The welding method, welding parameters, weld overlap ratio, and forming control method have an even greater influence on the forming quality of single-layer single-bead and single-layer multi-bead components. Yang et al. studied the influence of process parameters on the size of single-layer single-bead components and established a model for predicting the size of the straight arm based on the quadratic regression method. 9 Xiong and Zhang established a model to predict the weld appearance based on the back propagation (BP) neural network and obtained the optimal welding parameters. 10 Xuewei et al. fitted weld profiles to parabolic, cosine, and arc curves, and showed that the weld section and parabola exhibit the highest degree of fit. 11 Ding et al. studied the effect of weld overlap on surface flatness and proposed an ideal overlap model. The upper surface was shown to have the highest flatness when the area of the re-melted region and the area of the valley region are equal. Moreover, the optimal center distance is d = 0.738w. 12 Aiyiti et al. studied the relationship between weld width-height ratio, center distance, and overlap ratio. Surface smoothness, tensile strength, and elongation were superior when the width-to-height ratio was large. 13
For thin-walled component path planning, Ding et al. proposed the medial axis transform (MAT) path planning method. The central axis of each two-dimensional contour is extracted with the central axis as the starting contour, and a filling path is generated from the inside out. The MAT method eliminates pores in the geometric center. 14 Liu et al. proposed a composite path planning method and sharp angle correction strategy for solid components combining the zigzag path and contour offset path to eliminate pores in the geometric center. The sharp corner correction strategy was able to correct the inflexion path when the sharp angle was less than 58.65 degrees. 15 Florent et al. studied the zigzag path and contour offset path and proposed the MPP method, which decomposes complex geometries into multiple simple contours and selects the appropriate path planning method based on the characteristics of each region. 16
Through extensive research, WAAM technology has rapidly improved over the past decade. High forming accuracy has been achieved for thin-walled components (single-bead multi-layer components),17,18 as well as high flatness of single-layer multi-bead weld surfaces,
19
and various paths planning algorithm have been proposed for different geometric shapes.
20
In contrast, the forming accuracy and surface flatness of multi-layer multi-bead (MLMB) components are generally low. This has prompted further studies on the MLMB forming process. Li et al. analyzed the effects of the arc striking or arc extinguishing position and welding direction of each layer on the forming accuracy of cuboid components. The effect of molten pool flow on the surface morphology of formed components was analyzed and weld overlap was offset by a certain distance to improve forming quality (offset distance:
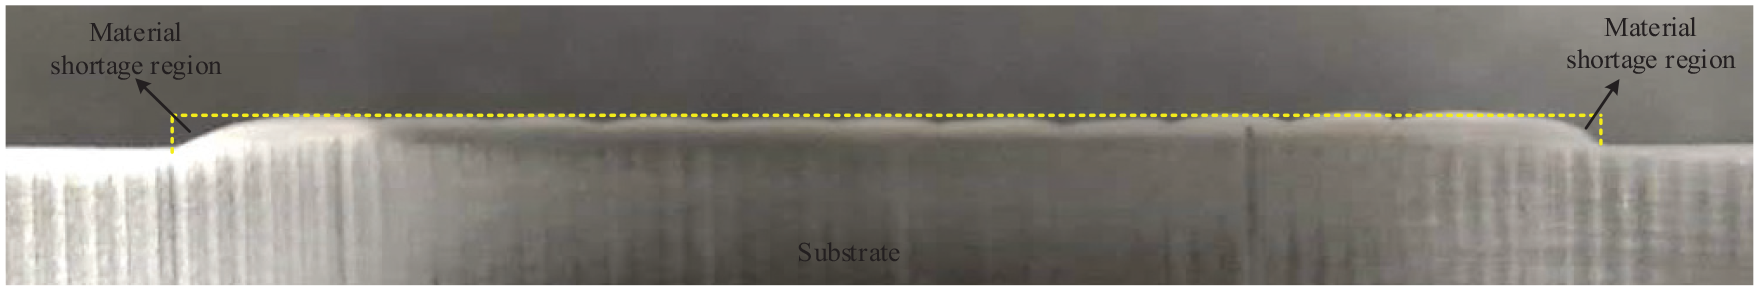
The above-mentioned research has focused mainly on the optimization of the forming process parameters in single-layer multi-bead components, the path planning algorithm of complex two-dimensional contours, and the post-processing of formed parts. However, there is little research on the overlapping conditions of multi-layer multi-bead components. Through a large number of multi-layer multi-bead surfacing experiment, it is found that the edges of the components are collapsed presenting different geometric shapes. There is a large difference between the geometry of the actual formed part and that of the three-dimensional model. By analyzing the multi-layer multi-bead overlap model, it is revealed that the material shortage region at the weld edge leads to the collapse of the component edge. Figure 1 shows the cross-sectional profile of a single-layer multi-bead weld. The profile of the weld overlap area (between the dashed blue lines) is nearly a straight line, whereas the non-overlapping area is a curve (indicated by the curved dashed red lines). Material shortages can be observed in the areas enclosed by the dashed red lines. For every layer, MSRs are present at the weld edges. As the height of the component increases, the MSR will have a greater impact on the overall shape of the component.
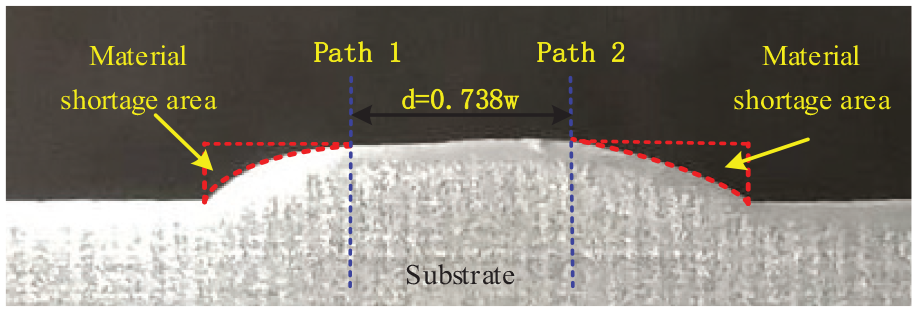
Schematic diagram of the material shortage region.
The aims of the preliminary research presented in this paper were: (1) to improve the MLMB forming process and (2) to realize efficient automation of the path generation process. First, an MLMB overlap model was established to analyze the influence of the MSR on the morphology of the finished component. A mathematical model of the edge weld overlap is proposed that can be used to determine the area of the MSR. The SECC method is proposed to eliminate the MSR, reduce the amount of post-finishing required, and improve material utilization. Second, parameters of the path planning algorithm can be determined and used to obtain the slicing height and edge compensation path cycle and the offset distance according to the weld height and weld width, respectively. Welding parameters can vary widely and have a strong nonlinear mapping relationship to the weld width and weld height; therefore, if the welding parameters change, it is necessary to remeasure the width and height of the weld. To improve the welding efficiency, a model to predict weld width and weld height is established based on the gradient descent algorithm. Finally, the SECC method and the WHP model are combined into a single path planning algorithm. The proposed forming process of MLMB components is shown in Figure 2.
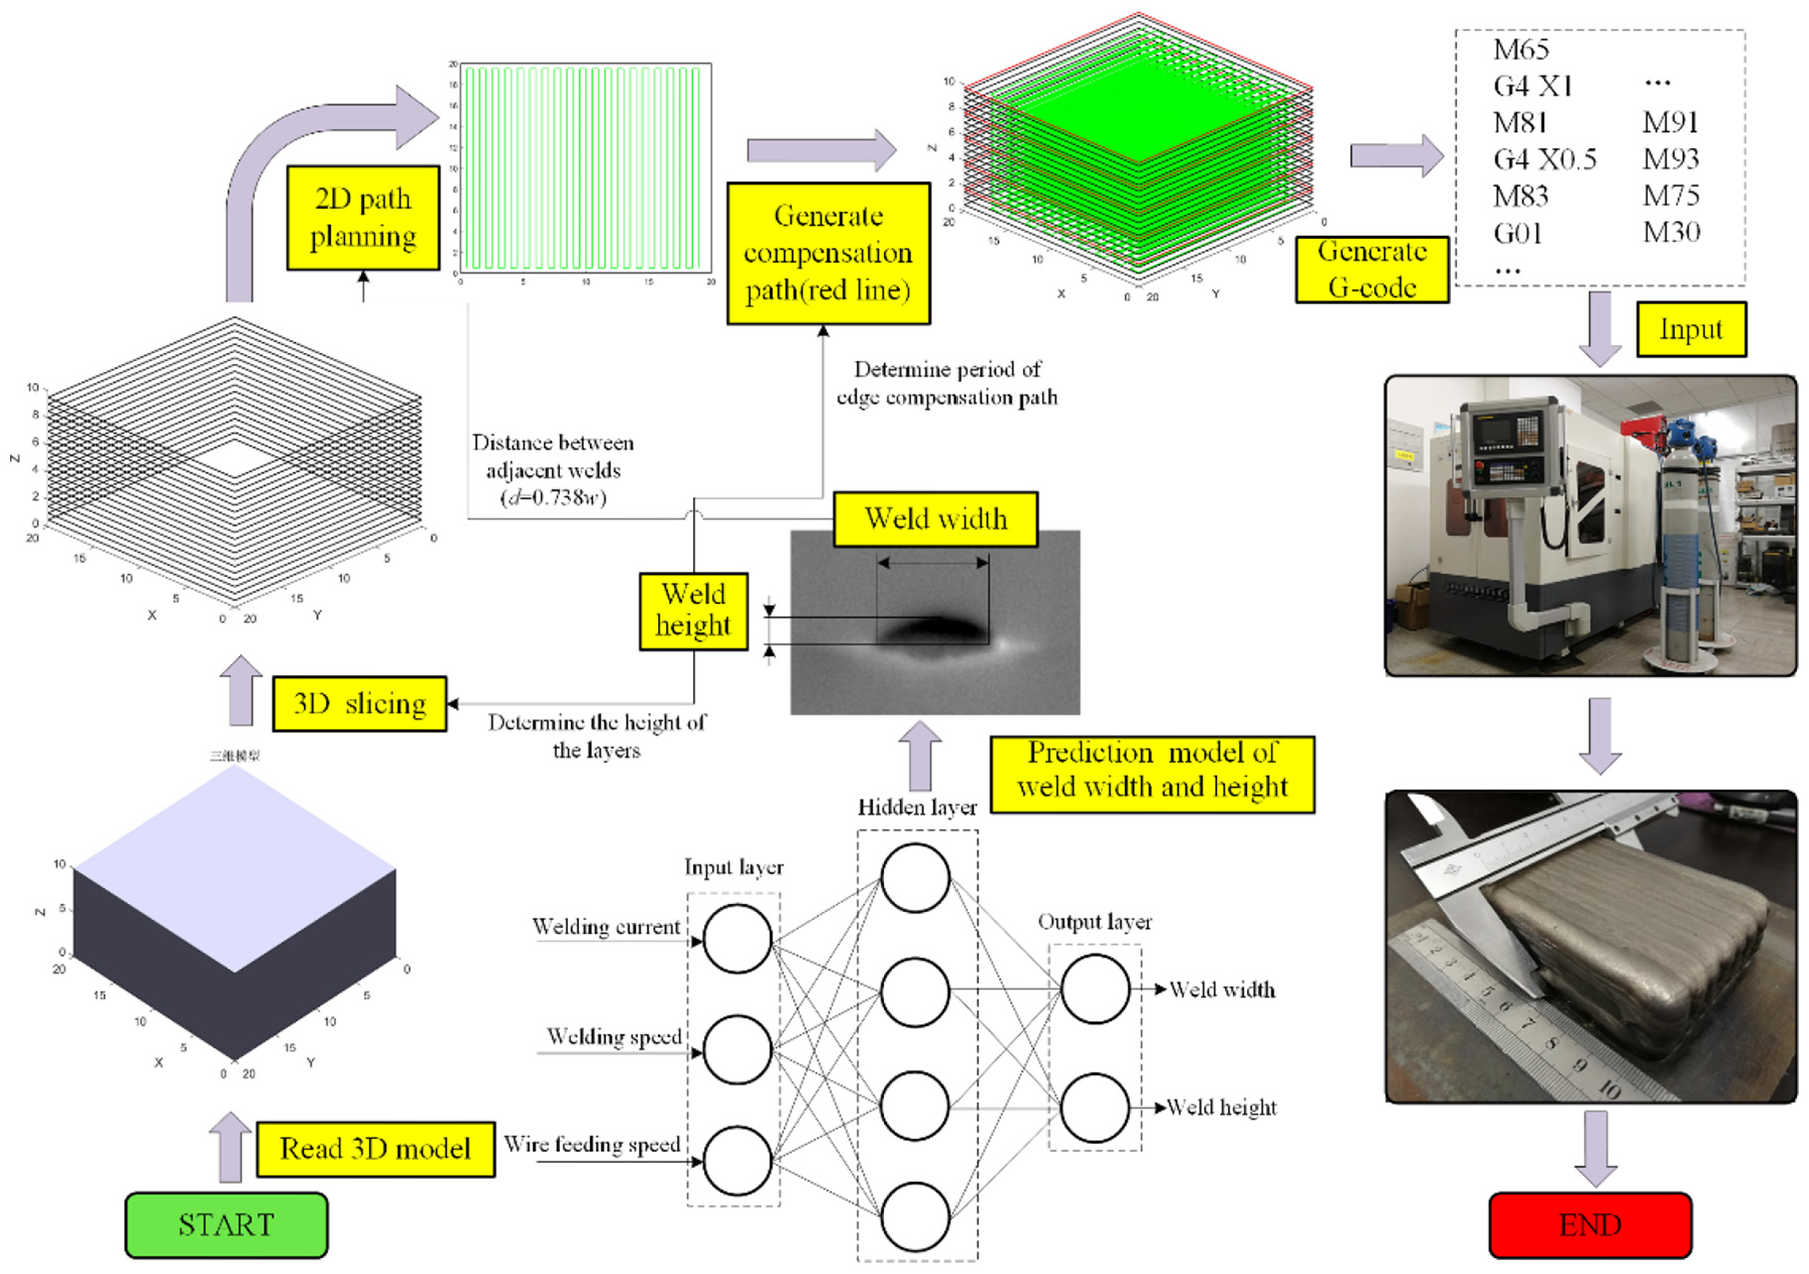
Forming process of multi-layer multi-bead (MLMB) components.
Establishment of neural network model to predict weld geometry
In this paper, a neural network model with three inputs and two outputs is introduced to predict the weld geometry under different welding parameters. There are three neurons in the input layer and two neurons in the output layer. The input data are the welding current, welding speed, and wire feeding speed and the output data are weld width and weld height. Figure 3 shows the neural network model to predict weld width and weld height. In addition, the model can be used to obtain the slicing height, edge compensation path cycle, and center distance of adjacent welds.
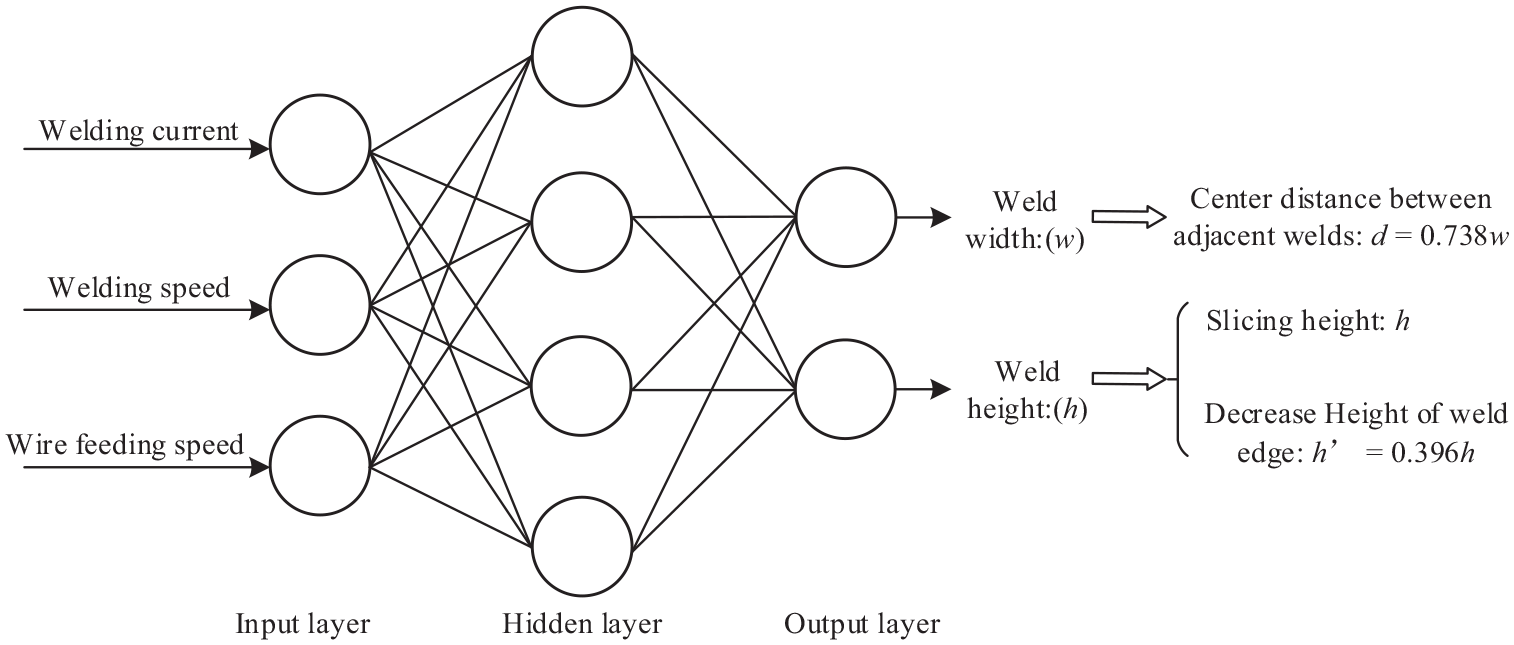
Neural network prediction model.
Specific steps for training the neural network model are as follows:
(1) Set the initial parameters. Set the weights and biases between (−1, 1), convergence accuracy
(2) Perform forward propagation of the input data. In the neural network, after multiple nonlinear transformations in the hidden layer, the input data are output in the output layer. The number of neurons in the hidden layer is determined as,

where n is the number of neurons in the input layer, m is the number of neurons in the output layer, and a = (1, 10). The output data are expressed as,
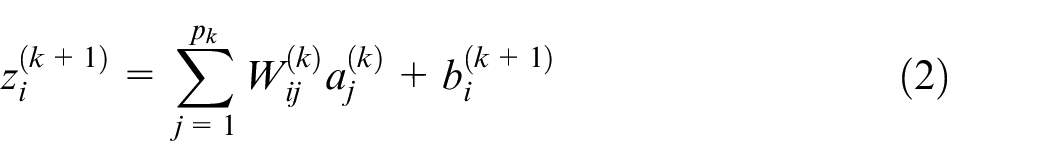
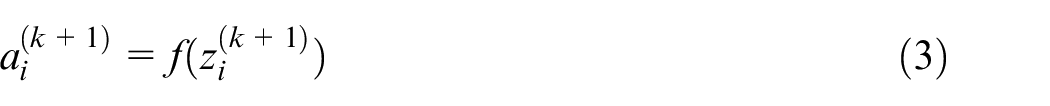
where k is the total number of layers,
(3) Reverse optimize the data. The gradient descent method is used to continuously adjust the weights and biases so that the total loss value E converges.
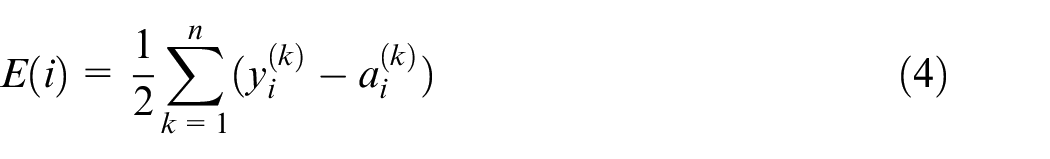
where
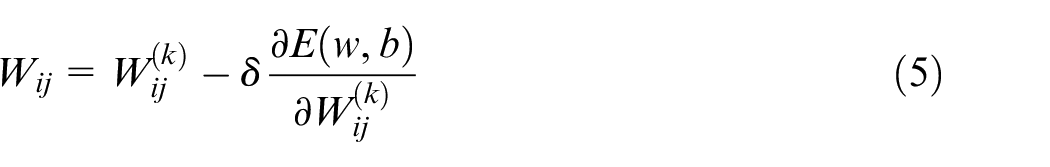
① Weight updating:
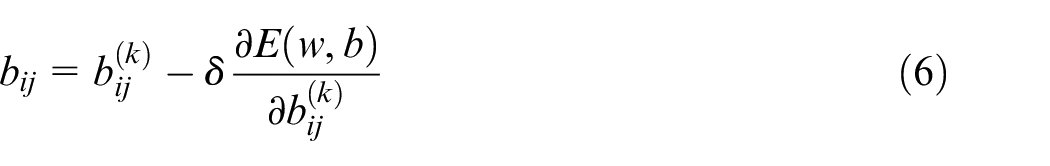
② Bias updating:
The neural network model to predict weld width and weld height is trained using the above steps until the output error is less than the preset convergence accuracy or the training time exceeded the preset maximum training time. The training results and prediction errors are presented in Figure 4. For welding, there is still a large error in weld geometry under the same welding parameters. The maximum error is 0.295 mm for the weld width and 0.126 mm for the weld height. Therefore, the model meets the requirements.
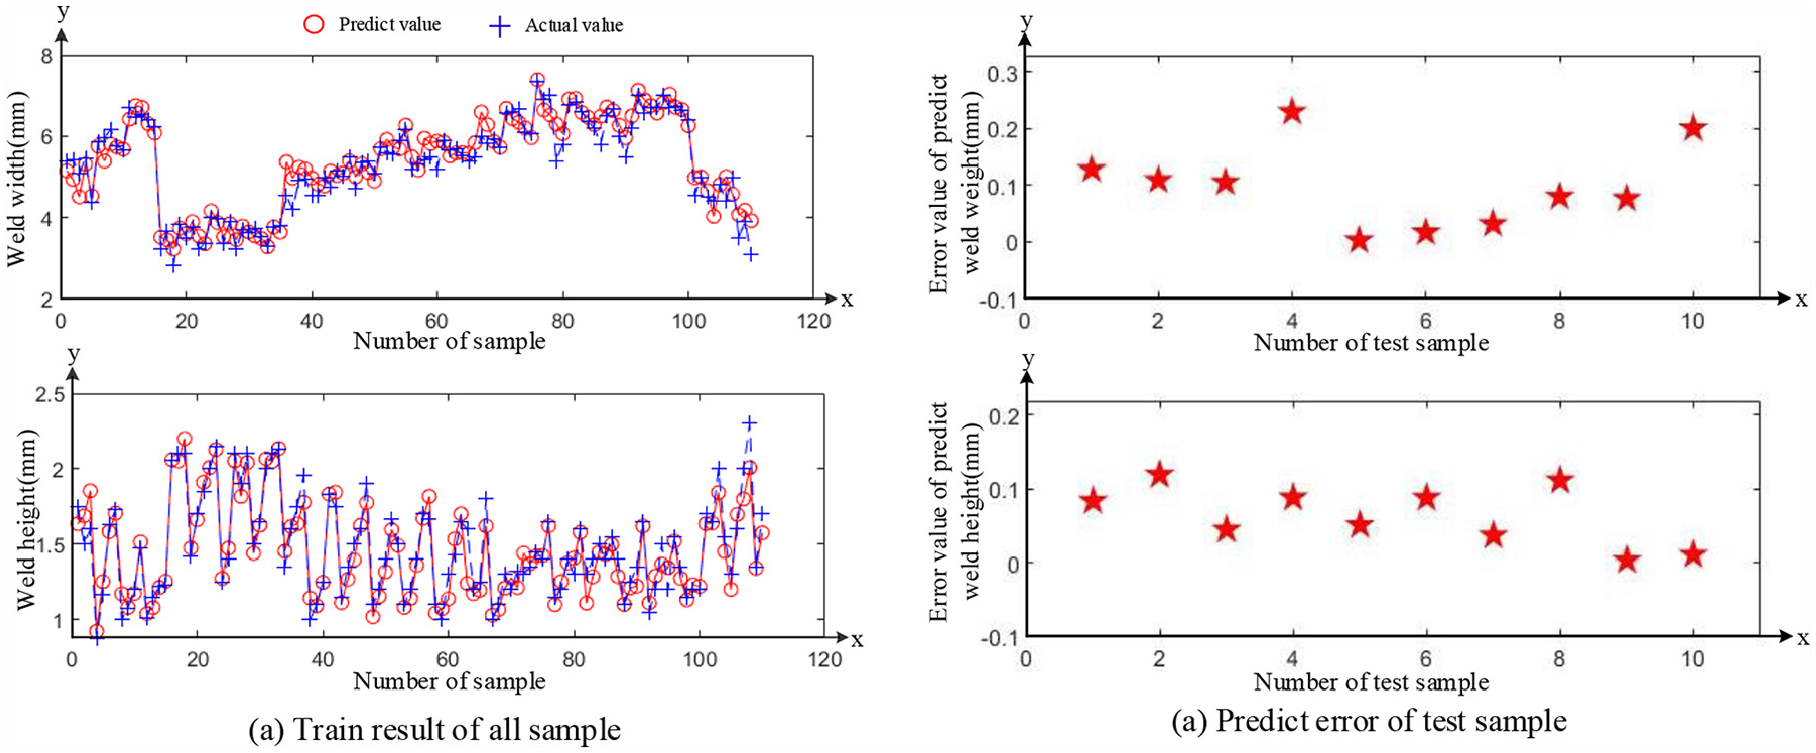
Training results of the neural network prediction model.
Influence of material shortage regionon forming
The weld overlap model was established based on the following conditions: (1) the section profile of the single weld is parabolic; (2) the adjacent weld is an ideal overlap, and the upper surface is considered flat; (3) welds on the same axis in different layers overlap completely; and (4) the influence of different heat dissipation conditions at different positions on the component are ignored during layer-by-layer deposition.
Establishment of single-layer multi-bead overlap model
Based on the above conditions, a single-layer multi-bead overlap model was established. As shown in Figure 6, the model is composed of weld 1 to weld n, which are overlapping welds. The direction of deposition is from weld 1 to weld n. The regions to the left of the weld 1 axis and to the right of the weld n axis are the edge regions of the layer, and have semi-parabolic cross-sections. The overlapping weld forms the bulk of the layer and the cross-sectional contour is a straight line, expressed as,


where d is the distance between the center of two adjacent welds; w is the weld width; h is the weld height; n is the number of welds; L is the main width of the single-layer weld, that is, the distance between the axis of bead 1 and bead n; W is the ideal width, that is the distance between the left end of bead 1 and the right end of bead n;
Figure 5 shows the actual forming diagram of single-layer multi-bead component, and the optimal overlap distance between adjacent welds is indicated (d = 0.738w). As it can be seen, the upper surface of the weld has high flatness, but there are material shortage regions on both sides of the weld. In single-layer welds, the effect of material shortage areas is ignored. The actual cross-section is consistent with that of the single-layer multi-bead overlap model.
Actual forming cross-section of single-layer multi-bead component.
3.2 Establishment of multi-layer multi-bead overlap model
This paper mainly investigates the optimization of the forming path of multi-layer multi-bead components with complex non-variable cross-section. Therefore, the deposition path of a cuboid is taken as an example to illustrate how the material shortage region is formed. The cross-section of the deposited weld in the first layer is shown in Figure 6, while the actual forming cross-section is shown in Figure 5. In the single-layer multi-bead overlap model, the impact of MSR on the forming accuracy of components is not considered. It is assumed that the weld of the second layer edge does not collapse. Thus, the second layer is deposited on the upper surface of the first layer, and the third layer is deposited on the upper surface of the second layer. Similarly, as shown in Figure 7, a multi-layer multi-bead overlap model is developed based on a single-layer multi-bead overlap model. It can be seen that the filling between axis 1 and axis N is complete, and there is no MSR. However, in each layer outside of axes 1 and N, there are material shortage regions. Therefore, for large-size components, the greater the height of the component, the greater the MSR accumulation, and the greater the effect of the MSR on surface morphology and forming accuracy.
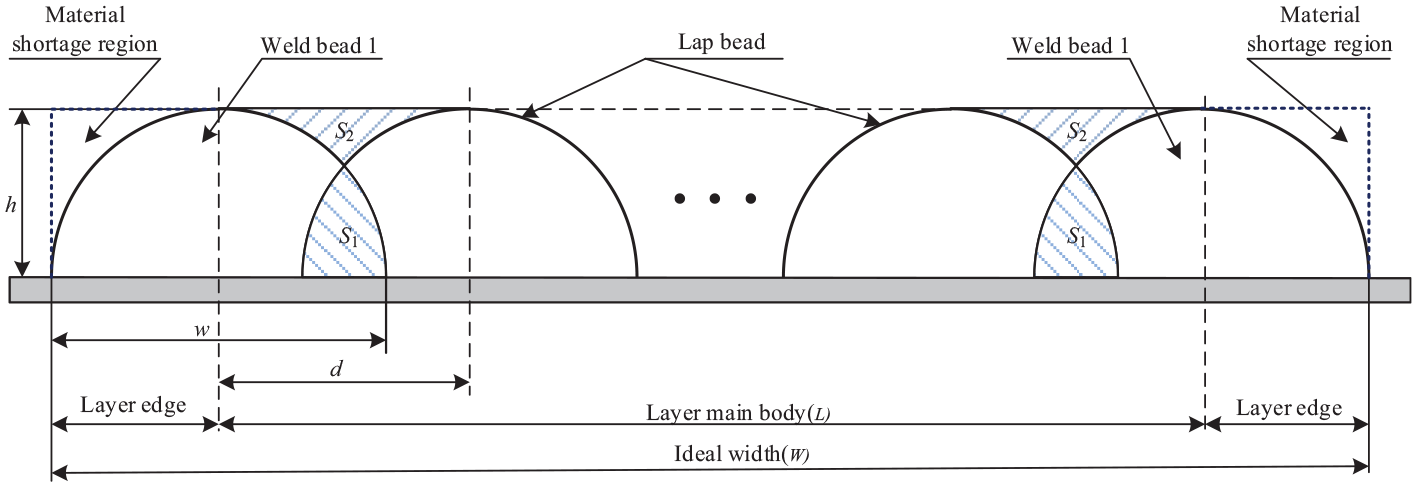
The single-layer multi-bead overlap model.
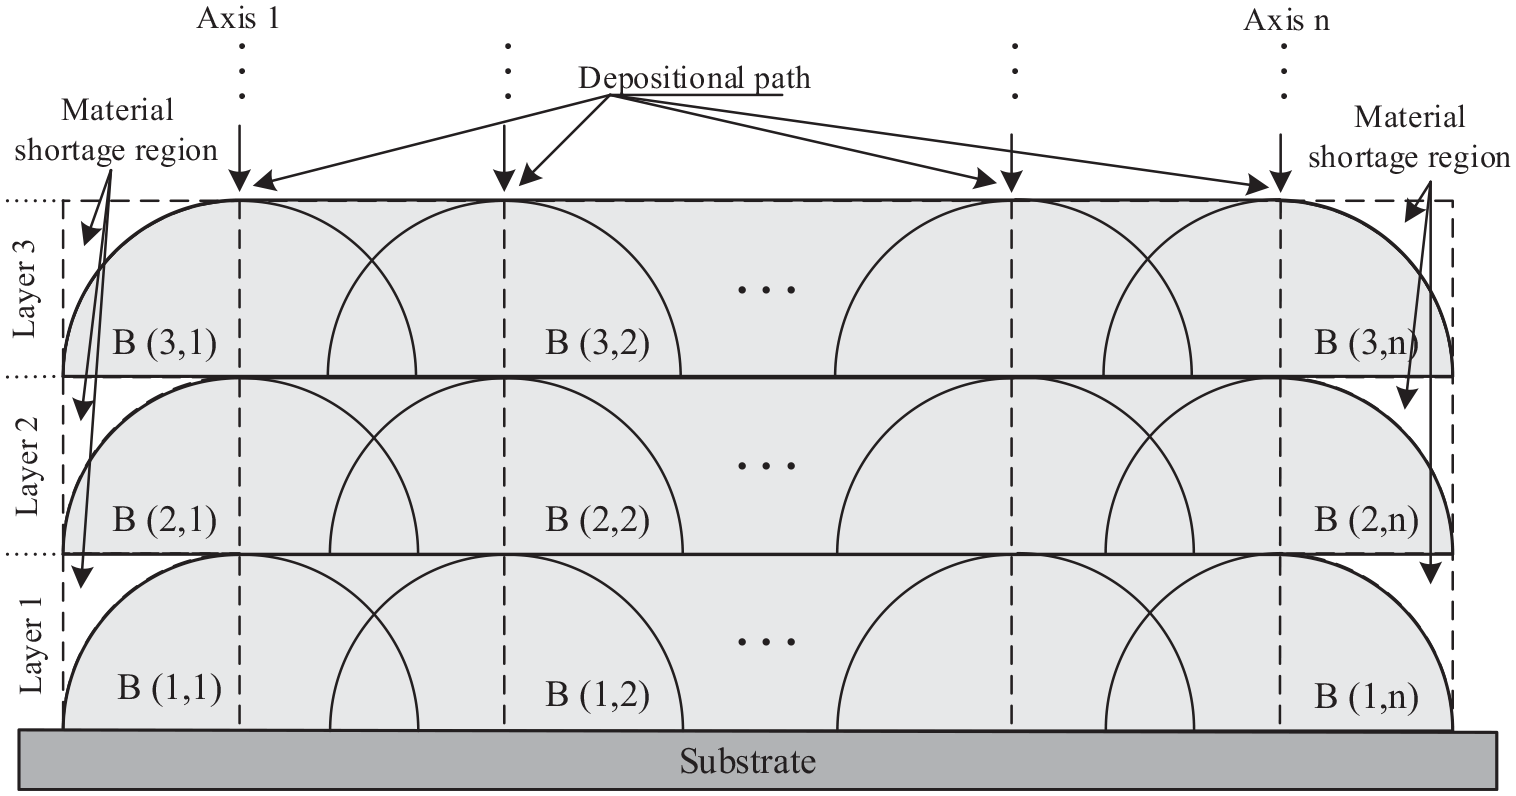
Multi-layer multi-bead overlap model.
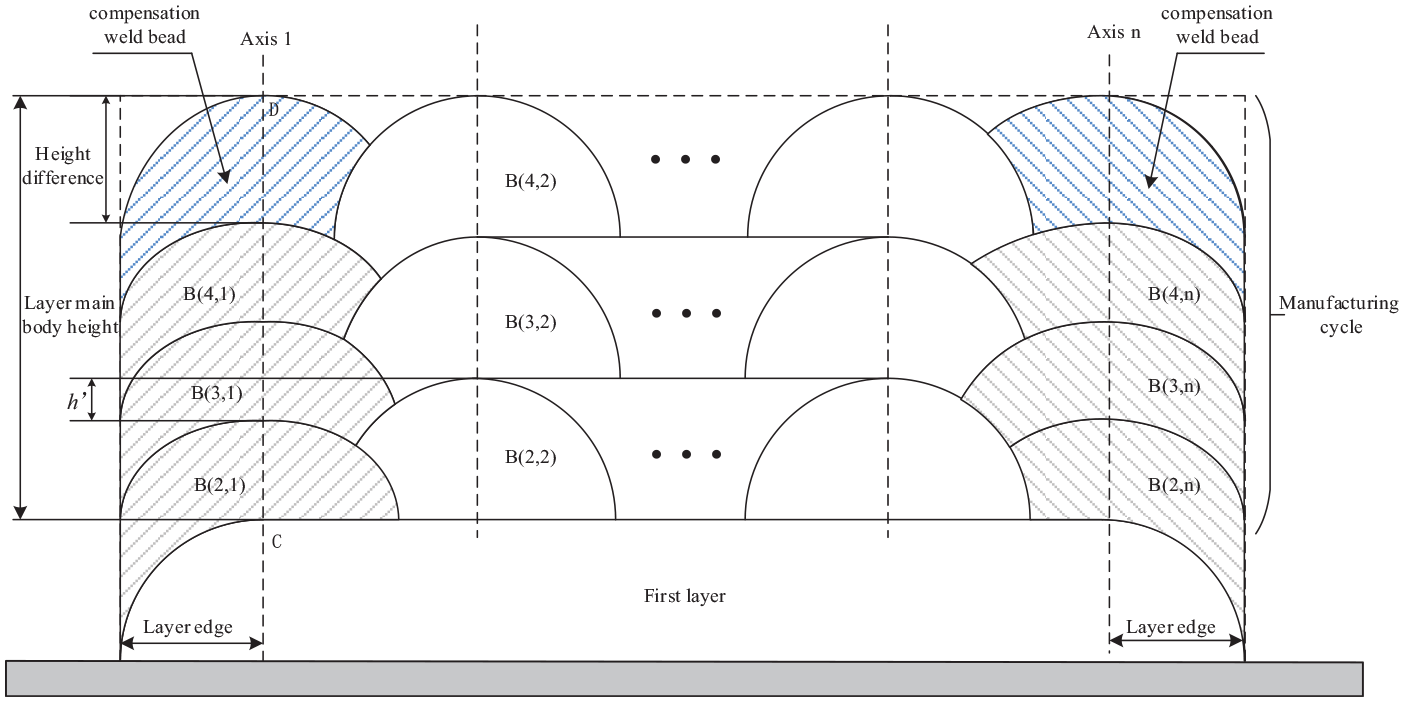
During the actual deposition process, the edge of the weld is likely to collapse due to the material shortage. Assume B (x, y) represents the yth weld of the xth layer. Then, B (2, 2) to B (2, n−1) are deposited on the plane between B (1, 1) and B (1, n), the upper surface of B (2, 2) to B (2, n−1) is approximately flat, whereas the edge of weld B (2, 1) and B (2, n) should fill the MSR of the edge of weld B (1, 1) and B (1, n). The height B (2, 1) and B (2, n) decrease by a certain amount. As the number of deposited layers increases, there is an obvious height difference between the edge region and weld body. When the edge reaches undergoes a degree of collapse, the height of the sub-edge region of the weld will also decrease.
The MLMB overlap model was used to analyze the influence of the MSR on the shape of the component. When the height of the component is large, the sides of the cross-sectional profile are approximately arc-shaped, as shown in Figure 8. Assume the expected width is M beads, the expected height is F layers, and the width of the top and bottom must be consistent. Since the upper surface is arc-shaped when the traditional path method is used, N (N > F) layers must be deposited to meet manufacturing requirements, then F-N layers are excess layers that must be removed.
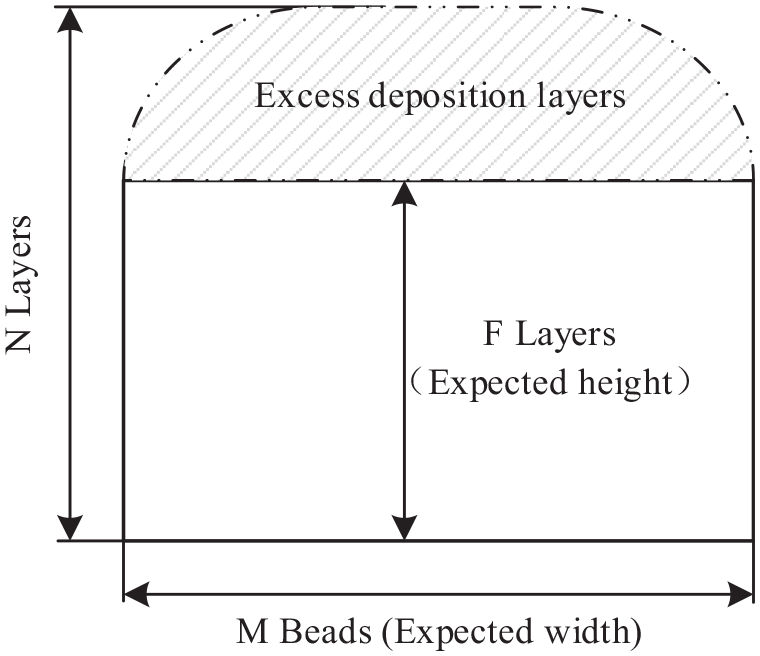
Shape of component produced using traditional method.
Forming control method
Solving height difference between single layers
To reduce material waste and production costs, it is necessary to eliminate the MSR in order to achieve the required geometrical shape as efficiently as possible. A mathematical model was developed, as shown in Figure 9.
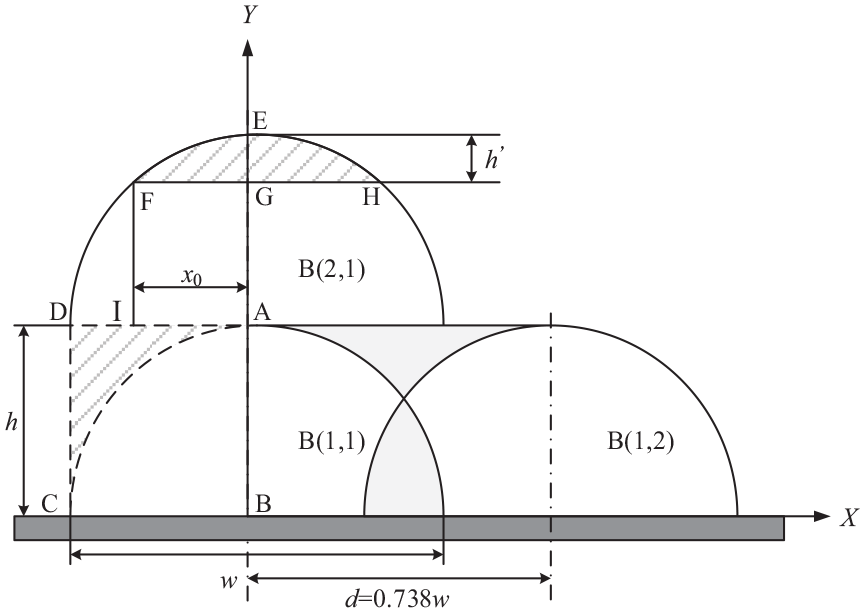
Mathematical model of edge overlap.
The first weld deposited on the substrate is B (1, 1) and the adjacent overlapping weld is B (1, 2). The edge weld B (2, 1) in two layer. The deposition path of B (2, 1) and B (1, 1) are located on the same axis and there is no MSR in the middle, therefore, the mathematical model does not consider the intermediate weld. The MSR
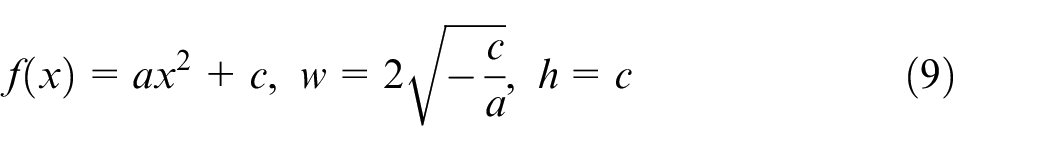
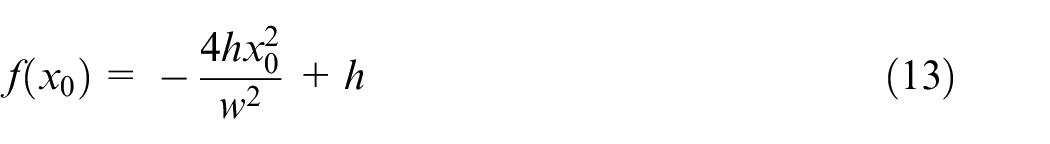
In the mathematical model, the cross-section shape of the weld is quadratic, where w is the weld width and h is the weld height, and the shape of the weld can be expressed using the following function:
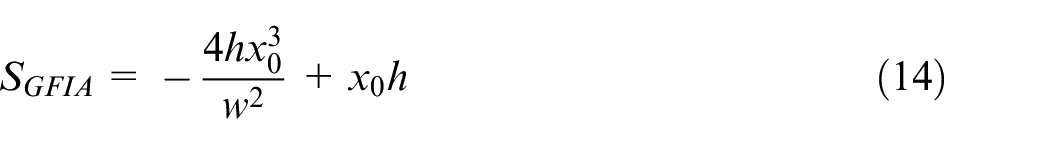
To obtain the height difference of B (2, 1), area

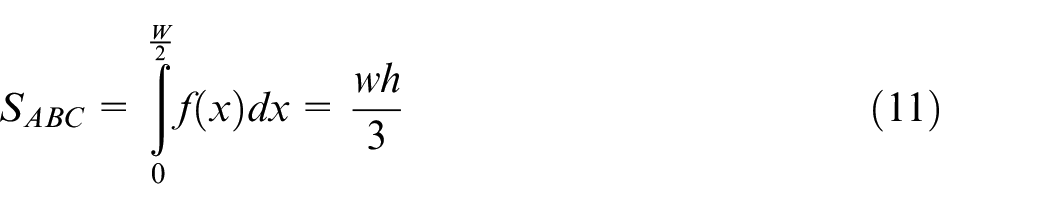
The MSR of B (2, 1) is filled with some of the material of B (1, 1). If the material shortage of B (2, 1) is known, then the height difference can be obtained. Assume

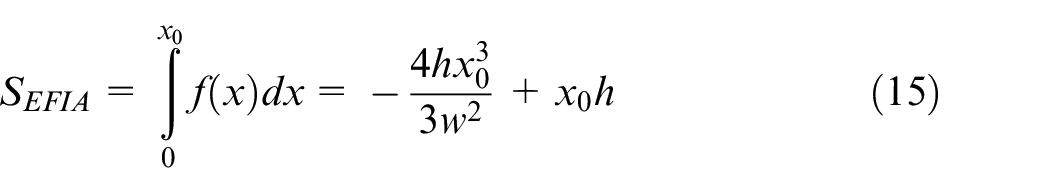
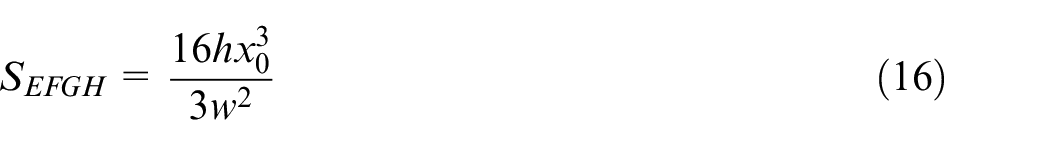
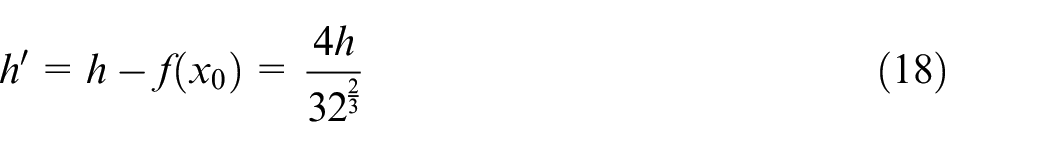
When the material shortage area of B (1, 1) is equal to the MSR of B (2, 1), the height difference

Shape follow-up edge cycle compensation method
As the height of the component increases, the MSR will continue to increase in size. The geometrical shape will not perfectly meet the target shape and the MSR must be eliminated. Therefore, when the edge height difference reaches the weld height, the edge compensation path is added.
Figure 10 shows a schematic diagram of the height difference compensation method. The first layer is deposited on the substrate and the MSR is formed at the edges. As B (2, 1) fills the MSR of the first layer, there is a height difference of
Schematic diagram of height difference compensation method.
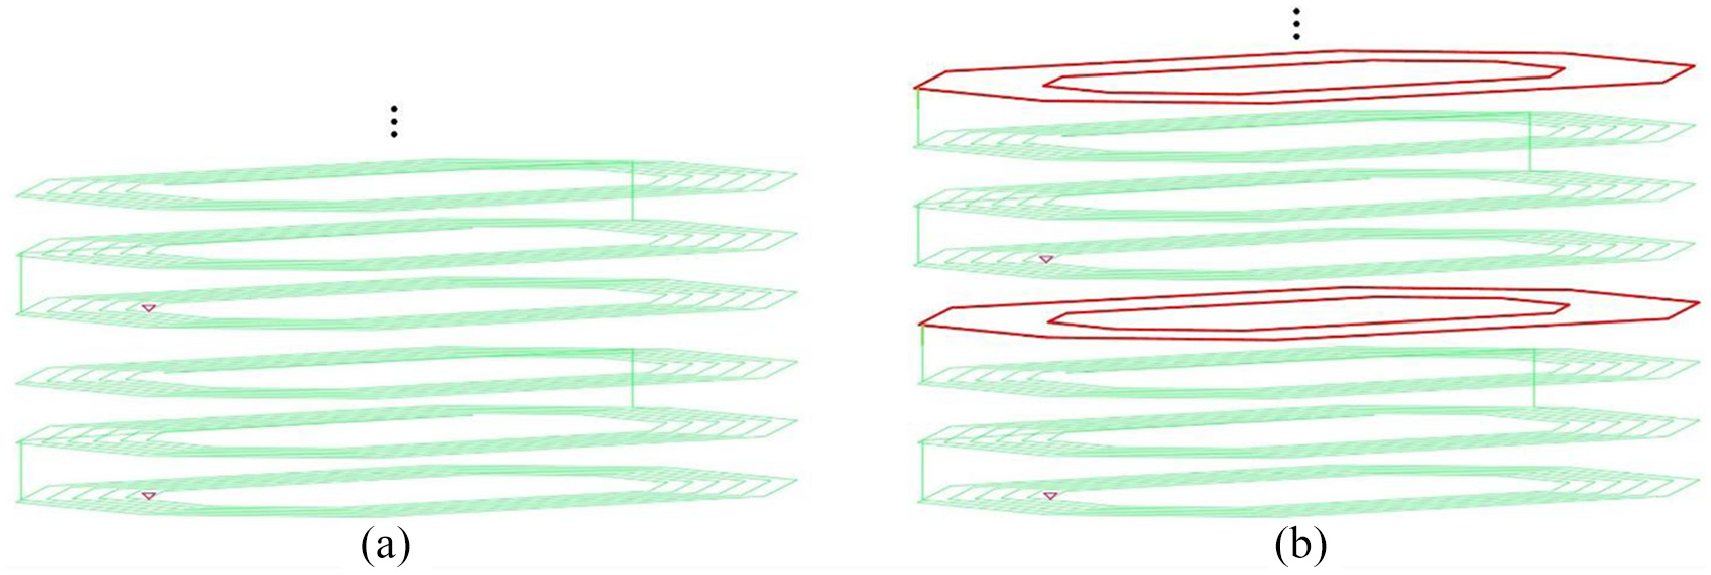
The deposition path generation procedure was developed using the shape follow-up edge cycle compensation (SECC) method. The path generation process is shown in the Figure 11 (red lines represents the compensation layer path and green lines are the normal path). The specific steps of the process are as follows:
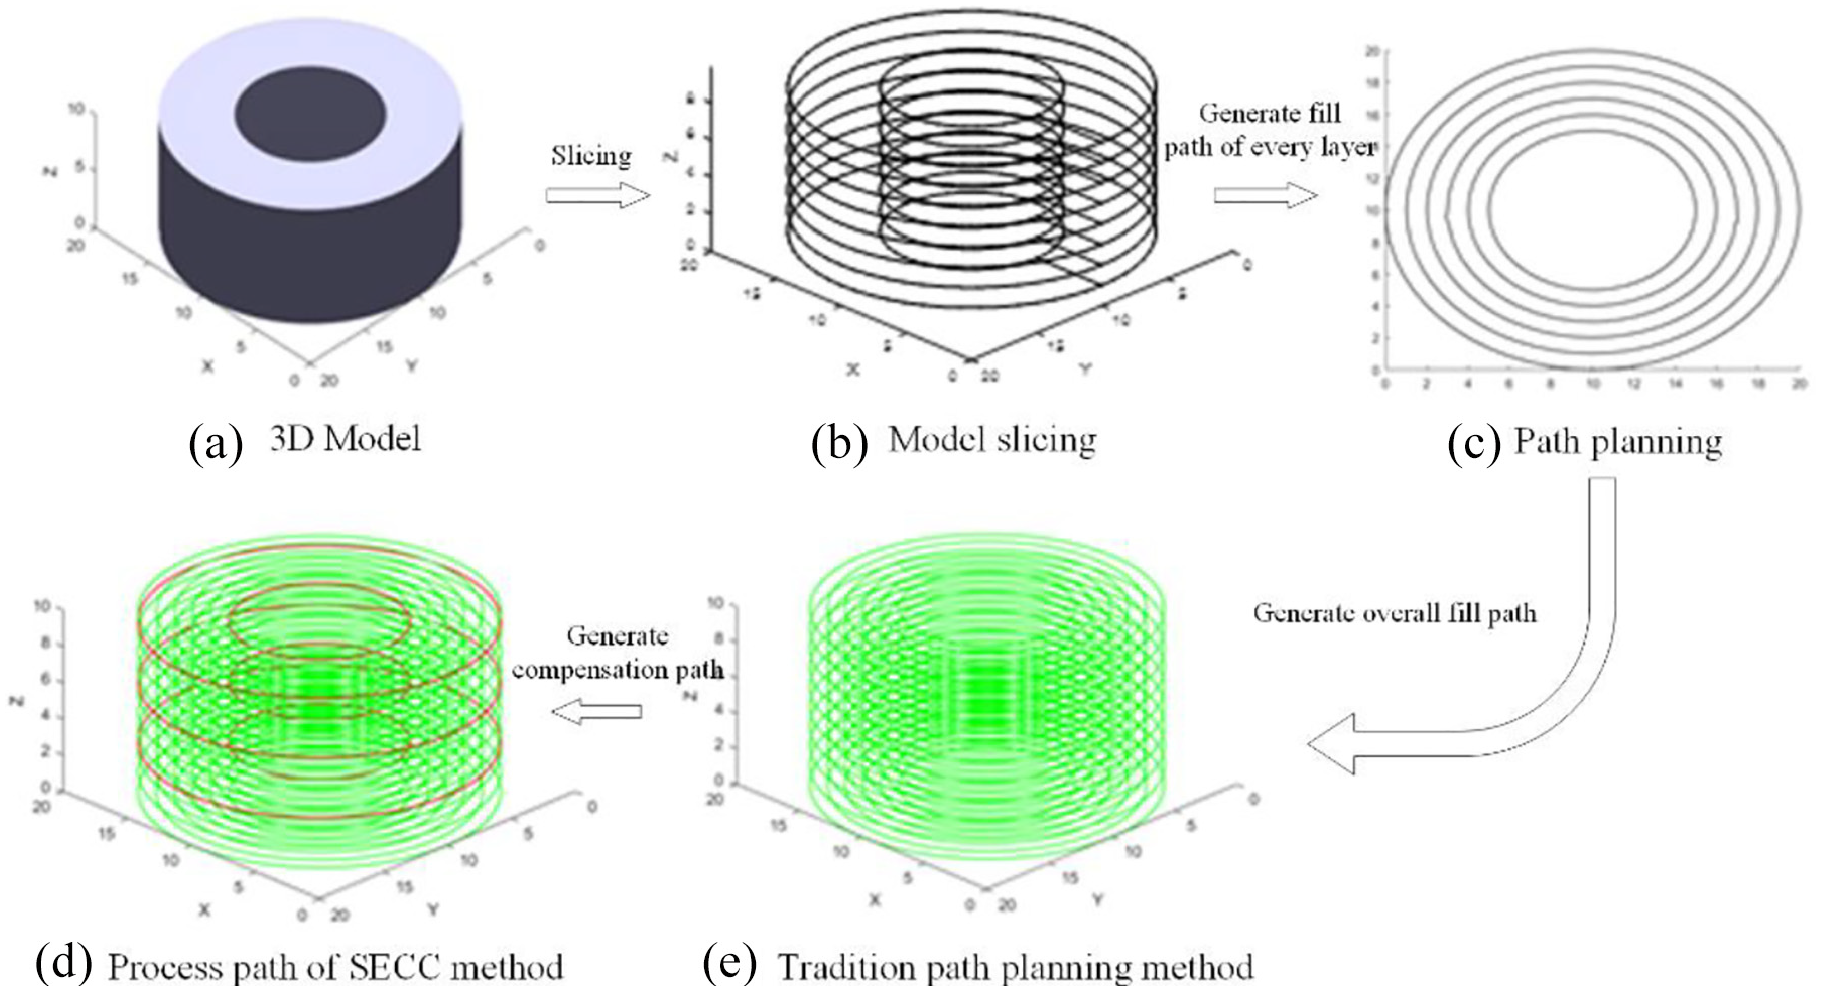
Method for generating the overall forming path.
Pretreatment of welding parameters. According to the BP network, the weld height and weld width are predicted under the current welding parameters. Based on the predicted results, the slicing height, weld overlap ratio, compensation path generation period, and number of compensation layers are determined.
3D model pretreatment. The 3D model is sliced and slice data are saved in an array.
Two-dimensional contour path planning. The path planning method is chosen according to the contour geometry.
Increase the compensation path. From bottom to top, edge compensation is added during the compensation cycle.
Output the overall deposition path.
Experimental validation
Experimental setup
The CNC plasma arc additive manufacturing system comprises mainly three parts: CNC system, plasma welding system, and path planning software (Figure 12). The CNC system is mainly composed of a CNC system control cabinet and a 5-axis machining device. The plasma welding system is mainly composed of a welding torch, Fronius welding control cabinet, and automatic voltage control (AVC) platform (enables real-time detection of the welding torch and substrate voltage and collision of the welding torch and components can be prevented by adjusting the distance between the welding torch and the working plane), wire feeding control cabinet, and plasma gas and shielding gas. ROB5000 can provide or accept the digital and analog signals that the robot and numerical control system need or send out, respectively. In addition, ROB5000 is used to realize the communication between the plasma welding system and the numerical control system. A custom-made path planning software is used to read the STL files, as well as for layering, weld size prediction, path planning, and G-code export. The G-code can be imported directly into the CNC system for processing.
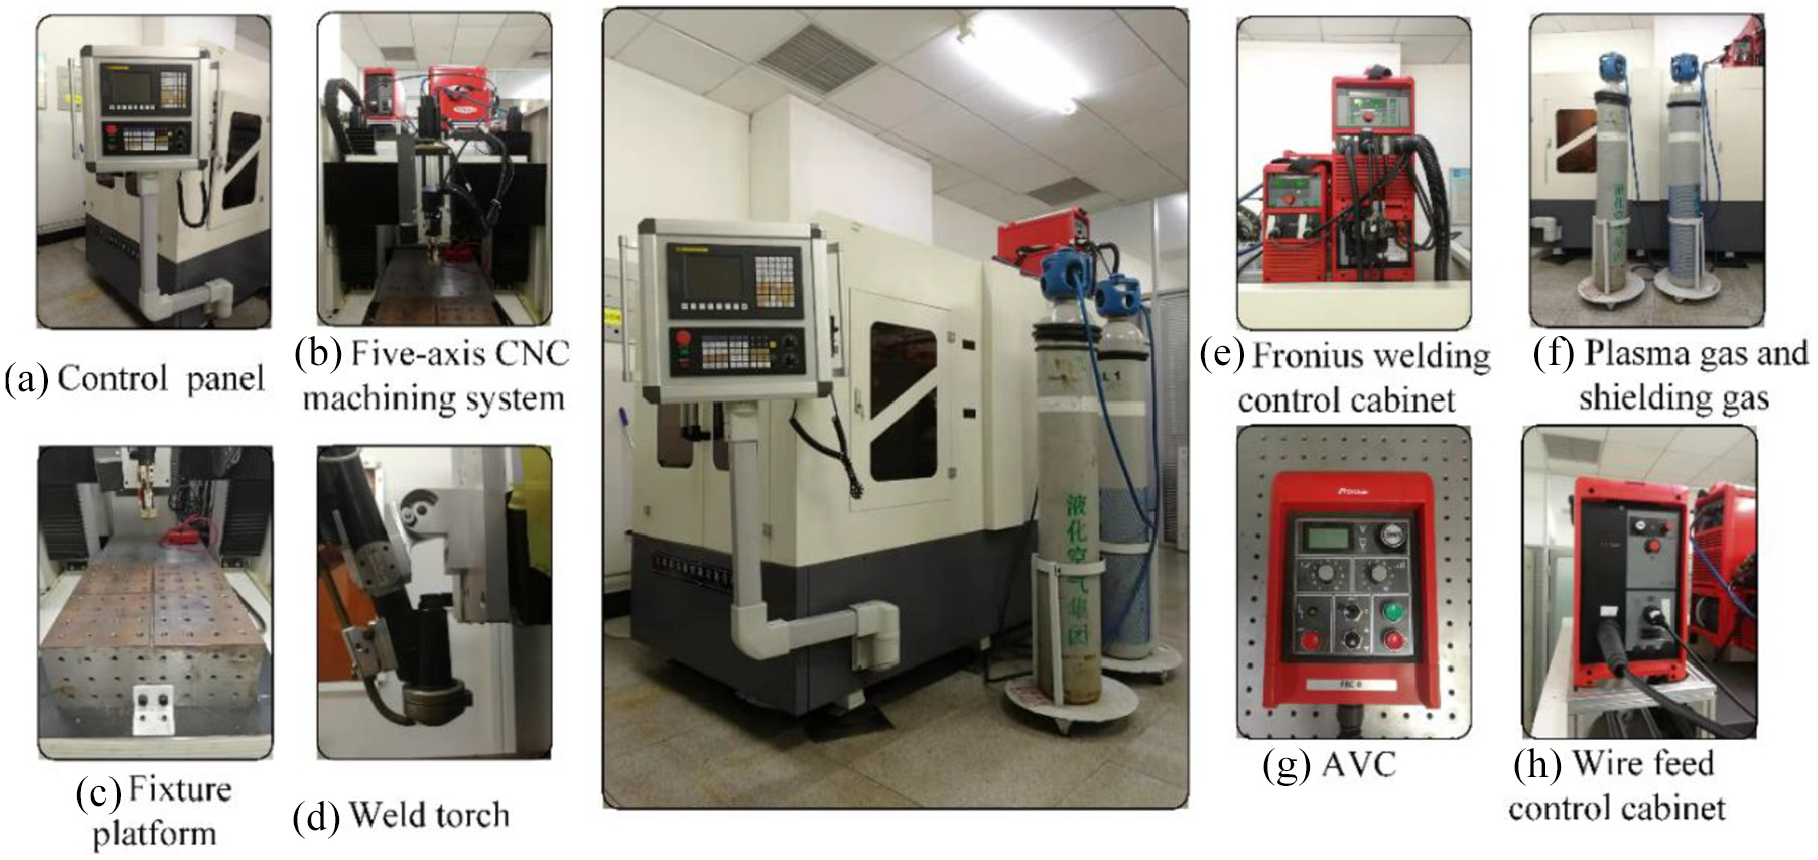
Computer numerical control (CNC) plasma arc additive manufacturing system.
The manufacturing parameters of the CNC plasma additive manufacturing system are as follows: welding current input range of 110–135 A; welding speed input range of 150–210 mm/min; wire feeding speed input range of 160–230 cm/min; and welding voltage range of 19–20 V. The maximum forming size of the worktable is 500 × 500 × 500 mm, and the positioning accuracy in each direction is 0.001 mm. The shielding gas used in the welding process was pure argon with a flow rate of 15 L/min and the plasma gas was argon with a flow rate of 1.3 L/min. In order to improve the forming quality and reduce spatter, the distance between the nozzle and the substrate was set to 3–5 mm. The cladding material was 304 stainless steel with a diameter of 0.8 mm. The substrate material was Q235 stainless with dimensions of 340 × 200 × 12 (length × width × height).
Experimental results
In this paper, two sets of experiments were carried out to verify the feasibility and applicability of the forming control strategy. In the first experiment, a continuous zigzag path planning method was used to deposit cuboid components. In the second experiment, the manufacturing parameters were varied, and continuous contour offset paths were used to deposit annular components.
Experiment one
Two cuboid components were manufactured using the same parameters and different forming control methods. The manufacturing parameters and weld size are listed in Table 1. To minimize the effects of temperature on the edge layer, each deposited layer was cooled to room-temperature before the subsequent layer was deposited. The aims of the experiment were: (1) To solve the problems of existing path planning methods with no edge compensation path cycle and to demonstrate the effects of the MSR on the component morphology; (2) To verify the actual forming effects and whether the expected geometric size is reached with the SECC method.
Manufacturing parameters.
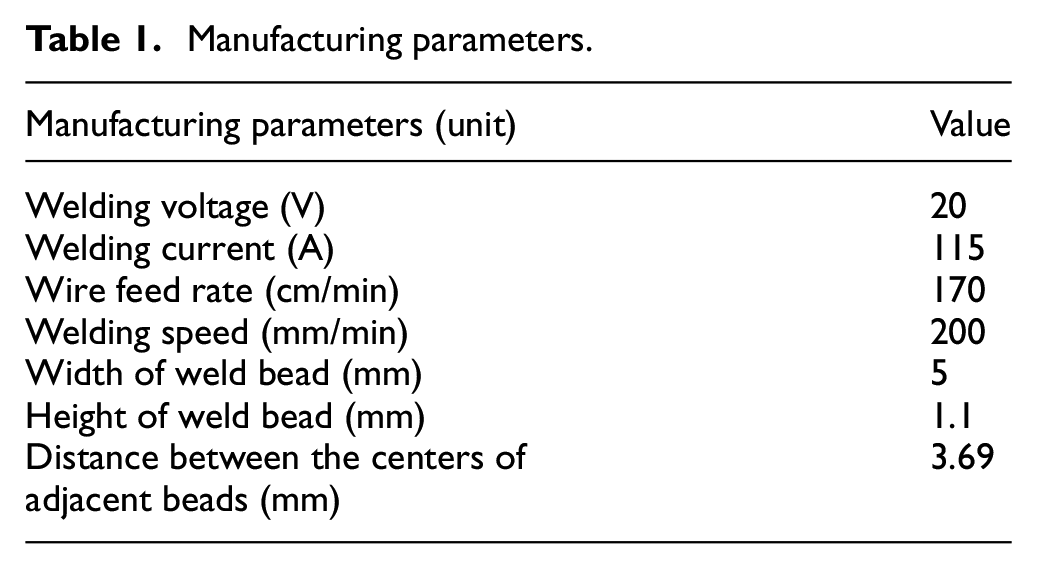
Figure 14(a) and (b) show experimental results of the traditional method. As shown in Figure 13(a), the deposition path of each layer is the same. Figure 14(c) and (d) show the component obtained using the SECC method. The height difference was calculated as
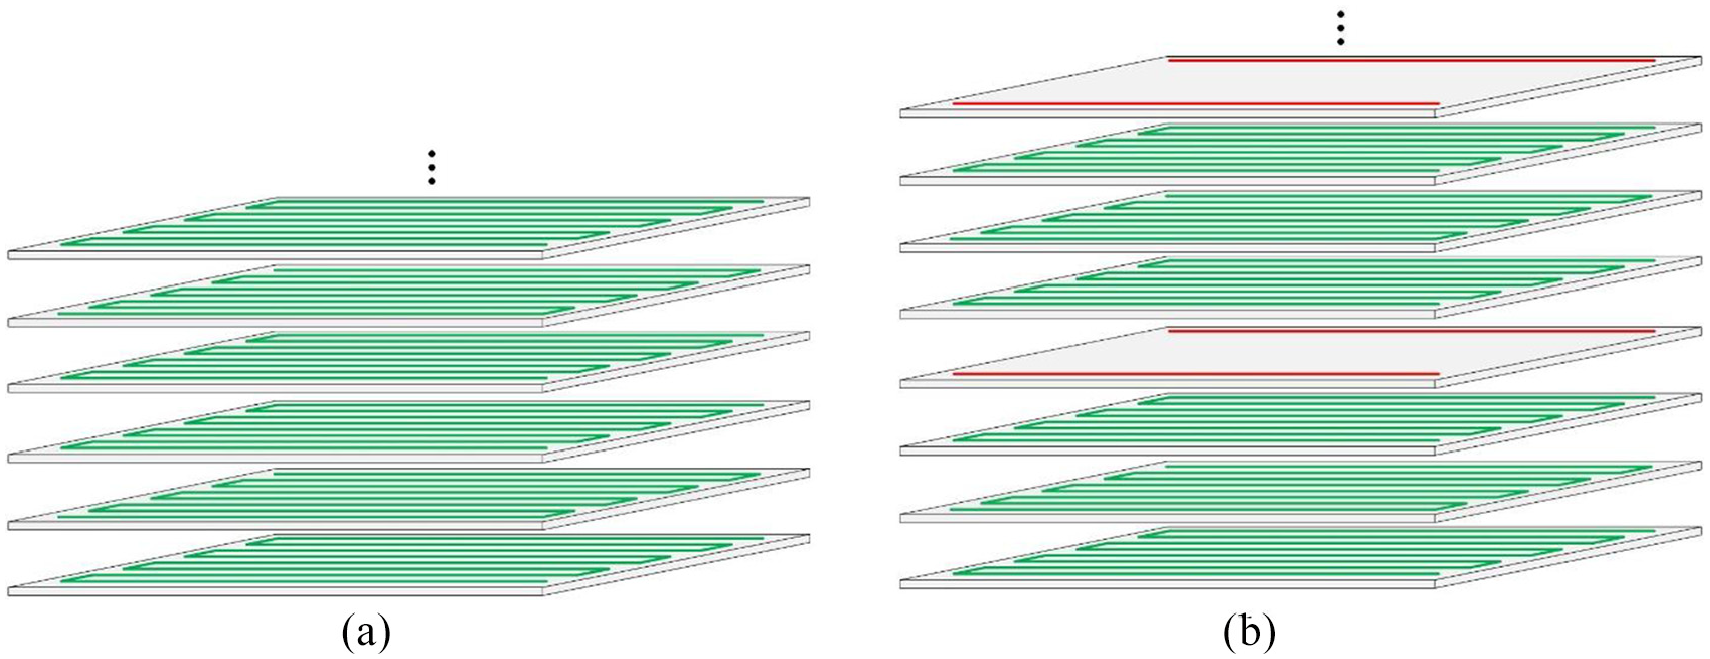
Schematic diagram of manufacturing cuboid components using the continuous zigzag path planning method: (a) traditional path planning method, and (b) SECC method.
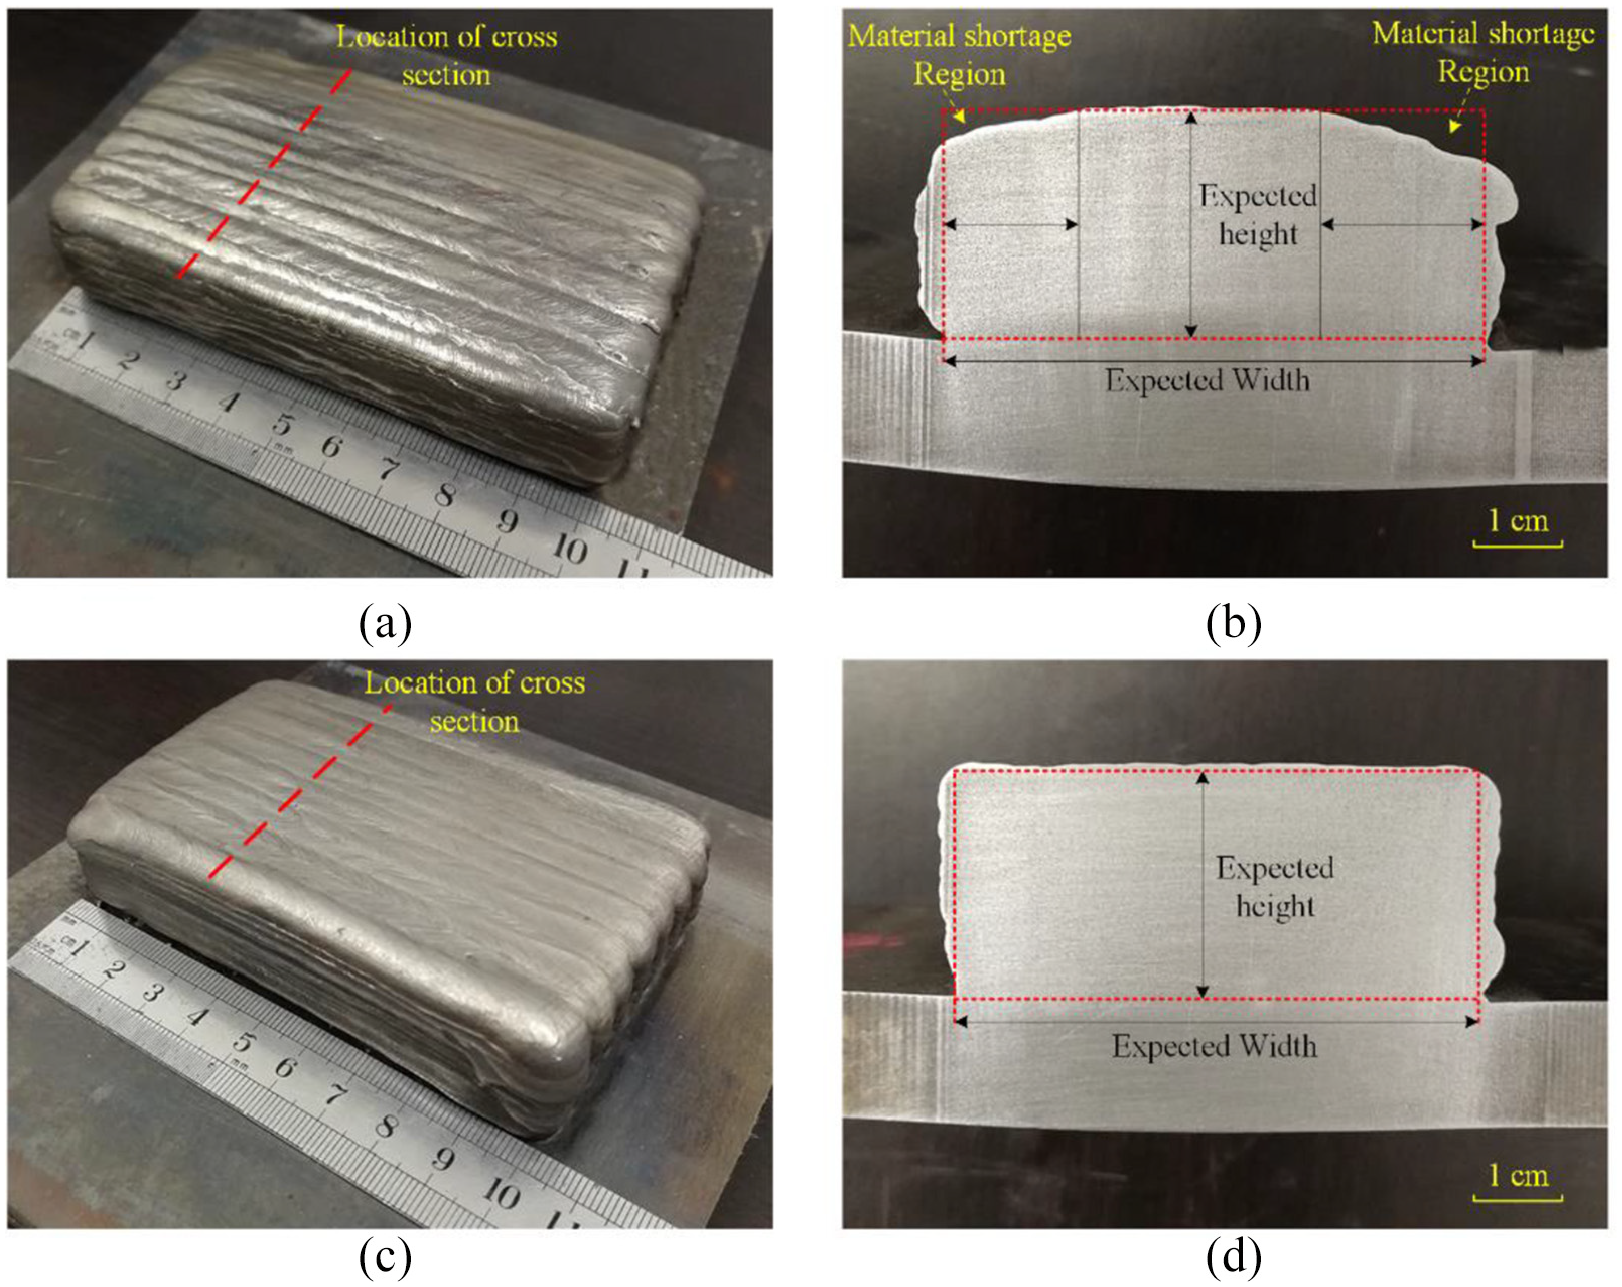
Manufacture of cuboid component (experiment one): (a) full component, (b) cross-section of component manufactured using traditional method, (c) full component, and (d) cross-section of component manufactured using SECC method.
The flatness of the upper surface is relatively poor when the traditional method is used and was improved by using the proposed method, as shown in Figure 14(a) and (c), respectively. The cuboid obtained using the two methods was cut at the red dashed line, and the cross section is shown in Figure 14(b) and (d). The ideal cross-sectional profile is marked with a red dotted line and the expected height and width are marked as thin black solid lines. It can be seen from Figure 14(b) that the cross-sectional width of the component reaches the expected width and the region between the black thin solid lines reaches the expected height, however, the MSR appears in the top layer between the black line and the outer contour. The region exists at the top of the edge weld and the sub-edge bead, which is consistent with the MLMB overlap model. Moreover, the upper surface profile is similar to a parabola, which is consistent with the surface prediction model. Figure 14(d) shows the cross-sectional profile of the cuboid using the SECC method. The expected width and height are reached. The upper surface profile is close to a straight line and has high flatness. The MSR is completely eliminated.
The actual widths shown in Figure 14(b) and (d) are larger than expected. Owing to the slow dissipation of heat during the manufacturing process, heat accumulates as the number of deposited layers increases and liquid metal flows to both sides, making the actual width larger than the expected width. In order to obtain higher geometric accuracy, it is necessary to use a CNC milling machine for finishing the components. In summary, the results of the first experiment show that the SECC method greatly improves the geometric accuracy of components.
Experiment two
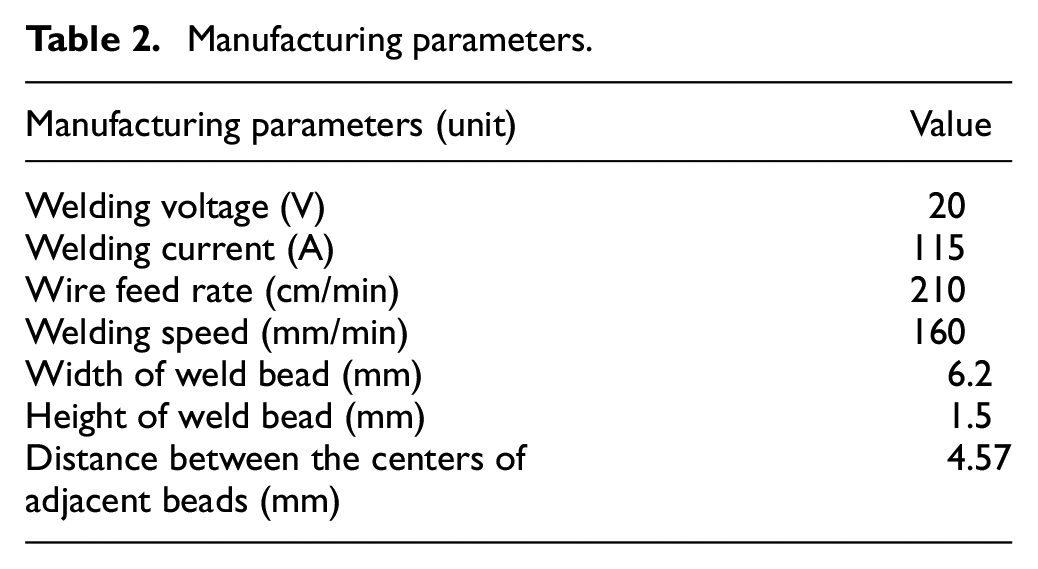
To verify the applicability of the SECC method, the manufacturing parameters and path planning method were varied. The manufacturing parameters and weld size are presented in Table 2.
Manufacturing parameters.
In the second experiment, the contour offset path planning method was used to deposit annular components. The first component was manufactured using the traditional method and the single-layer filling path is shown in Figure 15(a). The second component was manufactured using the SECC method. The edge height difference was calculated as
Schematic diagram of the filling path of annular components with the contour offset path planning method: (a) traditional path planning method, and (b) SECC method.
A series of components were deposited using the same manufacturing parameters and deposition path described above. Figure 16(a) shows an annular component deposited using the traditional method, and a higher middle bead and lower edge bead can be observed on the upper surface. Figure 16(c) shows an annular component deposited using the SECC method. The upper surface of the component has high flatness. Annular components obtained by the two methods were cut along the dashed red line, and the cross-sections are shown in Figure 16(b) and (d). It can be seen from Figure 16(b) that the cross-sectional contour is parabolic and the height difference is clearly observed between the edge layer and the middle region. In addition, the MSR can be observed on the top of both the inner and outer edges. The expected width is obtained; however, the expected height is not achieved. The expected height and width are reached and the MSR is completely eliminated when the SECC method is adopted, as shown in Figure 16(d). The upper surface contour is close to a straight line and has high flatness.
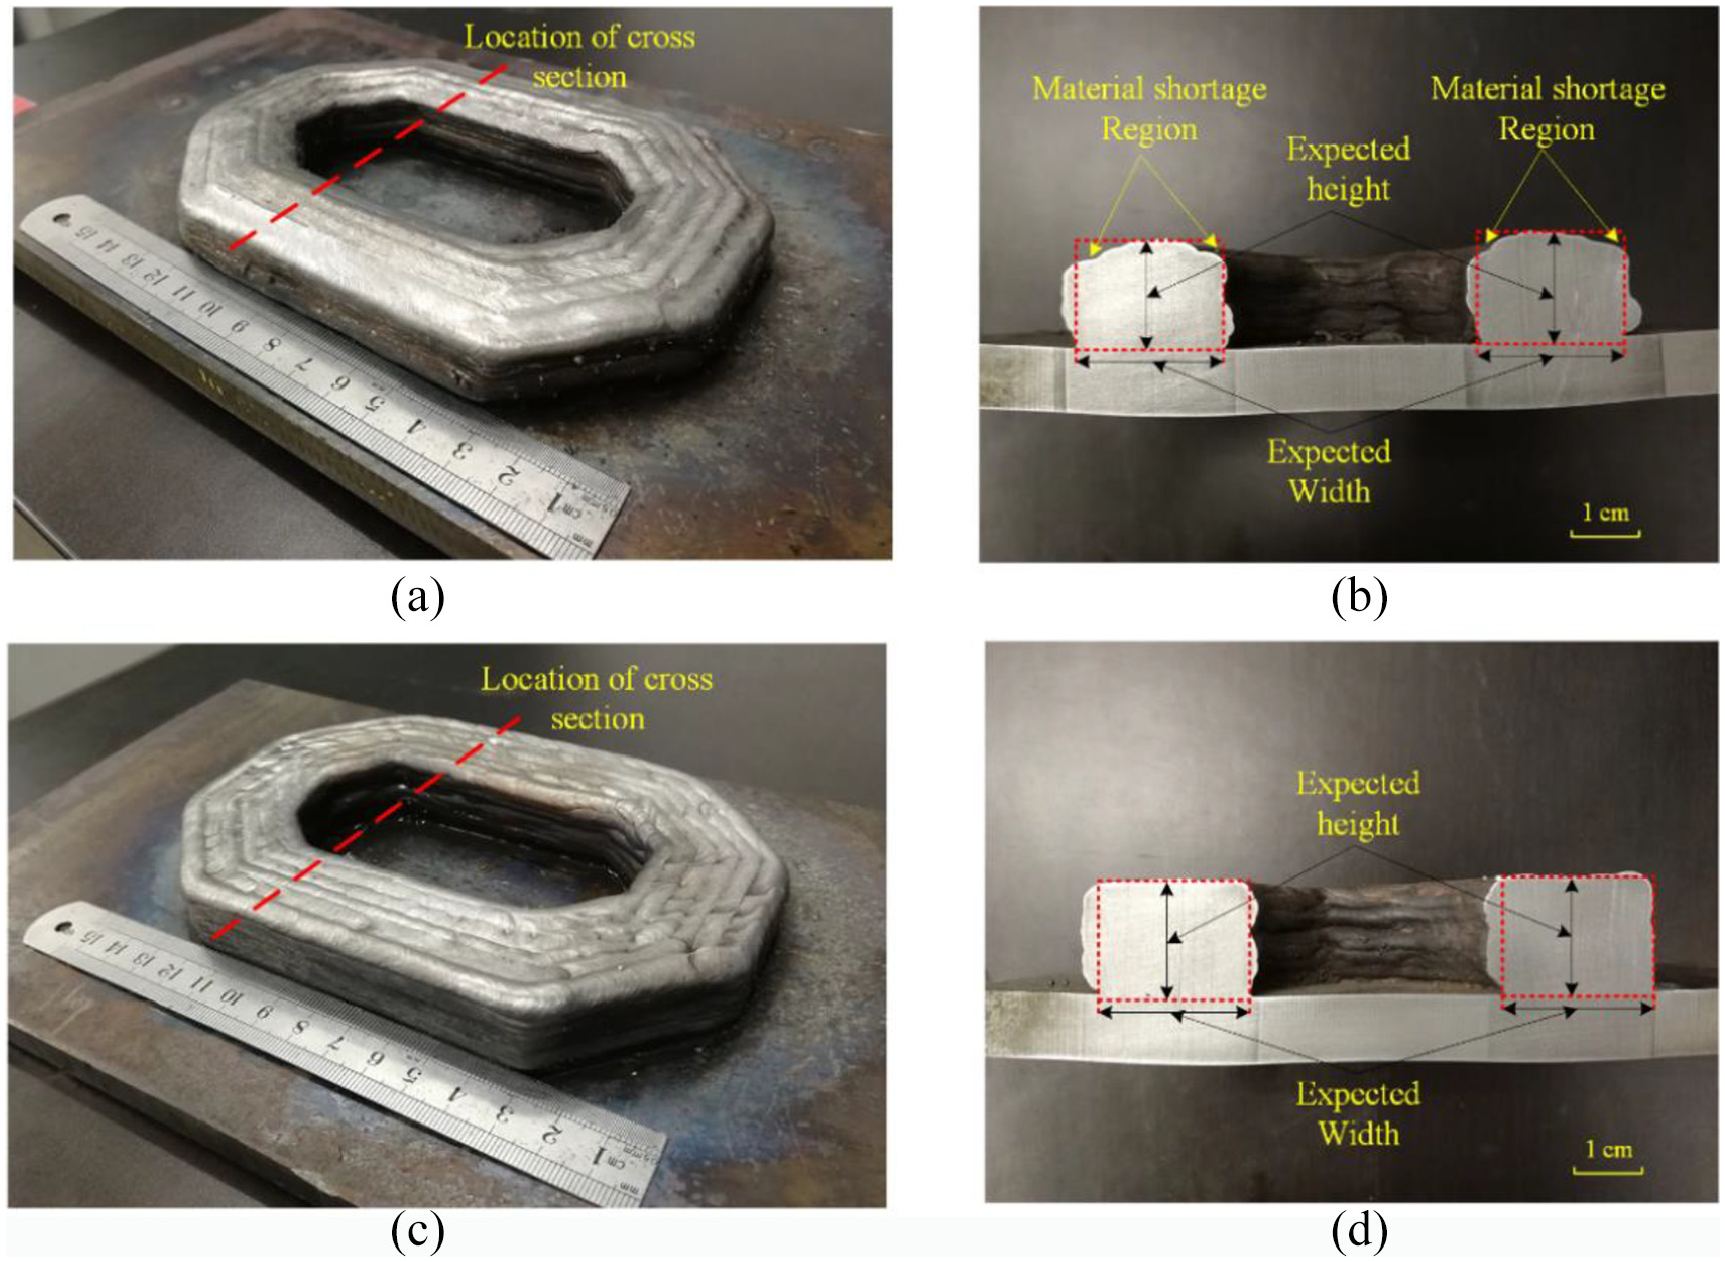
Manufacture of annular component (experiment two): (a) full component and (b) cross-section manufactured using traditional method, (c) full component, and (d) cross-section manufactured using SECC method.
This group of experiments has effectively demonstrated that the SECC method is suitable for precision forming of MLMB components under various manufacturing parameters and using different path planning methods.
In the experiments, the edge height using the traditional method, height of the main body of the component (ideal height of the edge), and the edge height using the SECC method in each manufacturing cycle were obtained. The variation of edge height is illustrated in Figure 17. It can be seen that no matter which path planning method is adopted, there is a height difference between the actual edge height and the ideal edge height using the traditional method. The height difference increases as the number of layers increases, and the edge layer fails to reach the expected height. The edge height is consistent with the ideal edge height only when the SECC method is adopted. Furthermore, the SECC method eliminates the MSR.
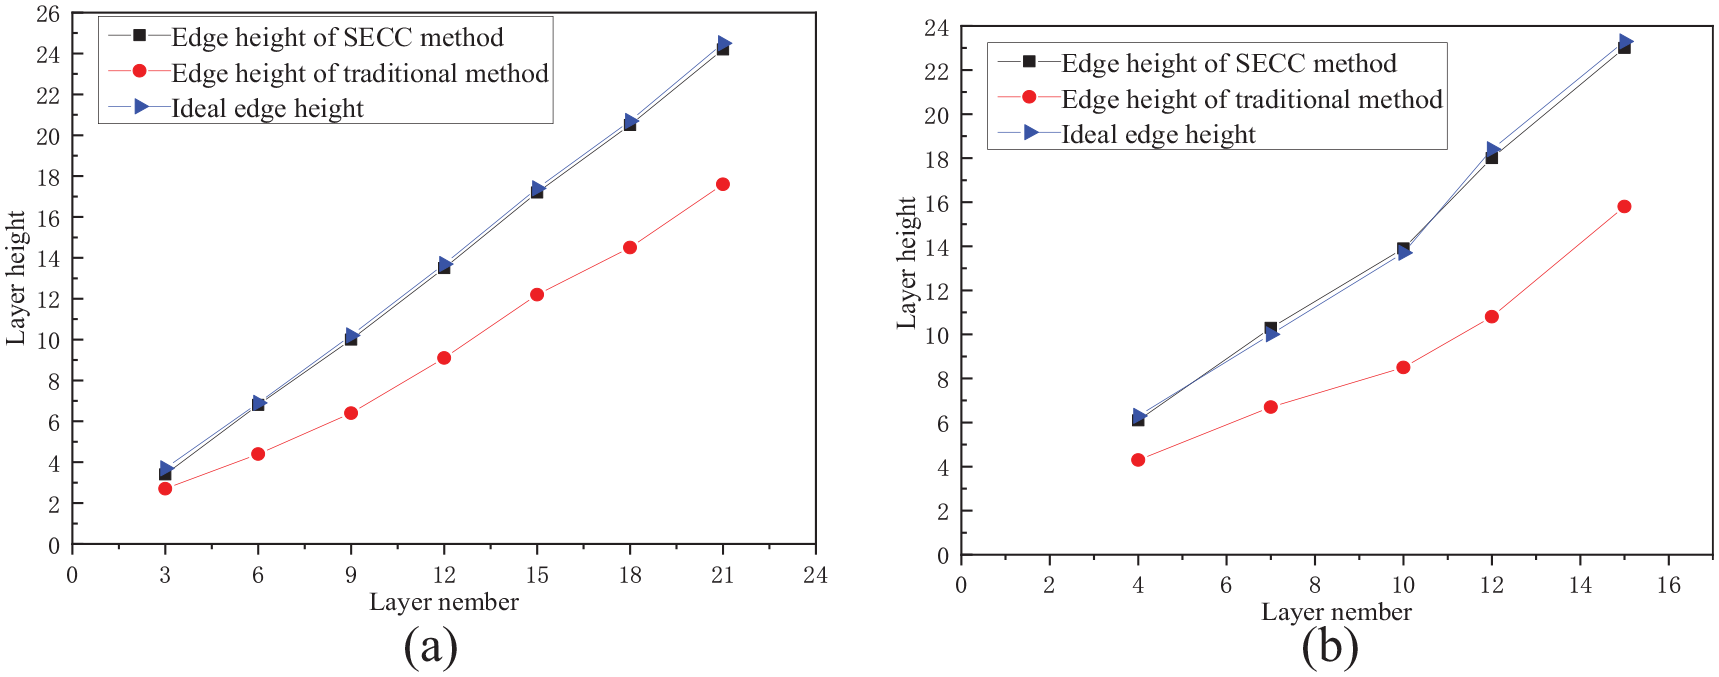
Height of weld bead edge obtained by traditional method and SECC method: (a) cuboid component (experiment 1), and (b) annular component (experiment 2).
To demonstrate the applicability of the SECC method in manufacturing complex geometric structures, a tensioner structure was manufactured. The structure is comprised of three characteristic sections, as shown in Figure 18. The geometric contour and filling path of each section are illustrated (green lines represents filling paths and black lines are geometric contours). Figure 18(d)–(f) show the actual form of the two-dimensional contour. After adding the edge compensation path, the geometric contours are more easily observed. Figure 18(g)–(i) are the overall forming paths of the three characteristic sections. Green lines represent the normal deposition path and the red line is the compensation path. The final component is shown in Figure 18(k). When the SECC method is adopted, the edge of the component does not collapse. In order to verify whether the edge height is consistent with the 3D model, heights were measured at three different positions and the results are presented in Figure 19. The height of the 3D model is slightly higher than the actual height, but overall, the desired effect is achieved.
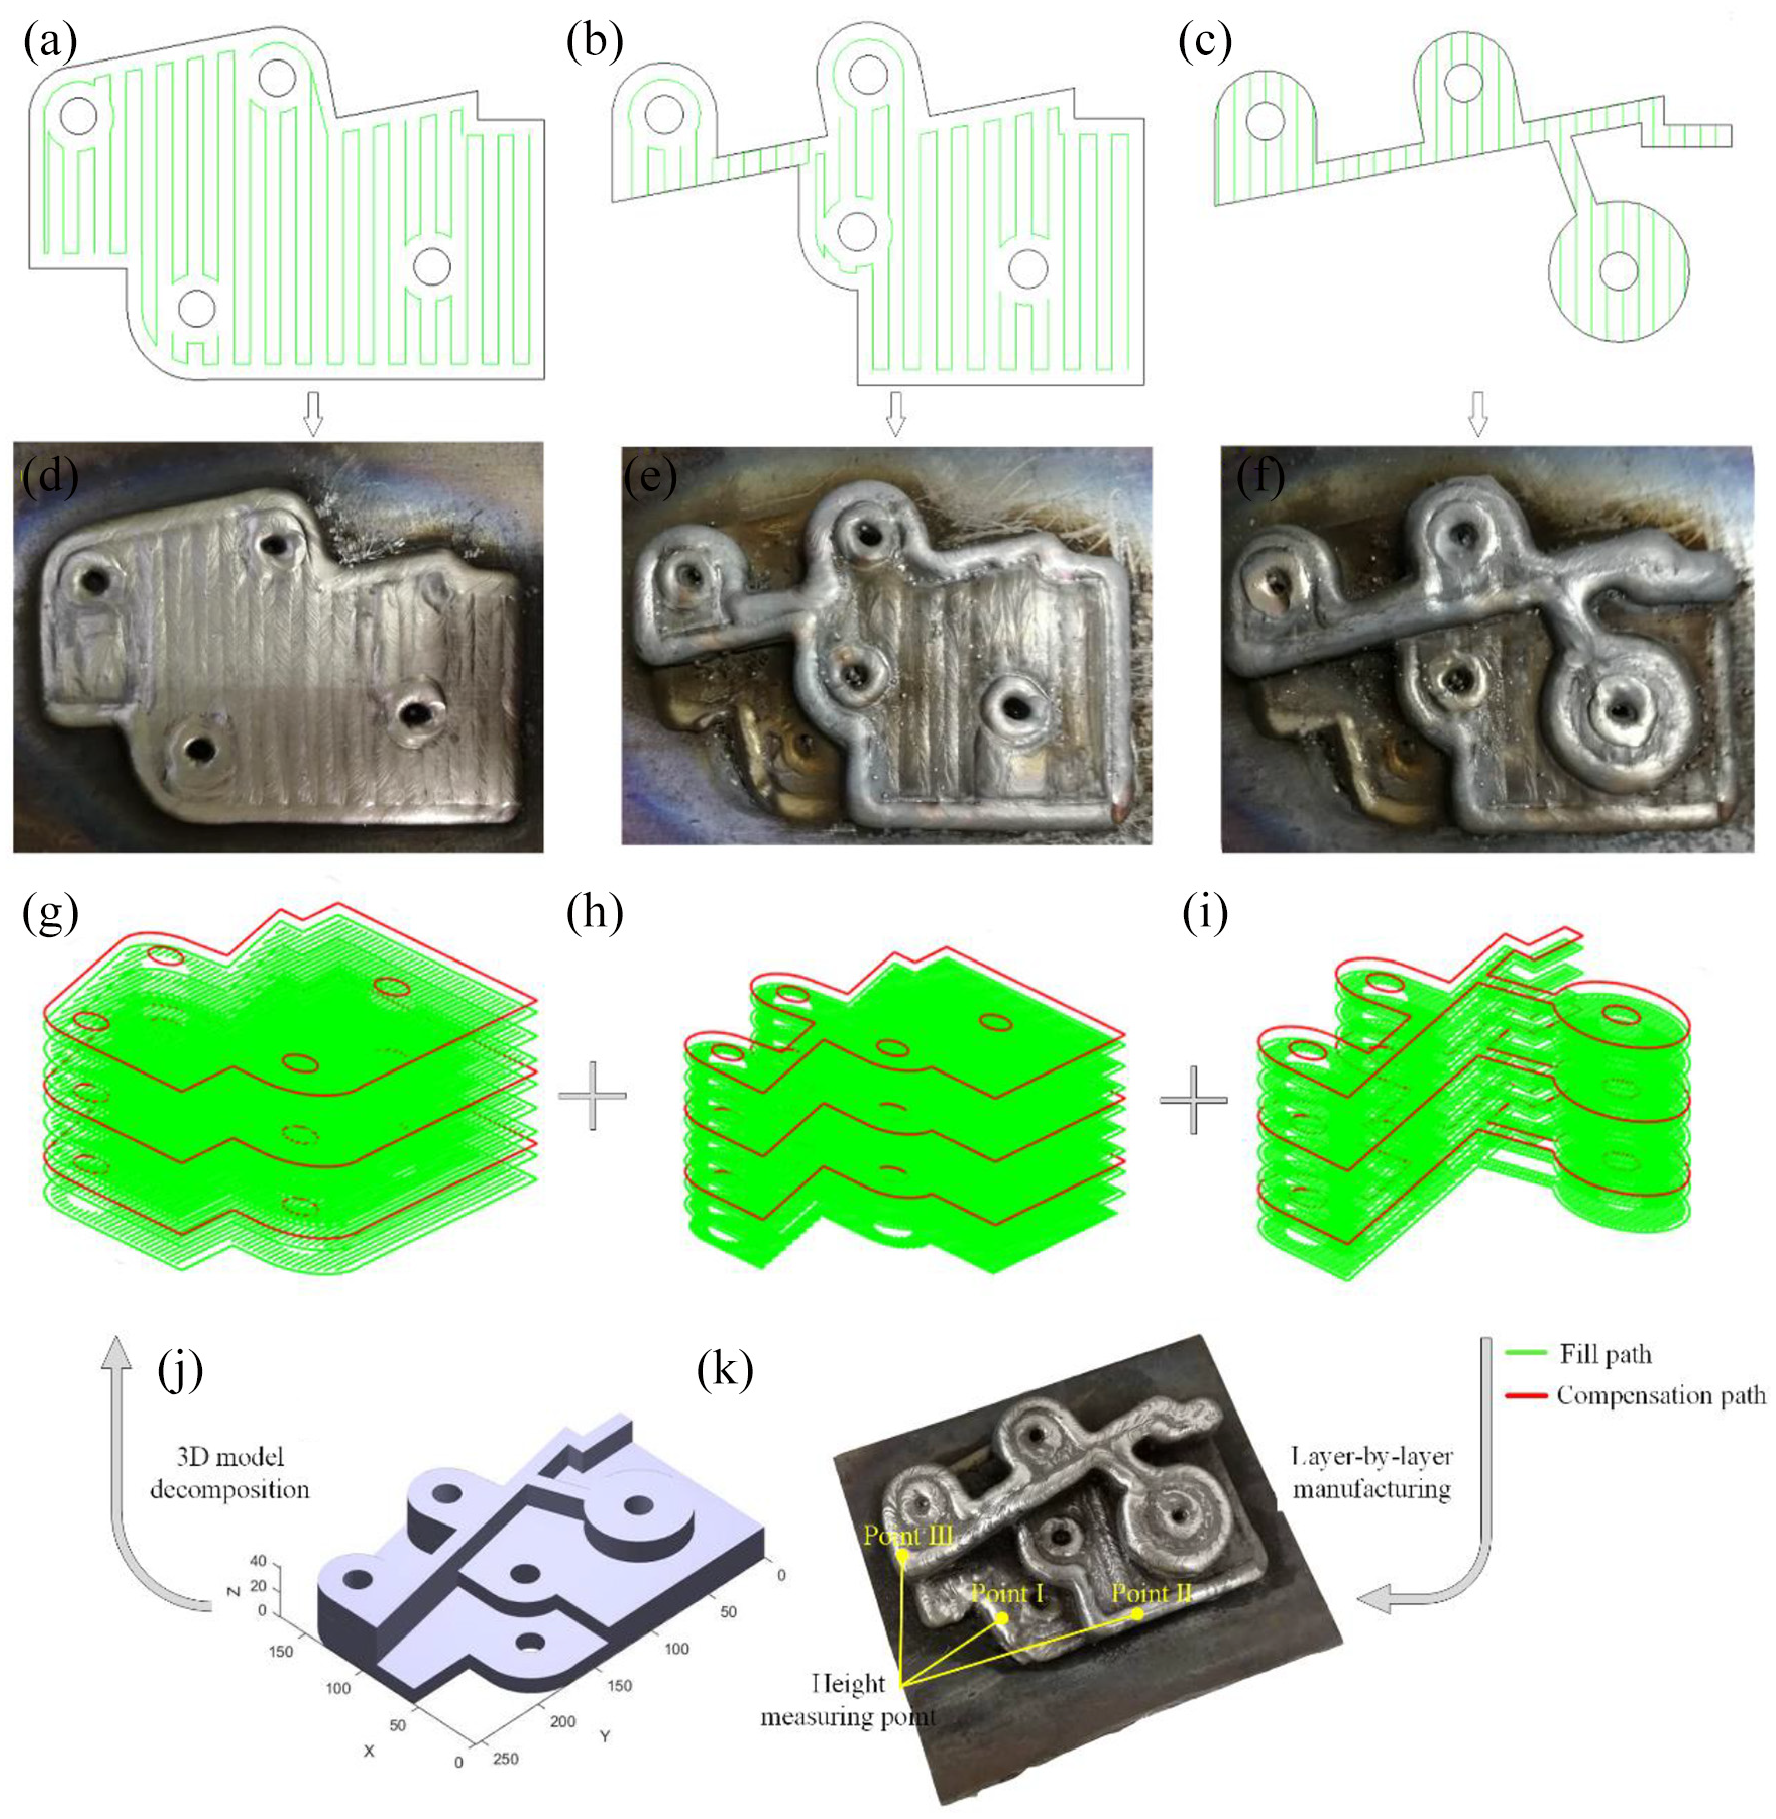
Tensioner manufacturing process: (a) to (c) filling path, (d) to (f) surfacing effect each layer, and (g) to (i) full tool path.
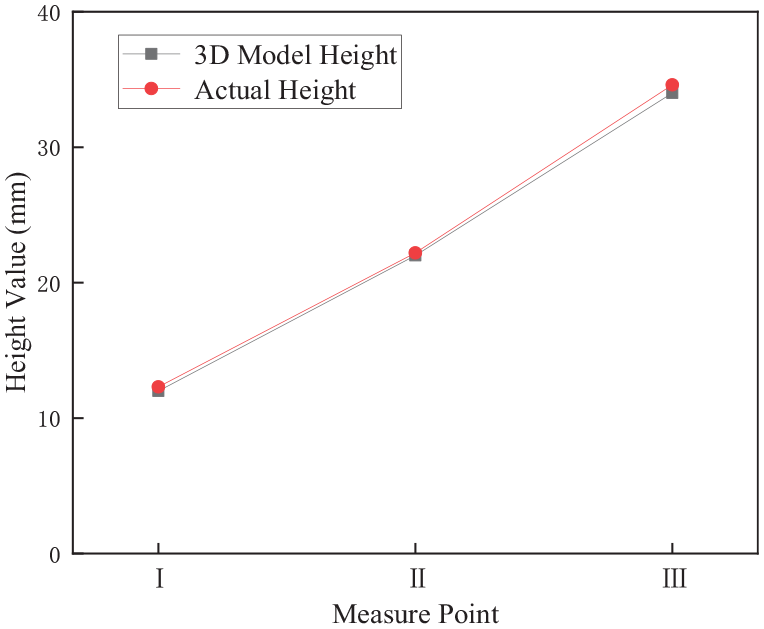
Height of component at three measurement points.
Conclusion
This paper proposed a forming control strategy to improve the manufacturing precision of multi-layer multi-bead components. The conclusions can be summarized as follows:
a width-height prediction model was established and can be used to obtain the weld width and weld height under various welding parameters.
The influence of the material shortage region on forming accuracy was analyzed and the shape follow-up edge cycle compensation method was proposed to eliminate the material shortage region. The edge compensation tool path can be increased according to the geometric features of the component; therefore, it is not necessary to change the welding parameters during the welding process to improve forming accuracy. Furthermore, combining the neural network model for predicting the weld width and height with the shape follow-up edge cycle compensation method enables offline programming.
The experimental results show that the shape follow-up edge cycle compensation method completely eliminates the material shortage region. In addition, the method is highly feasible and can be widely applied.
The forming control strategy improves the geometrical accuracy and increases surface flatness, which is of great significance in the precise forming of multi-layer multi-bead components. However, the proposed strategy neglects the influence of accumulated heat on the forming process and in our experiments, substrate deformation was large. In future research, the heat input must be controlled to further improving the geometric accuracy of the component.
Footnotes
Declaration of conflicting interests
The author(s) declared no potential conflicts of interest with respect to the research, authorship, and/or publication of this article.
Funding
The author(s) disclosed receipt of the following financial support for the research, authorship, and/or publication of this article: This research was financially supported by the National Natural Science Foundation of China (Grant no. U1733125, 51975410), the Natural Science Foundation of Tian Jing city (Grant no. 18JCYBJC19100, 17JCZDJC38700, 18JCYBJC18700) and Tianjin Municipal Education Commission Scientific Research Project (2019KJ011).