
Abstract
Selective laser melting (SLM) is a powder-based additive manufacturing technology that can be used to fabricate high-density components with complex geometry. Several studies have investigated the process parameters that affect surface quality. However, most researchers have ignored the importance of the scanning strategy. In this study, the Taguchi method was used to investigate the relation between warpage and fundamental parameters (laser power, scanning speed, overlap, and scanning angle) to fabricate stable and undistorted specimens. Moreover, several scanning strategies (offset scanning, line scanning, meander scanning, meander scanning with hatch vector, and lightning scanning) were applied to explore the influences on surface quality. The results revealed that meander scanning and lightning scanning generated consistent specimens without large deformation. The process parameters, such as an increased 45° scanning direction and 30% overlap, optimized the surface quality. A lower scanning speed (500 mm/s) could generate lower Ra of specimens, with the exception of lightning scanning with an increased 45° scanning direction. This study may contribute to the growing understanding of the scanning strategy in SLM.
Introduction
In recent years, three-dimensional (3D) printing, also known as additive manufacturing (AM), has been extensively used in many domains, including the aerospace, arms, medical appliance, and automobile industries. Compared with conventional manufacturing, AM can be used to fabricate individual complex components or hollow products using computer-aided design data because of the layer-by-layer fabrication procedure.1–3 The shape and geometry of products are largely unrestricted, allowing users to design ideal objects with more flexibility and accessibility. Additionally, material efficiency through the conventional processes, such as mold injection and metal cutting, is less than 20%, which is extremely low and results in a considerable waste of resources. Especially in aerospace component manufacturing, materials, such as titanium alloys, nickel-based super alloys, special steels, or ultra-high-temperature ceramics, are expensive. 4 By contrast, a material efficiency of more than 95% can be achieved because the remaining powder in AM is recycled. 5 Moreover, AM enables design flexibility. AM can reduce the cost of fixtures, molds, or dies, which is profitable for short-run production, further increasing the flexibility of the price of products. In microstructure and mechanical properties analysis, Trosch et al. 6 revealed that SLM processes not only demonstrated the same quality as conventionally forged or cast materials but also generated superior tensile mechanical properties. Therefore, AM is in a dominant position in the manufacturing industry.
Selective laser melting (SLM) is a metallic AM powder-based fusion process. Products of the SLM process consist of multiple layers of metal powder of various materials, such as stainless steel, titanium, and cobalt chrome, which is melted using high-intensity laser beams.7,8 However, SLM products of 98% density can be achieved, which can be used in aerospace applications, automobile components, and medical instruments. Support structures used to prevent overhang and undercut structural collapse are also fabricated during the SLM process.
In SLM processing, high-intensity laser irradiation enables the generation of large thermal gradients in the components. Defects such as deformation, mechanical properties, and internal porosity are common problems and easily solved through the optimization of process parameters. Furthermore, several types of scanning patterns have been investigated to reduce residual stress and fabricate complex specimens. In the manufacturing of most metallic products, SLM processing can be used to generate products of the same quality as products created using conventional methods.
Although SLM has several advantages, surface roughness is one of the major problems that should be addressed. In many applications, high surface roughness severely affects precision, which is critical during assembly. The surface roughness difference between SLM (Ra: 10–30 µm) and traditional methods such as milling and grinding (Ra: less than 1–2 µm) are large. 9 Although SLM is beneficial for the fabrication of complex products, the application of SLM is limited because of high surface roughness.
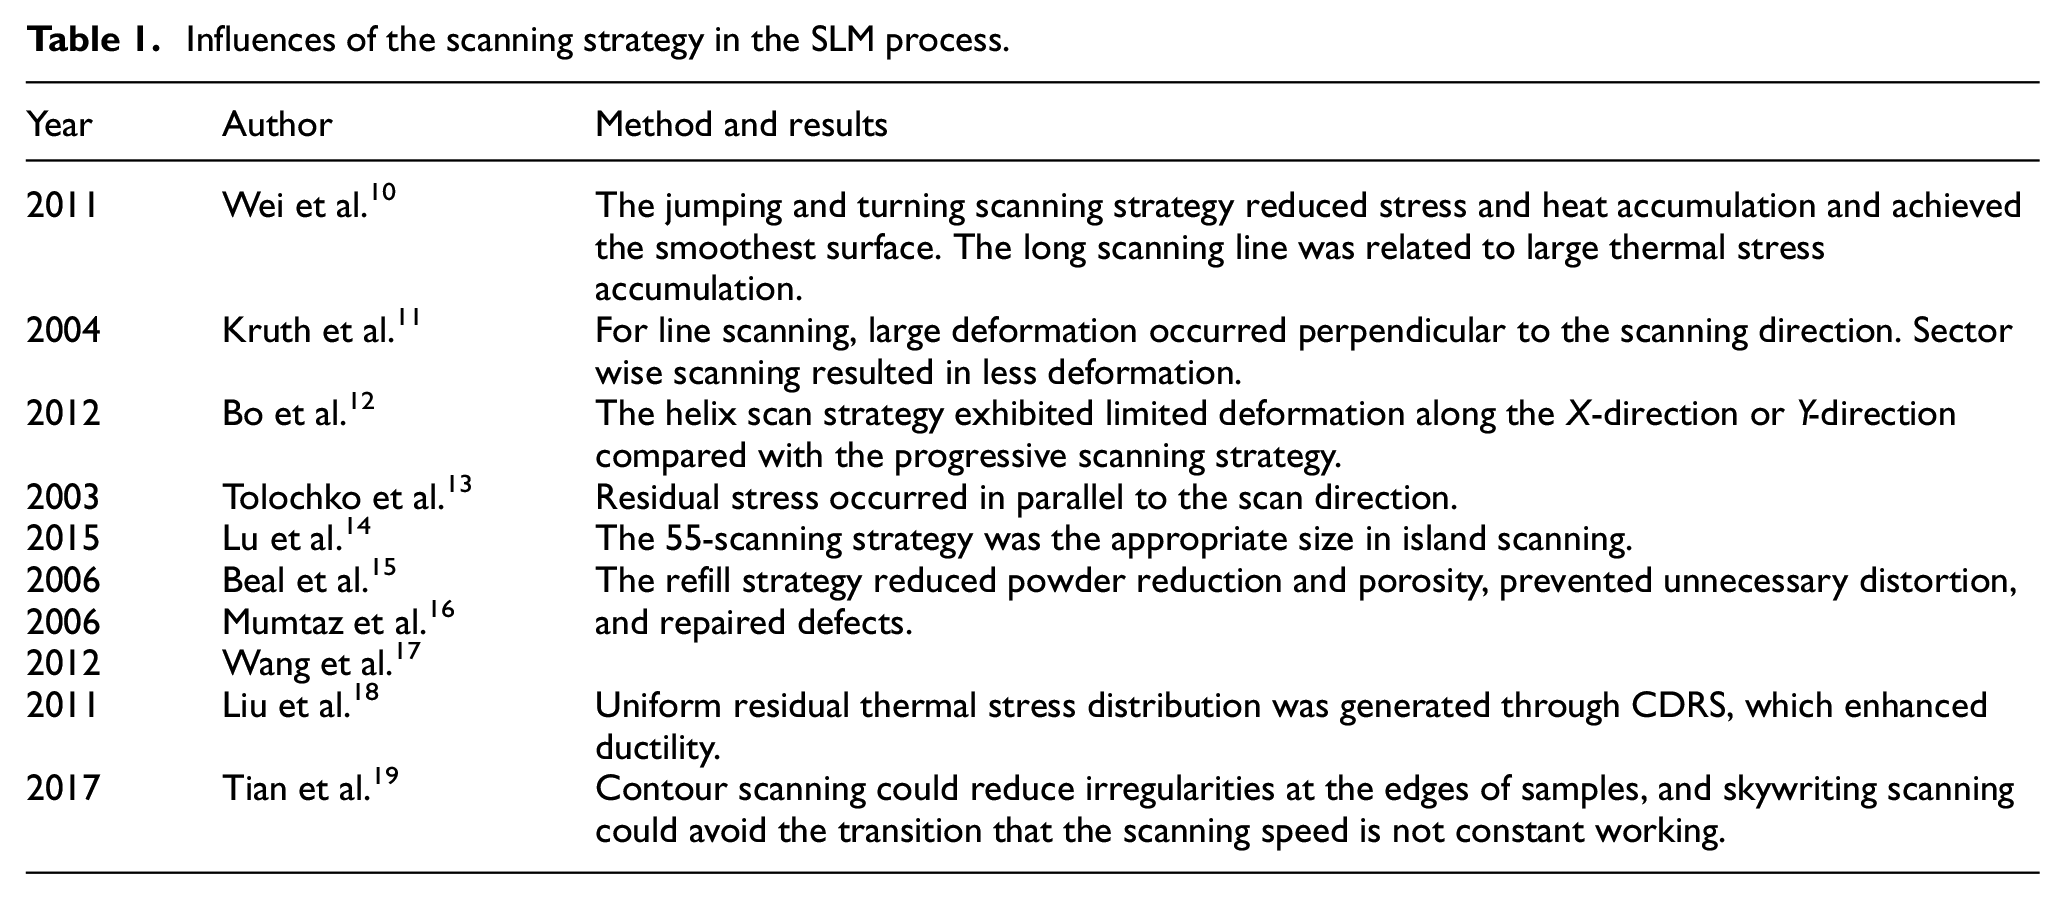
Several studies have revealed that the scanning strategy is correlated with temperature, stress, and distortion. Thus, the scanning strategy is a crucial parameter in the fabrications process. Wei et al. 10 investigated several scanning strategies, such as layering and turning, blocking and turning, internal to external circular, and jumping and turning strategies. According to the results, considerable balling effect and deformation were observed in the layering and turning strategy because of the large thermal stress accumulation resulting from the long scanning line. By contrast, the blocking and turning scanning strategy benefited from small scanning lines and generated fewer defects. However, the balling effect and metal accumulation were persistent in the boundary block. In the internal to external circular strategy, the balling effect and blind spots occurred at the center of the specimen. Insufficient cooling time was highly pertinent to a large amount of thermal stress accumulation, balling effect, and deformation. The smoothest surfaces were produced using the jumping and turning scanning strategy because stress and heat accumulation were reduced using a dotted scanning line.
Kruth et al. 11 obtained the same results as did Wei et al. 10 and mentioned that limited scan lines reduce deformation and thermal stress with or without the powder layer. Although the two strategies are different, short scanning lines resulted in less deformation and no significant differences were observed in the results of the strategies. From scanning experimental results, the minimum deformation was generated along the scanning direction. However, large deformation occurred in the direction perpendicular to the scanning direction.
Bo et al. 12 conducted a survey on reducing residual stress and deformation under the helix and progressive scan strategies. The helix scan strategy generated less Z-direction deformation along the X-direction or Y-direction. However, the progressive scanning strategy failed to fabricate the complex model. Tolochko et al. 13 mentioned that residual stress occurred parallel to the scan direction.
Lu et al. 14 scanned different island sizes. The microstructure, mechanical strength, properties, and residual stress were investigated in detail. A higher relative density was acquired for longer island sizes (the densities of 77- and 55-specimen were nearly 99.10%), and 22-specimen exhibited the lowest relative density, which was attributed to the occurrence of cracks. The pores decreased with increases in island size. Furthermore, mechanical property tests revealed the same tensile strength and yield strength in all specimens. The lowest residual stress appeared in 22-specimen scanning, which was again attributed to cracks. The 55-specimen scanning strategy was appropriate because of the high relative density and low residual stress.
Beal et al. 15 investigated the effect of several scanning strategies, such as the filling, sequential, alternated, and refill strategies, with functionally graded H13/Cu materials. The refill strategy benefits from lower powder reduction and porosity, leading to the fabrication of consistent tracks. Moreover, the lowest porosity and area reduction were generated by the refill strategy. In addition, Mumtaz et al. 16 and Wang et al. 17 revealed that the refill strategy can prevent unnecessary distortion and repair defects.
Liu et al. 18 investigated the microstructures and mechanical properties of 718 samples under single direction raster scanning (SDRS) and cross direction raster scanning (CDRS). No significant differences were found in tensile strength under the two different scanning strategies. However, the CDRS sample surpassed the SDRS sample in the ductility test. The CDRS sample had an advantage over the SDRS one in that it generated more uniform recrystallized grain sizes because of the uniform residual thermal stress distribution.
The scanning strategy has a critical effect on residual stress. An excessive accumulation of residual stress contributes to deformation and the balling effect, reducing the quality of surface roughness. Only few researchers have focused on the scanning strategy to improve surface quality. Tian et al. 19 demonstrated that contour scanning can reduce irregularities at the edges of samples, thereby increasing the surface quality. Furthermore, a decrease in the layer thickness reduces the Ra of surface roughness. Skywriting scanning avoided the transition that the scanning speed is not constant working. Yasa et al. 20 addressed the edge-effect problem using two scanning strategies. Although, the edge-effect problem could not be eliminated completely, the lowest edge appeared in island scanning. Overall, limited research has been conducted on the influence of the scanning strategy on surface roughness.
Table 1 depicts the effect of the scanning strategy on the SLM process. In this study, the scanning strategy was regarded as a critical parameter for optimizing the surface roughness. Studies have ignored the latent influences of the scanning strategy on the SLM process. Various scanning strategies have resulted in different surface qualities under the same conditions of laser power and scanning speed. This study may contribute to a better understanding of the scanning strategy in surface roughness.
Influences of the scanning strategy in the SLM process.
Materials and methods
Equipment and materials
The experiment was conducted using an SLM machine with a fiber laser that had a wavelength of 1070 nm, maximum power of 500 W, and beam spot size of 60 µm. To prevent the SLM-processed components from oxidation, the concentration of oxygen in the working chamber was set to be under 0.2% during the process. The workspace size was 250 mm × 250 mm × 250 mm.
The corrosion resistance and weldability of 316L stainless steel are considerably superior to those of other stainless steels. Therefore, 316L stainless steel is widely used in industries. Thus, 316L stainless steel was selected for this study and used as the processing material, and the size range was 22–59 µm. The flowability of the powder is closely related to the distribution of the powder size. Small sizes of powder decrease the flowability of the powder, which generates nonhomogeneous powder layers and worse relative density. Spierings et al. 21 reported that if D10 was less than approximately 5–6 μm, the powder particles began to agglomerate.
The surface roughness of the specimen was measured using a Mitutoyo SJ-210 contact stylus surface roughness tester. The average surface roughness of three parts of the specimen was determined. A substrate placed beneath the surface roughness tester was used to increase its height to be the same as the specimen. The dimension of the specimen was 10 mm × 10 mm × 2.5 mm with a 30-µm layer thickness. Surface morphology images, single track images, and track width were acquired using an OLYMPUS BX51M. In warpage measurements, we used Vernier calipers to measure the four parts of the specimen and calculated the average.
Single-track fabrication
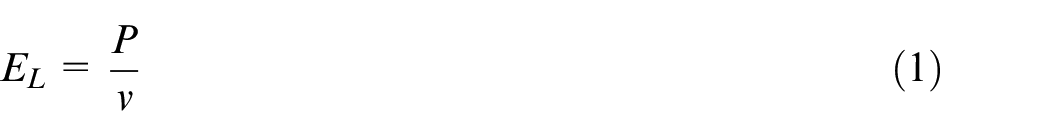
SLM-processed components are multilayered, and each layer consists of several tracks. Therefore, the quality of tracks essentially depends not only on the surface roughness but also the relative density of the as-built specimen. Several researchers have used many formulas to quantify the relation between the laser power and scanning speed, which is known as the energy density. Wang et al. 22 used linear energy density to interpret the experimental results of the single track. To compare the width of single tracks in the same conditions, the linear energy density was also used by Hong et al. 23
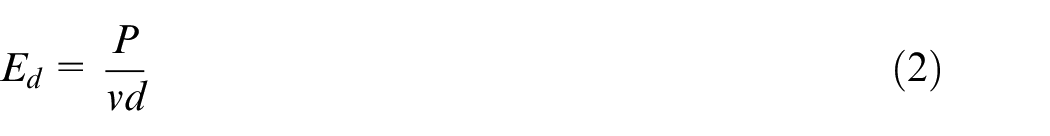
Although the ratio of power and speed can be used to identify the tracks, the change of laser spot diameter results in the generation of different single tracks even for the same values of p/v. Campanelli et al. 24 regarded laser spot diameter as a parameter in the energy density to survey the depth and width of the melting pool.
Moreover, Ciurana et al. 25 and Gong et al. 26 applied the volumetric energy density (VED) to characterize stability, and layer thickness was assumed as the other parameter in the formula.
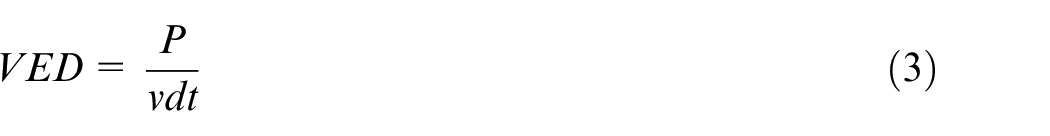
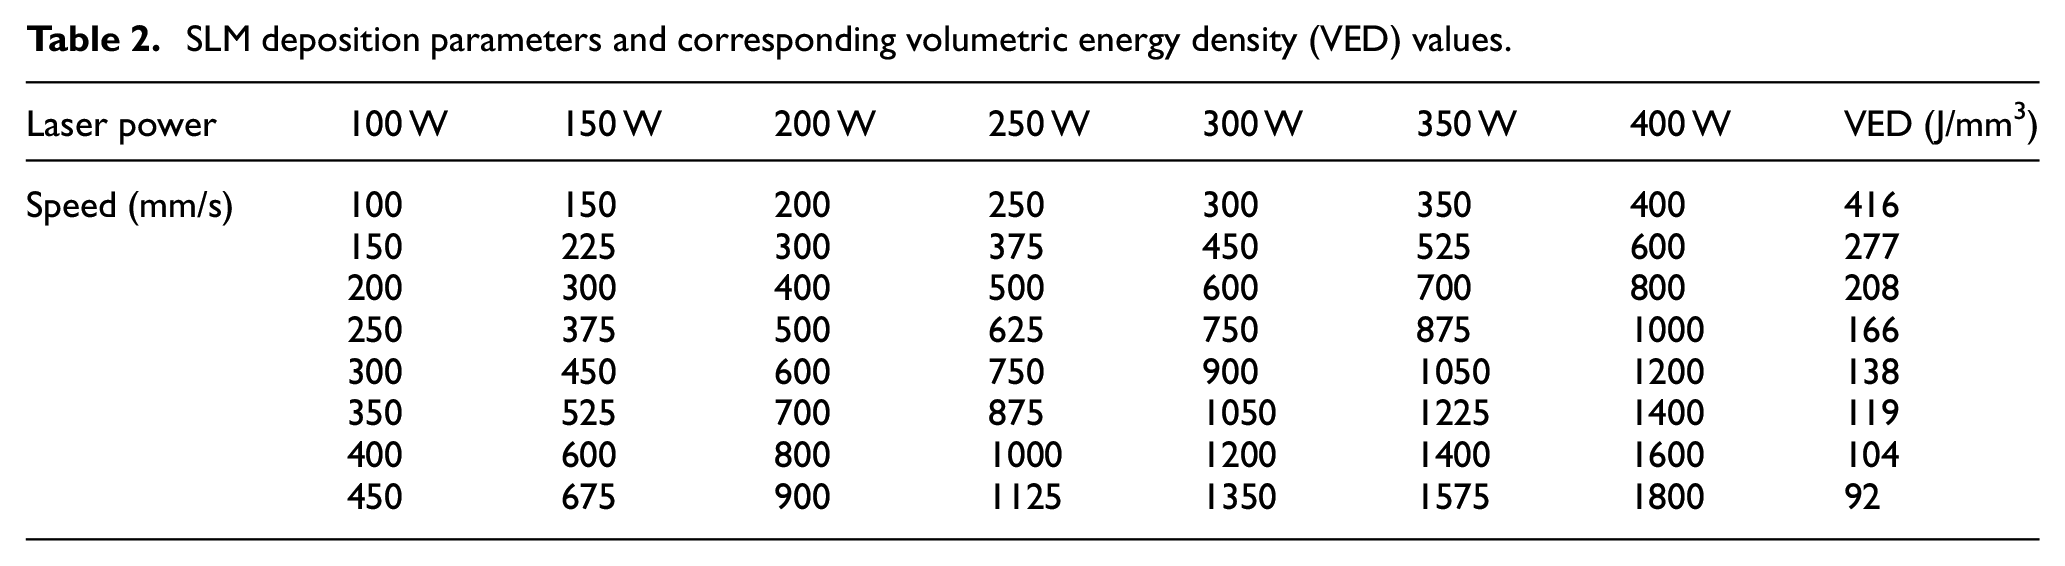
As mentioned, several formulas about energy density have been introduced. To investigate parameters related to single tracks comprehensively, VED was used to characterize the regular and smooth shape of the single track. Here, P is the laser power, v is the scanning speed, d is the laser beam diameter, and t is the powder layer thickness. To compare several laser power and scanning speed in the same conditions, Table 2 lists eight series of VED values. The laser power ranges from 100 to 400 with the cooperated scanning speed to reach an equal VED value. An appropriate combination of laser power and scanning speed were acquired to set up the Taguchi method. 27
SLM deposition parameters and corresponding volumetric energy density (VED) values.
Optimization using the Taguchi method
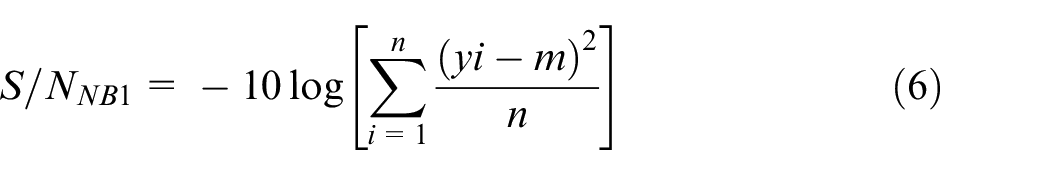
In this case, the primary goal was to fabricate a specimen with a value equal to the required value. The height of the specimen was identified as the quality characteristic. The ideal function is described as follows, where m represents the ideal value, and y is the measured value; the standard of the specimen height was set to be 2.5 mm.

In addition, the ideal function can be categorized into three types of conditions (larger-the-better, smaller-the-better, and nominal-the-best characteristics). In this case, nominal-the-best were suitable for the ideal function to reach the 2.5 mm height standard.
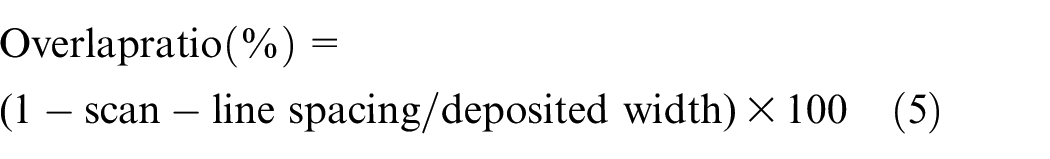
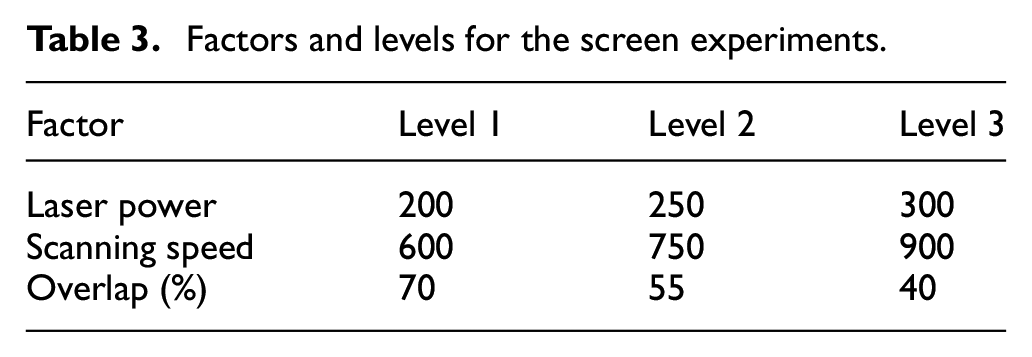
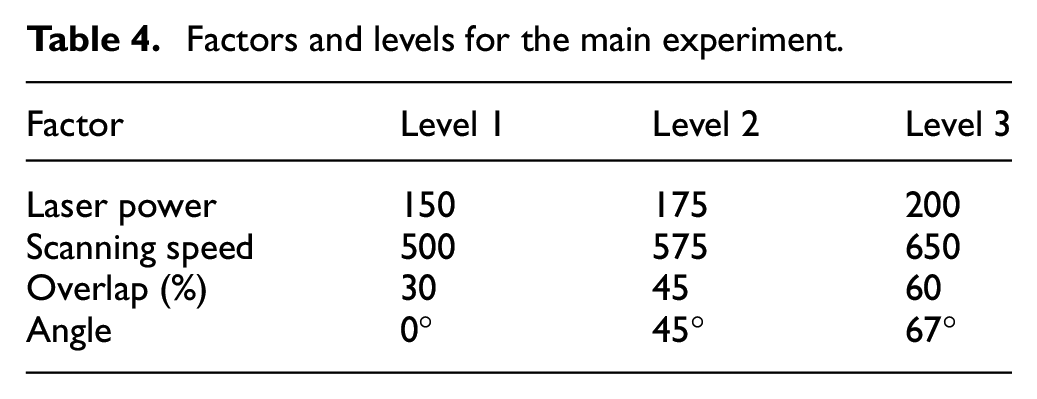
The parameters set by engineers are called control factors. These control parameters considerably affect the quality characteristic. For engineers, it is a challenge to decide the significant control factors. In the Taguchi method, a screen experiment is typically applied to determine the control factors and their setting levels. Table 3 depicts the major factors and levels for the screen experiments, which were selected from the single-track experiments. Because the laser was more than 300 W, the burned black condition occurred with the tracks. Additionally, the tracks that were formed with excess and insufficient values of VED were not selected. Furthermore, several studies have set the hatch space as the constant value. However, the single-width tracks are formed under different conditions. Therefore, the hatch space was set according to the width of the track, which is known as the overlap. The formula of the overlap ratio is depicted in (5). From the results of the screen experiment, appropriate levels of control factors can be determined. Table 4 depicts the factors and levels for the main experiments.
Factors and levels for the screen experiments.
Factors and levels for the main experiment.
The parameters that are uncontrollable and unpredictable are regarded as noise factors, also described as the factors causing different results even for the same levels of control factors. In the SLM process, the distribution of metal power is not exactly equal in the workspace, which is regarded as noise factors in this case.
Scanning strategy
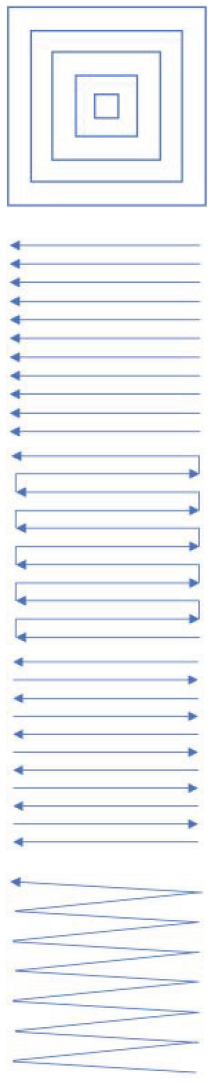
After conducting Taguchi methods, five scanning strategies shown in Figure 1 (offset scanning, line scanning, meander scanning, meander scanning with hatch vector, lightning scanning) were used on the optimized parameters, and all strategies were performed at an increased 45° angle for the scanning direction to investigate surface quality. The scanning strategy considerably affects thermal accumulation and residual stress. Excessive residual stress leads to deformation, and thermal accumulation without appropriate cooling time can lead to the balling effect on the surface of the specimen. Cheng et al. 28 focused on the simulation of stress and deformation under different scanning strategies in the SLM process. However, these results have not been verified yet. Therefore, the simulation conducted by Cheng et al. 28 can be compared with our experimental results to investigate the influences of the scanning strategy.
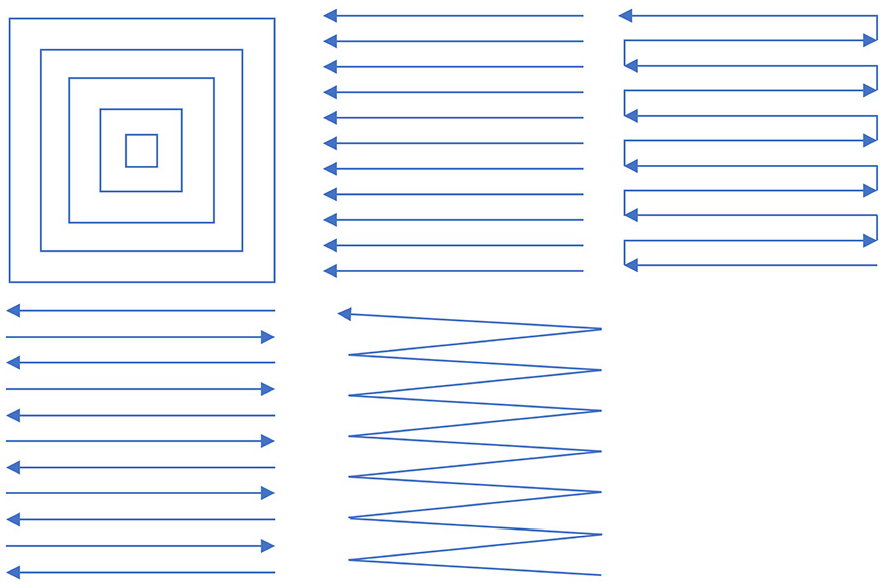
Offset scanning, line scanning, meander scanning, meander scanning with the hatch vector, and lightning scanning.
Results
Single-track characterization
The primary purpose of setting several different values of VED was to determine suitable ranges of laser power and rated scanning speed. Crucially, we surveyed various combinations of laser powers and scanning speeds with the same VED values. Figure 2 depicts the various types of single-track formation. The tracks in general were thicker and burned black at high VED values. By contrast, the discontinuous and thin tracks were related to insufficient VED values. Furthermore, the width of the tracks reduced linearly with the decrease in VED values in Figure 3. Even with the same VED values, the track formation was completely different. Thus, with the increase in the scanning speed, the width of the tracks decreased and the height of track increased. Under the VED values, the height of the track increased with the increase in the scanning speed. Flat tracks were generated with low laser powers. This section is divided into subsections to provide a concise and precise description of the experimental results. On the basis of these results, conclusions could be drawn.
Morphology of the single tracks.
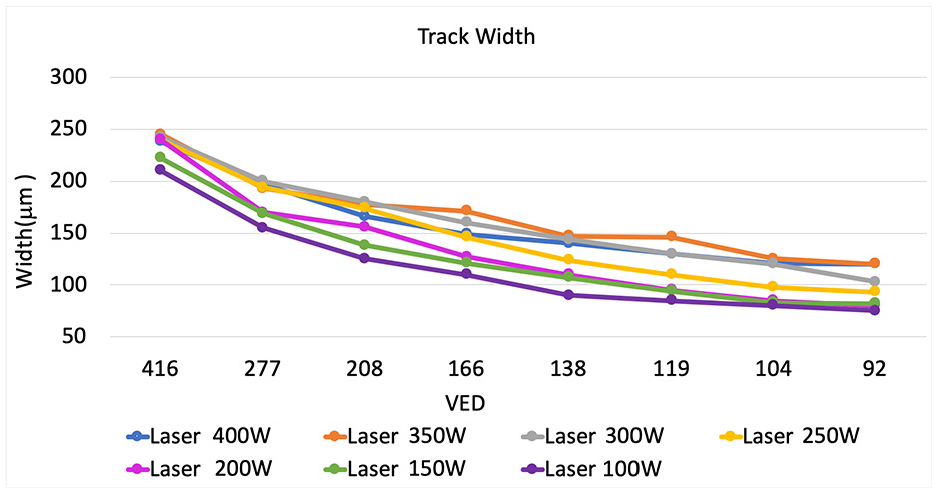
Width of the single tracks.
Figure 4 depicts the five types of single-track formation (balling, flat, continuous, prominent, and over burning tracks). Because the scanning speed reached 1200 mm/s, the balling tracks could not form the cylindrical shape. Even though the VED value was higher than 100 J/mm3, the continuous track could not be fabricated using excessive scanning speed. Several studies have revealed this phenomenon to be the balling effect, and it is attributed to Rayleigh capillary instability. High scanning speeds reduced the size of the melting pool. Once the wavelength of the liquid column exceeded its circumference, the liquid column dispersed into droplets.
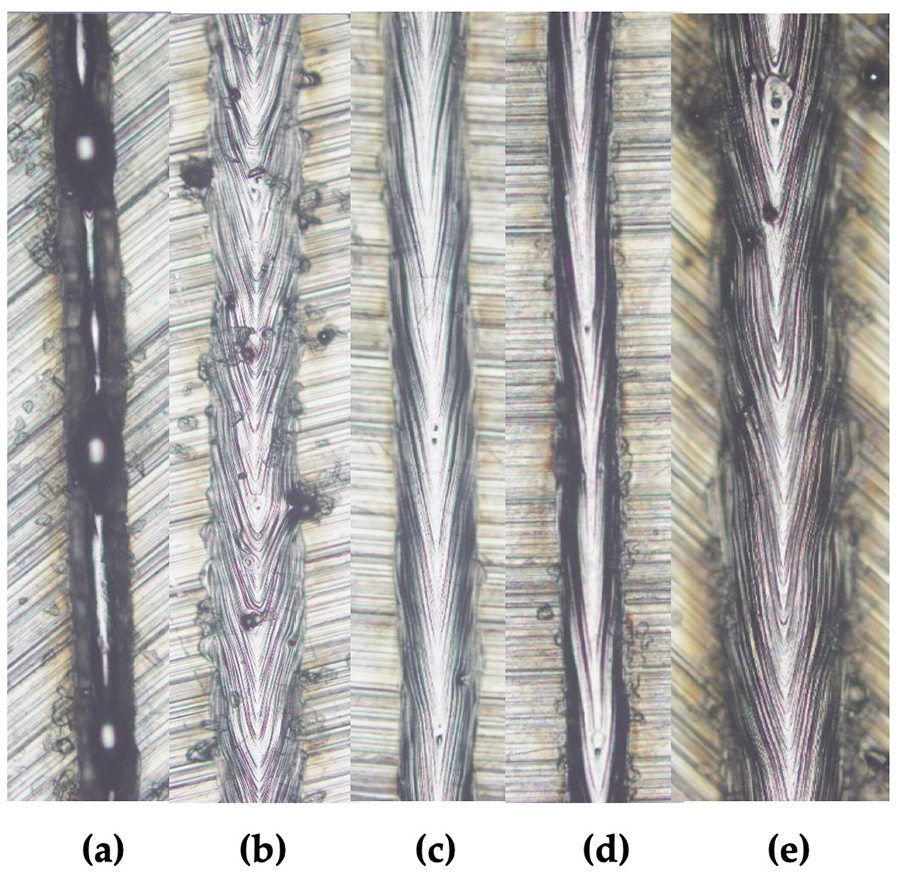
Five types of single-track formation: (a) balling track, (b) flat track, (c) continuous track, (d) prominent track, and (e) over burning track.
Flat tracks appeared under low laser power (100–150 W). Moreover, the unmelted residue frequently attached to the flat tracks. Although this defect is unpredictable and can occur in any type of single tracks, unmelted residue is related to low laser power. Additionally, the border of the flat track was more irregular than that of other types of tracks. A sequence of the irregular border of tracks appeared particularly with the laser power of 150 W.
The Type c track is the standard of continuous tracks, which are generated under a laser power of 250 W and scanning speed of 750 mm/s. Unmelted residue did not attach to the tracks, and the shape of track was even, stable, and continuous. Furthermore, the height of track increased because of higher scanning speed.
Prominent tracks formed at laser powers of 300–400 W and scanning speeds of 700–1200 mm/s. No signature difference occurred between the prominent tracks and continuous tracks. No defects, such as unmelted residue, irregular border, and distortion, were observed in prominent tracks. However, the burned black condition was observed with the prominent track in both 138 and 106 J/mm3 values, which indicated that the laser power was excessed. The excess laser power increased the depth of melting, which caused the melting depth is greater than the thickness of layer. When the thermal energy reached the boiling point, the vaporization of alloy resulted in air bubbles, which is also known as the keyhole phenomena. The enhancement of porosity reduces the mechanical strength of SLM-process samples, which is the most avoidable problem in SLM.
Overly burned tracks were generated because the VED values were more than 200 J/mm3. The tracks were extremely wide and thick, and more unmelted residue attached to not only the track but also the surface of the substrate. The occurrence of distortions and irregular borders in this type of track were higher, and a burned area surrounded the track. Over burning tracks reflect common defects that can occur in SLM.
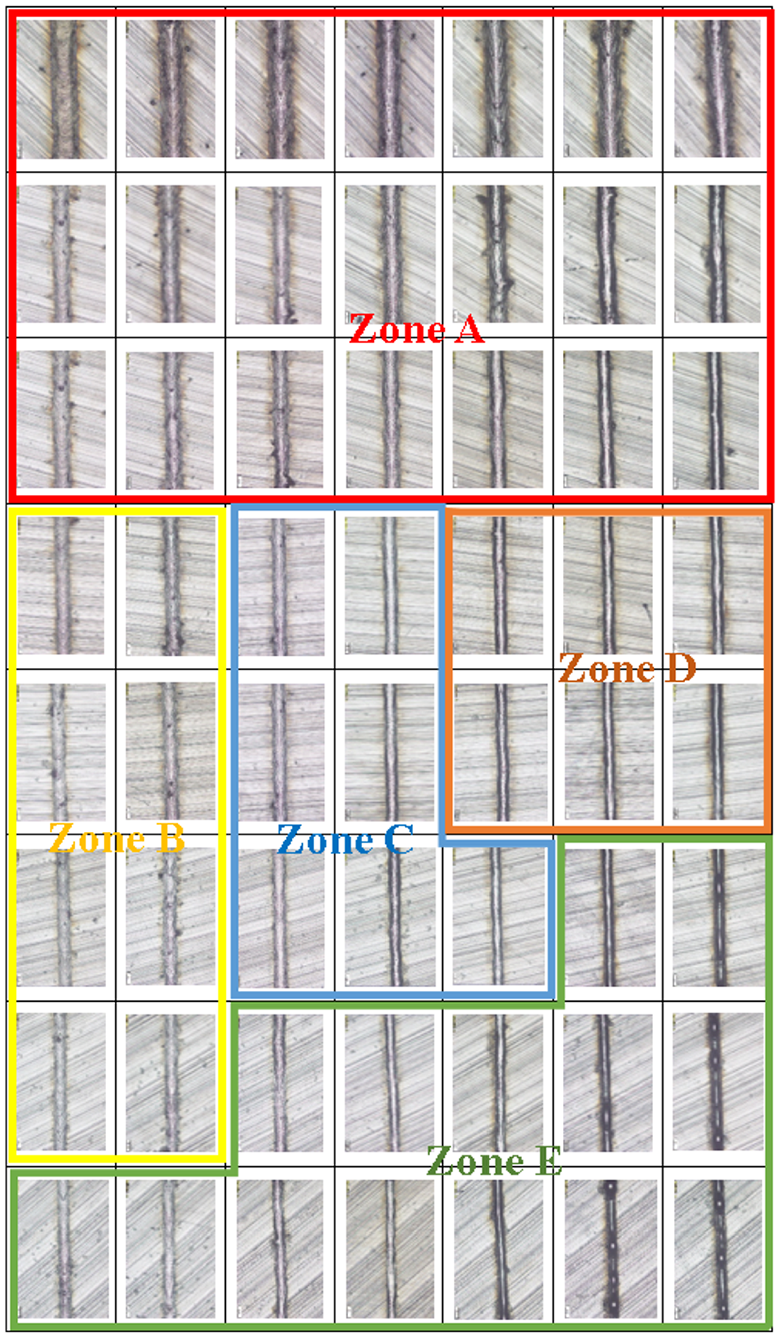
Figure 2 depicts the shape distribution of a single track. The tracks that were generated with insufficient VED values and excess scanning speeds were categorized in zone A. The flat tracks generated with laser powers of 100–150 W were characterized into zone B. Zone C depicts the distribution of continuous tracks, in the range of 119–166 J/mm3 values with the laser power range of 200–300 W and scanning speeds of 600–1000 mm/s. Prominent tracks were revealed in zone D. Although the tracks are continuous, the excess laser power can lead to a keyhole. Over burning tracks were generated in large VED values (200–400 J/mm3) in zone E. The suitable combinations of laser power and scanning speed that are distributed in the blue area of the shape map were analyzed using the Taguchi method, which is presented in the next section.
Taguchi experimental results
Control factors have a strong effect on the ideal function. Factors such as the laser power and scanning speeds were crucial in the SLM process. If the distorted specimen was fabricated because of an inappropriate combination of these two factors, we would not be able to investigate the influences of other factors. Although we require smooth and continuous single tracks, we still cannot guarantee the generation of the specimen without severe distortion. Therefore, we decided to conduct screen experiments to understand the initial circumstances of control factors.
As depicted in Figure 5 for screen experiments, excess laser power appears to be highly related to distortion, which causes manufacturing failure. Regardless of the scanning speed, all the specimens collapsed when the laser power was 250 W. Notably, the smoothest single track that was generated with a laser power of 250 W and scanning speed of 750 mm/s failed to form a stable specimen. In the initial process of fabrication, no deformation occurred in the specimen when Type c tracks were used. However, the accumulation of thermal energy enhanced with additional layers caused the vaporization of the alley. Therefore, the laser power should be set to less than 250 W to prevent large deformation. Notably, stable specimens were generated at a laser power of 300 W and scanning speed of 900 mm/s.
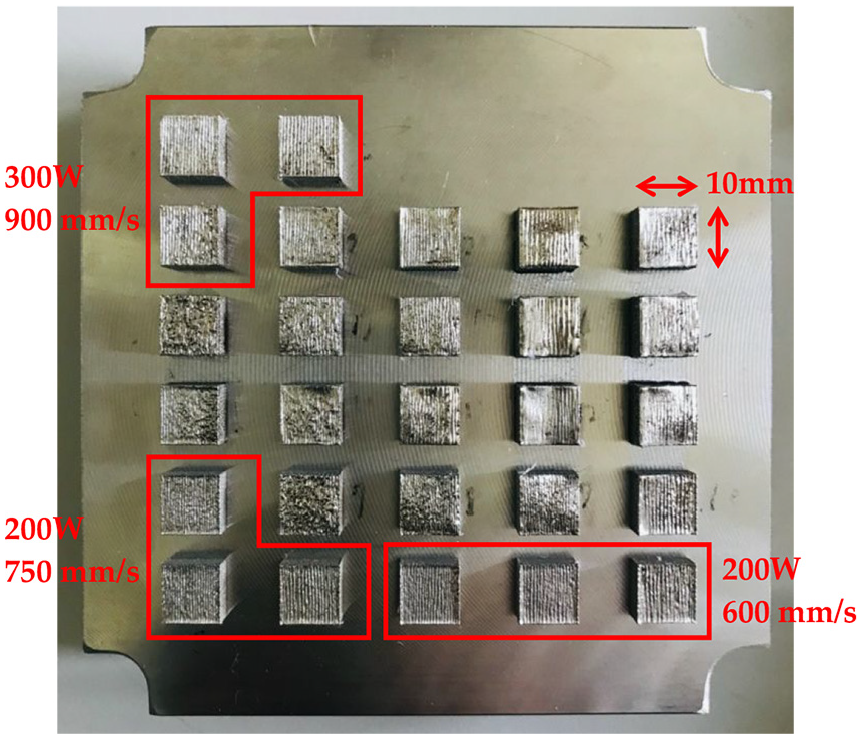
Specimens by screen experiments.
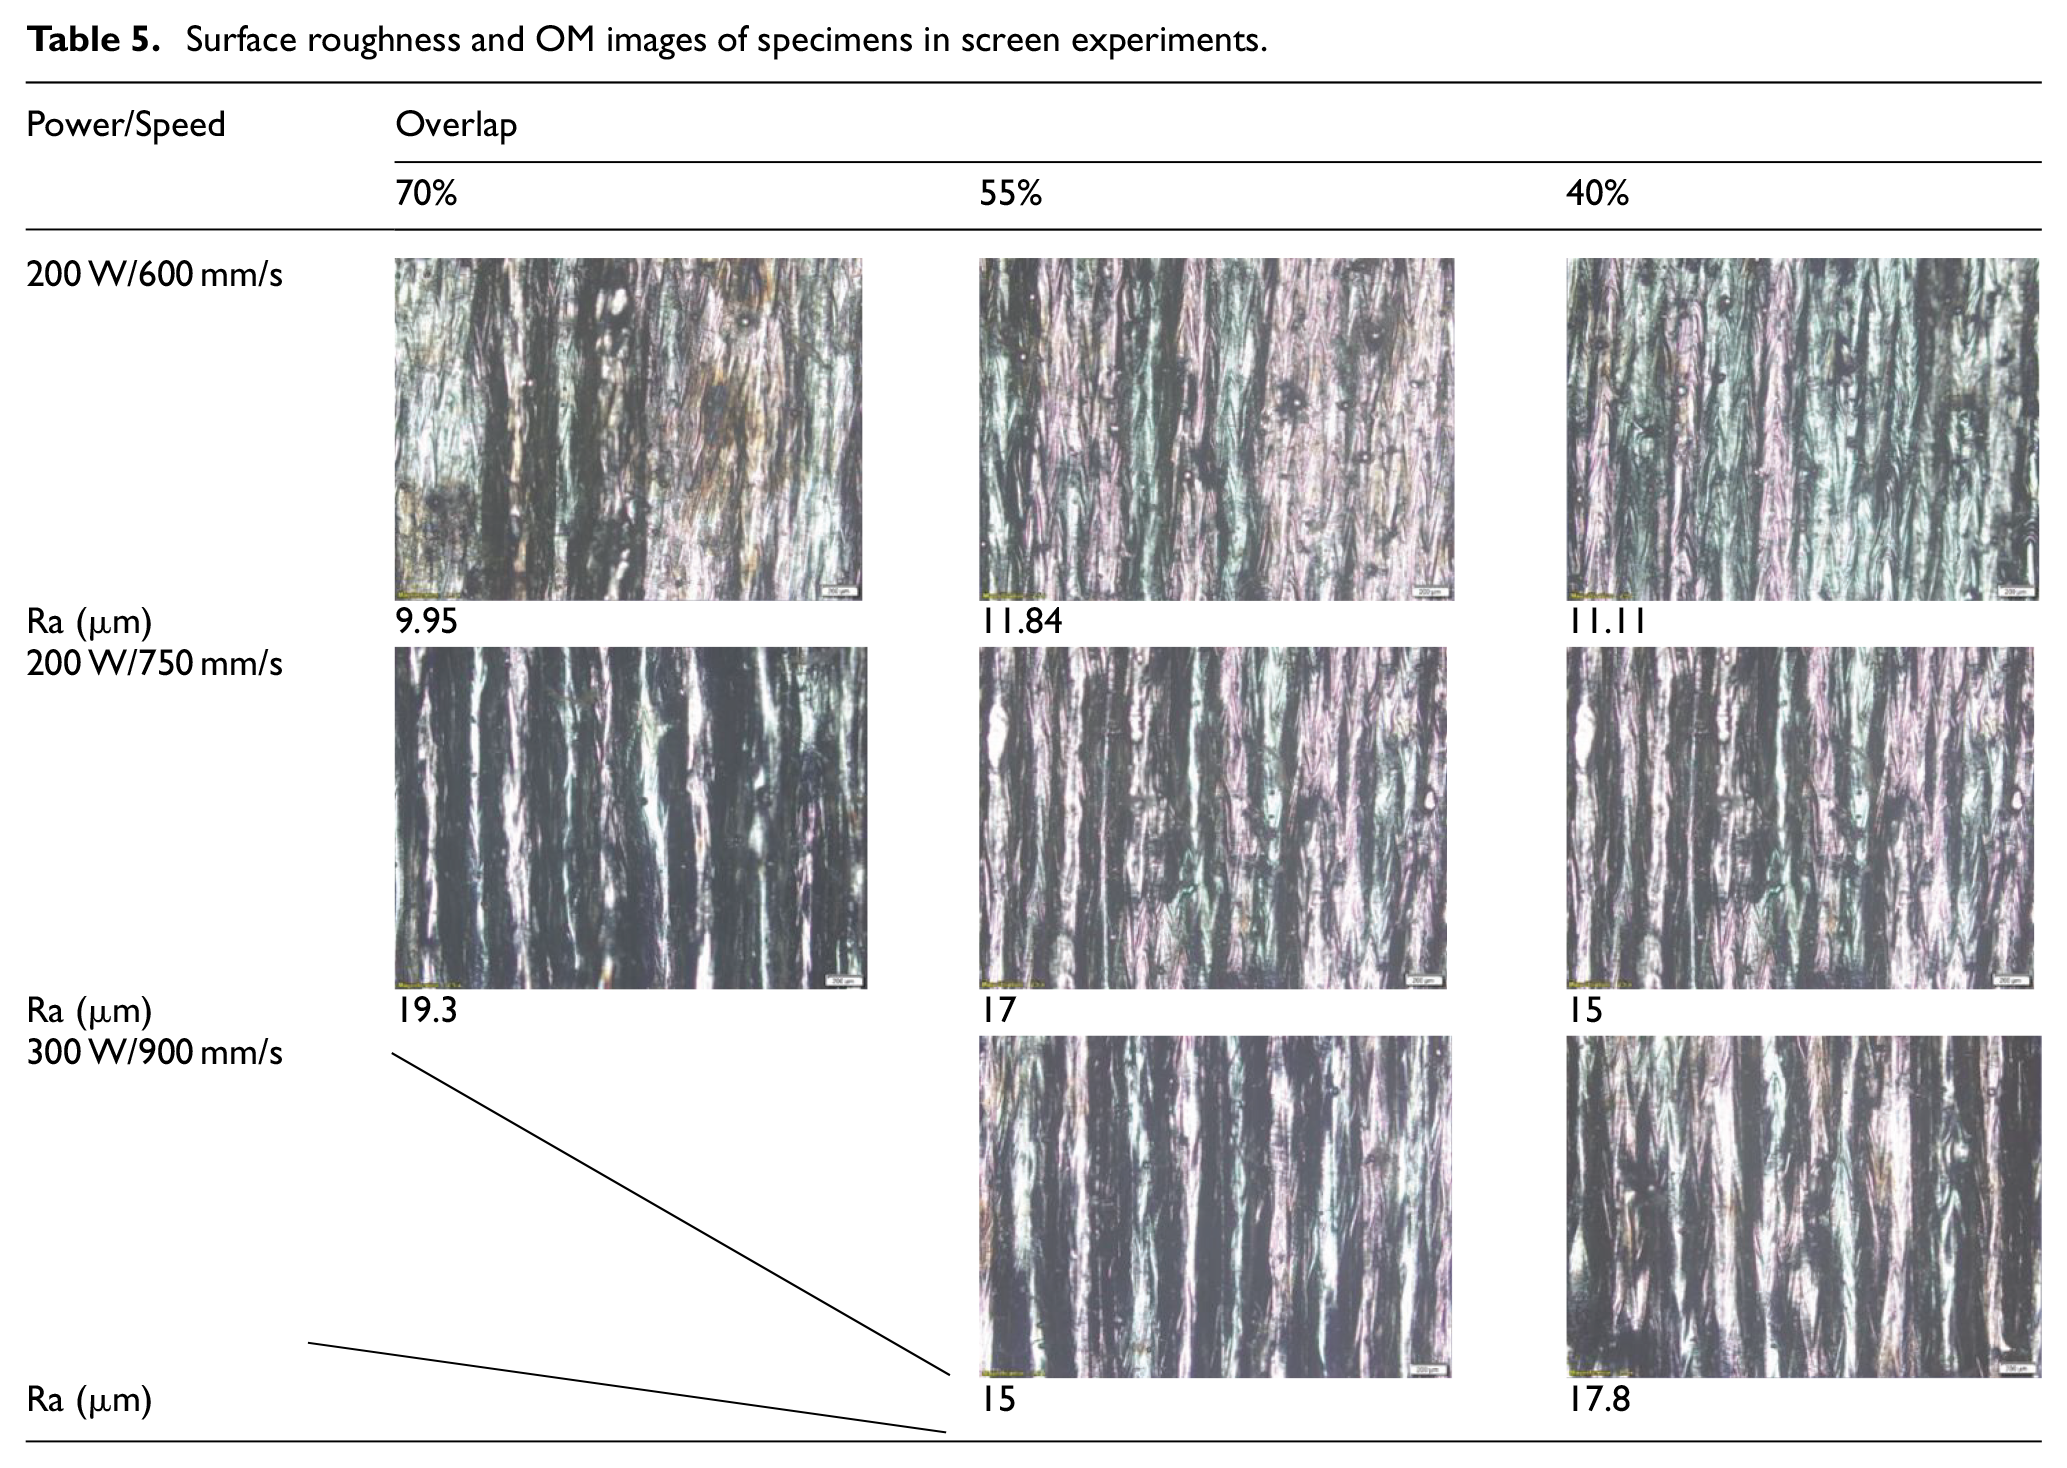
Stable and nondistorted specimens appeared at the laser power of 200 W with both 600- and 750-mm/s scanning speeds. At the scanning speed of 900 mm/s, insufficient VED was unable to melt the practical to form a consistent specimen. We measured the surface roughness of stable specimens to investigate whether the overlap could cause a significant effect. The results are presented in Table 5. Overlap is associated with surface quality, and the difference value was 3–4 Ra (Ra is the arithmetic average of the absolute values of the profile height deviations from the mean line). Under a laser power of 200 W and scanning speed of 600 mm/s, the lowest Ra occurred with 70% overlap, which was also the lowest of all screen experiments. However, a large distribution of over burning was observed with 70% overlap. For a laser power of 200 W and scanning speed of 750 mm/s, 70% overlap caused the worst surface roughness. Furthermore, a stable specimen did not form under a laser power of 300 W and scanning speed of 900 mm/s with 70% overlap. Therefore, the value of overlap should not be more than 70%. We investigated the influence of scanning speed on the surface quality. Under the same laser power and overlap (55%, 40%), a lower scanning speed was related to superior surface roughness. When the scanning speed was increased, the track width decreased but the track height increased. 29 The shape of the track became more spherical, which increased the concave area between the peak and crest and degraded the surface quality (Figure 6).
Surface roughness and OM images of specimens in screen experiments.
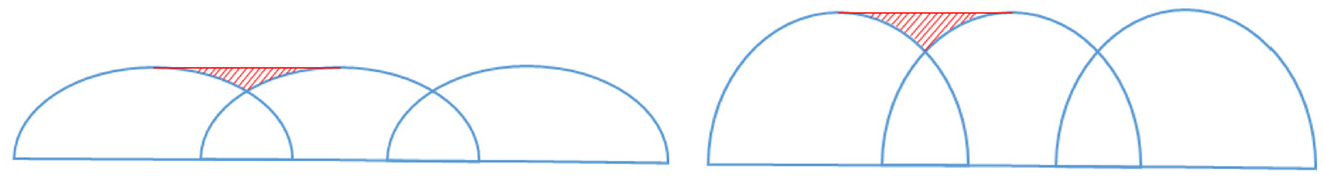
Overlap diagram of sequence melting tracks.
Analysis of the data and process optimization
The signal-to-noise ratio (S/N ratio) is as a measuring quality in the Taguchi method. An increase in the S/N values indicates that the variance of quality characteristics has decreased. The primary goal is to determine the factors setting that minimizes response variation when adjusting or maintaining the process on the target.
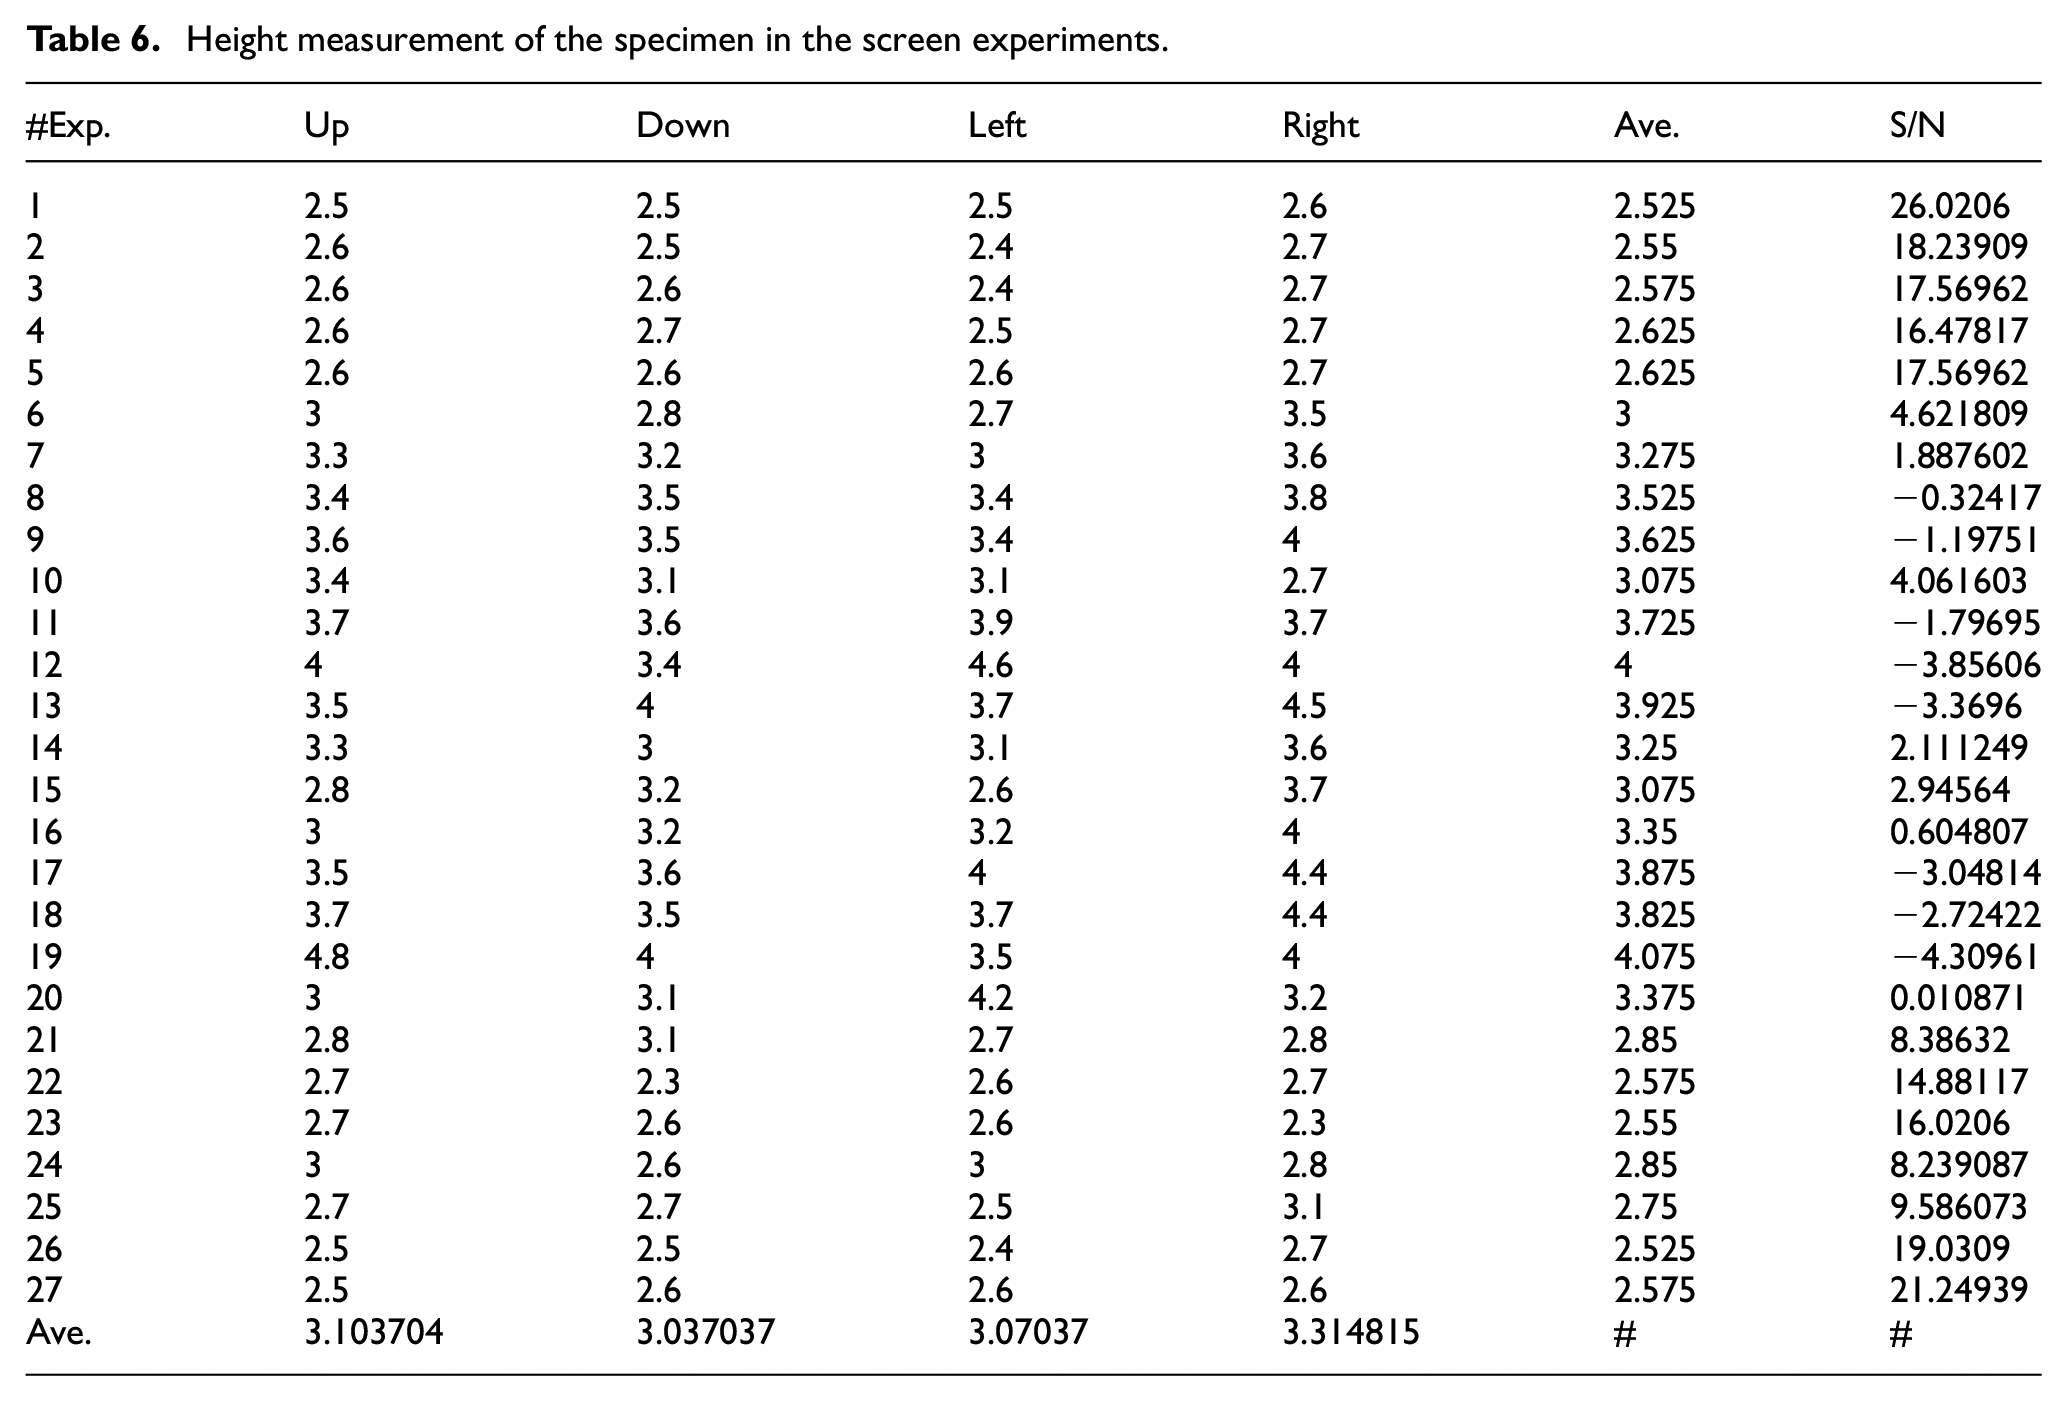
The purpose of this experiment was to determine the optimal factor combination that results in the lowest warpage for the 3-mm-tall sample. The four heights were measured on the four edges of the sample. Table 6 depicts the height measurements of the specimen. The closer the height of the specimen is to the nominal value, the more the S/N ratio increases because of the nominal-the-best characteristics. Moreover, the right part of the specimen exhibited a severe warpage phenomenon. This result is consistent with those of Kruth et al., 11 and large deformation occurred in the direction perpendicular to the scanning direction.
Height measurement of the specimen in the screen experiments.
Process optimization can be achieved through three major procedures. In the beginning, the effect of all factors can be realized according to the main effect for the S/N ratios. To decrease the variance of quality characteristics, we selected the factor that significantly affected the S/N ratios. The laser power (the effective range for the S/N ratio is 11.77) and scanning speed (the effective range for the S/N ratio is 5.83) are the factors that are relevant to the S/N ratios. Second, we selected the factors to adjust the means of quality characteristics close to the target value without influencing the variance of quality characteristics. Factors such as the increased angle (the effective ranges for quality characteristics and S/N ratio were 2.14 and 5.83, respectively) are regarded as adjustment factors. The remaining factor was nonsignificant to the S/N ratio and the means of quality characteristics, and we set their levels to ensure the cost minimization.
The maximum S/N ratio value occurred at a laser power of 150 W (P1) and scanning speed of 575 (V2), which were used to reduce the variance of quality characteristics. Furthermore, an increased angle of 45° was used to adjust the means value. When the overlap was regarded as the nonsignificant factor, we set a 30% overlap (A1) to reduce the cost of the material. Finally, the most appropriate combination of factors was P1V2R1A1.
Scanning strategy effect
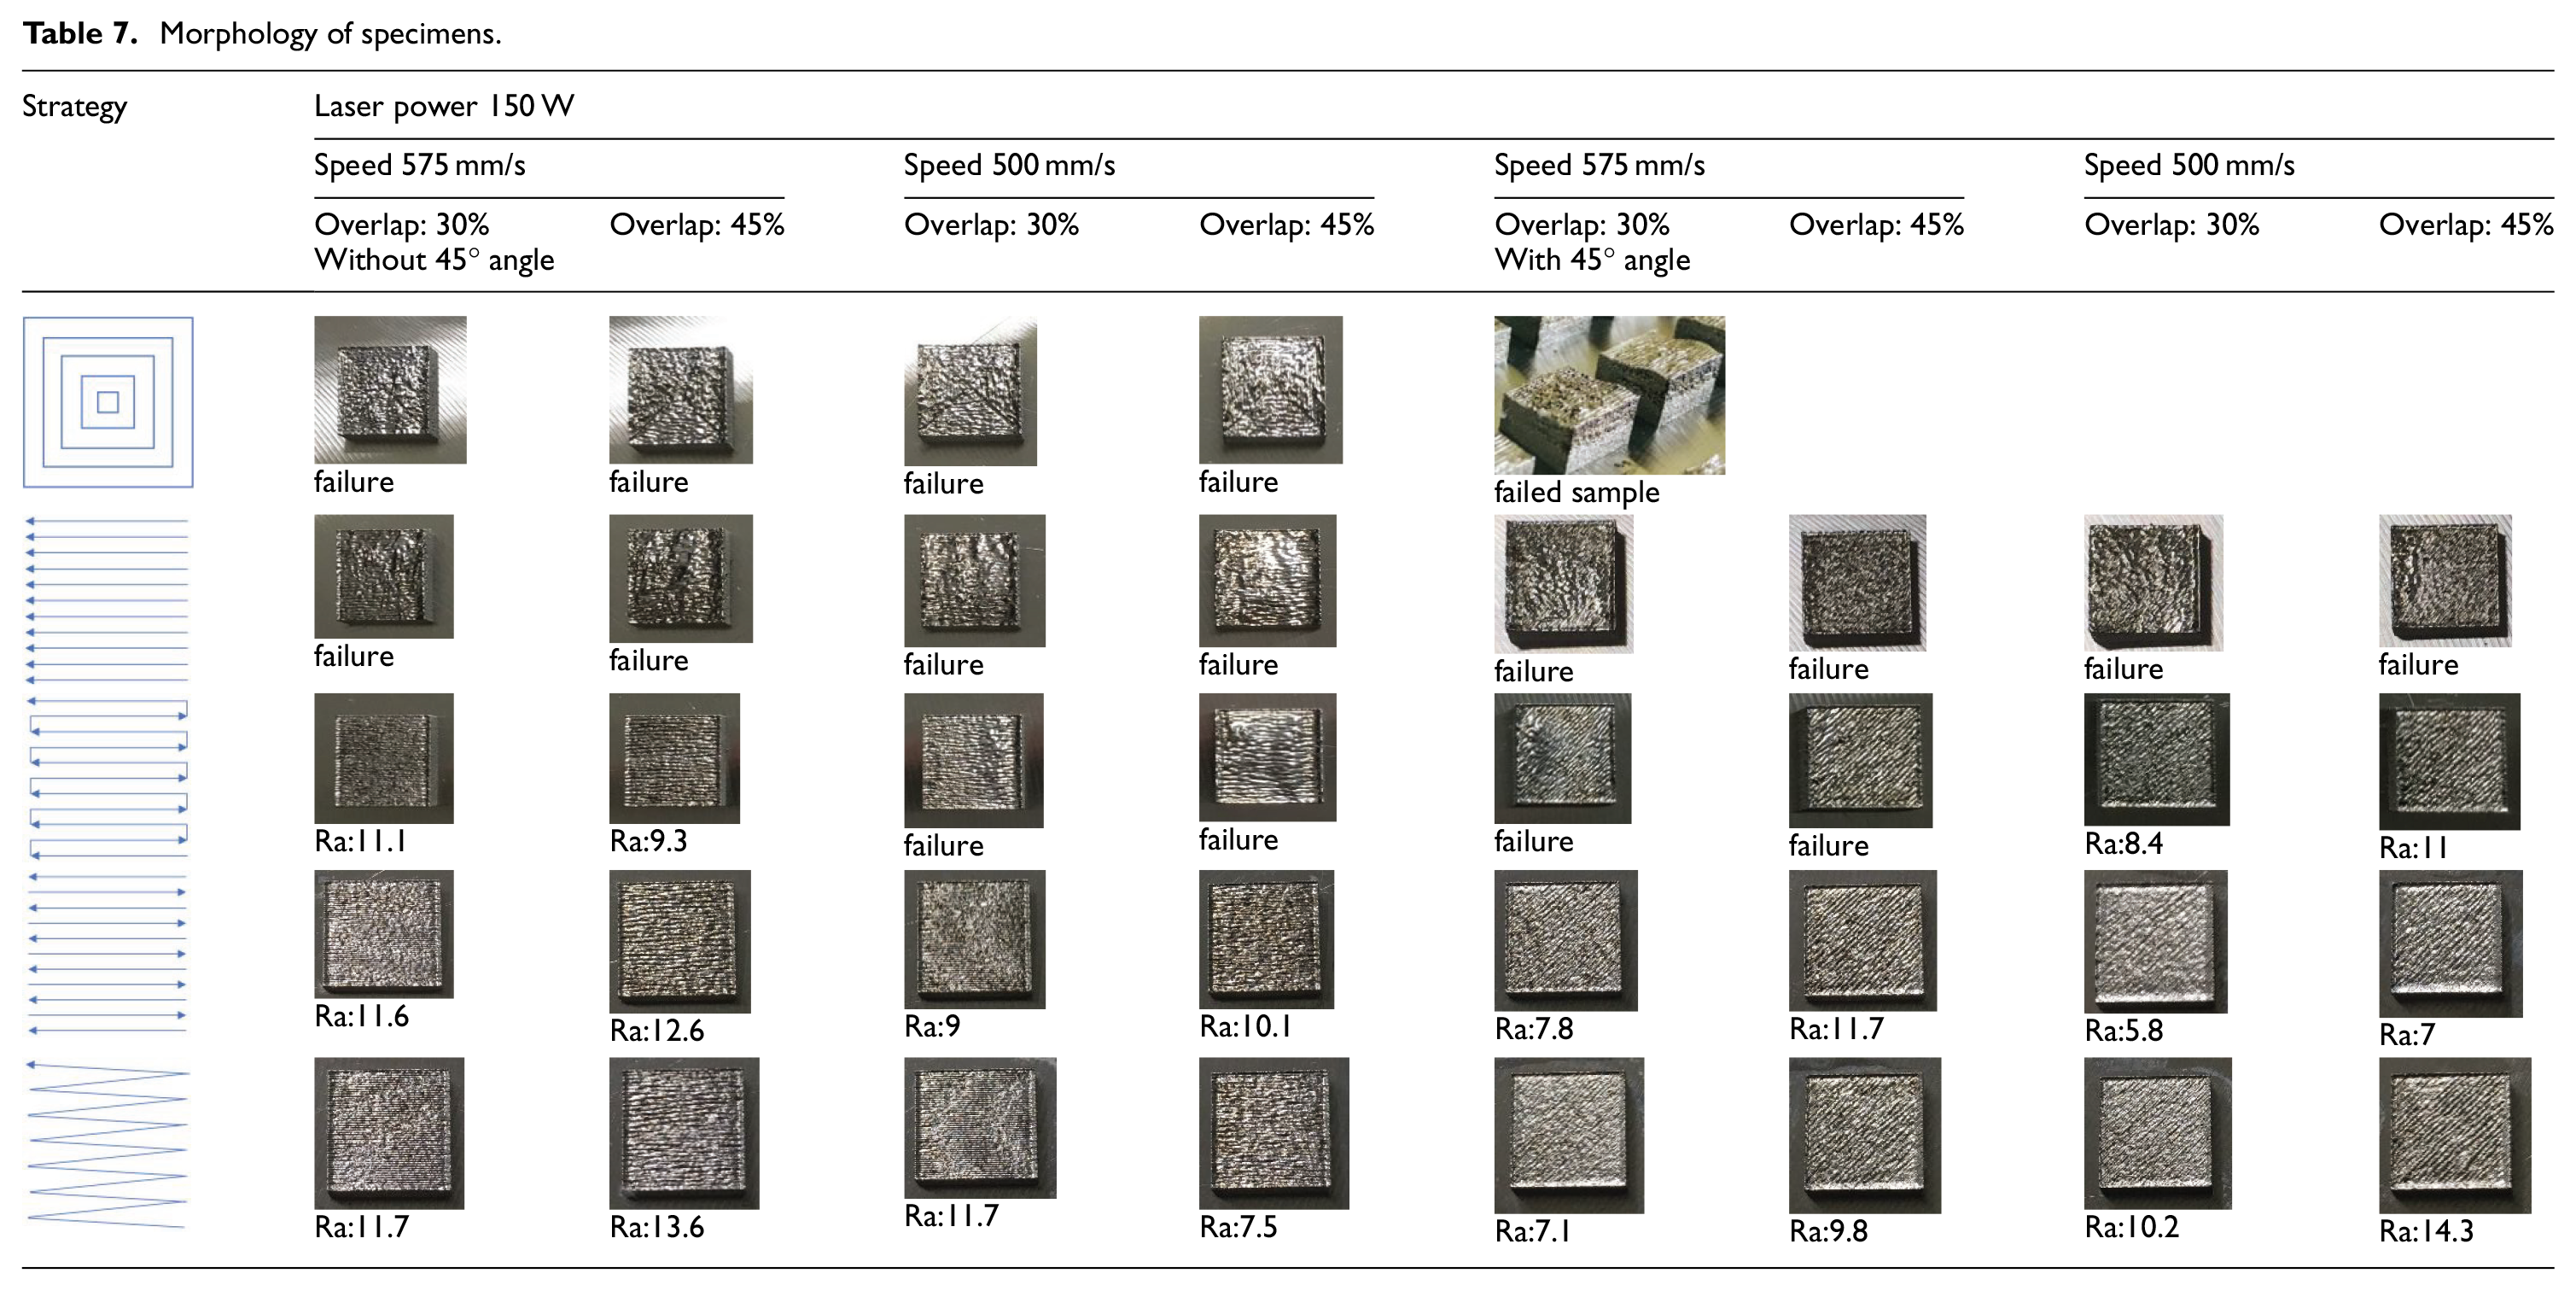
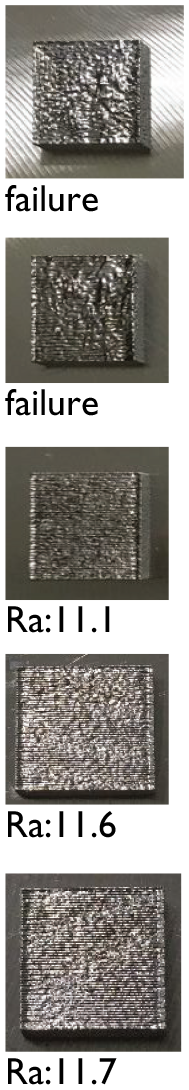
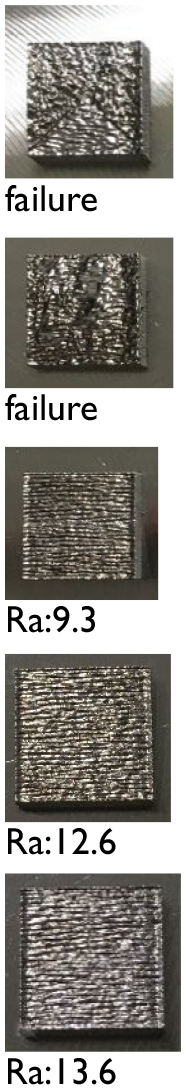
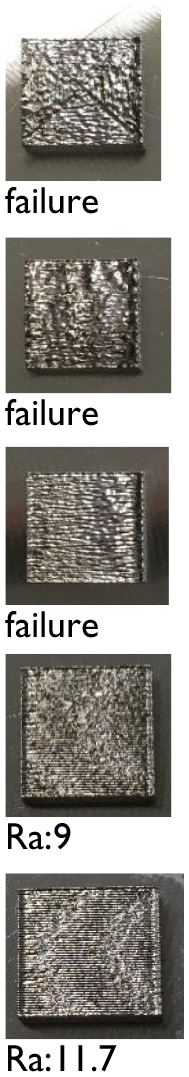
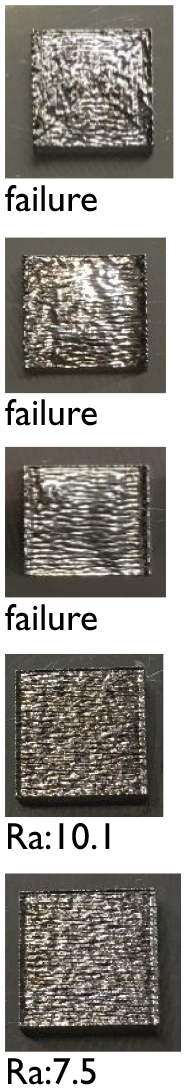
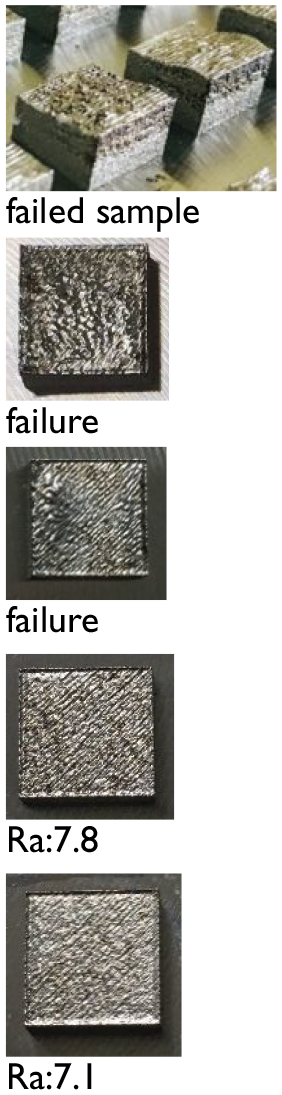
Specimens that were generated under different scanning pattern, overlap, and scanning speeds are depicted in Table 7. Although the optimized combination of parameters was acquired using the Taguchi method, we investigated several scanning effects under various conditions to enhance the accuracy of this study. The specimens surrounded by a red frame were regarded as having severe deformation. The stable specimens without severe deformation are depicted in the blue frame. Specimens were regarded as a failed sample if Ra could not be measured on the surface because of warpage or deformation.
Morphology of specimens.
Discussion
Offset scanning strategy
Offset scanning failed to generate consistent specimens, which resulted in the failure of surface roughness measurements. A large distribution of deformation was obtained in specimens under different scanning speeds (500 and 575 mm/s) and overlap (30%, 45%). According to the simulation of stress and deformation under several scanning strategies by Cheng et al., 28 the largest stress was observed for the out-in strategy. Although the offset strategy and out-in strategy are slightly different, the simulation was consistent with the experimental results. Furthermore, both Wei et al. 10 and Kruth et al. 11 revealed that the long scanning line was related to deformation and thermal stress. Therefore, the initial long path of the offset filling strategy may generate large deformation and residual stress. Moreover, the path of the offset filling strategy decreased as the scanning progressed to the center of the specimen, which resulted in large thermal gradients of the cooling time between the inner and outside area. In conclusion, failure to form a stable specimen may be related to a long scanning line and large thermal gradients of the cooling time.
Line scanning strategy
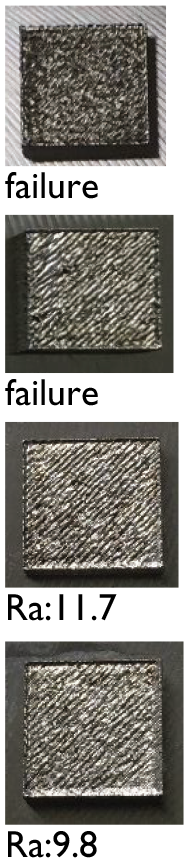
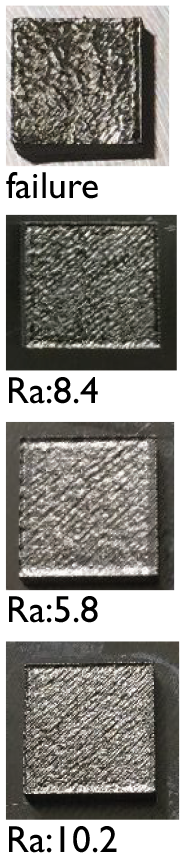
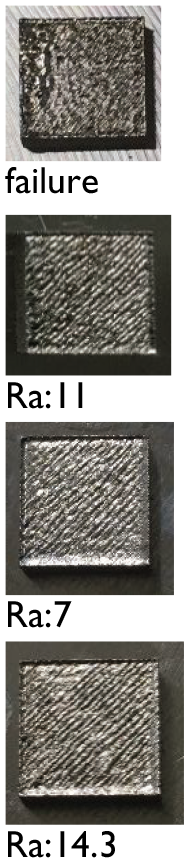
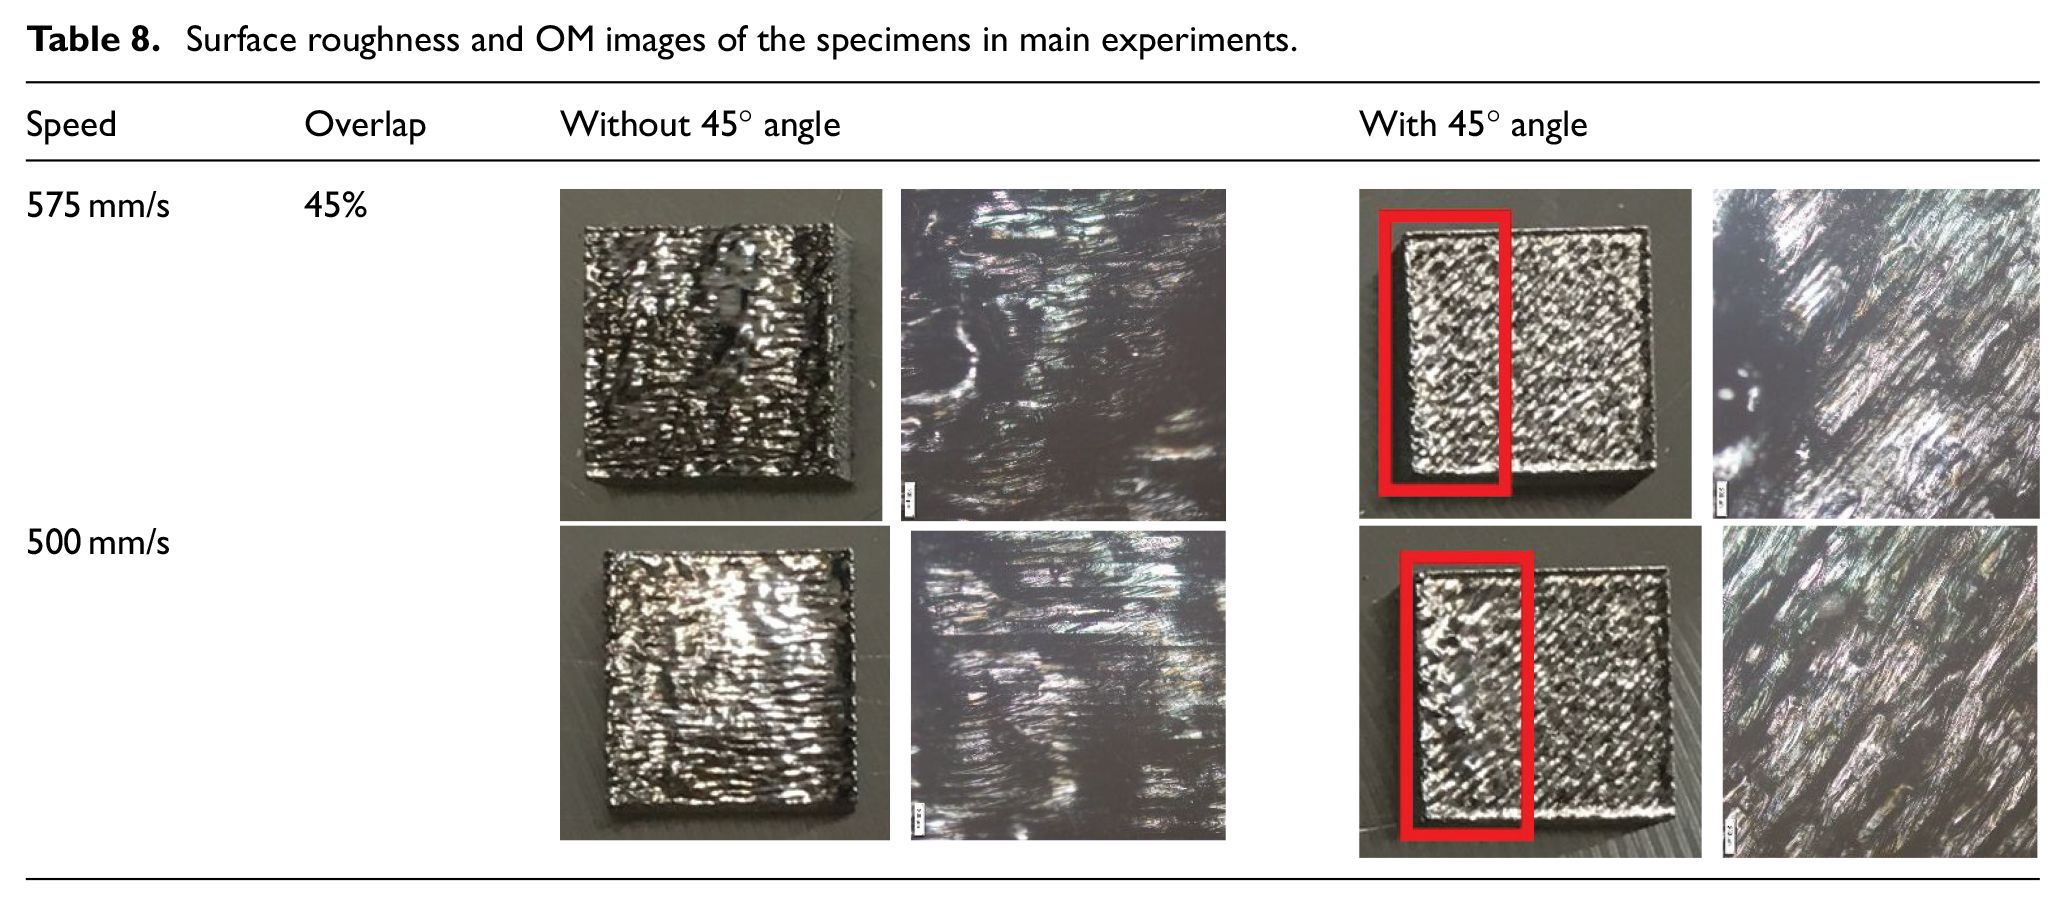
The line scanning strategy resulted in the same failure as the offset scanning strategy did, and distorted specimens were generated under all combinations of parameters. Therefore, we increased the 45° scanning direction for the line scanning pattern to determine whether the deformation degree could be reduced. Table 8 presents a comparison of results with and without the 45° increased angle; more stable specimens were generated with the 45° rotated angle in the combinations of a speed of 575 mm/s with 45% overlap and a speed of 500 mm/s with 45% overlap. Only small distributions of deformation were observed in the left area of specimens. For the OM images of distorted specimens, the irregular fabrication of the surface was observed instead of continuous tracks. The specimens under 45° exhibited superior fabrication of surface quality. The failure of the line scanning strategy was likely related to unidirectional scanning directions. Tolochko et al. 13 revealed that residential stress occurred in the direction parallel to the scan. Consequently, large residential stress accumulated in the single scanning direction.
Surface roughness and OM images of the specimens in main experiments.
Meander scanning strategy with and without the hatch vector
In the meander scanning strategy, the transition between the endpoints of two adjacent hatch lines within a hatch block is joined. Normal meander scanning can generate specimens without severe deformation. Figure 7 depicts the measurement results of surface roughness of the specimens. The lower Ra values of surface roughness appeared with 30% overlap in each experiment. Moreover, the lower scanning speed (500 mm/s) could optimize the surface quality. Furthermore, each surface quality of the specimen improved with the additional increased 45° scanning direction; this is consistent with the simulation by Cheng et al., 28 which indicated that the lowest residual stress and deformation were observed under 45° line scanning. Consequently, the lowest Ra (5.8 μm) of surface roughness was generated with an increased 30° angle and a scanning speed of 500 mm/s.
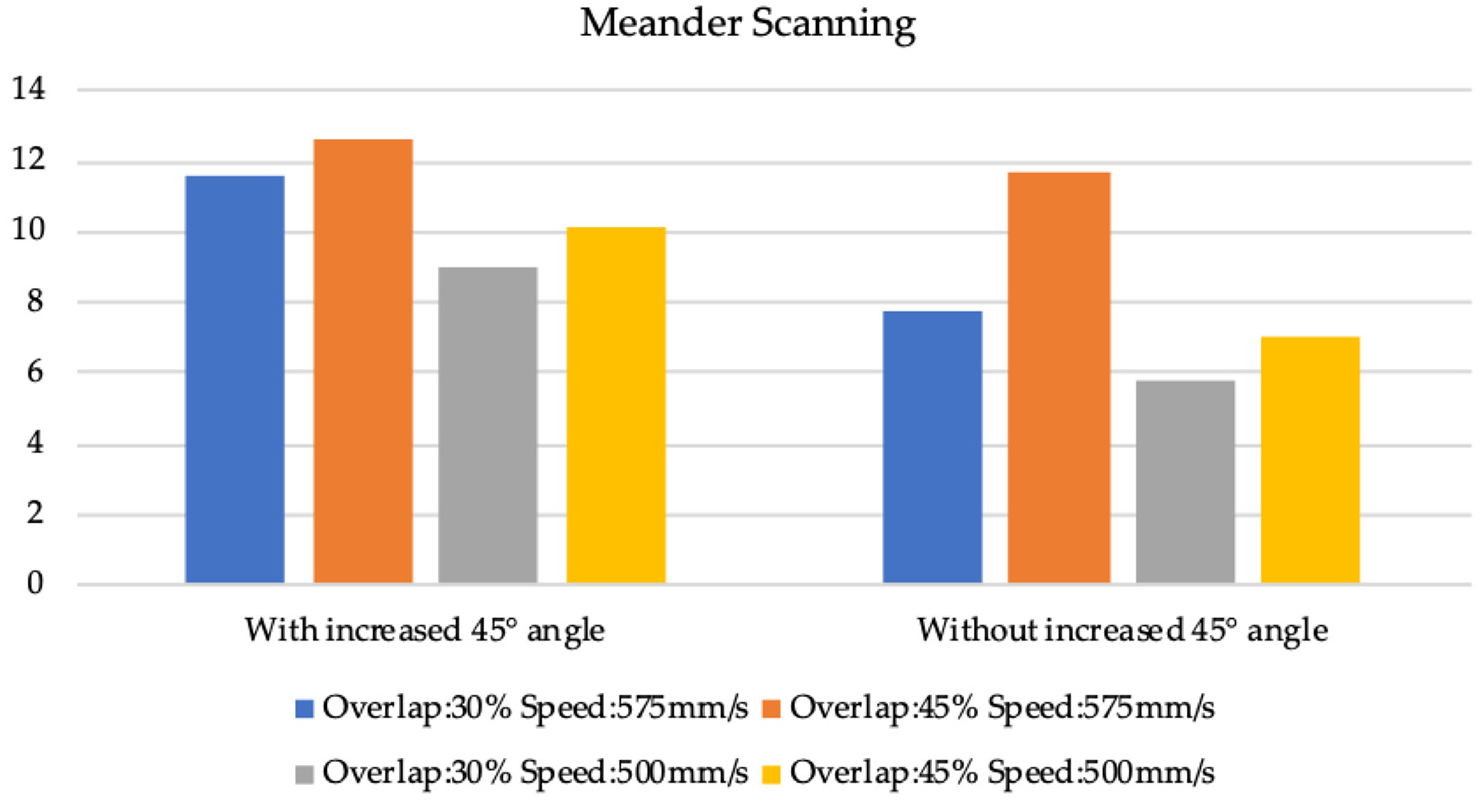
Comparisons of several different parameters under meander scanning.
Although the specimen generated under meander scanning with a hatch vector exhibited superior performance under a combination of a scanning speed of 575 mm/s and 45% overlap compared with those generated without the hatch vector, few consistent specimens were generated successfully under meander scanning with the hatch vector. An additional hatch vector causes excess thermal accumulation, which is closely associated with deformation.
Lightning scanning strategy
Lightning scanning could successfully generate stable and undistorted specimens. Figure 8 depicts the measurement results of surface roughness of the specimens. Most of the specimens that are generated under 30% overlap exhibited superior surface quality compared with those generated under 45% overlap, with the exception of the case with a speed of 500 mm/s and increased 45° angle. In the investigation of the effect of an increased 45° angle, only the condition of a scanning speed of 500 mm/s and 45% overlap resulted in superior surface quality results. The higher scanning speed was related to superior surface quality, which displayed the same results in meander scanning. However, the surface quality decreased with a further increase of a 45° angle in the scanning direction.
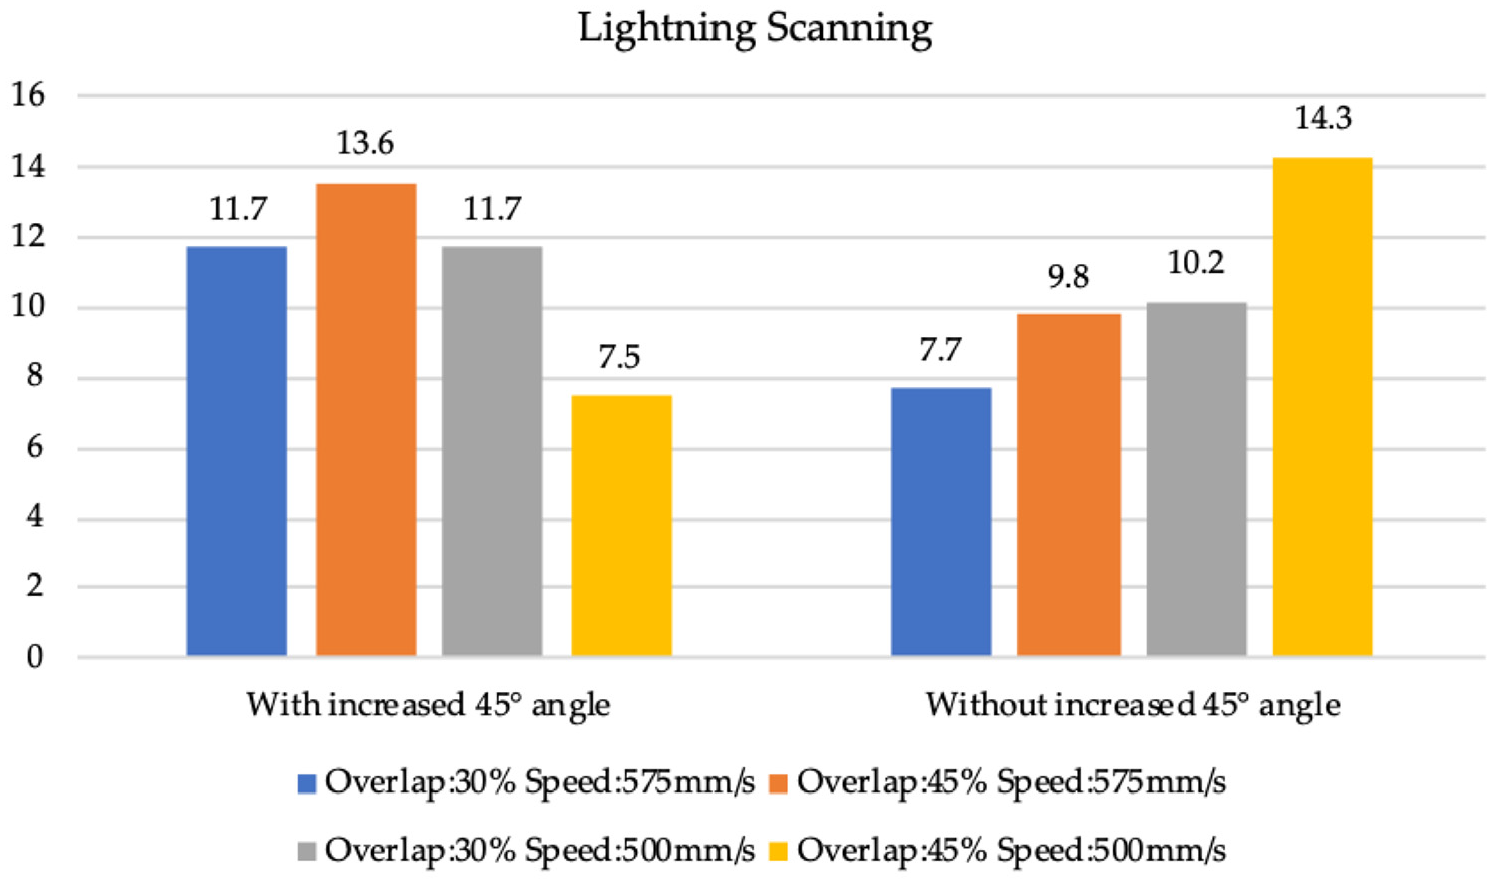
Comparisons of several different parameters under lightning scanning.
Figures 9 and 10 compare the lightning scanning and meander scanning strategies. Without the increased 45° scanning direction, lower Ra appeared in most groups of the experiments under the meander scanning strategy. The only exceptional result was that the specimen was generated at scanning speeds of 500 mm/s and 45% overlap. Because the scanning direction was increased by 45°, meander scanning still exhibited superior performance in surface quality, especially when the difference value was 5–7 Ra for the lower scanning speed. The lightning scanning strategy was superior only under the combination of a scanning speed of 575 mm/s and 45% overlap.
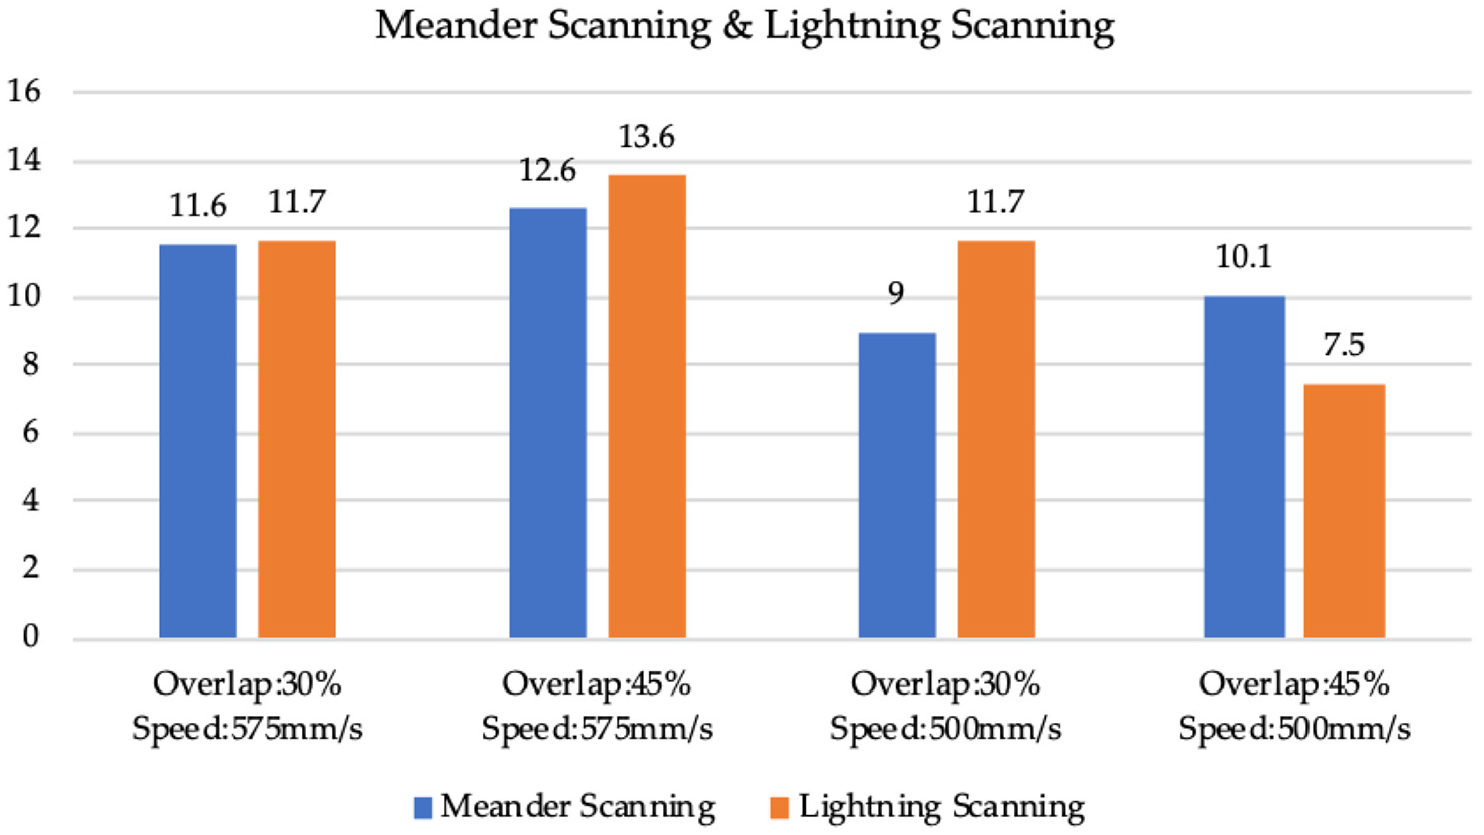
Comparisons of several different parameters under meander scanning and lightning scanning.
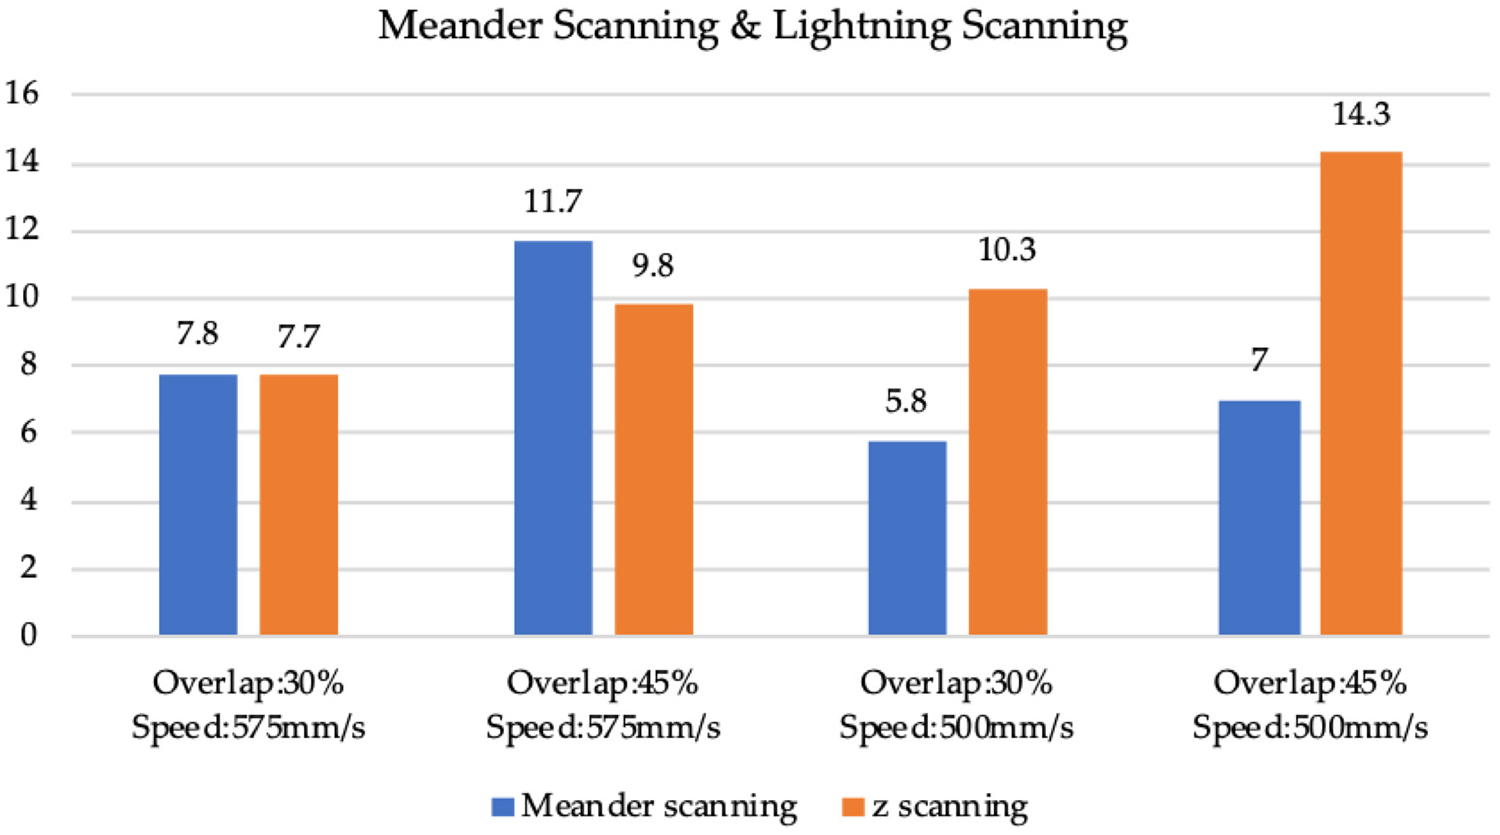
Comparisons of several different parameters under meander scanning and lightning scanning with the increased 45° angle.
Conclusion
Five typical tracks and their distribution were observed in VED experiments. Because the scanning speed was more than 1200 mm/s, continuous tracks did not form on the balling tracks because of Rayleigh capillary instability. The appropriate VED value is in the range 119–166 J/mm3, and the laser power should be limited under 250 W to prevent the burned black condition.
Because the laser power exceeded 250 W, specimens were generated with large deformation even under low VED values (with 900 mm/s). To avoid the collapse of the specimen, flat tracks are suitable for generating multiple layers and laser power should be set to less than 200 W. The process parameters’ effects on the warpage were investigated comprehensively using the Taguchi method.
The meander and lightning scanning strategies could generate specimens without large deformation. The meander scanning strategy was superior to the lightning scanning strategy. The specimen generated using the meander scanning strategy exhibited the lowest Ra (5.8) of surface roughness. Superior surface quality appeared under an increased 45° angle and 30% overlap. Moreover, the specimens generated at a scanning speed of 500 mm/s exhibited superior performance to that generated at a scanning speed 575 mm/s, with the exception of lightning scanning with an increased 45° scanning direction.
Footnotes
Appendix 1
Declaration of conflicting interests
The author(s) declared no potential conflicts of interest with respect to the research, authorship, and/or publication of this article.
Funding
The author(s) disclosed receipt of the following financial support for the research, authorship, and/or publication of this article: This research was funded by the Ministry of Science and Technology (grant numbers 107-2221-E-224-057 and 108-2221-E-224-047-MY2).