
Abstract
In the present work, 304LN austenitic stainless steel has been considered for the texture evolution study after the hot-deformation process. The axi-symmetric compression tests, with post-deformation isothermal holding at the same temperature, were performed at 900°C, 1000°C and 1100°C with a strain rate of 0.1 s−1. Texture evolution during the post-hot-deformation was studied through electron back scattered diffraction. Effect of temperature and holding time on texture evolution were studied. At low deformation temperature and lesser holding time 〈100〉 and 〈110〉 fibre textures were observed. At high deformation temperature and/or high holding time the texture becomes random. Texture intensity along α fibre, for all the temperatures, is chaotic whereas along β and τ fibres it is uniform at low temperature and becomes chaotic with the increase in deformation temperature. Goss component was found to be a major texture component with significant amount of ND and RD rotated cube components.
Introduction
Different variants of 304 austenitic stainless steel grade have wide applications, starting from household items to chemical, automobile and nuclear industries.1–3 This is because of its good strength at elevated temperature and excellent corrosion resistance. 2 Rolling, being an important manufacturing process, a significant amount of works on rolling texture development in 304 austenitic stainless steel have been studied.4–12 The rolling texture developed in Face Centred Cubic (FCC) material is categorised as brass or alloy type and copper or pure metal type. The difference in texture development is due to the Stacking Fault Energy (SFE) of the material. In general, the high to medium SFE materials develop copper type texture with ideal orientations, Copper {112} 〈111〉 or S {123} 〈634〉 as the major component. On the other hand, the low SFE material shows brass type texture with ideal orientation Brass {011} 〈211〉 as a major component.11,13 These rolling textures can also be described by fibre textures viz. α, β and τ. A texture transition from Brass to Copper type can be expected with the increase in SFE. Apart from the SFE, chemical composition, initial texture and process parameters like rolling temperature, reduction etc., also affect the texture development. The amount of reduction and the temperature of the final pass have a significant effect on the final texture. 14 The presence of friction at the roll-workpiece interface produces shear strain at the surface of the workpiece whereas the mid-thickness experiences a plane strain condition. So, rolling of metallic materials, depending upon the deformation conditions, may produce rolling texture and/or shear texture.6,15 In hot rolling, as the rolling is performed at high temperature, in addition to deformation texture, recrystallisation texture like Goss {110} 〈001〉 and Cube {001} 〈100〉 can also be developed. Recrystallisation texture developed after prior cold or hot deformation largely depends on the deformation texture. Chowdhury et al. 16 observed Copper, Goss and Brass recrystallisation texture {236} 〈385〉 components after annealing of cold rolled 304L austenitic stainless steel.
In hot rolling of austenitic stainless steel, near to the top surface of the rolled samples that is, in severely sheared region {112} 〈110〉, {111} 〈110〉 and {001} 〈110〉 texture components are developed. On the other hand the texture component at the mid-thickness is mainly contributed by {110} 〈112〉. 5 In addition to {001} 〈110〉 and {112} 〈110〉 components, γ fibre also develops near to the surface; and β fibre along with cube texture at the centre. 7 It has been reported that with increase in the rolling temperature the texture for 304 austenitic stainless steel can be changed to copper type from brass type. 17 In another work, Raabe 18 found the through thickness hot rolling texture for 304 austenitic stainless steel to be dependent on the shear strain distribution along the thickness. At the centre of the hot band and at the sub-surfaces, random textures were observed whereas, at the top surface and at the intermediate layer that is between the centre and the top surface, {001} 〈110〉, {111} 〈211〉 and {211} 〈100〉 orientations were observed. These orientations are the shear texture components, which led the author to conclude that the hot rolled texture is dependent on the through thickness shear strain distribution. Transition of texture from alloy type to pure metal type with the increase in rolling temperature (from 200°C to 600°C) has also been reported for 304L austenitic stainless steel material. 19
In axisymmetric deformation like compression, usually performed to study the flow (stress-strain) behaviour of the material,20,21 the fibre texture developed around the principal deformation axis. 22 Axisymmetric compression of 304H austenitic stainless steel develops 〈110〉 fibre texture at 950°C and 0.001 s−1. 23 However, this texture becomes weaker with the increase in temperature. Taylor and Hodgson 24 observed the development of α fibre by axisymmetric compression of 304 austenitic stainless steel within the temperature and strain rate range of 700°C–900°C and 1–100 s−1, respectively. In one of the earlier works of the present authors, 25 it was observed that the compression of 304LN austenitic stainless steel at 900°C produces 〈110〉 fibre texture, which diffuses with the increase in deformation temperature, and α fibre at 900°C. The texture evolution on high temperature axisymmetric compression of austenitic stainless steel, reported till date, are restricted to the deformation only.23–28 Similarly, most of the works on recrystallisation texture formation, after deformation, in austenitic stainless steel are based on cold rolling process.12,16,29
As stated earlier, the crystallographic texture development in the deforming material largely depends upon the texture of the input material as well as on the deformation conditions of the last pass. 14 The texture of the input material to the last pass, is a result of deformation during the previous passes as well as the softening happening in between two passes. So, during multi-stage hot deformation processes like rolling, forging etc. texture evolution is a function (in addition to other variables like strain, strain rate, temperature etc.) of the time interval between two passes. Study of the effect of time interval on texture development is equally important as that of effect of deformation on texture development. Earlier published works on the hot deformation of similar kind of material reported the softening happening in between deformation processes, by analysing the flow curves.30,31 The analyses for microstructure have also been reported.32,33 In-depth analyses, including the effect of temperature and holding time on the texture evolution/texture component formation was not reported, and the same has been made in the present research. The 304LN austenitic stainless steel has been taken for the post-hot-deformation texture evolution study. The deformed samples were subjected to characterisation through the electron back scattered diffraction (EBSD) technique for the study of texture evolution.
Experimental details
Processing
The post-deformation study of the considered 304LN austenitic stainless steel (C-0.035, Cr-18.3, Ni-8.04, N-0.09 wt. %) samples was conducted by performing the axi-symmetric compression test followed by isothermal holding for different time spans. The tests were performed on a deformation dilatometer (DIL 805 A/D, Bähr-Thermoanalyse GmbH). The test setup that is the deformation dilatometer provides controlled deformation on a material to study the high temperature flow behaviour of the material. It has the provision to record and maintain the temperature of the samples during the test. Suitable cylindrical samples of 10 mm length and 5 mm diameter (Figure 1(a)) were cut from the as-received material by using wire electro-discharge machine. It can be noted that as the sample is to be deformed in between two flat punches, any kind of slanting error in between the two flat surfaces of the sample may develop a non axi-symmetric deformation. So, careful facing operation was performed on the samples to make the two flat surfaces parallel. The compression direction (CD) was kept along the normal direction (ND) of the as-received material (Figure 1(b)). To record the sample temperature, during the test, thermocouple was attached (spot welded) at the mid-thickness of the sample. The temperature of the sample was maintained by continuous heating provided by the induction coil. No lubricant has been used in between the sample and the flat punches. Due attention was given in proper placing of the samples in between the punches to make the compression axi-symmetric. The samples were heated (at 10°C/s) to the required temperature and held for 180 s for uniform heating. Samples were then compressed (true strain of ∼0.16, 15% reduction in height) followed by isothermal holding, and immediate cooling (at 50°C/s) to room temperature. Three temperatures, 900°C, 1000°C and 1100°C and four holding times, 2 s, 10 s, 100 s and 1000 s were considered for the present work. All the tests were executed at a constant strain rate of 0.1 s−1. Figure 1(c) represents the above thermo-mechanical schedule and Figure 1(d) shows the experimental setup along with the sample attached with the thermocouple.
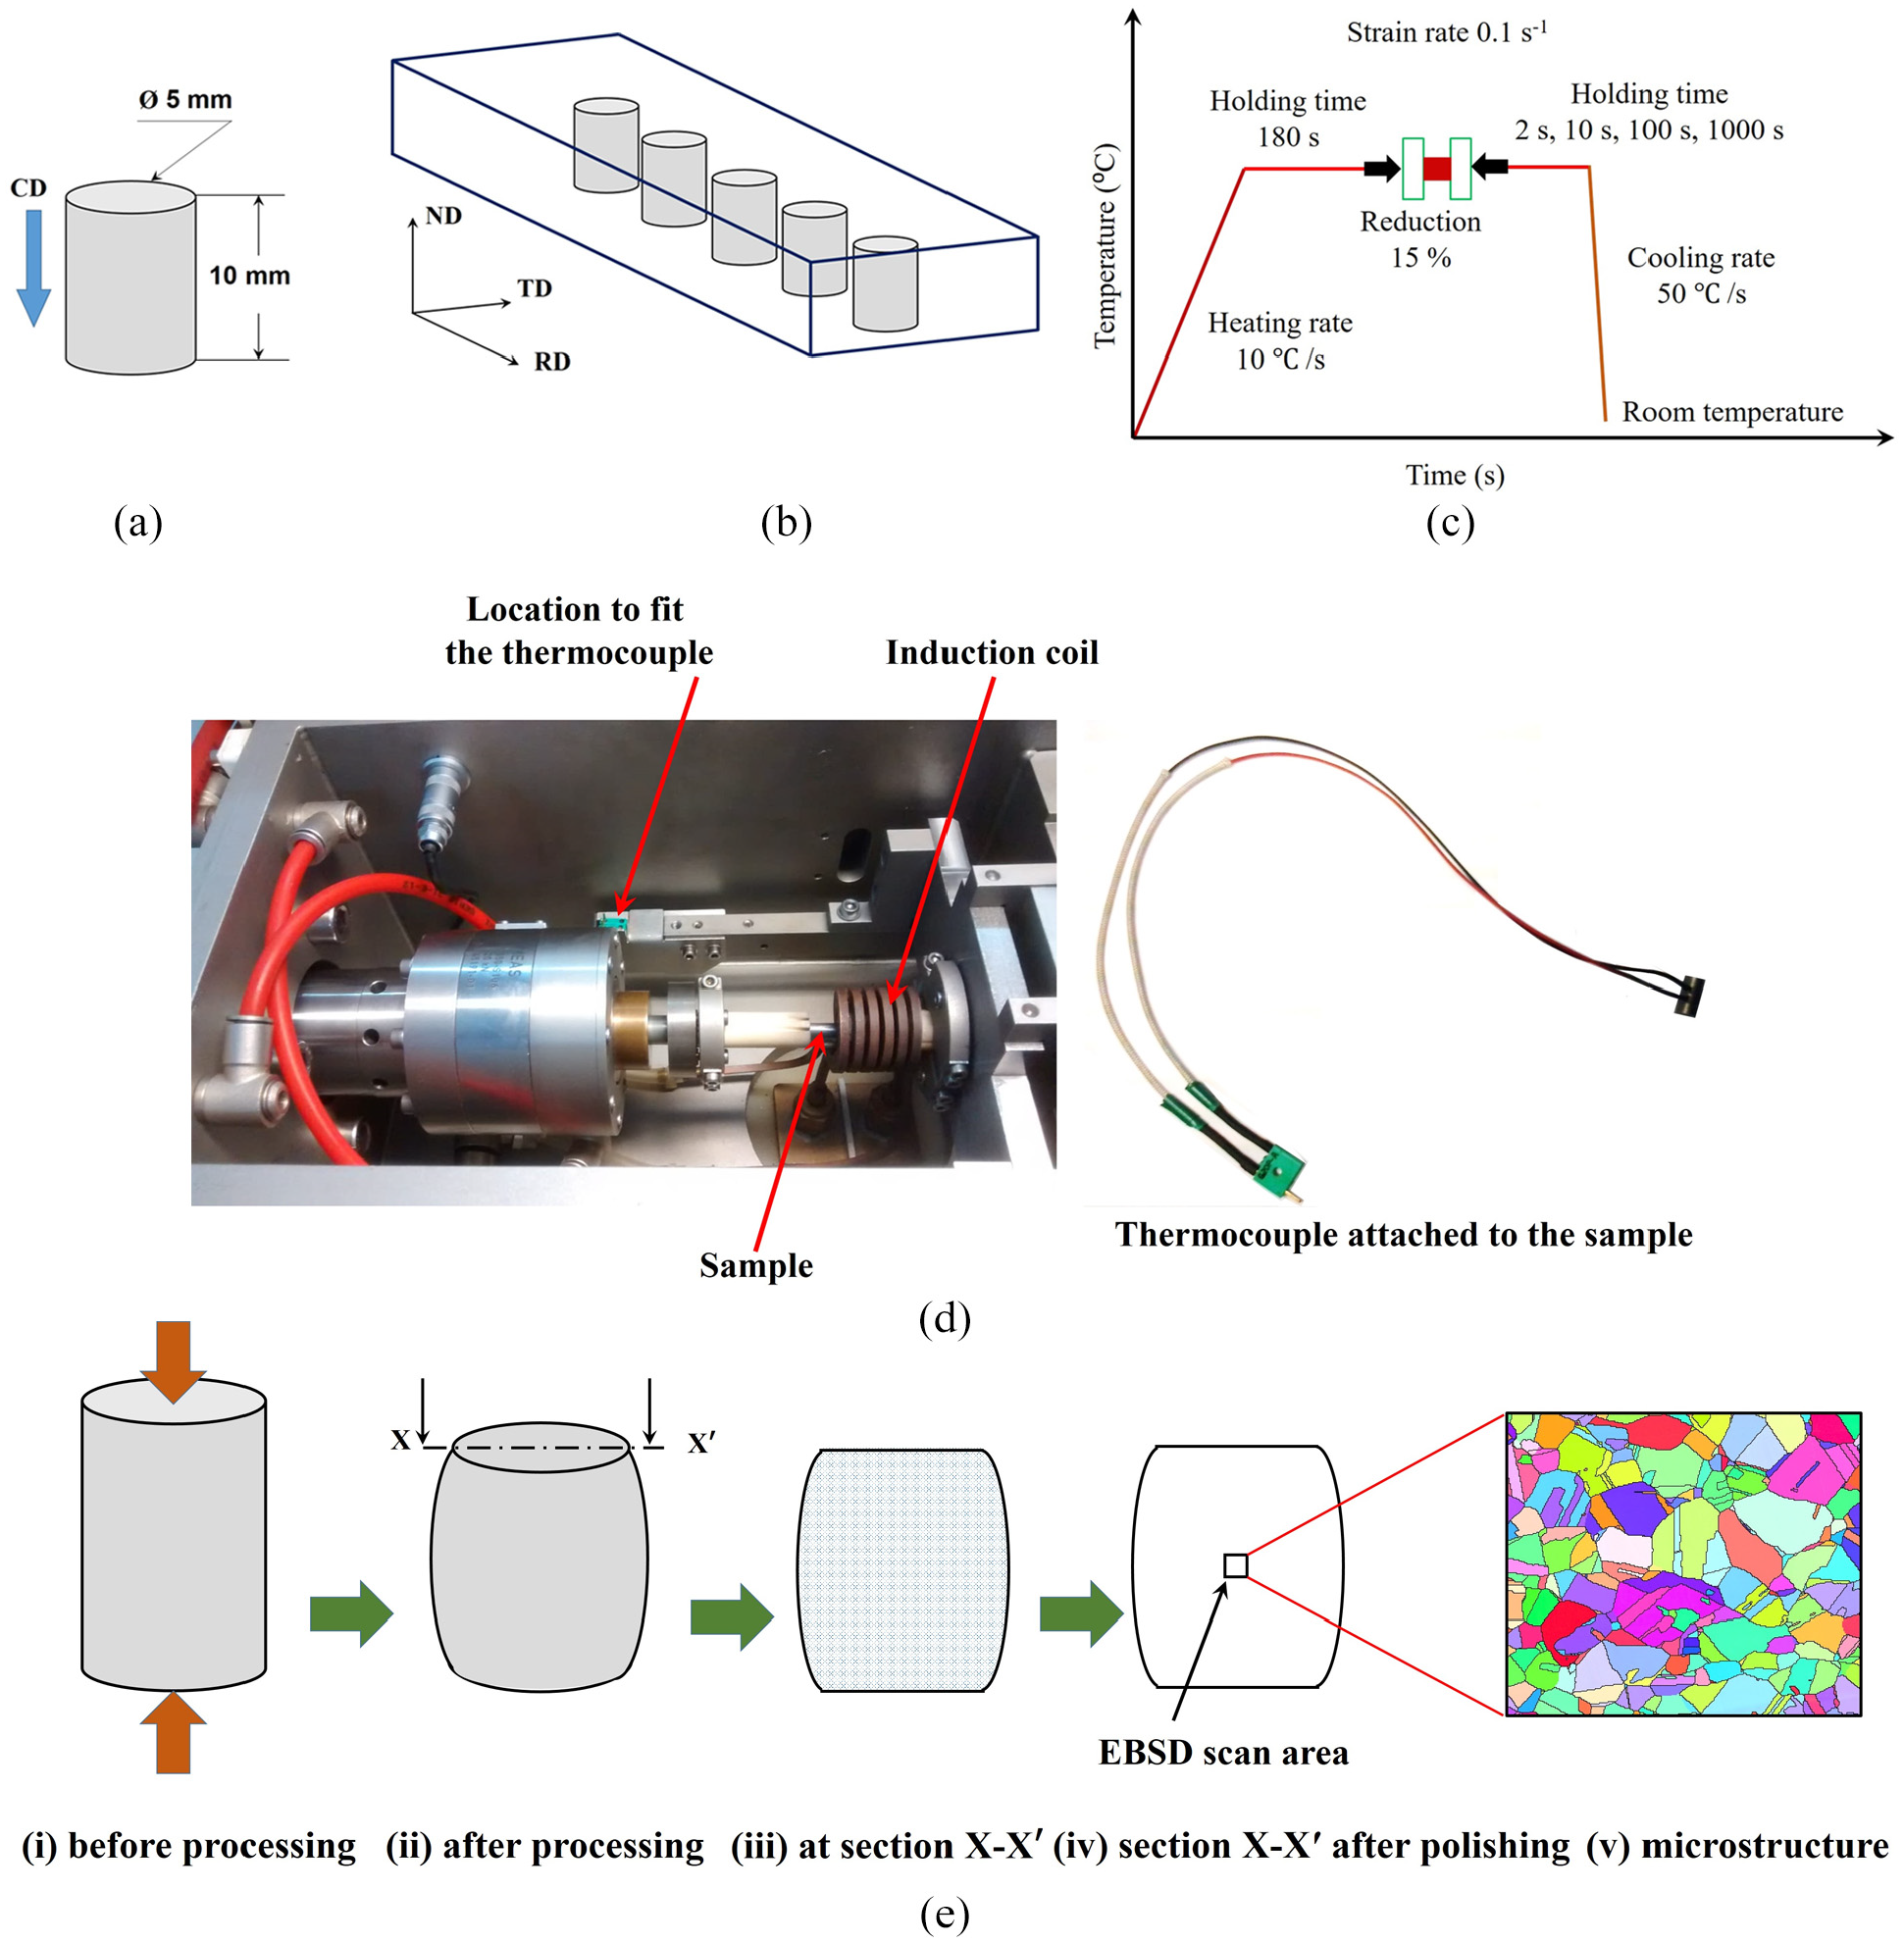
Schematic representing: (a) initial dimensions of the sample, (b) reference directions of the sample with respect to the as-received plate, (c) thermo-mechanical schedule for the present study, (d) experimental set-up with thermocouple attached to the sample, and (e) schematic showing the different stages of the experimental work.
As mentioned earlier, no lubricant has been applied in between the samples and the flat punches. So, barrelling of the samples, after deformation, is expected. Similarly, though the sample temperature was maintained and monitored near the mid-thickness, temperature gradient was seen along the thickness. This was because of the contact of the sample with the dies, which were at room temperature. However, the temperature gradient was not too high as the sample dimension was small. In industrial practice, application of lubricant is not always feasible or even if it is used it may not completely nullify the effect of friction. Also, the dies remain at room temperature. However, the die temperature may increase as the process is performed in multiple stages. But, the die temperature is much lower than the sample temperature. Hence, the contact conditions in the compression test performed in the present work can be related to the real deformation process like upset forging.
Characterisation
In axi-symmetric compression of cylindrical sample, the intensity of deformation is the maximum near the volumetric centre. 34 So, area near to this zone has been considered for the texture study. The deformed samples were cut along the CD, and mechanical polishing was carried out on the cut surface by SiC grinding papers, starting from coarse to fine grit size. Later electro-polishing was performed to make the surface strain-free. The samples were then subjected to characterisation by EBSD. The EBSD scan was performed on a field emission gun-scanning electron microscope (ZEISS AURIGA). Each scan was performed at the mid-thickness of the samples with a step size of 0.7 μm. The location of the EBSD scan, on the deformed samples, is schematically shown in Figure 1(e). The plane considered for the EBSD scan was RD-ND and RD-CD for as-received material and deformed samples, respectively. Here, RD can be read as rolling direction and radial direction for as-received material and deformed samples, respectively.
The EBSD scan data were analysed by using TSL OIM software (version 7.2). Before the analyses, the data were subjected to grain dilation clean-up procedure. The grain tolerance angle and the minimum grain size were taken as 5° and 2 μm, respectively. The cleaning has been performed for a single iteration. For representation of texture by orientation distribution function (ODF), Euler angle with Bunge notations is used. Only the important ODF sections for FCC material that is,
Results and discussions
Initial and after processing microstructure
The as-received material was in the solution annealed condition. Figure 2 shows the initial microstructure of the material that is the microstructure of as-received (un-deformed condition) material. Each colour of the microstructure indicates a specific crystal orientation which can be read from the colour key code shown in the figure. Grains are separated by high angle grain boundaries that is, boundaries with misorientation angle >15°.
35
Presence of twins can be observed from the microstructure. The average grain size (
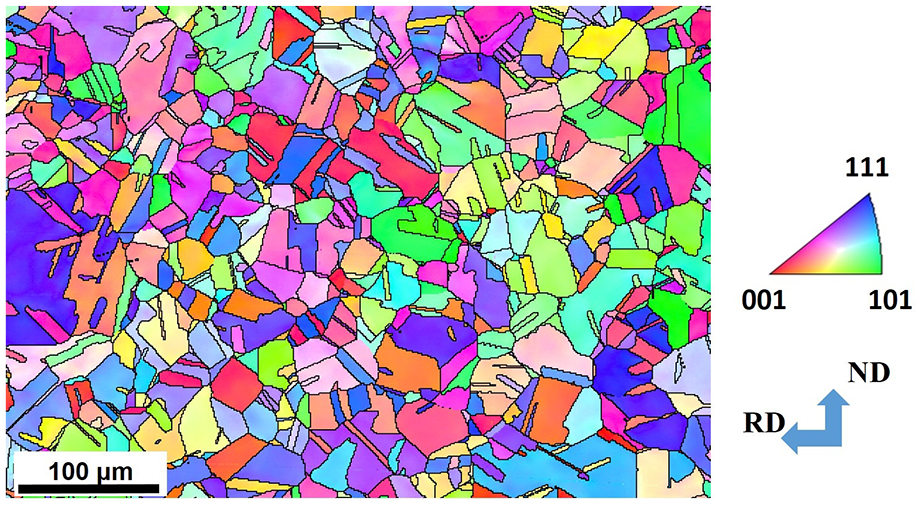
IPF map of as-received material.
The IPF maps of the samples compressed and isothermally held for different time span at 900°C, 1000°C and 1100°C are shown in Figure 3(a)–(l). The isothermal deformation and holding at the lower temperature that is, 900°C result a high fraction of deformed grains, as can be observed from Figure 3(a)–(c), in the form of colour gradient. At this temperature, even after 100 s of holding time deformed grains are present (Figure 3(c)). On the other hand, at higher temperature that is, 1100°C a holding time of 2 s leads to an almost fully recrystallised condition (Figure 3(i)). For the intermediate temperature of 1000°C, fully recrystallised conditions can be observed after 100 s of holding time (Figure 3(g)). Large fraction of twin boundaries can be seen for recrystallised microstructures.
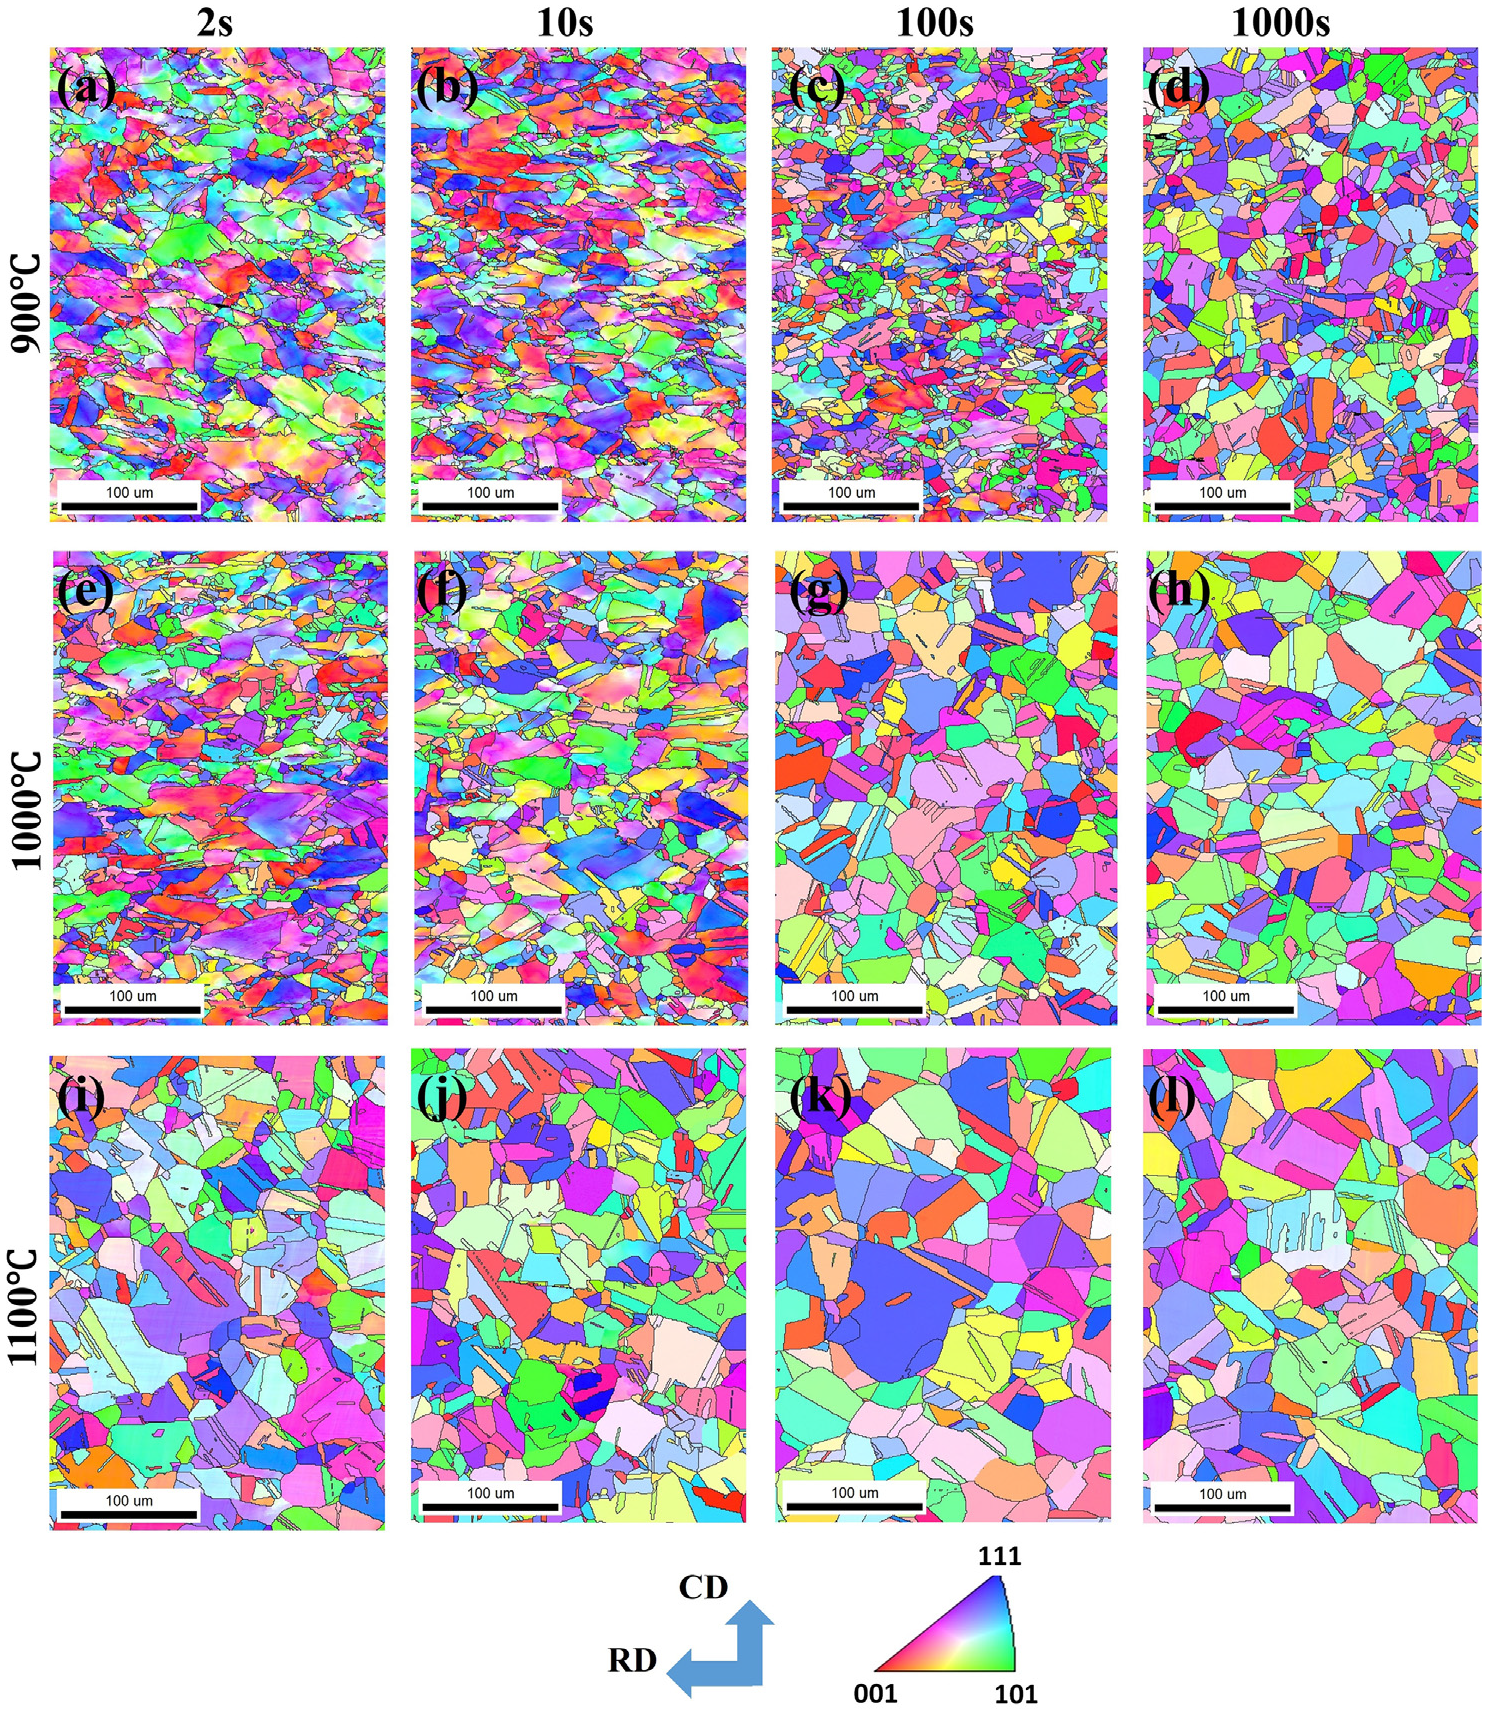
IPF map of samples compressed and isothermally held for 2 s, 10 s, 100 s and 1000 s at (a–d) 900 °C, (e–h) 1000 °C and (i–l) 1100 °C.
Initial texture
The EBSD scan on the as-received material was done on the RD-ND plane and at the mid-thickness. The (100), (110), (111) PFs and the ODF are shown in Figures 4 and 5, respectively. The position of different ideal orientation is superimposed on the ODF plot. Strong Copper and Cube components with moderate brass, rotated brass and S components can be observed.
(100), (110) and (111) PFs of as-received material.
ODFs of as-received material with ideal orientation locations for FCC material.
After processing texture
Pole figure
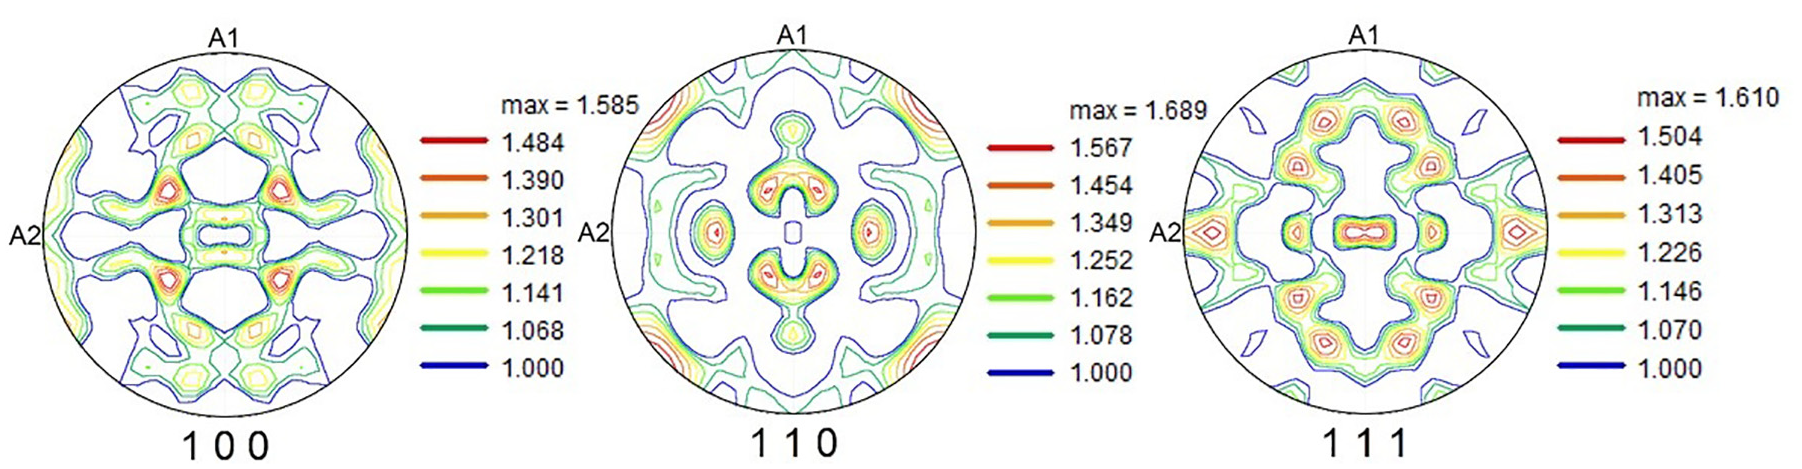
The (100), (110) and (111) PFs representing the texture developed in samples compressed and isothermally held at 900°C, 1000°C and 1100°C are shown in Figures 6–8, respectively. Here in these figures, the effect of holding time can be observed through the PFs placed vertically. The compression direction that is, CD and the radial direction that is, RD are represented as A1 and A2, respectively.
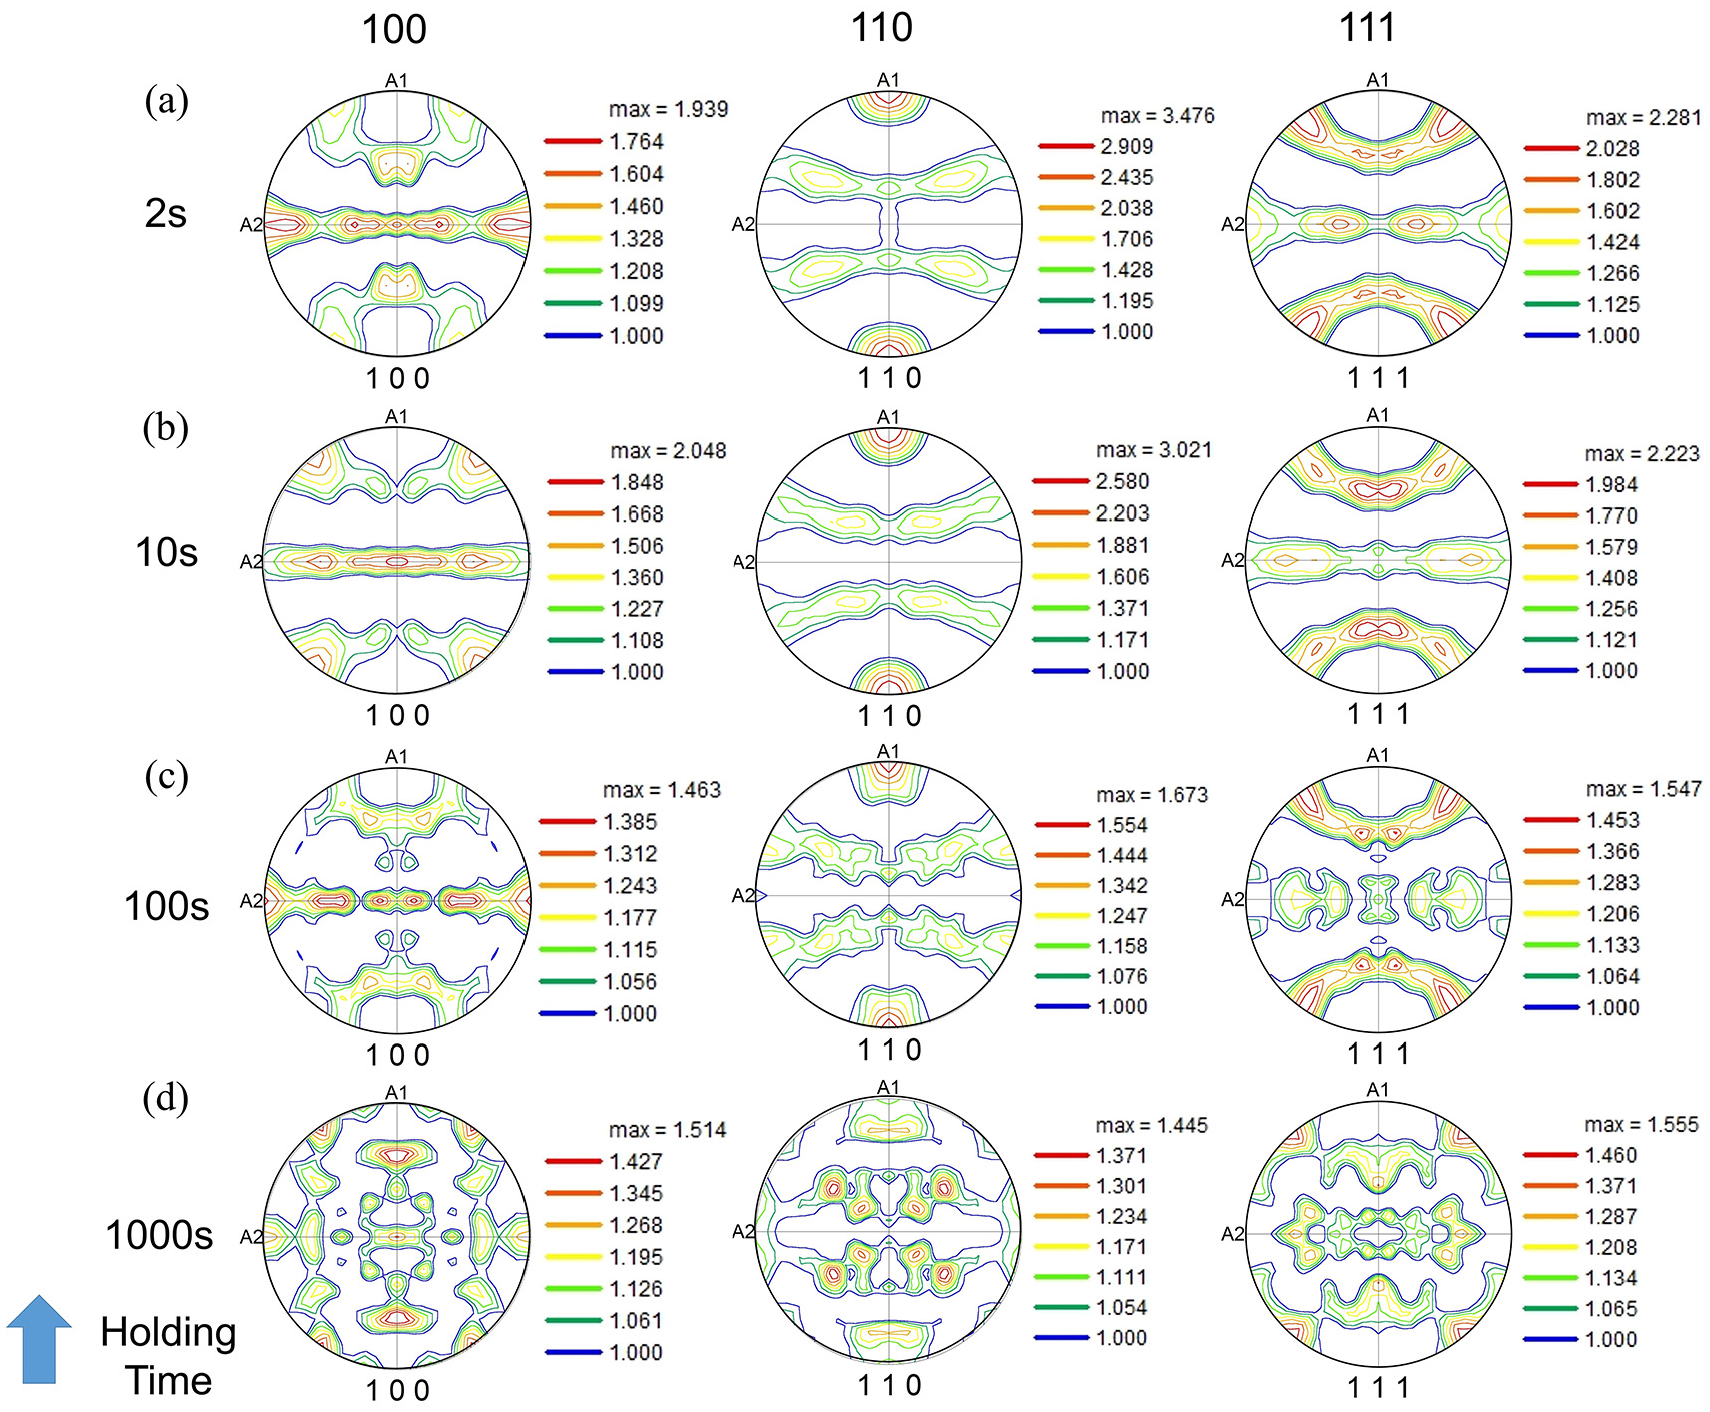
The (100), (110) and (111) PFs of samples compressed and isothermally held at 900°C for (a) 2 s, (b) 10 s, (c) 100 s, and (d) 1000 s.
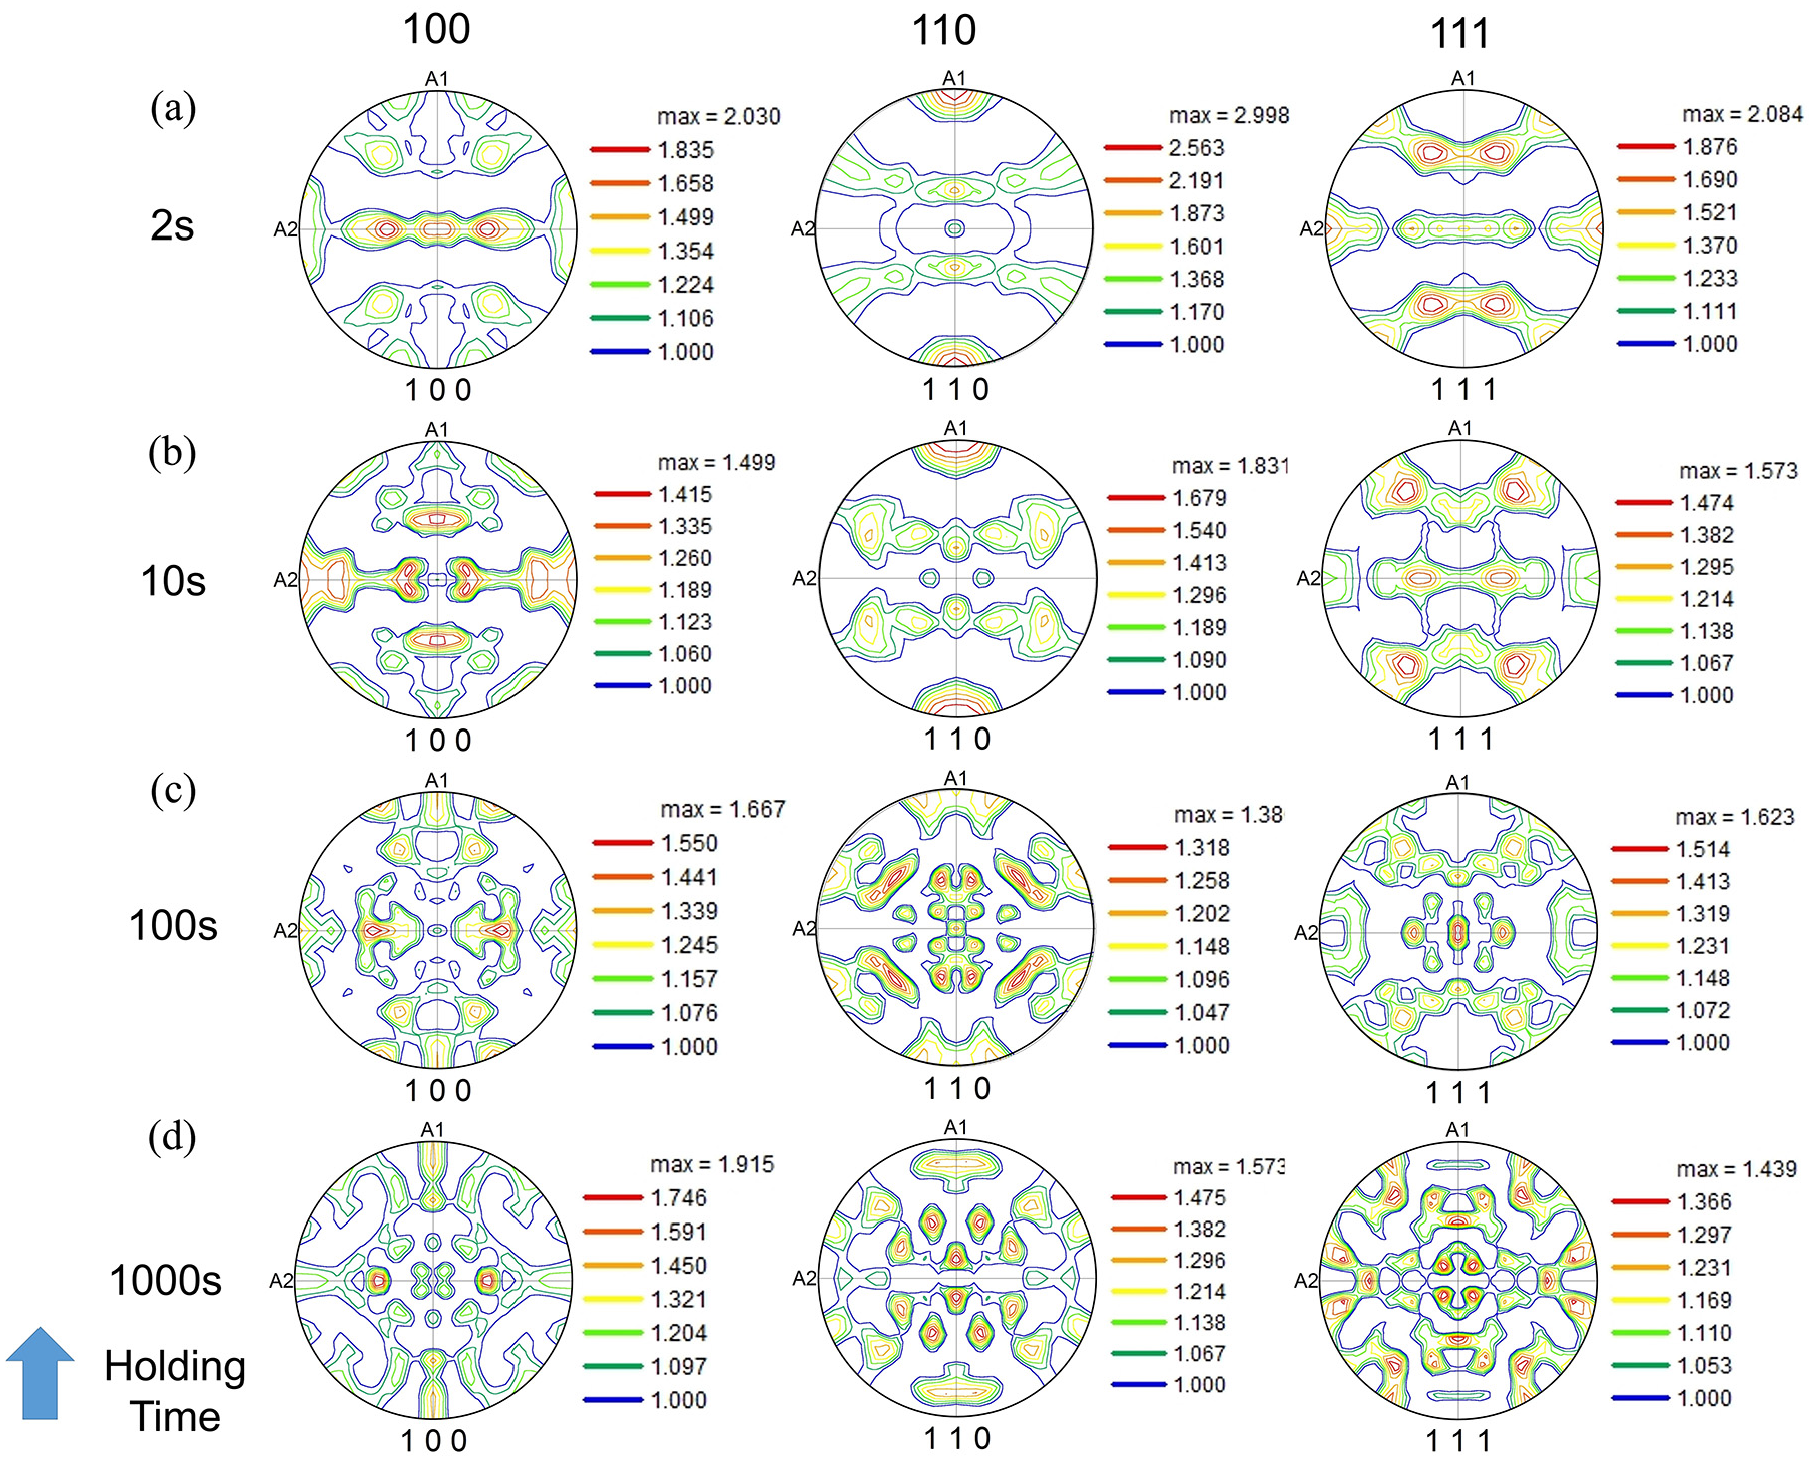
The (100), (110) and (111) PFs of samples compressed and isothermally held at 1000°C for (a) 2 s, (b) 10 s, (c) 100 s, and (d) 1000 s.
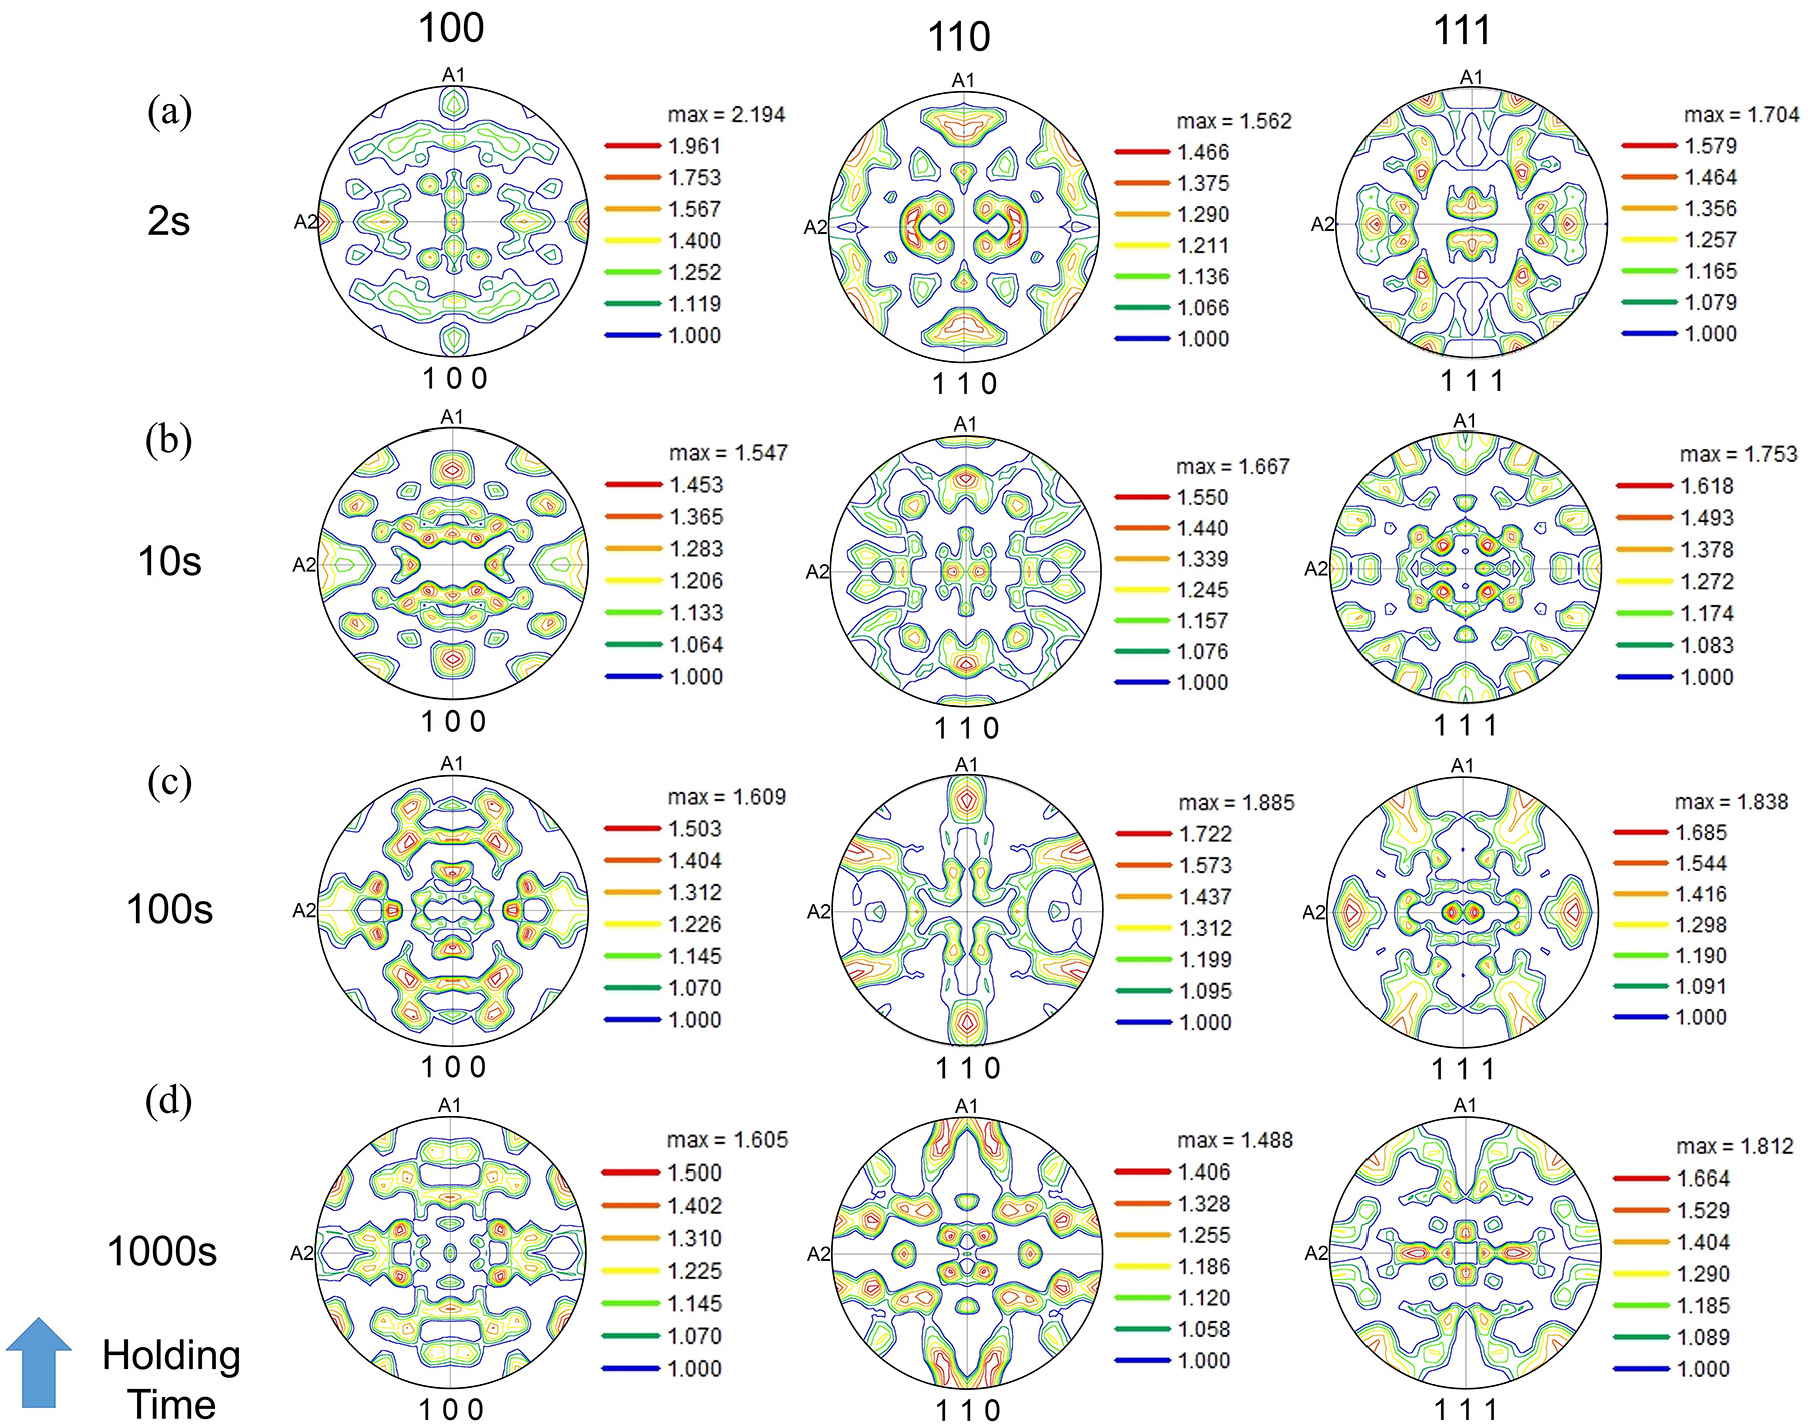
The (100), (110) and (111) PFs of samples compressed and isothermally held at 1100°C for (a) 2 s, (b) 10 s, (c) 100 s, and (d) 1000 s.
The application of deformation, equivalent to true strain of ∼0.16 develops the 〈100〉 and 〈110〉 fibre texture, though with lesser intensities. These fibres can be clearly observed for the samples processed at 900°C (Figure 6). A strong {110} 〈001〉 component can also be observed in (110) PFs for 900°C (maximum MRD ∼3.47 for 2 s). However, its intensity gets decreased with the increase in holding time (maximum MRD ∼1.11 for 1000 s). Similarly, a higher intensity of 〈100〉 poles near the RD can be observed in (100) PFs (maximum MRD ∼1.94 for 2 s). Moreover, at 900°C the deformation developed fibre textures, which were prominently observed for the sample held for 2 s, which spread with the increase in holding time, and comparatively random texture was observed for the case of 1000 s.
At 1000°C (Figure 7), the dissociation of the deformation fibre textures that is, 〈100〉 and 〈110〉, which were seen at 900°C, can be observed. Along with the fibre textures, the (100) poles near RD, observed in the case of 900°C, also starts disappearing at 1000°C. However, the {110} 〈001〉 component is still present with a lower intensity (maximum MRD ∼3 for 2 s). Intensity of this component decreases with the increase in holding time, and finally disappears at 1000 s. The presence of {001} 〈010〉 component, at 1000°C, can be seen from the (111) PFs. This can be observed as high intense (111) poles are present near to its ideal locations. However, with the increase in holding time it gets deviated from its ideal location.
At 1100°C (Figure 8), no trace of any deformation fibre texture is observed. All the PFs at 1100°C shows the formation of random texture with lower maximum MRD. Though a high fraction of (100) poles (maximum MRD ∼2.2) can be seen near to the RD in (100) PF of sample held for 2 s.
Orientation distribution functions
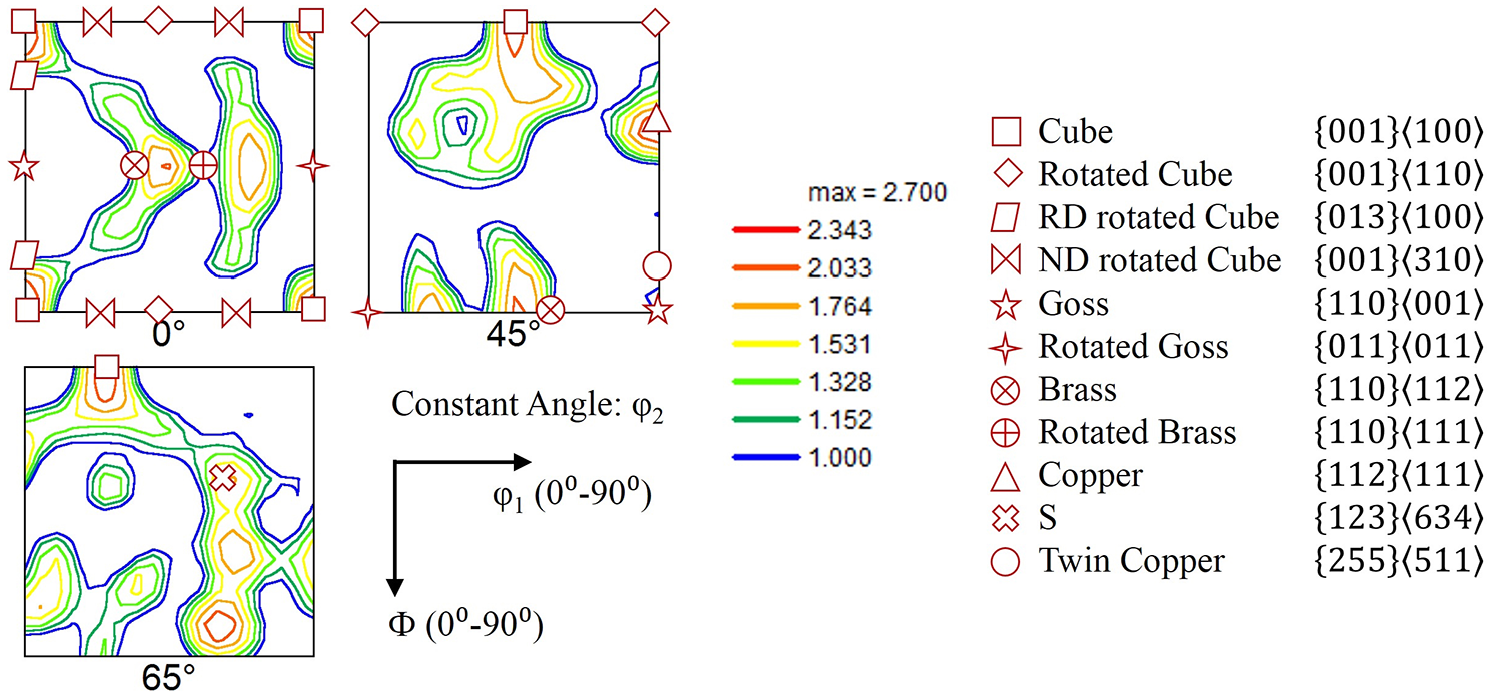
In order to identify the texture components more prominently, ODFs at constant
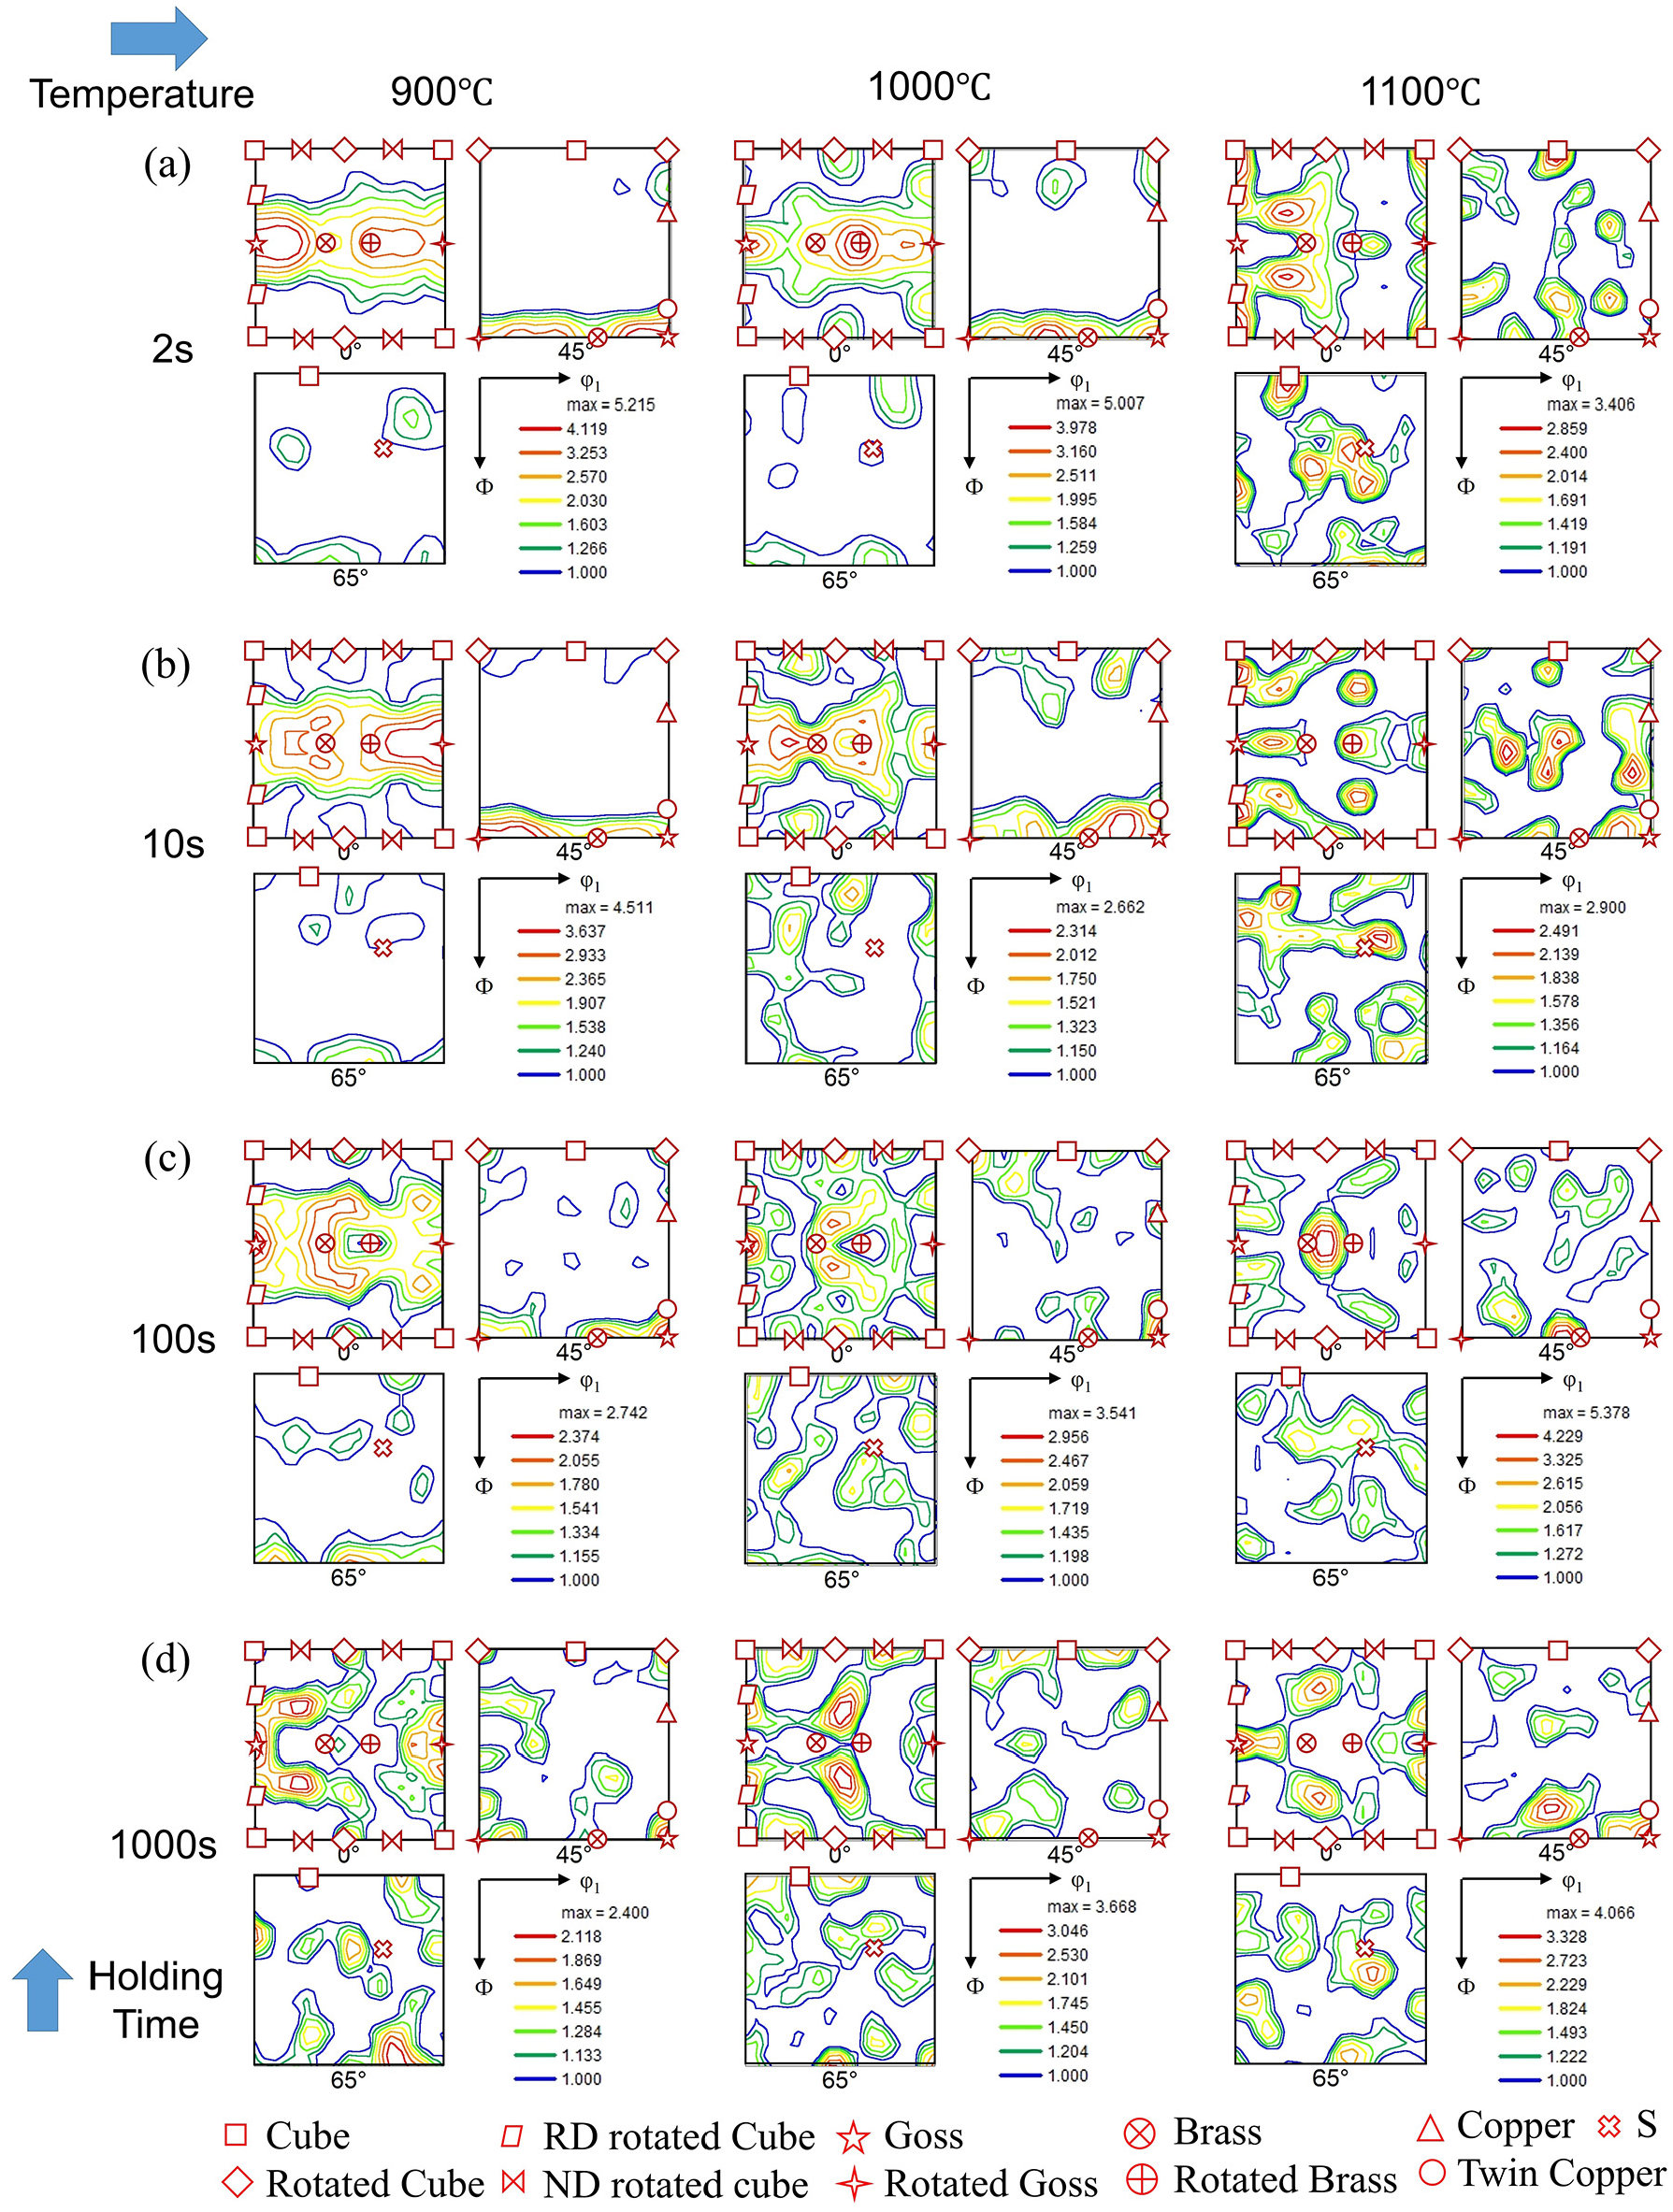
ODFs of samples compressed and isothermally held at 900°C, 1000°C and 1100°C for (a) 2 s, (b) 10 s, (c) 100 s and (d) 1000 s.
The increase in the deformation temperature to 1000°C leads to the formation of rotated cube components at a small holding time span of 2 s. However, the
In comparison to the temperature 900°C and 1000°C, the samples tested at 1100°C shows a smaller number of ideal texture components. For all the considered holding time, except for 1000 s, cube and rotated cube textures were found to be the dominant components. At 1000 s only Goss texture was observed. However, at 100 s a presence of Brass texture can be seen.
Moreover, for all the processing conditions in addition to Goss texture significant fraction of Cube texture can be observed, especially for temperatures 1000°C and 1100°C. However, these Cube components are either rotated about ND or RD.
Texture intensity distributions across the α, β and τ fibres for as-received material and samples compressed and held at 900°C, 1000°C and 1100°C for 2 to 1000 s are shown in Figures 10 (a)–(c) and 11(a)–(i), respectively. For as-received material, the intensity peaks can be observed near ideal orientations {011} 〈211〉 and {112} 〈111〉. At all the three temperatures, the intensity distribution is not uniform for α fibre (Figure 11(a), (d) and (g)). This fibre has the highest intensity for deformation at 900°C and 1000°C, followed by a holding time of 2 s. However, the intensity decreases with increase in post-deformation holding time. At 1100°C, the highest intensity is observed for 1000 s holding time and near the Brass component {011} 〈211〉. The effect of holding time on texture intensity across β and τ fibres is minimal at 900°C (Figure 11(b) and (c)). However, there is a decrease in intensity along β fibre, when compared with the as-received material (Figure 10(b)). At this temperature, the intensity of the Brass component decreases with increase in the post-deformation holding time. Increase in temperature to 1000°C and 1100°C leads to fluctuating intensity distribution along β and τ fibres (Figures 11(e), (f), (h) and (i)).
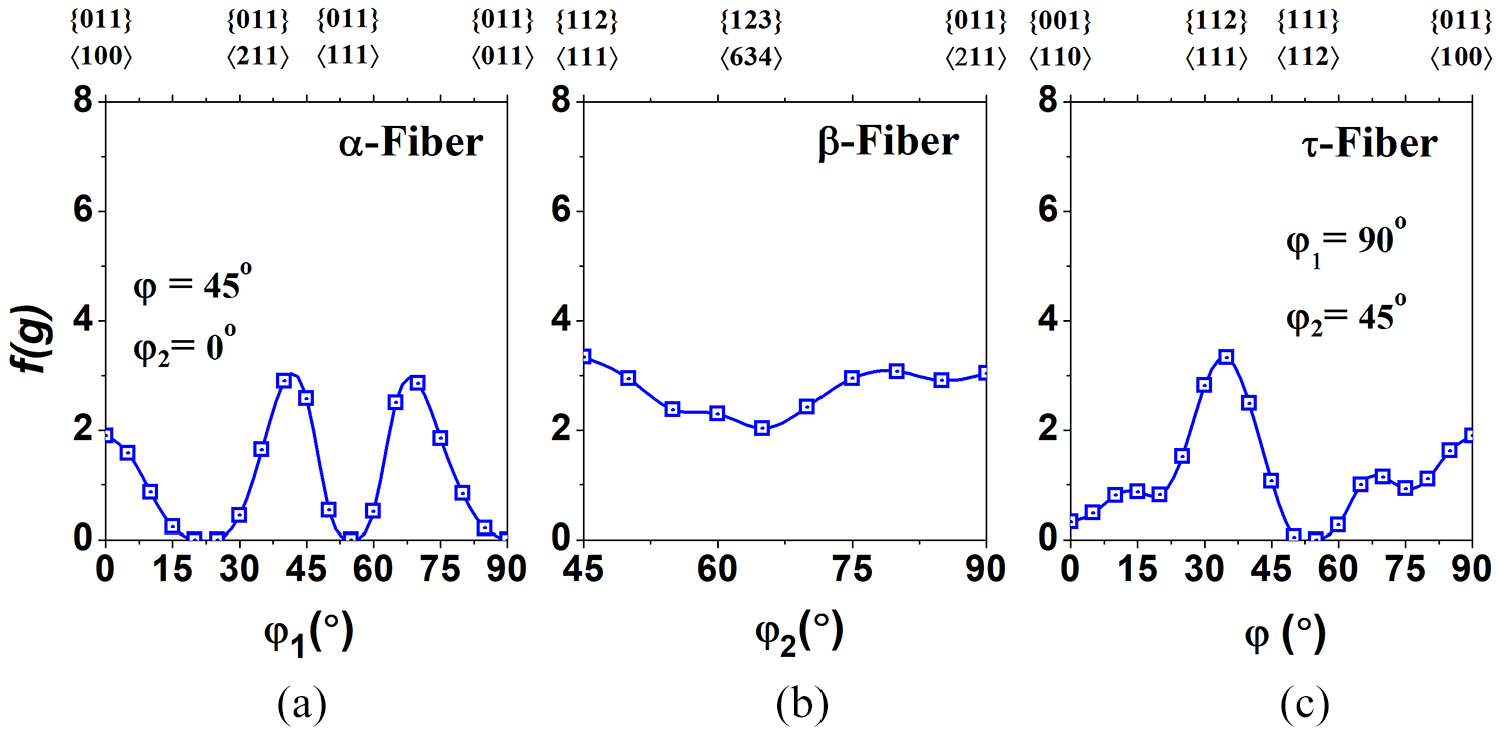
Texture intensity distributions along α, β and τ fibres of as-received material.
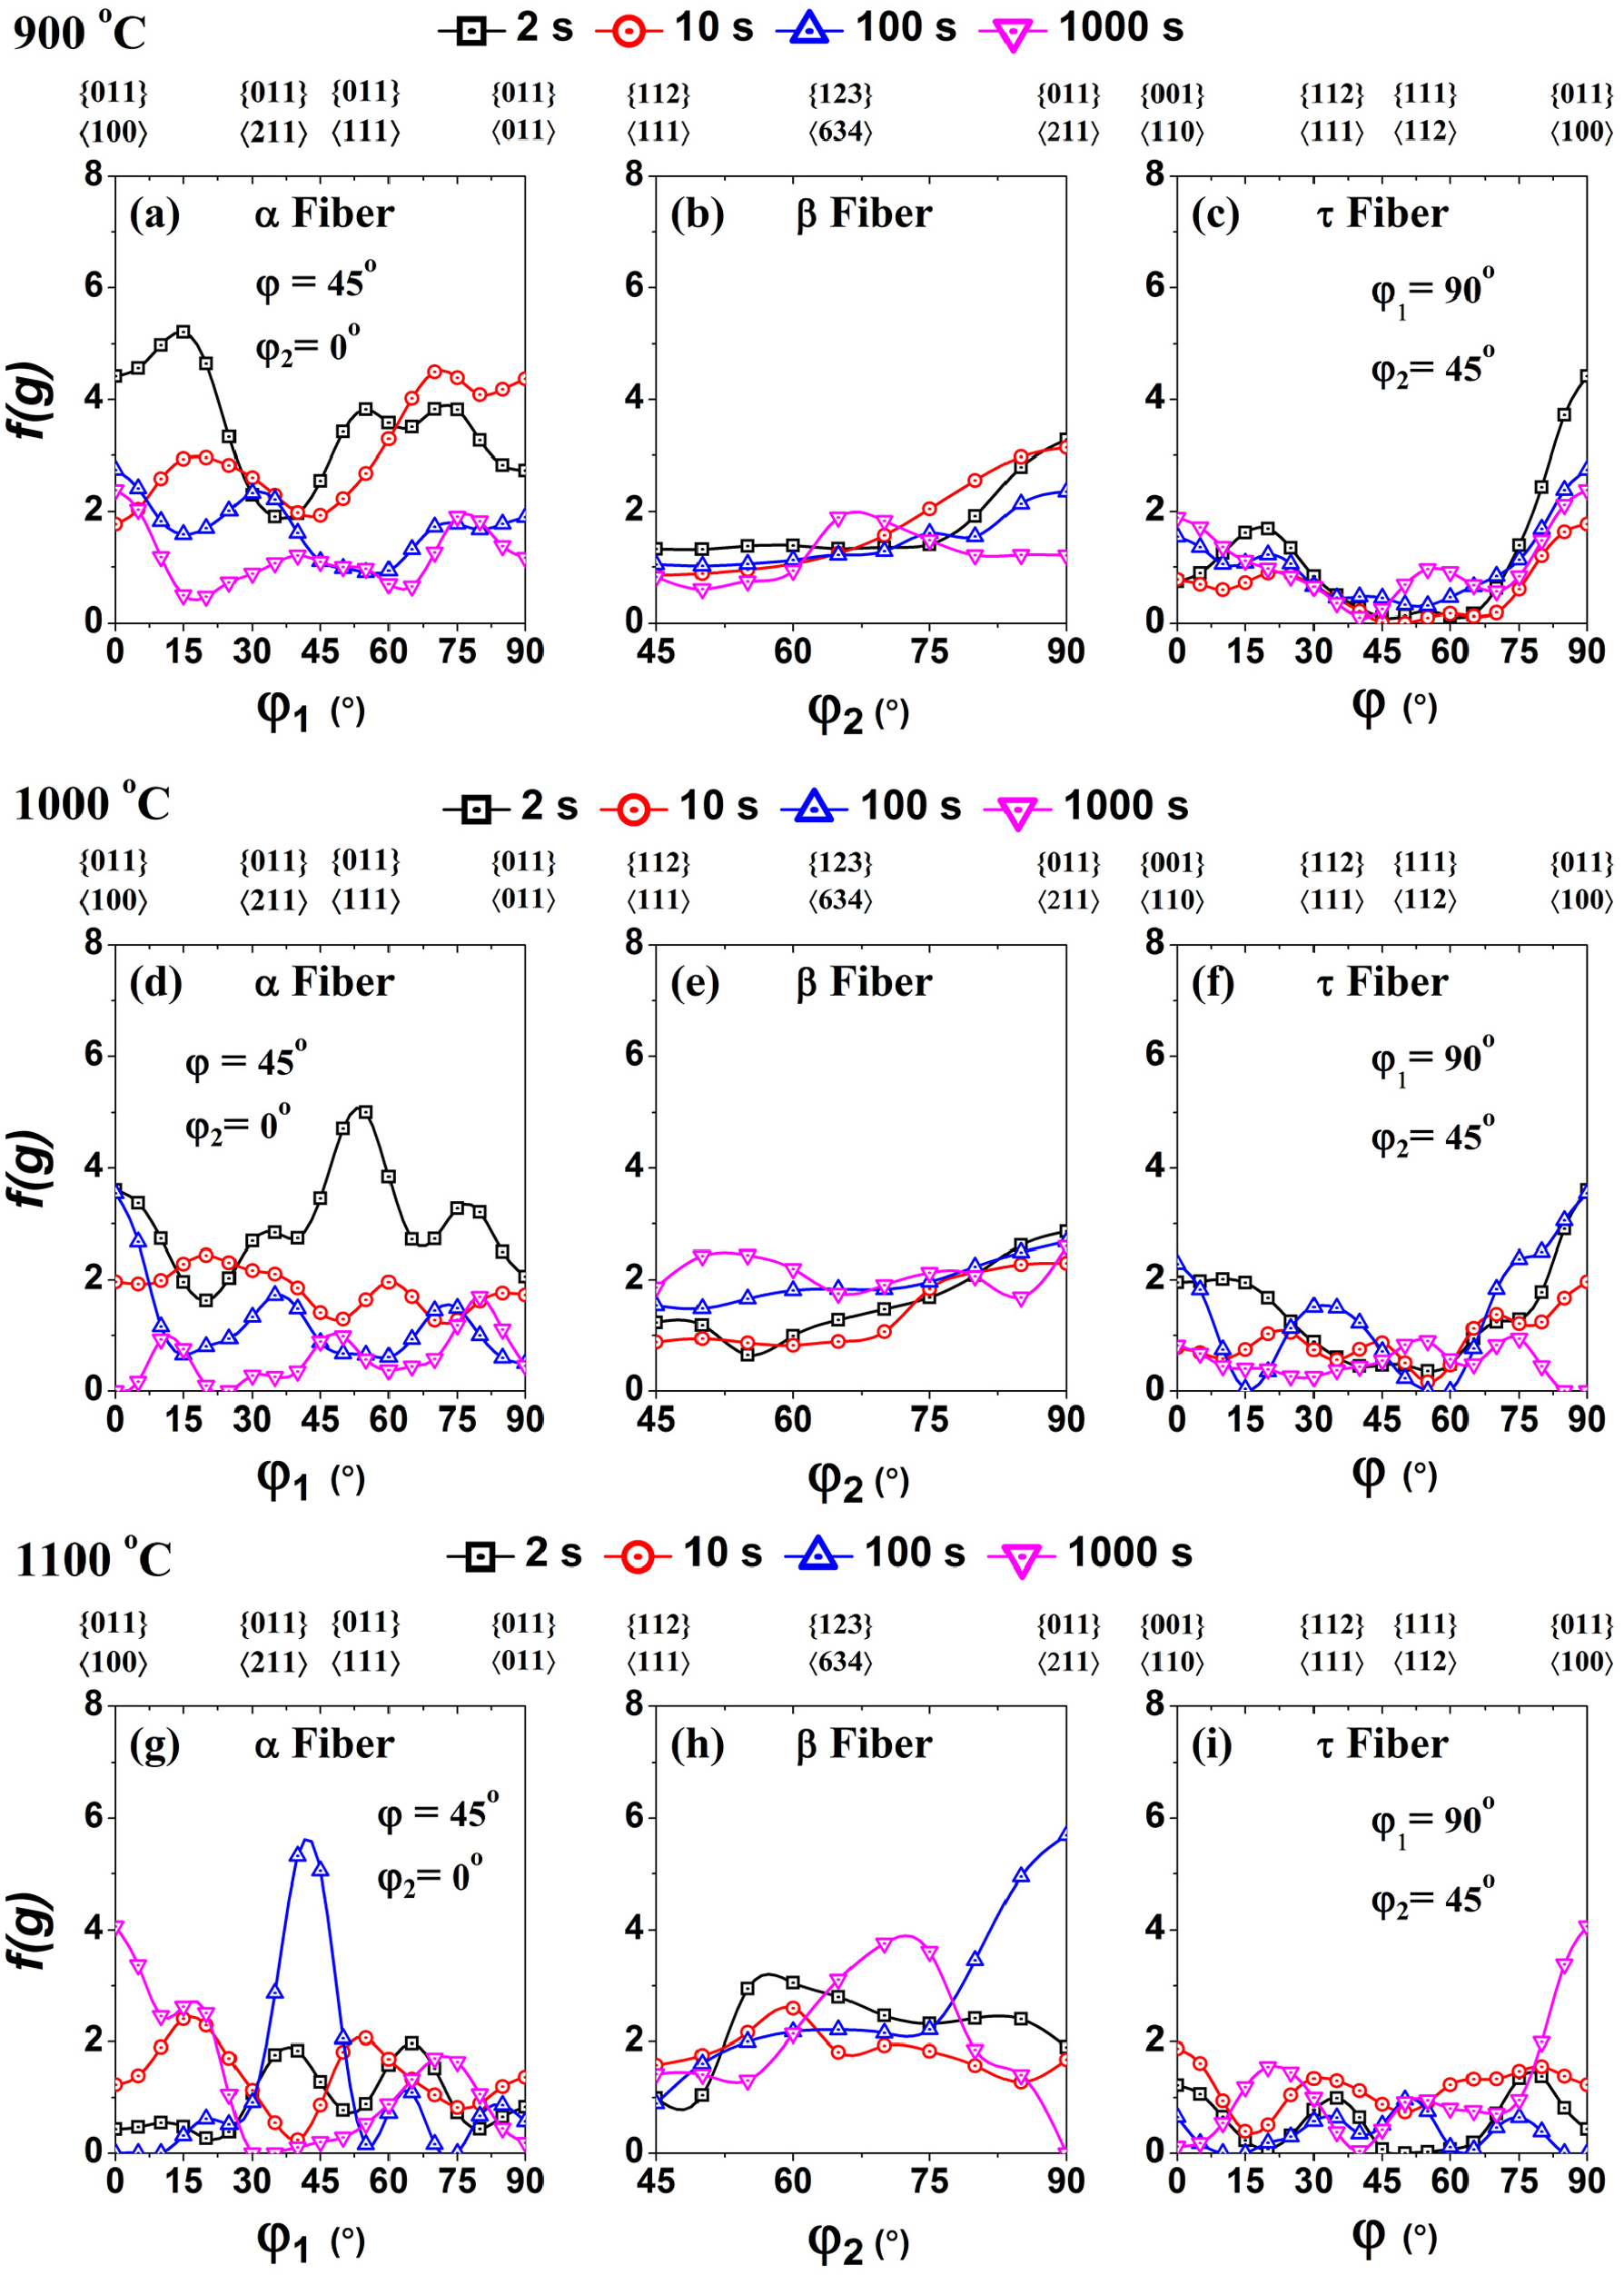
Texture intensity distributions along α, β and τ fibres for samples compressed and isothermally held at temperatures (a–c) 900°C, (d–f) 1000°C, and (g–i) 1100°C.
The initial texture shown in Figure 5 depicts the presence of ideal texture components viz. Copper, Brass, S and Cube. In general, Copper, Brass and S are the deformation textures and Cube is the recrystallisation texture. So, it can be concluded that the solution annealing (as-received material was in solution-annealed condition) retains the deformation texture and the initial texture is copper type texture.6,13
The after processing texture of samples held for 2 s and 10 s at 900°C and for 2 s at 1000°C contains Goss and Brass as major and minor deformation texture components. This can be seen on their respective ODF plots in Figure 9 (presence of deformed grain can be confirmed from the respective microstructures shown in Figure 3). These samples also exhibit strong intensities along α fibre (Figure 11(a) and (d)). Based on this, it can be concluded that the axisymmetric deformation performed on the material (true strain ∼0.16) exhibit Brass type texture, which was supposed to be, as the present material is a low SFE material (∼20 mJ/m2). 36 Formation of α fibre (110 || ND fibre, extending from Goss to Brass) for reduction less than 20 % in rolling is also reported by Singh. 13 So, a transition from initial Copper type to Brass type texture occurs because of axisymmetric compression of true strain ∼0.16. However, none of the samples, after processing, shows the trace of Copper component (Figure 9). The same does happen for S component. So, it can be said that the after deformation holding time does not help in texture transition from Brass to Copper.
The formation of higher fraction of Goss component, at 900°C and 1000°C, might be due to the presence of Goss orientation in the deformed matrix, as it can be observed from the ODF of samples held for 2 s (Figure 9(a), these samples contains higher fraction of deformed grains than the other samples). Subsequent annealing prevails Goss component formation, which might be due to their optimum growth conditions. At 1100°C, higher intense Goss component can be observed for sample held for 1000 s whereas, sample held for 100 s shows a higher intensity Brass component. Existence of deformation texture components like Brass and Goss components, after annealing, indicates the oriented nucleation. 29 The comparatively diffuse and random texture formation, at temperatures 1000°C and 1100°C might be due to the formation of significant number of annealing twins (existence of annealing twins, after processing, can be confirmed from the respective microstructures shown in Figure 3). 37
Conclusion
In-depth analyses, capturing the practical condition of upset forging process, including the effect of temperature and holding time on the texture evolution/texture component formation has been studied for the austenitic stainless steel. This in-depth study will be helpful to the researchers, working on the texture/crystallographic orientation development in metallic material due to the plastic deformation.
The axisymmetric compression of true strain 0.16 transforms the initial Copper type texture to Brass texture and subsequent holding time does not help in retaining back the Copper texture. At low deformation temperature and less holding time 〈100〉 and 〈110〉 fibre textures were observed. Also, at these conditions, traces of α fibre was developed. On the other hand, at high deformation temperature and/or high holding time the texture becomes random. Goss, ND and RD rotated Cubes are found to be the major texture components at higher deformation temperature and higher holding times. Due to the friction between the workpiece and the die, deformation was not uniform throughout the sample thickness. Also a through-thickness temperature gradient was observed.
The work can be further extended considering different process parameters so as to obtain an optimum process parameter based on the texture development.
Footnotes
Declaration of conflicting interests
The author(s) declared no potential conflicts of interest with respect to the research, authorship, and/or publication of this article.
Funding
The author(s) received no financial support for the research, authorship, and/or publication of this article.