
Abstract
In this study, the optimal process parameters for a high-velocity oxygen fuel spray, which was used to deposit WC-12Co coating on a 16Mn steel substrate, were studied to simultaneously improve the microhardness, adhesion strength, and porosity of the coating. To this end, trial tests were conducted to determine the feasible ranges of the spray parameters: powder feed rate (A), spray distance (B), and oxygen/propane mixture ratio (C). Taguchi orthogonal array (L9) experimental design was used to determine regression formulae for the microhardness, adhesion strength, and porosity. Then, based on a method using the multiple regression-based weighted signal-to-noise ratio, the optimal spray parameters were identified. To verify the optimization results, confirmation experiments were carried out. An analysis of variance was also conducted to check the proportion of contribution of the spray parameters on the output quality characteristics. The confirmation test results proved that the predicted and measured results were in good agreement. The optimal conditions of the high-velocity oxygen fuel spray were: A = 32 g/min, B = 0.35 m, and C = 5. The estimated optimal coating properties were: microhardness = 1335.784 HV, adhesion strength = 64.659 MPa, and porosity = 1.797%. The oxygen/propane ratio showed the highest contribution to the microhardness, whereas the most influential factor for both adhesion strength and porosity was the spraying distance.
Keywords
Introduction
Thermal spray techniques have been used extensively to improve the surface properties and dimensional restoration of metal parts by means of deposited coatings. Of these techniques, high-velocity oxygen fuel (HVOF) spraying is highly flexible and suitable for a wide range of substrate materials, such as alloys, metallic ceramics, and carbides. 1 Low alloy, high-strength 16Mn steel has been extensively used in many industries, especially in mining machinery, and civil construction. Many mechanical components made of 16Mn steel experience severe friction and wear during their operation, such as drilling rigs, the bucket teeth of hydraulic excavators, crusher shafts, etc. Hence, deposited erosion-resistant coatings made with HVOF spray for those components are extremely important to extend their service life and restore their dimensions.
The HVOF coatings have the advantages of low porosity, and high adhesion strength and hardness compared with other spraying methods. 2 However, the performance of the HVOF coatings is highly sensitive to the spray process parameters. 3 Therefore, the determination of optimal spray parameter values is critical for obtaining superior coating properties, and has attracted significant attention from researchers. Among the optimization techniques, the design of experiments (DOE) using the Taguchi approach is fairly effective for finding the optimal process parameters for many industrial implementations, including the thermal spray process.4–8 Praveen et al. 4 used the Taguchi method for the optimization of HVOF spray with NiCrSiB/WC-Co coating on an AISI 304 stainless steel substrate. Qiao et al. 5 studied the optimal parameters of HVOF spray using an iron-based amorphous coating on a 45-steel substrate also using the Taguchi method. Wang et al. 6 examined the abrasive wear response of a WC-Co coating deposited on a 16Mn steel substrate, in which kerosene was used in the HVOF spray. Qin et al. 7 explored the optimal spraying parameters of HVOF spray with Fe-based coatings. The effects of the main process parameters on residual stresses in HVOF sprayed WC-12Co coatings were studied by Nouzouri et al. 8
The Taguchi approach is normally suitable for the optimization of a single objective. To solve the multi-objective optimization of thermal spray processes, several authors have developed the Taguchi-OEC technique, 9 Taguchi-based gray relational analysis10,11 and response surface methodology.12,13 Pal and Gauri 14 introduced the multiple regression-based weighted signal-to-noise ratio (MRWSN) optimization method, which was based on a combination of the Taguchi and mathematical regression techniques. They applied this method to various optimization problems in engineering such as plasma-enhanced chemical vapor deposition, wire electrical discharge machining, and polysilicon deposition. 15 The noticeable advantages of this method are its easy implementation and low computational complexity. Nevertheless, the MRWSN method still can offers competitive computational accuracy in comparison with other methods. 16 Therefore, it may be useful for process engineers.
In this work, the multi-objective optimization of the HVOF spray process with a WC-12Co coating and 16Mn steel substrate was studied. The objectives of optimization were the microhardness, adhesion strength, and porosity of the coating. The spray parameters to be optimized were the powder feed rate, spraying distance, and oxygen/propane ratio. Trial tests were prepared to determine the feasible ranges of the spray parameters. Then, each spray parameter range was divided into three levels, and spray experiments were conducted. The optimal spray parameters and correspondent quality characteristics-based multi-objective optimization were determined using the MRWSN method. In order to check the optimal results determined by theoretical computation, confirmation experiments were conducted. Finally, an analysis of variance (ANOVA) was carried out to determine the degree of influence of each spray parameter on the output measures, and the obtained results are discussed.
Materials and experiment method
Materials
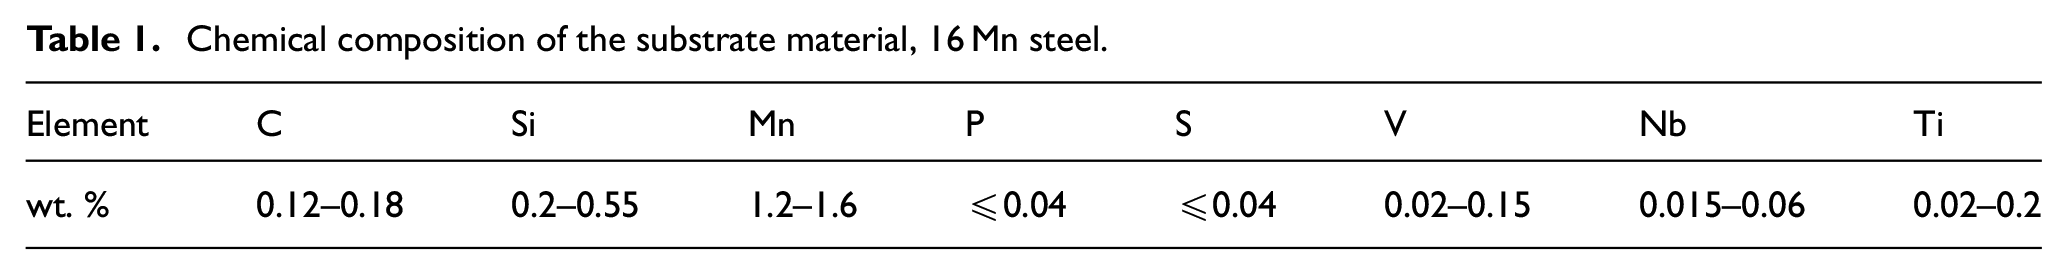
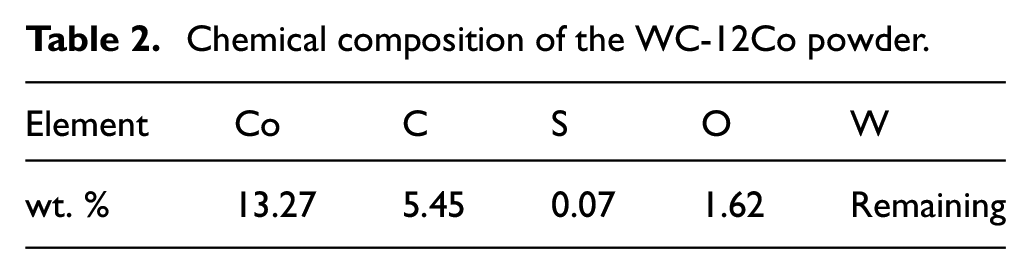
The substrate material was 16Mn steel with the chemical composition shown in Table 1. The powder used in the HVOF spray was WC-12Co, provided by Eutectic Corp. (USA). Figure 1 shows the morphology of the WC-12Co powder, which was captured by scanning electron microscopy (SEM). It can be seen from Figure 1 that the WC-12Co powder is spherical in shape with particle sizes ranging from 15 to 45 µm. Moreover, powder particles with a porous structure can be observed. Figure 2 presents the energy-dispersive X-ray (EDX) scanning pattern of the WC-12Co powder. From Figure 2, the chemical composition of the powder was identified as depicted in Table 2.
Chemical composition of the substrate material, 16 Mn steel.
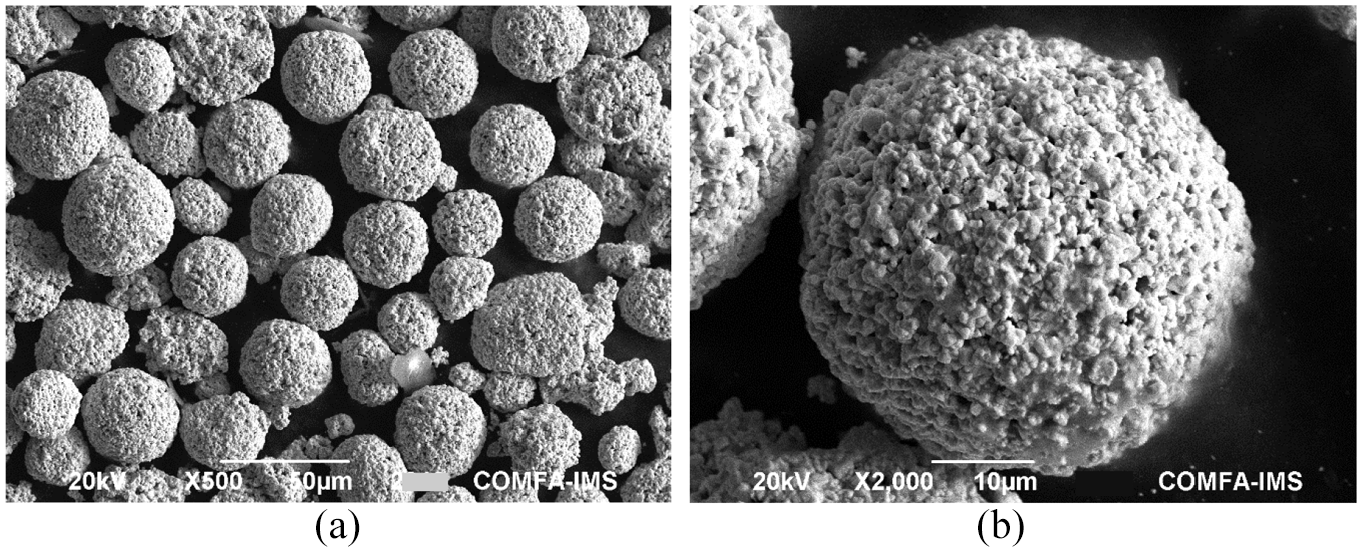
Morphology of the WC-12Co powder: (a) SEM image of WC-12Co powder and (b) enlarged view of a particle.
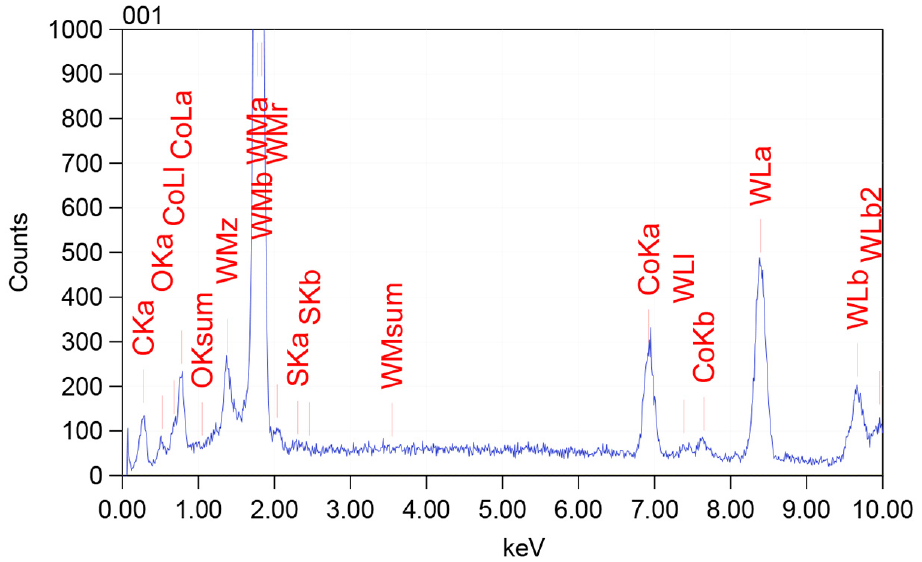
EDX scanning results of the WC-12Co powder.
Chemical composition of the WC-12Co powder.
Experiment method
The dimensions of the specimens used in the HVOF spray were 50×50×6 mm. The specimens were cut from an original steel plate by using an electrical discharge machine, which was intended to minimize the effect of the cutting process on the steel substrate properties. Subsequently, the specimens were blasted by an abrasive blasting machine (TSA–206, Vietnam) to increase the adhesion strength between the deposition and the substrate. The size of the sand particles used in the blasting was between 0.8 and 1 mm. The surface roughness of the specimens after blasting varied between 8 and 10 μm, and was checked using a surface roughness gage (SurTest TR100, ElektroPhysik, Germany). After blasting, the specimens were cleaned with Acetone solution to remove the embedded particles, and were subsequently air dried at 45°C for 5 min. The WC-12Co powder was dried in a vacuum oven for 2 h at 120 to 150°C to remove the absorbed moisture.
The spraying process was performed on a Hipo-Jet HVOF system, which consisted of a MP-2100 control panel, an HP-2700M spray gun, and a PF-3350 powder feeder. Before spraying, the specimen was pre-heated using the spray gun at 150°C for 2 min. The pre-heating temperature was checked by a non-contact thermometer. After that, the spray process commenced. The required thickness of the deposited coating after the spraying process was 500 ± 50 µm. Figure 3 presents the specimens before and after spraying.
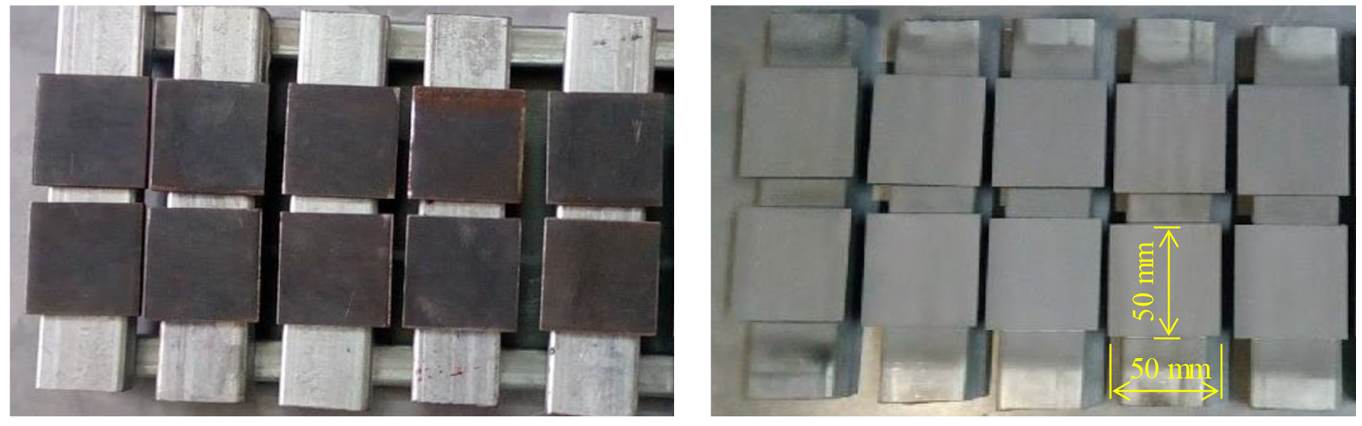
The specimens before spraying (on the left) and after spraying (on the right).
Coating properties characterization
This section presents the characterization methods used to measure the microhardness, adhesion strength, and porosity of the coating. The microhardness was measured using a hardness tester (IndentaMet 1106, Buhler, USA) based on the ASTM E384-17:2011 standard. 17 During the microhardness test, a load of 100 g was applied using an indenter, and the elapsed time of indentation was 15 s. Then, microhardness was measured on the HV0.1 scale. Figure 4 shows the specimen after the microhardness test.
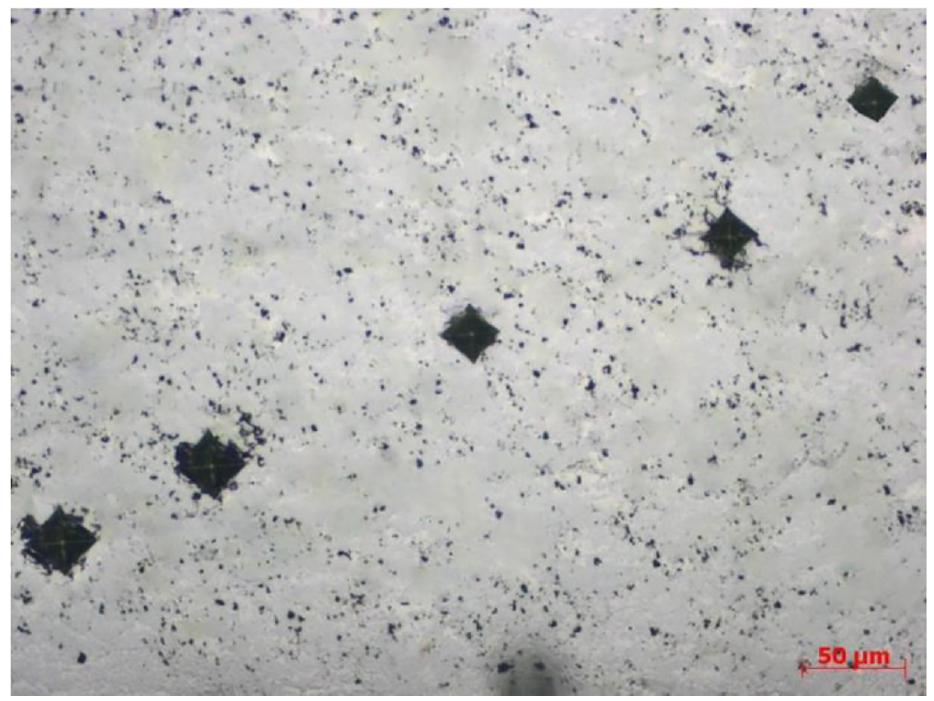
SEM image of specimen after the microhardness test.
The adhesion strength of the coating was characterized according to the JIS-H-8666-1980 standard. 18 The dimensions of the specimens used in the adhesion strength test were 7×50×6 mm. The specimens were cut from the initial sample with the size of 50×50×6 mm by using an electrical discharge machine. Figure 5 shows the experimental setup for measuring the adhesion strength. A custom-designed fixture was fabricated to perform the test. Figure 5 also illustrates the schematic diagram of the designed fixture. The fixture was fixed to the test bed of a universal testing machine, which generated a compressive load on the punch. The load was monitored, and the adhesion strength of the coating was calculated as follows:
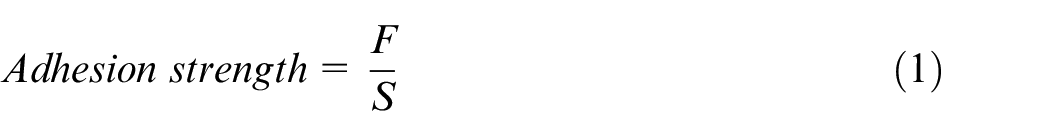
where F is the measured load in newtons (N). S is the shearing area, which was equal to the embedded area of the coating on the substrate: S = 50×7 mm2.
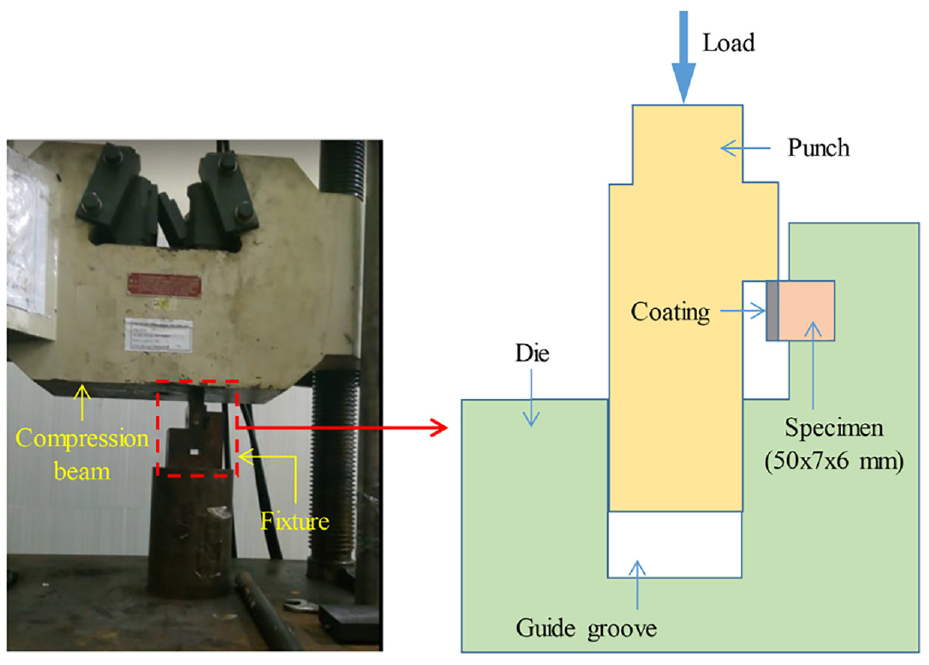
Experiment setup for measuring the adhesion strength.
The porosity test was guided by the ASTM B276-05-2015 standard. 19 Accordingly, the test was conducted on a 400×400 µm square area of a cross section over the coating thickness. The porosity was theoretically calculated as the ratio of the total areas of the voids to the examined square area. Images of well-polished cross-sections were captured using the inverted microscope Axioplan 2 (Carl Zeiss, Germany) at a 200× magnification. The solid background of the magnified image was removed to determine the porosity, which was done using the image processing program ImageJ (NIH, USA). Figure 6 demonstrates the magnified images from the porosity test.
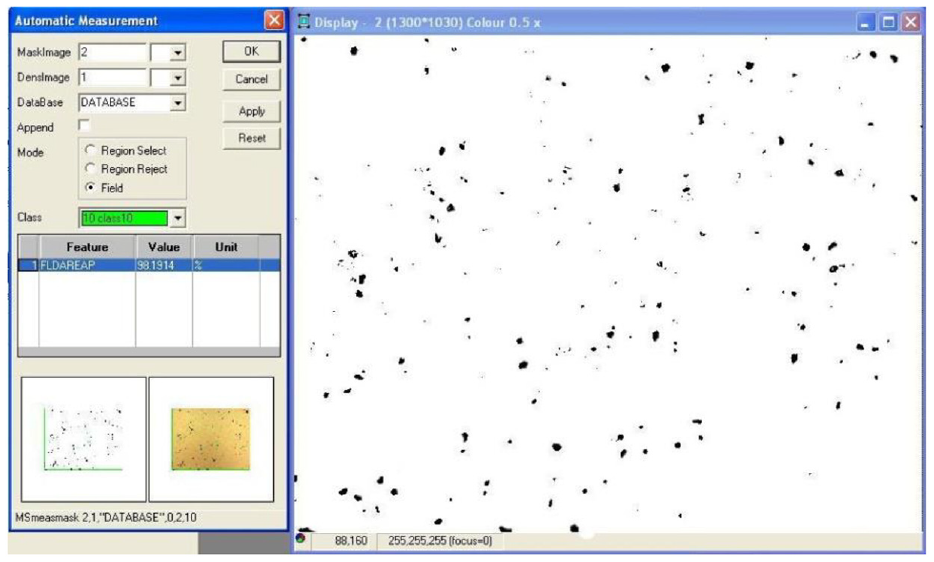
Porosity test with the original image and the image with solid background removed.
The measurement of the coating characteristics was repeated at least five times to ensure reproducibility. The final measured value was the average of the recorded measurements.
Experimental design
With HVOF spray, the powder feed rate, spray distance, and oxygen/propane ratio are the critical parameters that predominantly affect the quality of the deposited coating.9,20,21
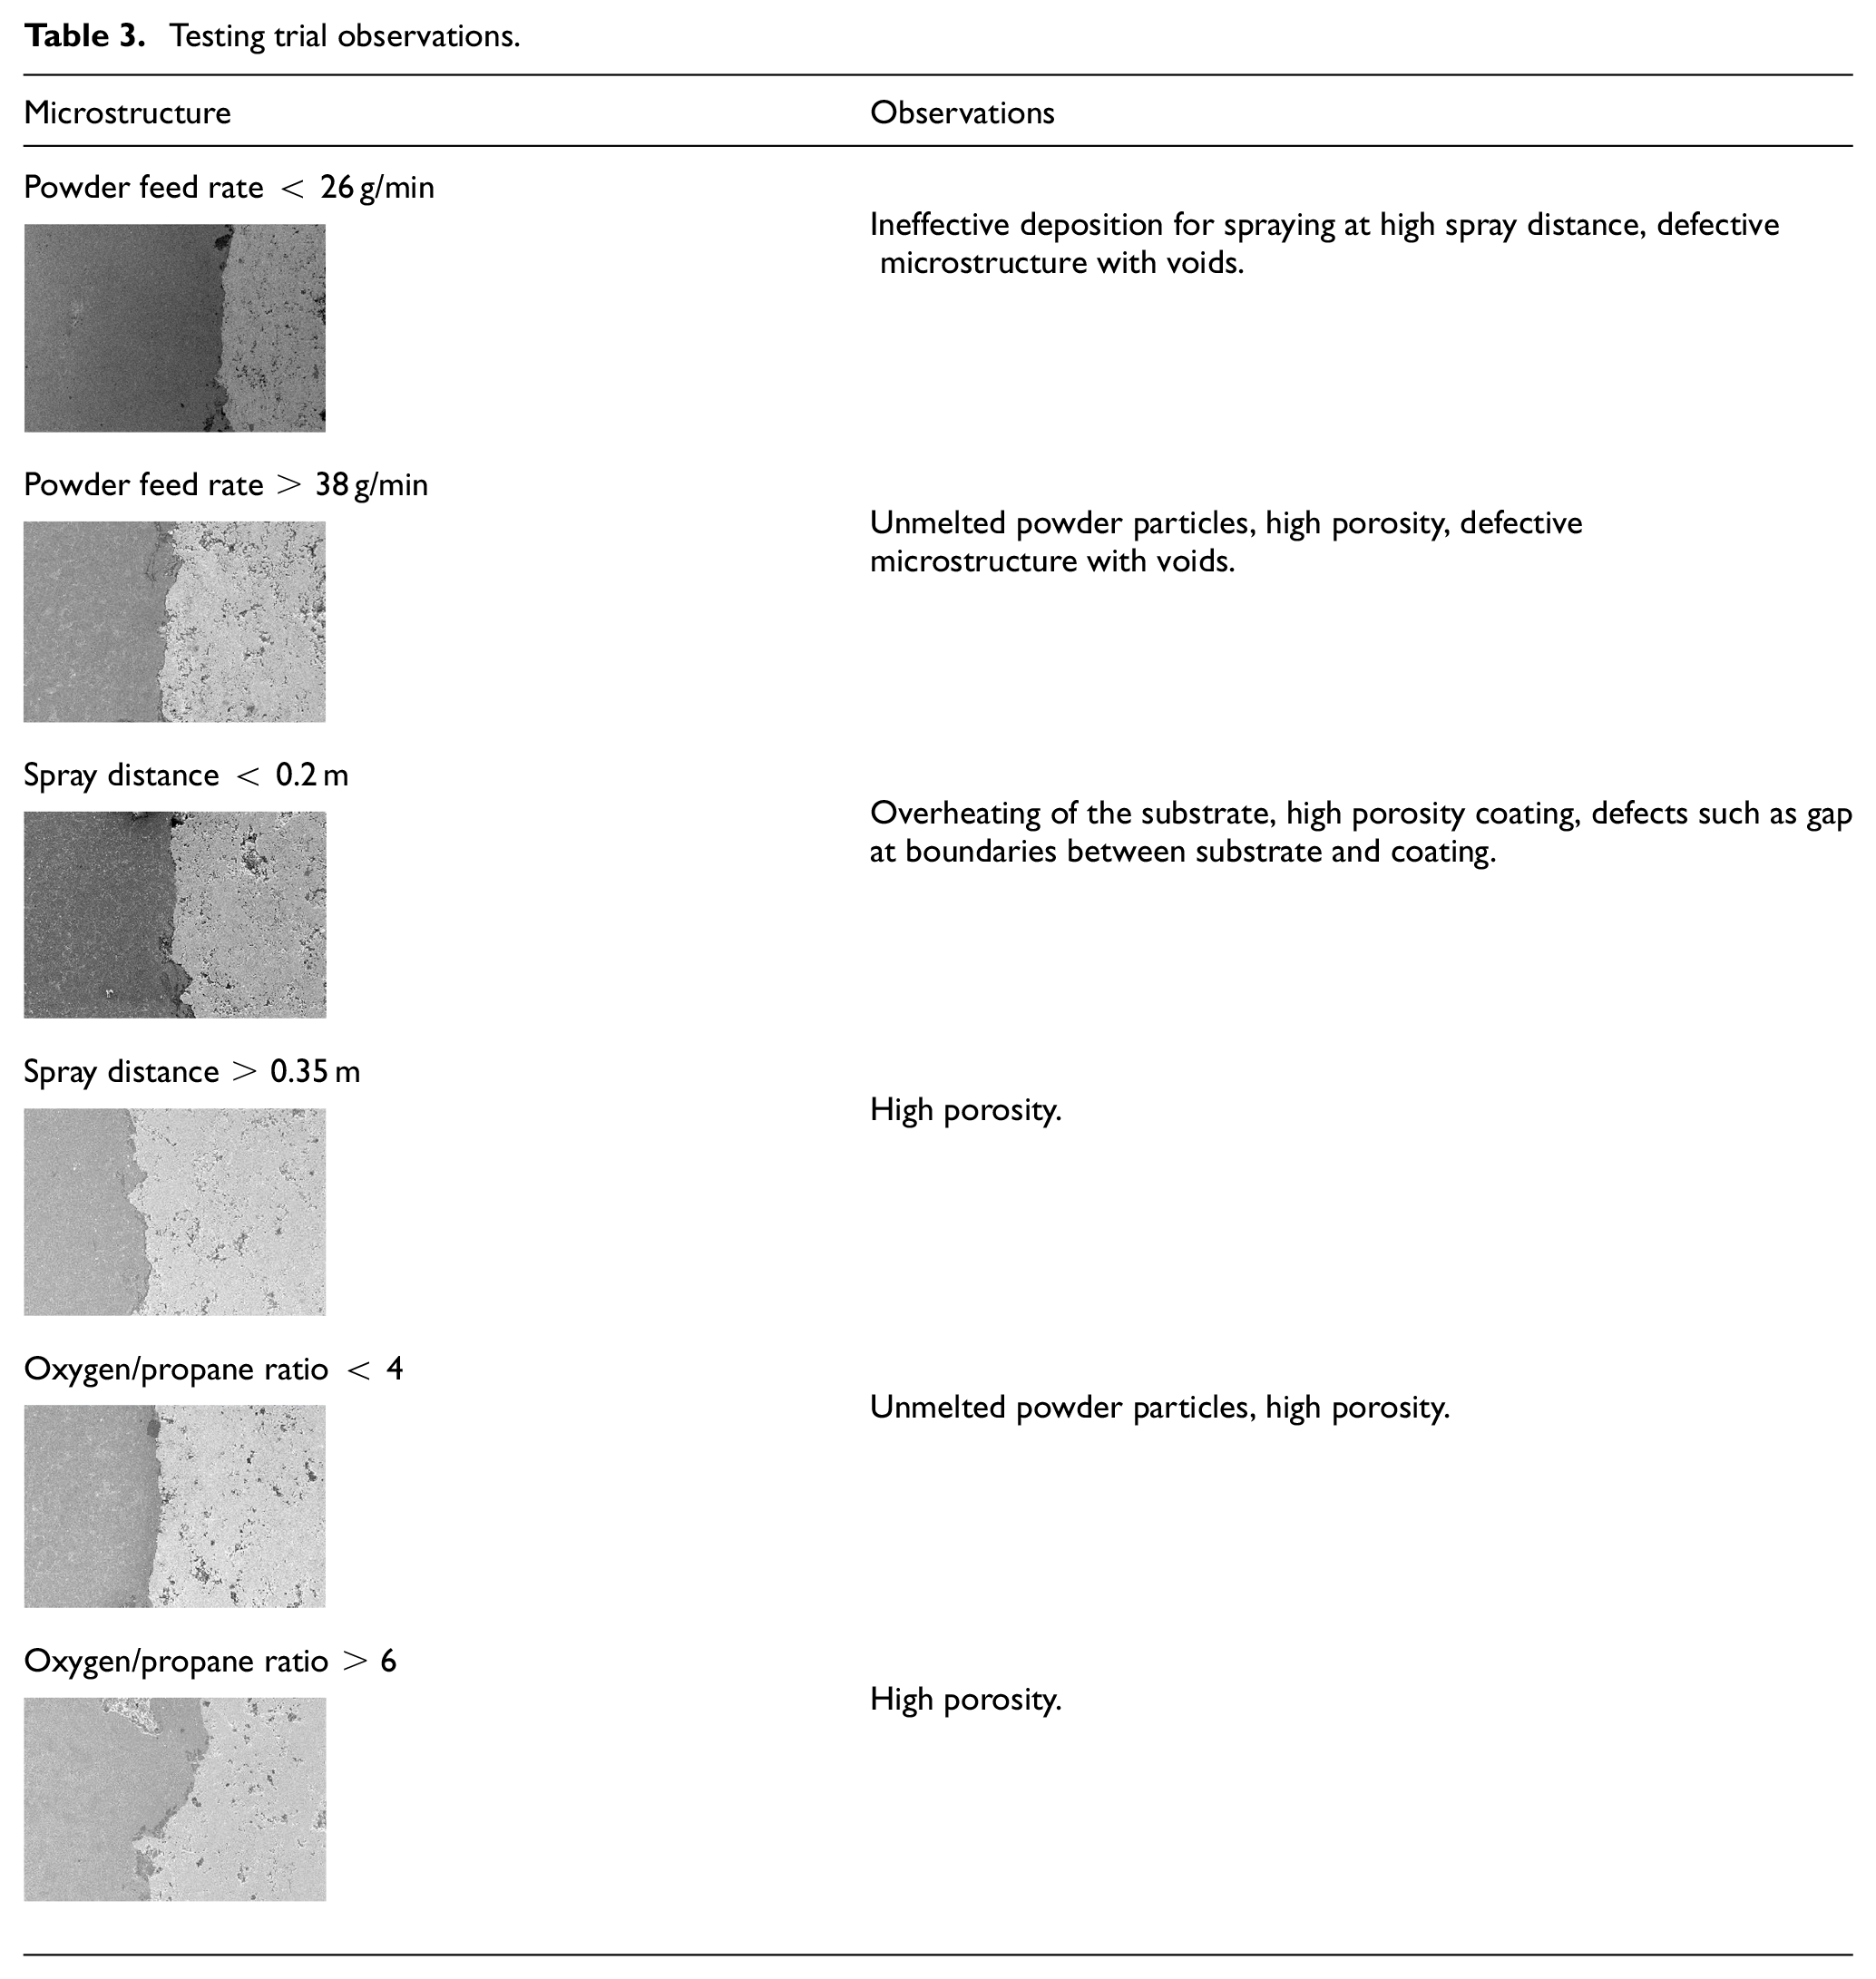
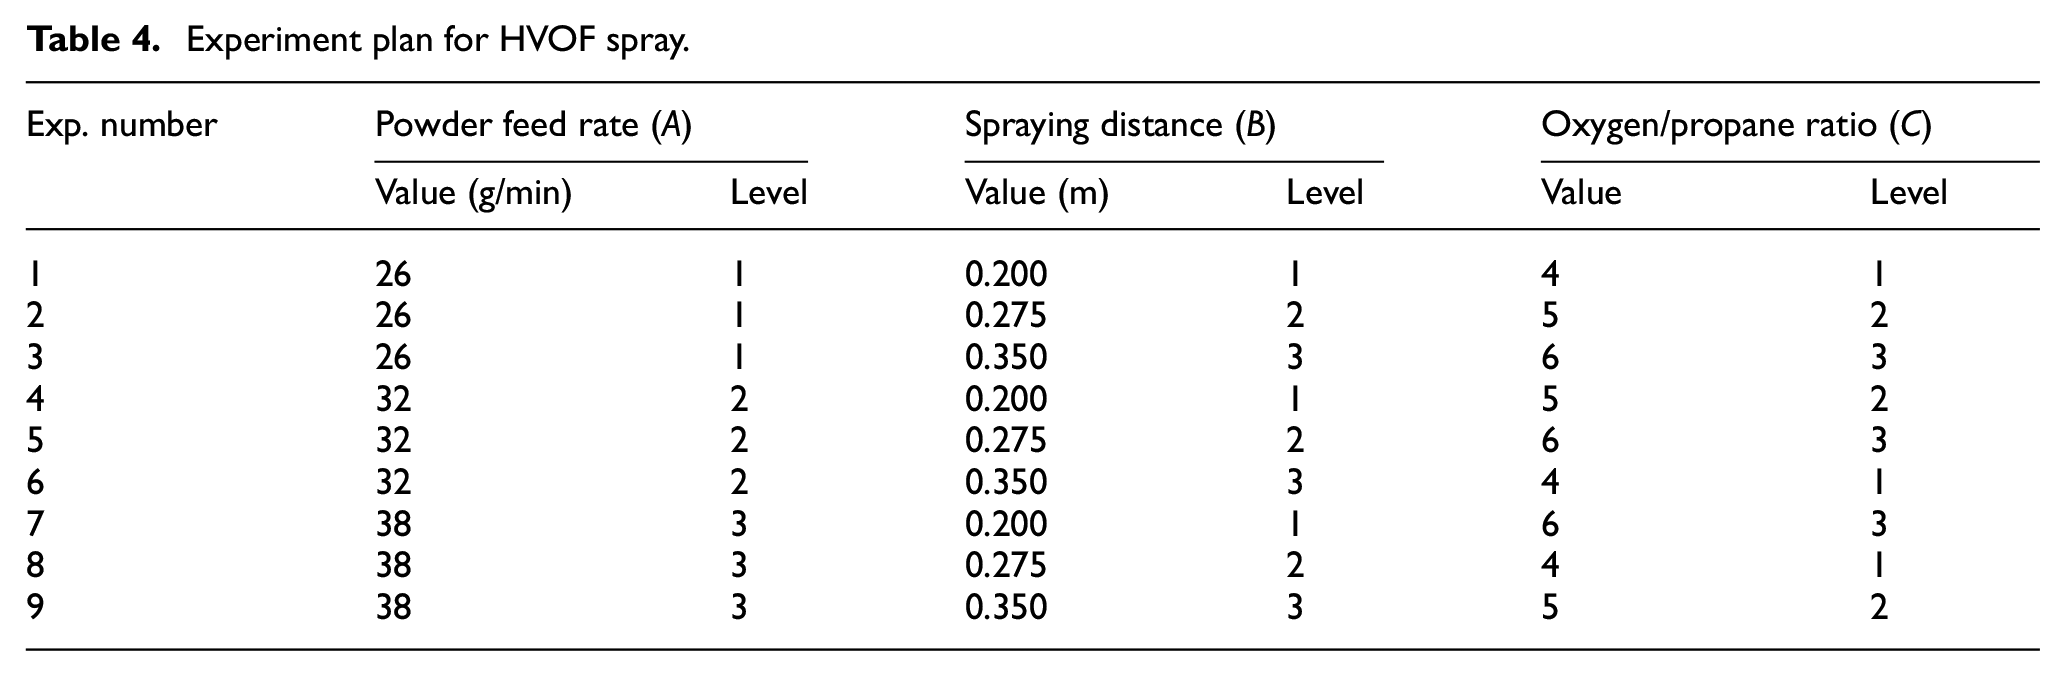
To identify the feasible range of the above-mentioned spray parameters, a number of trial tests were carried out with varying powder feed rates, spray distances, and oxygen/propane ratios. The other parameters, which were kept constant during the process, are as follows: oxygen and propane pressure = 0.686 MPa, propane flow rate = 60 L/min, carrier gas (nitrogen) pressure = 0.4 MPa, carrier gas flow rate = 20 L/min. From the testing trials, some observations of the deposited microstructures were obtained, as summarized in Table 3. From Table 3, the working ranges of the spray parameters were selected as follows: powder feed rate from 26 to 38 (g/min), spray distance from 0.2 to 0.35 (m), and oxygen/propane ratio from 4 to 6. To find the regression formulae for the response qualities, a total of nine experiments were conducted. The experiments followed the L9 orthogonal array recommended by Taguchi. Three levels were selected for each spray parameter, including powder feed rate (A), with A1 = 26, A2 = 32, and A3 = 38 (g/min); spray distance (B), with B1 = 0.2, B2 = 0.275, and B3 = 0.35 (m); and oxygen/propane ratio (C), with C1 = 4, C2 = 5, and C3 = 6. Table 4 shows the details of the experiment plan.
Testing trial observations.
Experiment plan for HVOF spray.
Multi-objective optimization methodology
MRWSN method
This section presents the calculation process for the MRWSN method for the multi-objective optimization. First, the average values of response quality
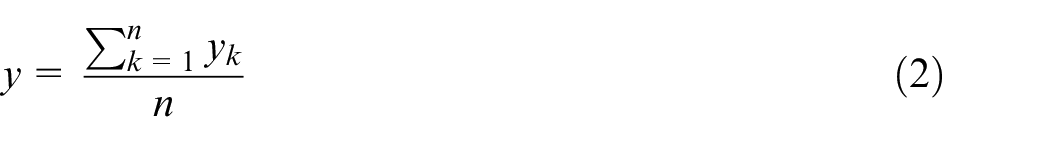
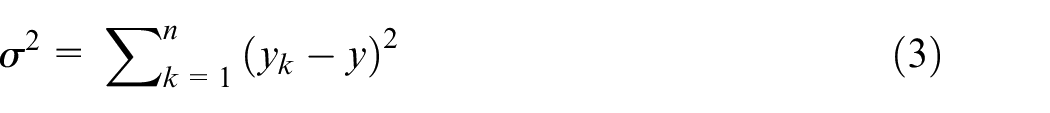
where y indicates the value of response quality (microhardness, adhesion strength, and porosity), and n is the number of repeated measurements for one experiment.
Next, regression formulae for response quality

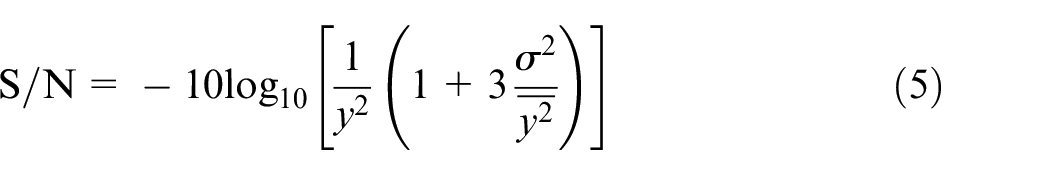
For the larger-is-better criterion, which was used for the microhardness and adhesion strength of the coating to the substrate, the S/N ratio was determined as:
From the calculated S/N ratios, the MRWSN was estimated using the following equation:
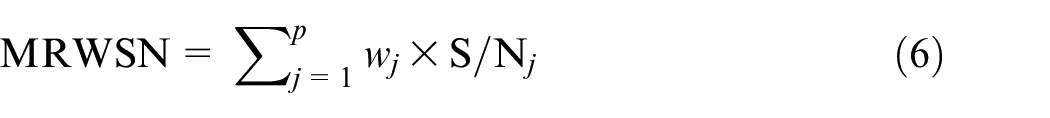
where S/N
j
represents the signal to noise ratio for the j-th response quality. Here, wj is the weighting factor of the response quality, which satisfies
After attaining all the MRWSN values, the set of spray parameters corresponding to the highest value of MRWSN were identified. Those parameters represented the optimal spray conditions. Finally, the response qualities associated with the optimal parameters were calculated using the regression equations found in the previous step.
Determination of regression formula
The general form of the regression formula is:
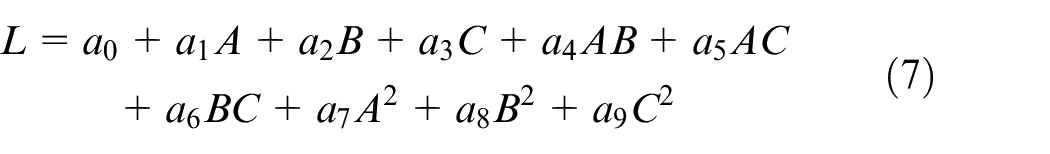
where A, B, and C are the spray parameters. aj (j = 1–9) are the coefficients to be determined. These coefficients are determined by minimizing the following residual sum of squares SSR:
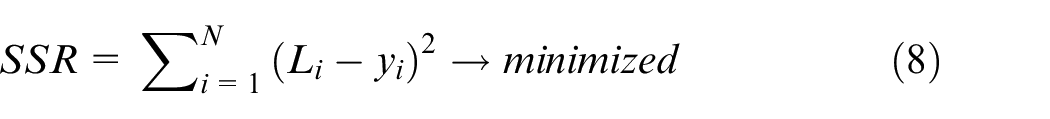
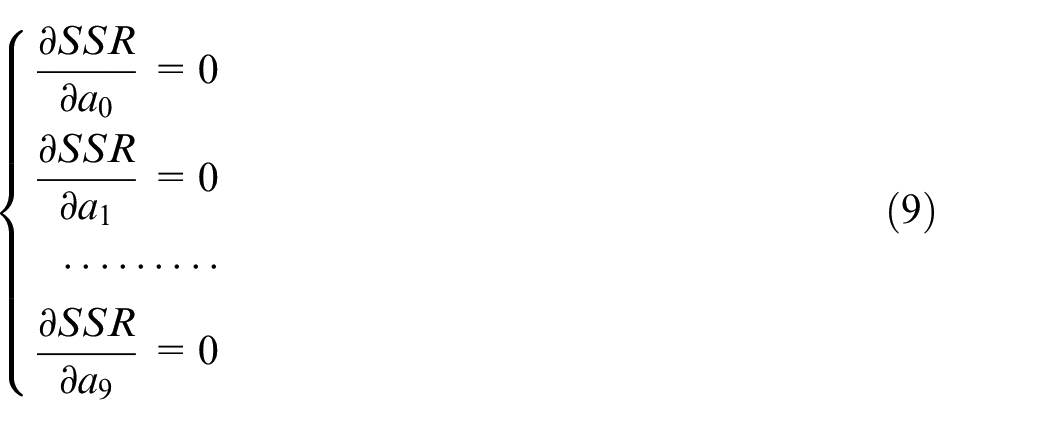
where subscript i indicates the experiment. N is total number of experiments, N = 10. Accordingly, the coefficients aj (j = 1–9) are the roots of following system of equations:
The above system of equations was transformed to the following standard form as:
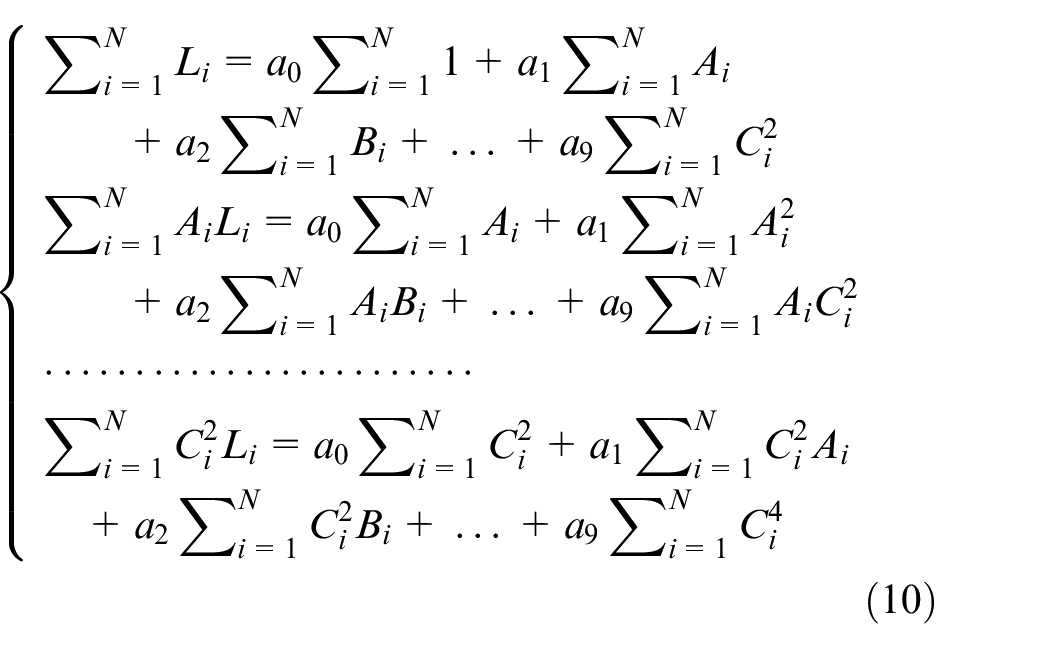
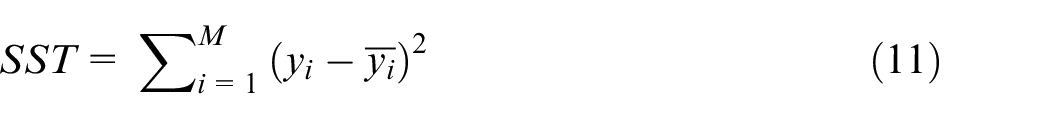
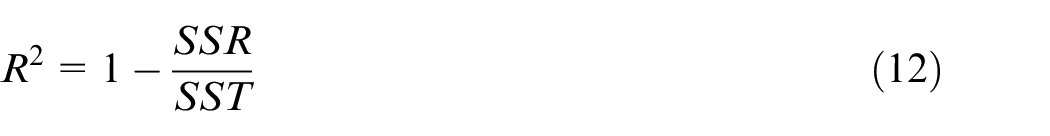
By solving the system of equations in (10), the coefficients aj (j = 1–9) were found. To solve this system of equations, an iterative Newton–Raphson method was used. After that, a goodness of fit test was performed to confirm the accuracy of the derived regression equations. To perform the goodness of fit test, the sum of squares explained by the regression (SSR) was calculated using equation (8). Subsequently, the total sum of squares SST, which represents the total difference between each variable and its mean value, was calculated:
where
An
Results and discussion
Experimental results
Table 5 shows the experimental results for microhardness, adhesion strength, and porosity. Table 5 demonstrates that the microhardness, adhesion strength, and porosity of the coatings vary from 1058.2 to 1255.5 HV, 52.1 to 67.6 MPa, and 1.42 to 3.37%, respectively.
Experiment results for coating properties obtained by HVOF spray.
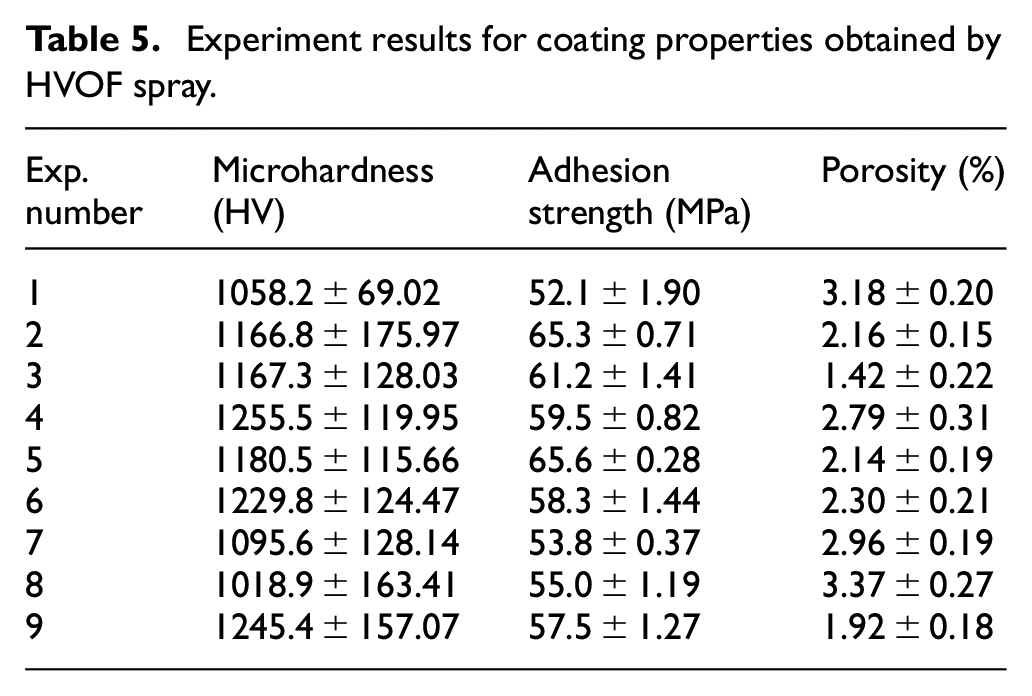
Figure 7 shows the microstructure of the coatings with the largest (Experiment 1) and smallest porosity (Experiment 3). Experiment 3 has a higher spraying distance and a higher oxygen/propane ratio than Experiment 1, while the powder feed rates were the same. The deposited coatings generally show dense microstructures. However, there are voids in the cross-section of the coating for Experiment 1 as shown in Figure 7(a). A coating with denser microstructure is generally formed with a lower porosity (lesser volume of voids). In HVOF spray, the energy absorbed by the powder particles has a great impact on the quality of coating. This is because only the particles with sufficient energy will experience a plastic deformation and fully transform to a molten state. The energy gained by the particles also influences the solidification behavior of the molten particles. The small powder particles underwent a full phase transformation from a solid to a melt state in Experiment 1. However, a partially melted state occurred in the larger particles because the particles gained insufficient energy during the short spraying time. As a result, voids formed in the deposited coating, as can be observed in Figure 7(a). On the other hand, the deposited matrix shows complete melting when the spraying distance is 0.35 m (Experiment 3). Therefore, the particles underwent a full transition from solid to melt phase, which led to a reduction in coating defects, as shown in Figure 7(b).
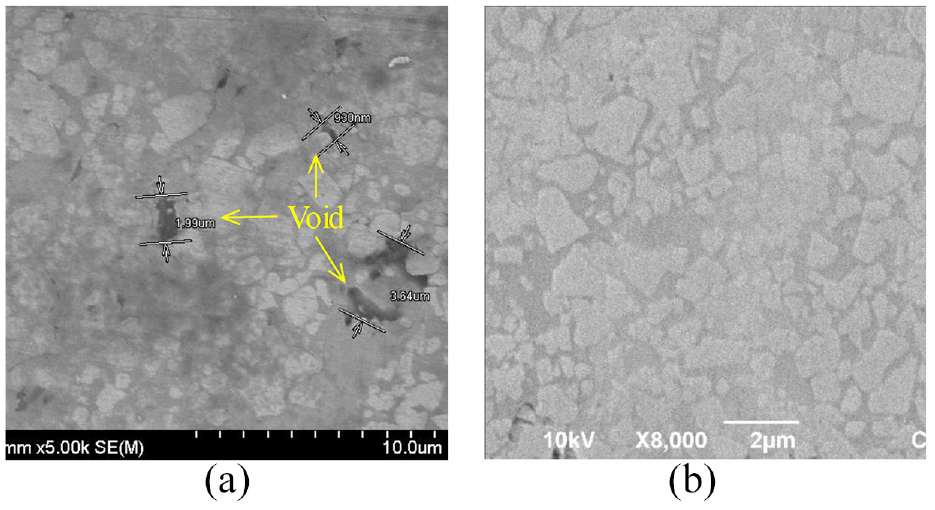
Microstructure of coatings with minimal and maximal porosity: (a) experiment 1 and (b) experiment 3
Figure 8 shows the interface regions between the coating and substrate for Experiments 1 and 3. The characteristics of the interface have a major impact on the strength of the adhesion between the substrate and coating. Defects such as pores and gaps are found at the boundaries, as shown for Experiment 1 in Figure 8(a). With an increasing oxygen/propane ratio, the thermal source produced by the spray gun increases. Hence, the coating powder can be deposited with a higher degree of melting to form good bonding with the substrate, which contributes to an increase in the adhesion strength.
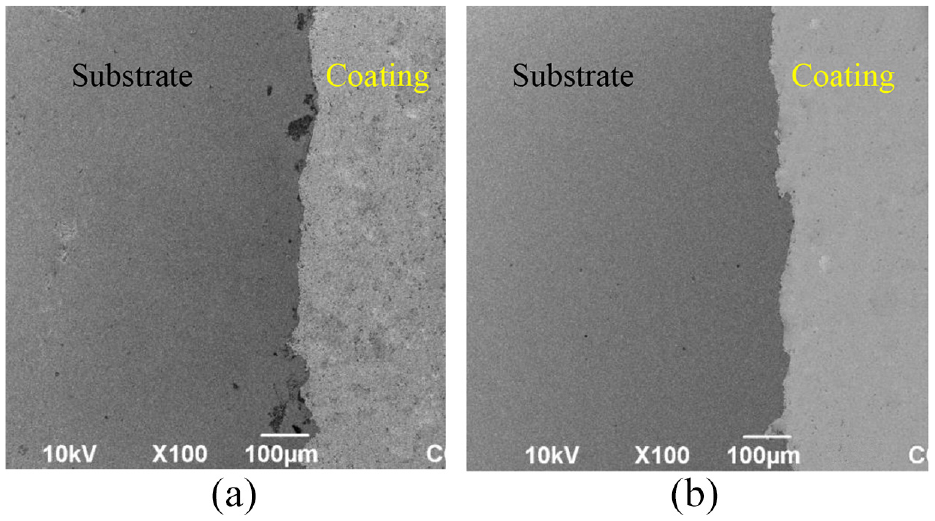
SEM image of the interface between coating and substrate: (a) experiment 1 and (b) experiment 3.
The above-mentioned improvement in the melting ability of the particles also accounts for the increased microhardness in Experiment 3 compared with Experiment 1, as shown in Table 5. Nevertheless, an improvement in coating qualities cannot be attained by an increase or decrease in individual spray parameters. Instead, the coating qualities are dependent on how the three spray parameters are combined. Hence, it is essential to find the optimal combination of spray parameters.
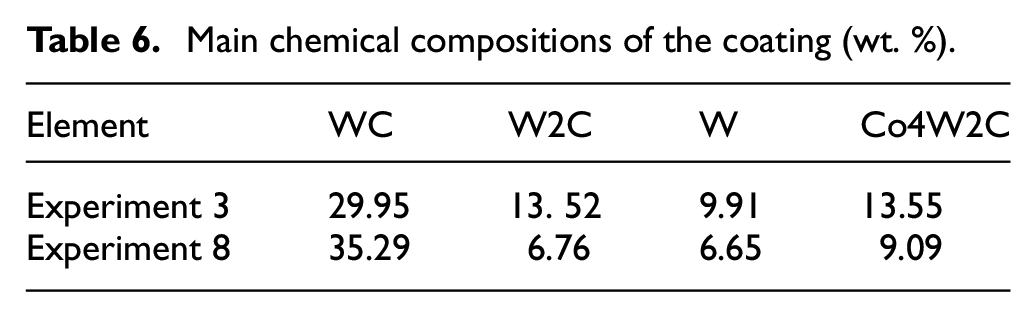
Figure 9 shows the typical phase compositions of the coating obtained using EDX line scanning. Compared with the phase compositions of the original powder, new phases were formed, such as W2C and Co4W2C, caused by the phase transformation process due to heat and also the quick cooling process of the HVOF spray. Table 6 lists the main chemical compositions of the deposition. The change in spray parameters resulted in a subsequent change in the chemical composition of the coating, as shown in Table 6.
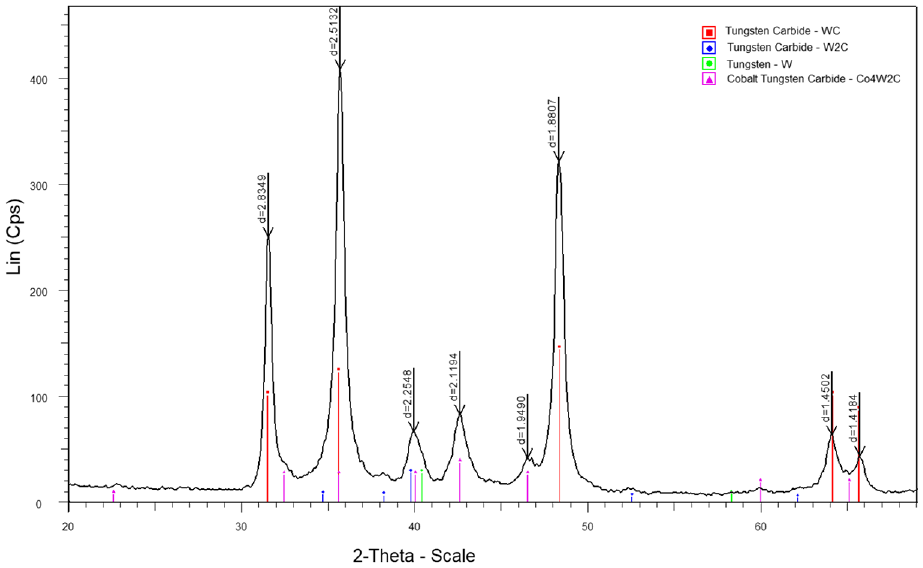
Phase composition of coating.
Main chemical compositions of the coating (wt. %).
Multi-objective optimization
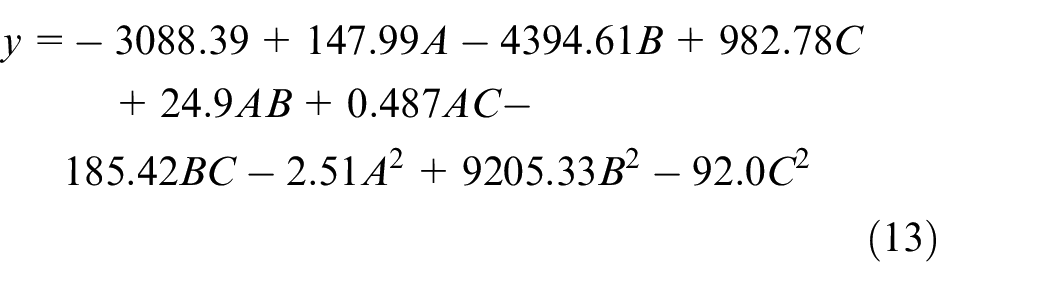
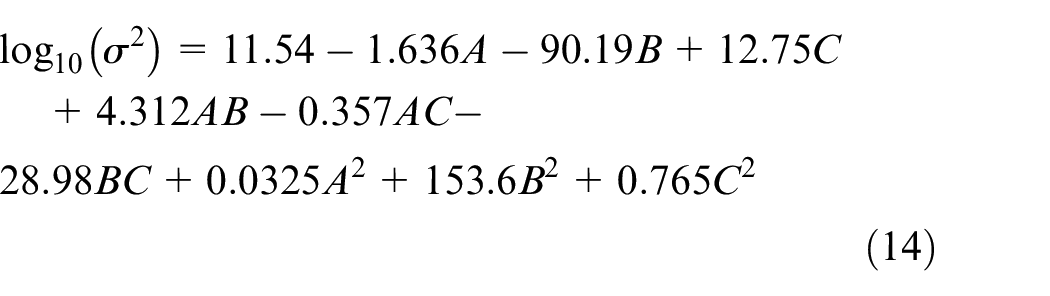
This section presents the determination of the optimal spraying parameters using the MRWSN approach. From the experimental results represented in Table 5, the regression formulae for
For the microhardness:
For the adhesion strength:
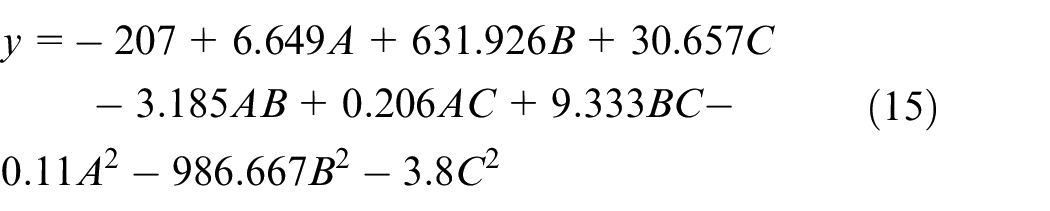
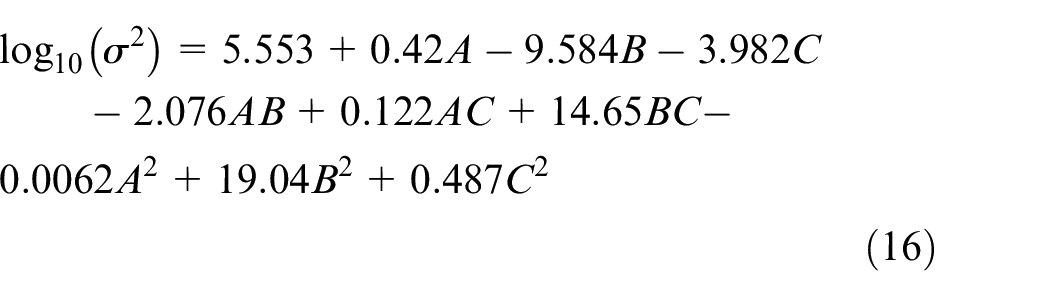
For the porosity:
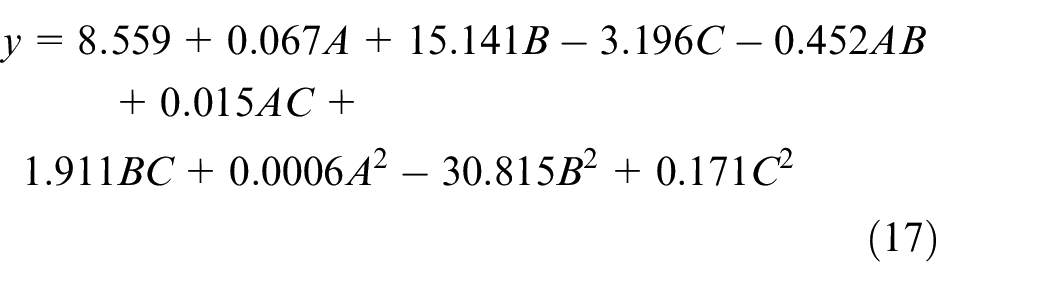
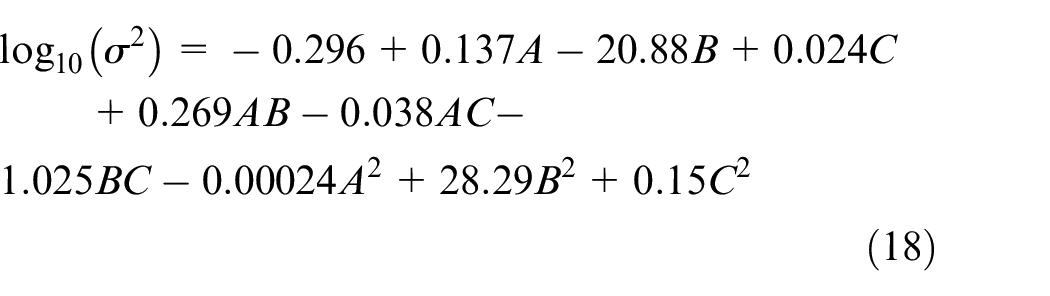
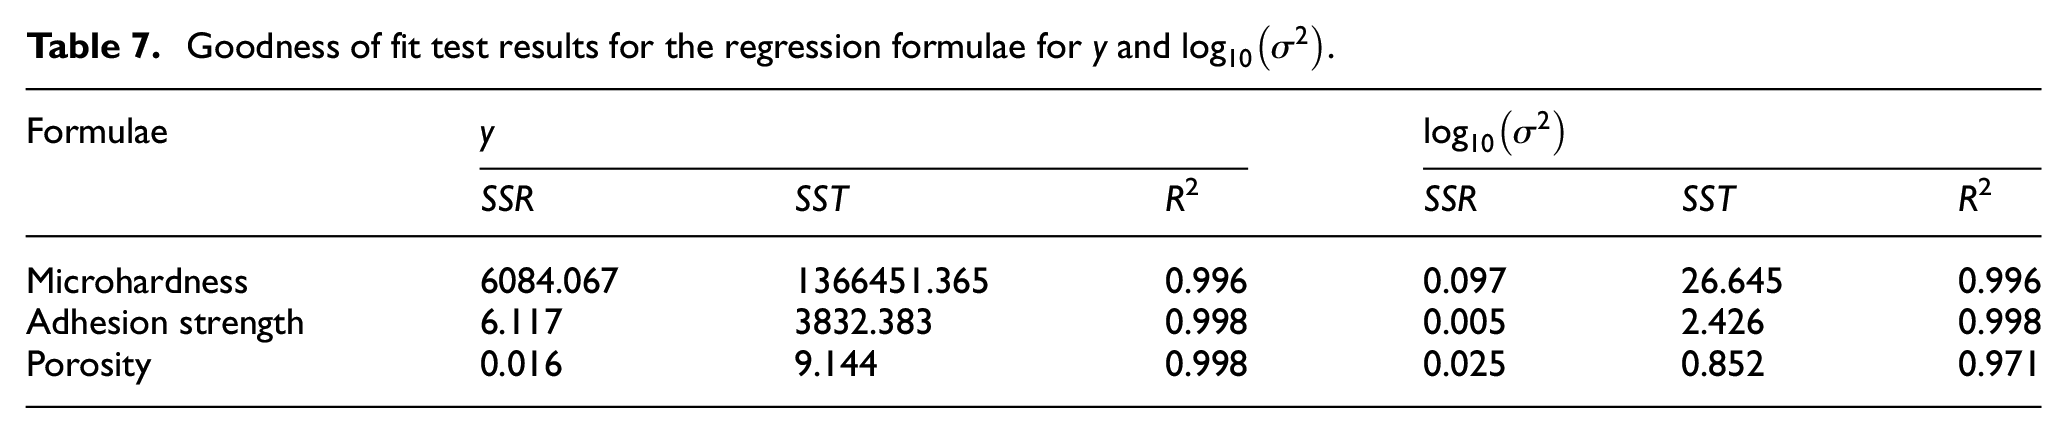
Table 7 shows the goodness of fit test results for the regression formulae (13)–(18). It can be observed that the calculated values of the coefficient of determination (
Goodness of fit test results for the regression formulae for y and
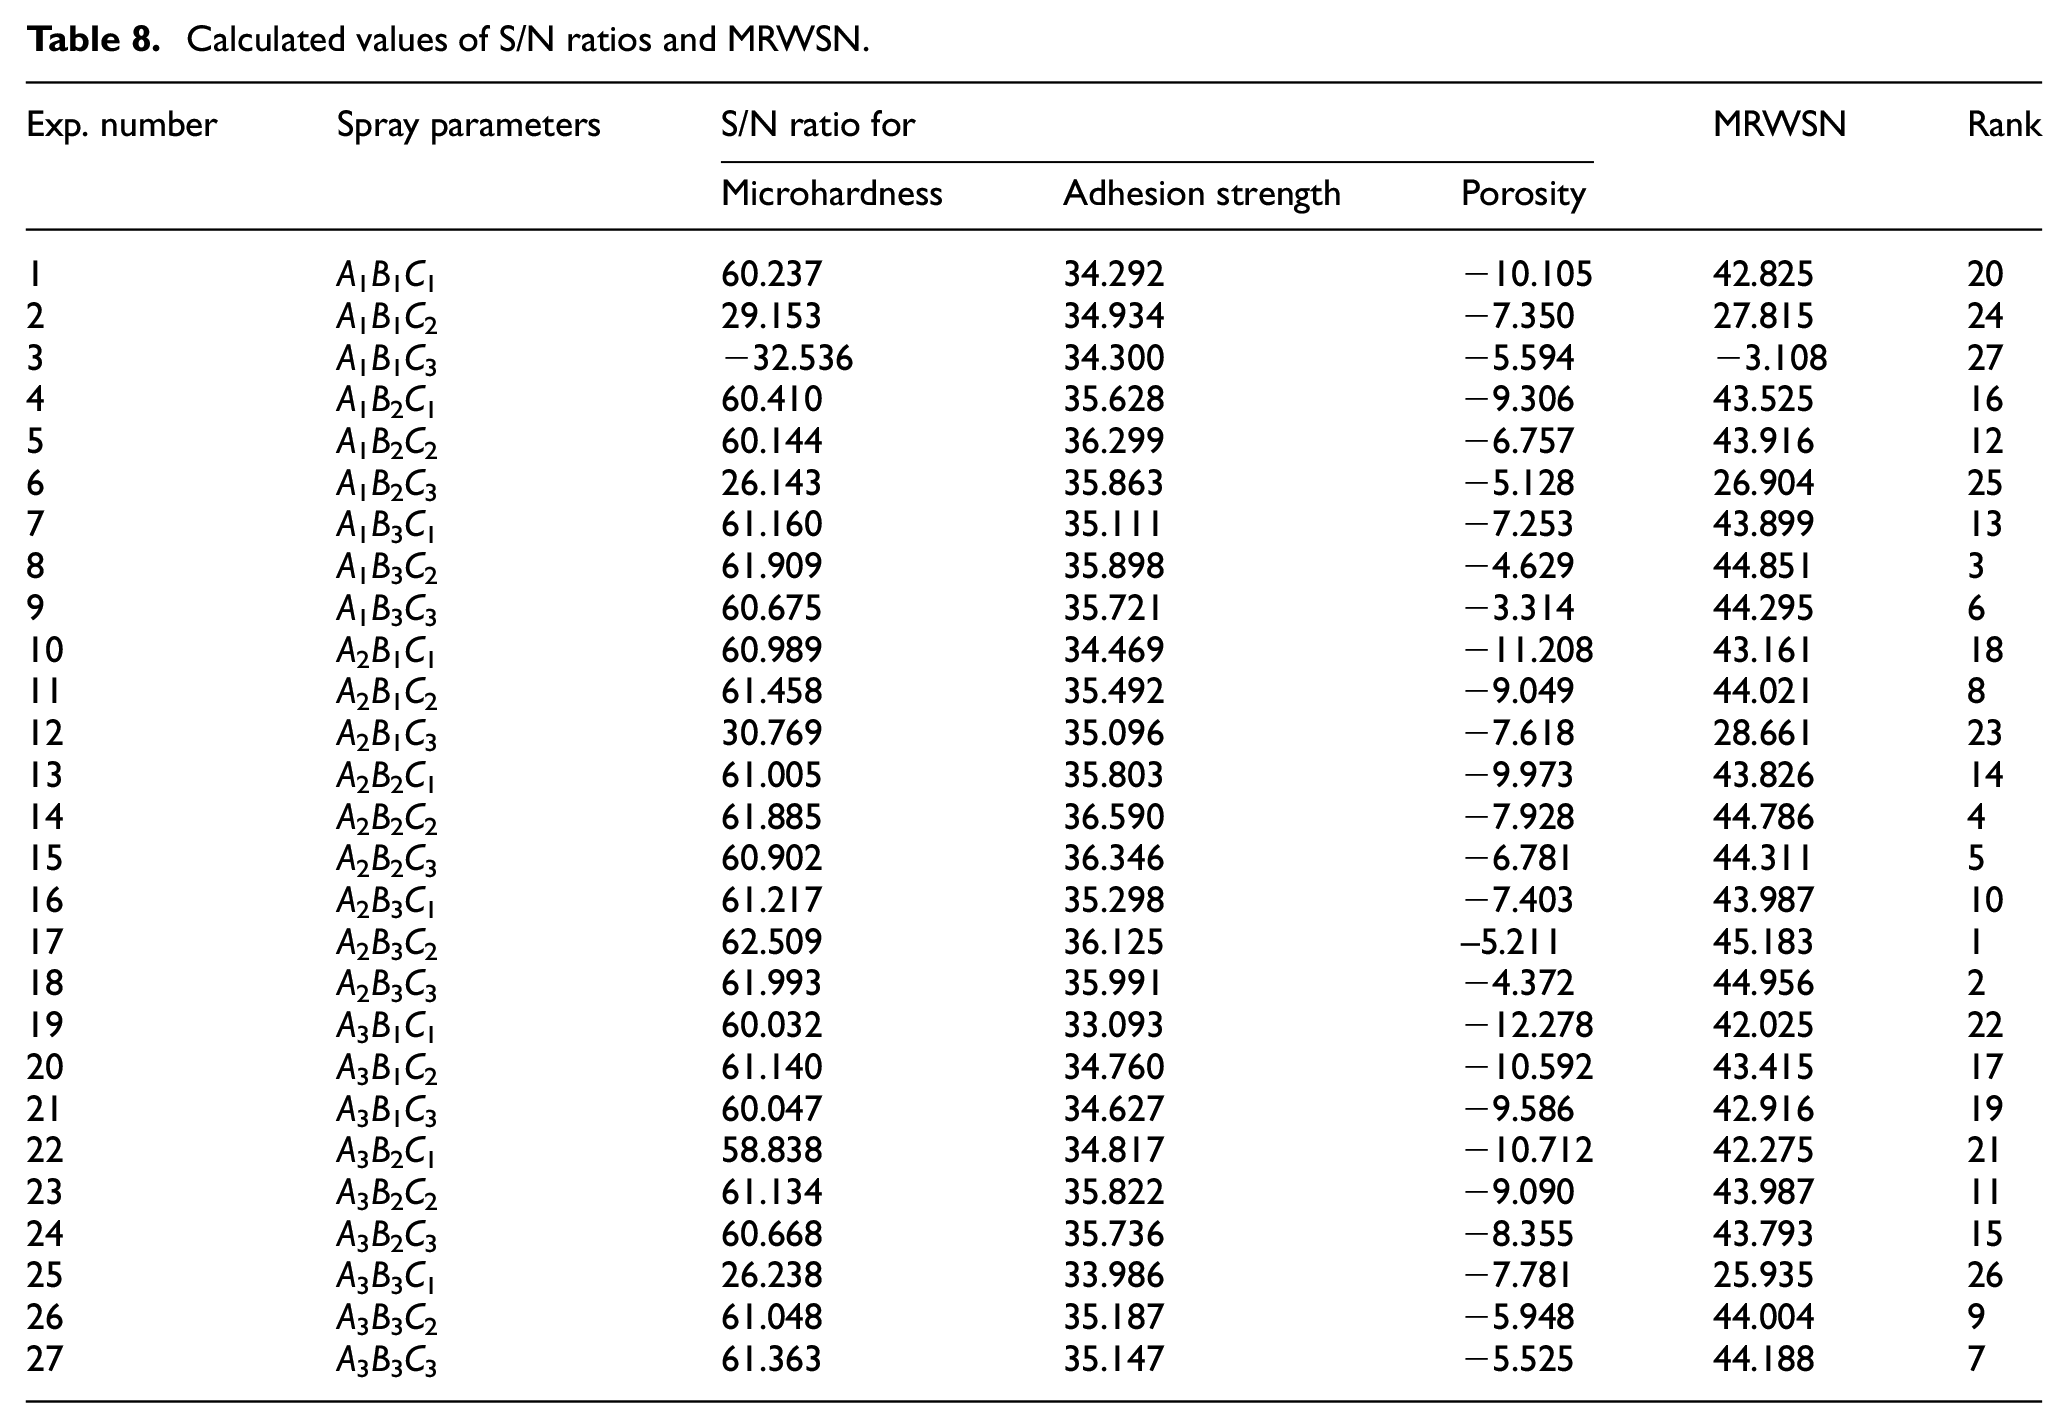
Based on the MRWSN theory, a combination of 27 sets of spray parameters were created, as shown in column 2 of Table 8. From equations (13)–(18), the
Calculated values of S/N ratios and MRWSN.
Experimental verification
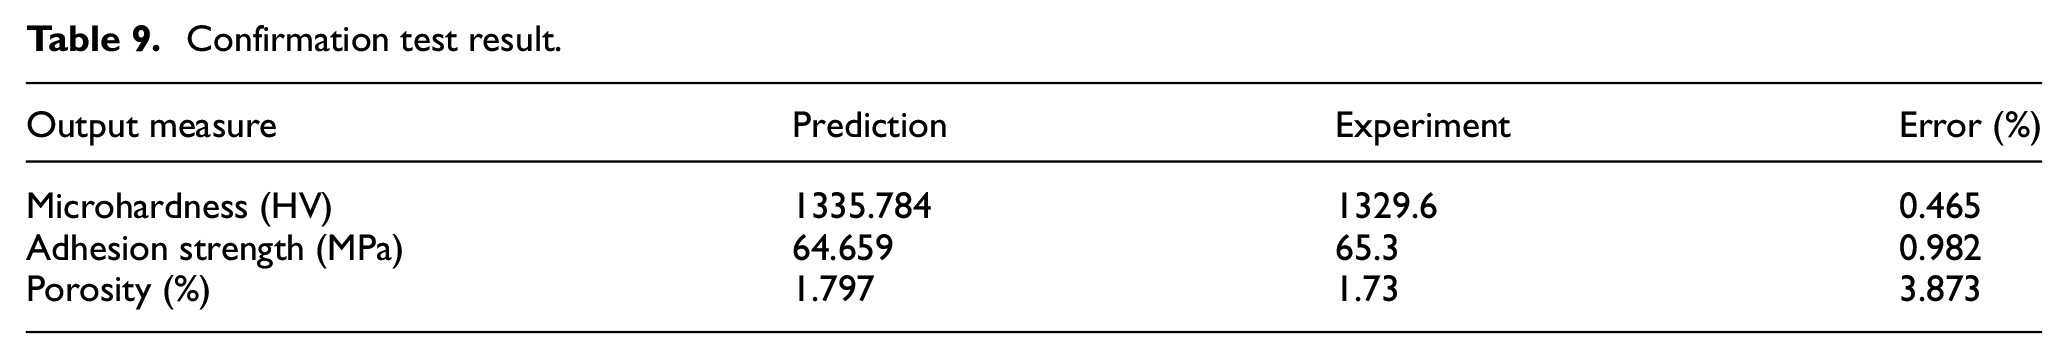
In order to verify the computed optimization results, confirmation experiments were conducted with the optimal spray parameters, A = 32 g/min, B = 0.35 m, and C = 5, that were determined using the theoretical computation. Then, the response characteristics were measured and compared to those obtained by prediction.
Table 9 shows the verification results. This table clearly shows that the measured and predicted values of microhardness, adhesion strength, and porosity are in a good agreement. The errors between measurement and prediction are smaller than 4% for all the response characteristics. Hence, the accuracy of the optimal results found using the MRWSN method was confirmed.
Confirmation test result.
ANOVA results
In this section, the ANOVA results are presented. The main objective of the ANOVA is to determine the degree of importance of a spray parameter (or factor) on each quality characteristic via a so-called “contribution percentage.” Accordingly, the most influential factor, which shows the maximum contribution percentage, can be identified.23,24
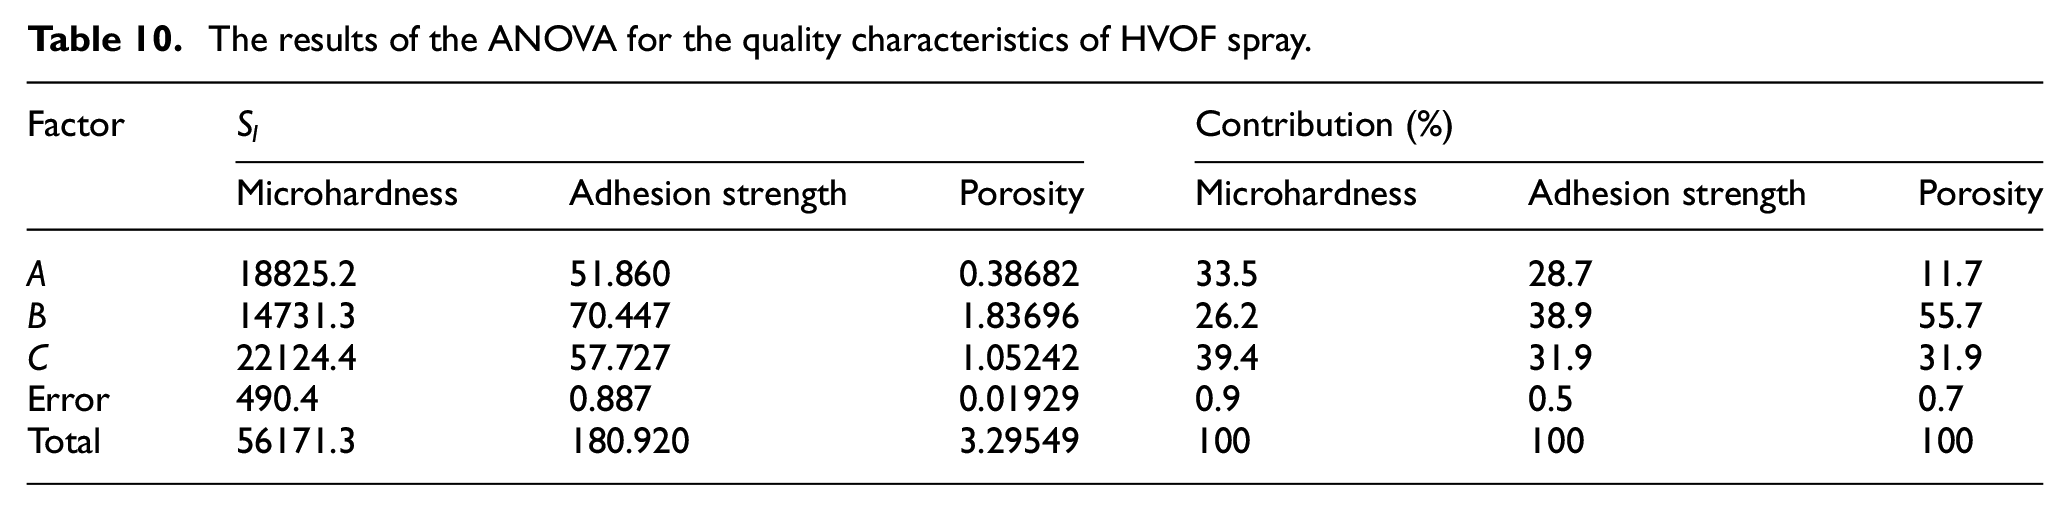
Table 10 shows the results of the ANOVA. From this table, the ratio of oxygen/propane (C) exhibits the greatest influence on the microhardness, with a contribution of 39.4%. The next greatest influences are the powder feed rate (A) and spray distance (B), with contributions of 33.5 and 26.2%, respectively. On the other hand, the most influential factor that affects the adhesion strength and porosity is the spraying distance, with a contribution of 38.9 and 55.7% respectively. The powder feed rate shows the least effect on both adhesion strength and porosity, with contribution percentages of 28.7 and 11.7%, respectively.
The results of the ANOVA for the quality characteristics of HVOF spray.
Conclusions
In this study, experiments using HVOF spray with WC-12Co powder on a 16Mn steel substrate were conducted. The microhardness, adhesion strength, and porosity of the coating were characterized. The MRWSN method was adopted to simultaneously optimize the quality characteristics. The conclusions of this paper were as follows:
The feasible working ranges of the spray parameters confirmed by the trial test were: a powder feed rate from 26 to 38 (g/min), a spray distance from 0.2 to 0.35 (m), and an oxygen/propane ratio from 4 to 6.
The regression formulae for the three coating characteristics were found. Good results for the goodness of fit tests for the formulae were confirmed with all coefficients of determination (R2) > 0.97.
The optimal conditions of the HVOF spray were identified: powder feed rate A = 32 g/min, spray distance B = 0.35 m, and oxygen/propane ratio C = 5. The output measures predicted for the optimal spray parameters were microhardness = 1335.784 HV, adhesion strength = 64.659 MPa, and porosity = 1.797%, which agreed well with the measured results of the confirmation experiments, with errors less than 4%.
The ANOVA results showed the individual contributions of the spray parameters to the output coating characteristics. The oxygen/propane ratio showed the highest contribution to the microhardness, whereas the most influential factor for both adhesion strength and porosity was the spraying distance.
Footnotes
Declaration of conflicting interests
The author(s) declared no potential conflicts of interest with respect to the research, authorship, and/or publication of this article.
Funding
The author(s) disclosed receipt of the following financial support for the research, authorship, and/or publication of this article: This work was supported by the Ministry of Education and Training, Vietnam (Grant No. B2021-SKH-02)