
Abstract
To clarify the effects of deep rolling parameters on residual stress, two-dimensional and three-dimensional finite element models were developed using the Chaboche hardening model. Both two-dimensional and three-dimensional simulation results were compared with experimental results. The three-dimensional model is more accurate, especially the 90° cut-out model. The maximum errors in the longitudinal and circumferential directions of 90° cut-out are 8.9% and 15.6%, respectively. Compared to 20 MPa, a rolling pressure of 38 MPa results in larger and deeper compressive residual stress in both directions, but lower surface residual stress in the circumferential direction. Compared to 30% overlap, 60% overlap produces larger compressive residual stress in the near surface region in the longitudinal direction and deeper residual stress with lower maximum compressive residual stress in the circumferential direction. The friction coefficient only slightly affects residual stress in the circumferential direction; increasing the rolling speed induces higher near surface residual stress in the circumferential direction. Compared to the HG6 tool, the HG8 tool generates decreasing surface residual stresses and deeper residual stress in both directions. Compared to one pass, two passes significantly increase the residual stress in circumferential direction, but only slightly increase the residual stress in the longitudinal direction.
Keywords
Introduction
Due to its excellent mechanical properties, Ti-6Al-4V is widely used in the aerospace industry. To further improve the service performance of Ti-6Al-4V components, mechanical surface treatment technologies, such as shot peening and laser shot peening, have been used to enhance the surface properties. These process technologies can induce compressive residual stresses and work hardening in the near surface region to prevent crack initiation and propagation. However, the high surface roughness after peening will increase the stress concentration and promote crack initiation. Compared to shot peening and laser shot peening, deep rolling produces deeper and higher compressive residual stresses with lower surface roughness. Deep rolling process parameters, such as rolling pressure, feed rate, and number of passes, have a significant effect on the subsurface layer properties. Understanding the effect of these process parameters on surface integrity is critical to improving fatigue performance of the components.
As we all know, residual stress has an important influence on fatigue behavior. Hence, the effect of deep rolling process parameters on residual stress has been the topic of many investigations. Alshareef et al. 1 studied the effect of ball burnishing parameters on the residual stress; their results show that burnishing pressure has the greatest effect, and residual stress increases with the feed rate. Beghini et al. 2 studied the effect of the rolling pressure and the feed rate on the residual stress. They found that the depth of the compressive region increases with the rolling force, and the maximum stress position also tends to be subsurface. However, the feed rate does not produce any effect at large depth, and only the initial subsurface distribution is slightly influenced. Nguyen and Le 3 found that an increase in burnishing feed results in a decrease in residual stress in both the axial and tangential directions, and an increase in the depth of penetration leads to an increase in residual stresses. El-Axir 4 investigated the effect of the ball burnishing parameters on the residual stress and found that at low speeds, an increase in the burnishing force leads to an increase in the maximum compressive residual stress. However, at high speeds, the maximum compressive residual stress decreases with increasing burnishing force. Nagarajan et al. 5 investigated the influence of ball diameter on residual stress and found that a larger ball diameter generates the higher and deeper compressive residual stress with surface stress reduction. By single factor experiments, Yuan et al. 6 found that the residual stress of TA2 increases with increasing rolling pressure and decreasing rolling speed.
As described above, the residual stress distribution of the deep rolling process is influenced by many factors. To accurately predict the residual stress profile requires a model to be built. Only a few publications have focused on finite element (FE) simulation of residual stresses produced in the deep rolling process. Klocke et al. 7 established an FE model of roller burnishing to quantitatively predict the induced residual stress. The model was verified by the roller burnishing test with different parameters and materials. Hadadian and Sedaghati 8 adopted the Johnson–Cook constitutive model to develop a model of deep rolling process between a ball and a plate for investigating the thermal relaxation of residual stress. Uddin et al. 9 developed a three-dimensional (3D) FE model of ball burnishing between a ball and a plate using Johnson–Cook constitutive model, and the investigation of the influence of process parameters on the surface integrity was carried out. John et al. 10 investigated the ball burnishing process on computer numerical control (CNC) lathe by two-dimensional (2D) FE model with Johnson–Cook constitutive model, and the effect of process parameters on the roughness and residual stress were investigated. Zhang et al. 11 established a 3D model of the roller burnishing process between a roller and a plate using an exponential hardening model. Hassani-Gangaraj et al. 12 investigated the influence of rolling force and feed rate on the residual stress through a 3D FE model composed of a roll and a block. In the model, a cyclic stress–strain curve obtained by extrapolating tensile–compression test data was used as the material model. FE modeling can deal efficiently with the deep rolling problem. While many researchers have studied the deep rolling process with the FE method, most have developed the model between a ball and a plate using the Johnson–Cook constitutive model. Few have developed a 3D model between a ball and a cylinder using other material models such as the Chaboche constitutive model. To our knowledge, the Chaboche model has not been used as the material model of Ti-6Al-4V to simulate the deep rolling process. The size effect has also not been analyzed in the publications. Publications have merely described how the residual stress changes with different process parameters, and few have explained why residual stress has different changes depending on the direction with the change in deep rolling parameters.
This article builds a 3D FE model of the deep rolling process that can accurately predict the residual stress distribution along the depth after deep rolling of Ti-6Al-4V. The material model is the Chaboche model. The calculation of Ti-6Al-4V Chaboche material model parameters based on uniaxial monotonic test data is described. The 3D model is compared to a 2D model to prove its advantages, and the size effect is investigated. The effects of deep rolling parameters on the residual stress profile of Ti-6Al-4V are investigated through the 3D model, and the changes in the residual stress profile in different directions are explained by related theory.
Chaboche hardening model
Uniaxial monotonic loading test
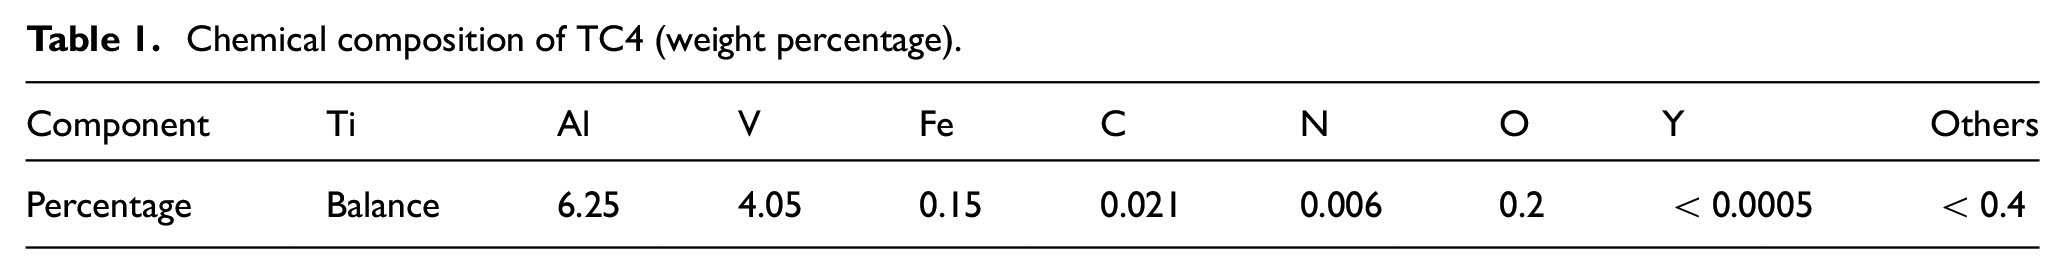
The uniaxial test data from Lim et al. 13 are used in this article. The material used in the uniaxial compression test is Ti-6Al-4V, and its chemical composition is listed in Table 1. The test sample is a solid cylinder manufactured from the stock used in the deep rolling experiment. The Young’s modulus and Poisson’s ratio of the material are 113.8 GPa and 0.342, respectively. The compression test data are plotted in Figure 1.
Chemical composition of TC4 (weight percentage).
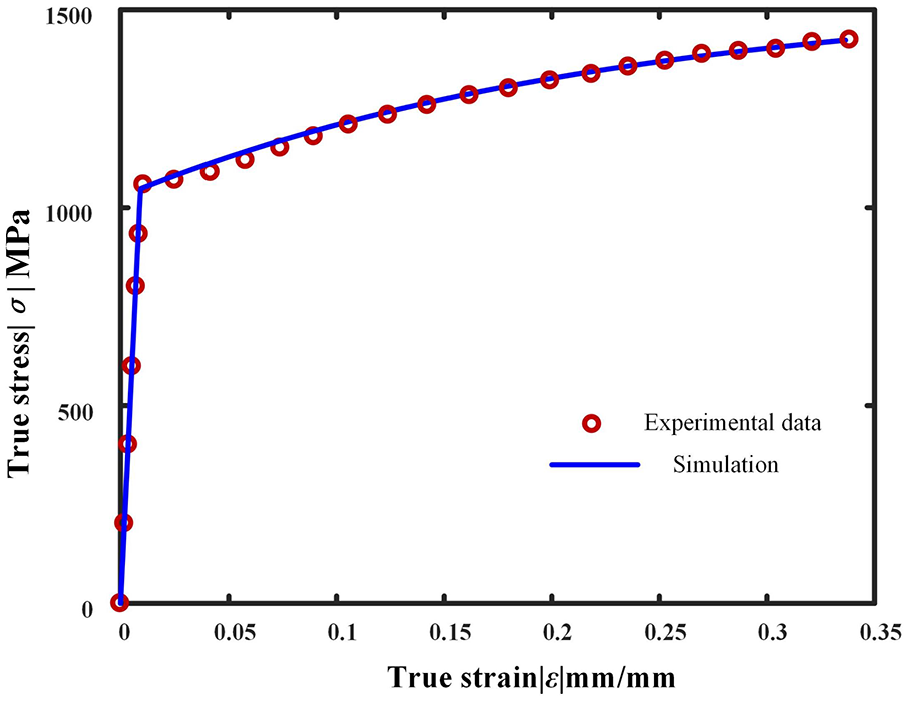
Comparison of experimental data and simulation results.
Parameter determination of Chaboche hardening model
The Chaboche hardening model is based on the von Mises yield criteria

where s is the deviatoric stress tensor, a is the deviatoric back stress tensor, and σ0 is the yield stress. The Chaboche nonlinear kinematic hardening material model was adopted in the deep rolling modeling. The back stress was decomposed into several components in the model, which can be defined by equation (2) 14
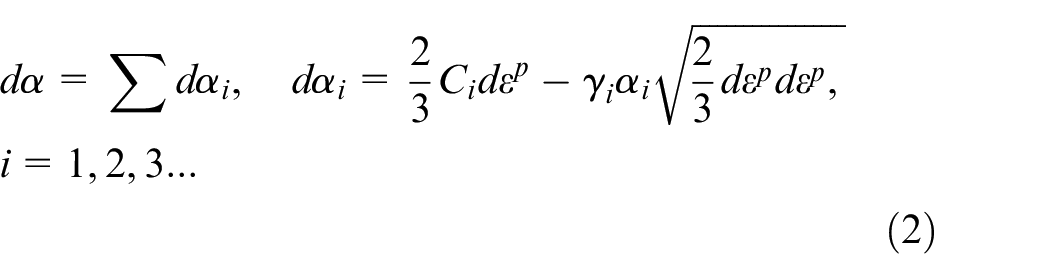
where α is the back stress, αi is the back stress component, Ci and γi are the parameters to be identified, and dεp is the plastic strain increment.
Equation (2) is a first-order inhomogeneous linear differential equation. In the uniaxial cycle loading condition, we solve it to obtain
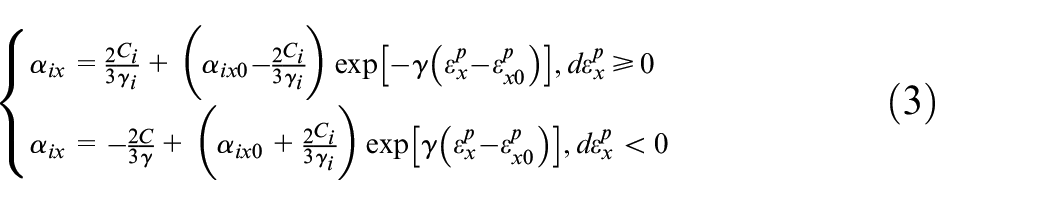
Two nonlinear components and one linear component are enough to precisely predict the material properties. 15 As only uniaxial monotonic test data are used in this work, we can simplify equation (3) to

There are five independent variables in equation (4), so it is better solved by a genetic algorithm. The input is the uniaxial monotonic test data, and the output is the values of the five variables. The fitness function is expressed as
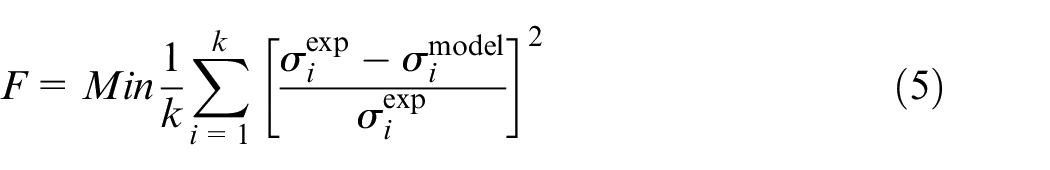
where
The maximum number of iterations of the genetic algorithm is 10,000. The obtained parameters of the Chaboche hardening model are listed in Table 2. The nonlinear kinematic hardening model was verified in Abaqus 6.13. As shown in Figure 2, the quarter symmetry boundary conditions were applied on a single element, and the compression loading was the same as in the uniaxial compression test. The predicted results are shown in Figure 1, which clearly shows that the predicted stress–strain response agrees well with the experimental results.
Chaboche model parameters.
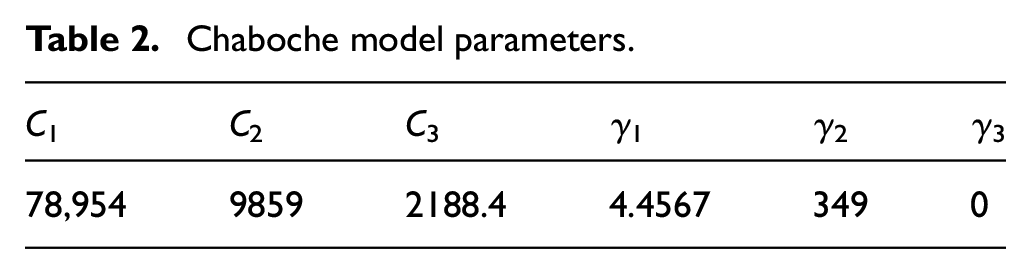
Schematic of uniaxial test simulation.
FE modeling of deep rolling
The 2D FE model
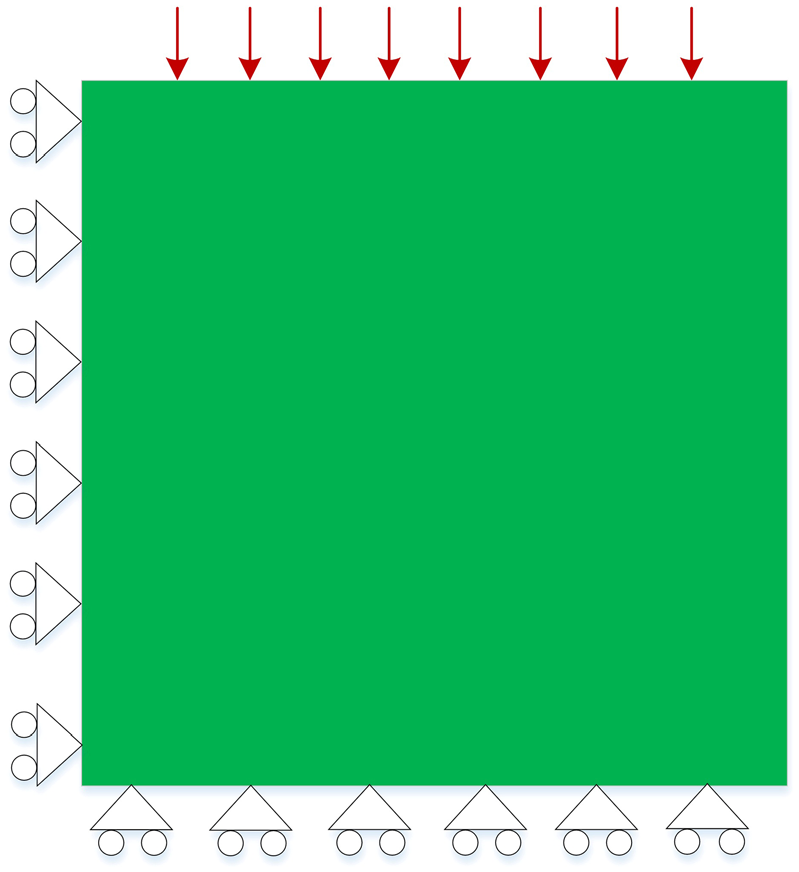
As shown in Figure 3, during deep rolling, a mechanically or hydraulically controlled ball or roller exerts a specific pressure on the surface of a rotating component, causing plastic deformation in the near surface region. The Abaqus standard was adopted for the 2D simulation of the deep rolling process. The ball was considered an analytical rigid body. A 12 × 4.5 mm2 part of the cross section along the longitudinal direction of the specimen, as shown in Figure 4(a), was considered to build the 2D model. The element type of the specimen was CPE8R. The mesh near the surface was refined to 0.1 × 0.1 mm2 with 3000 elements, to increase the accuracy of the simulation results.
Schematic of deep rolling process.
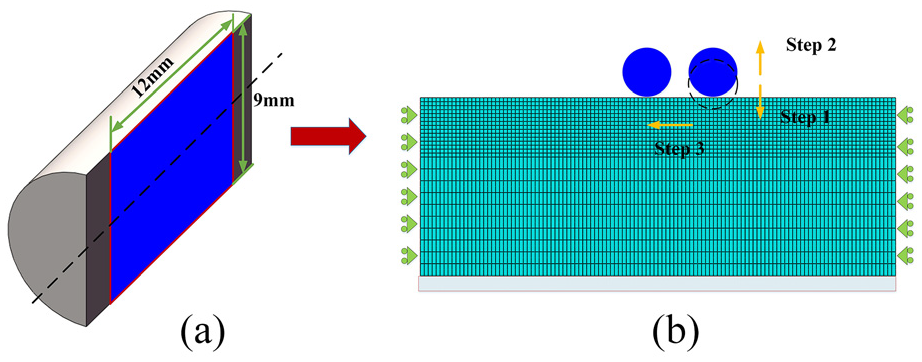
(a) Cross section for 2D modeling and (b) boundary conditions of 2D model.
Figure 4(b) displays the boundary conditions of the 2D model. The bottom of the specimen was fixed and the horizontal displacement of the two lateral edges was limited. In addition, as can be seen from Figure 4(b), the movement of the ball was composed of three parts: penetration of the ball, unloading of the ball, and movement along the surface of the specimen after unloading. Compared to the 3D model in section “The 3D FE model,” the rotating of the ball around the specimen was neglected. Finally, a static spring back analysis was performed to obtain the residual stresses.
The 3D FE model
In the 3D condition, the quasistatic simulation was conducted for the deep rolling process, as shown in Figure 3. The explicit solver is more efficient with quasistatic problems with nonlinear contact. The deep rolling process was modified to facilitate the simulation setup and reduce time consumption. The tool rotated around a fixed specimen. The computational time of the model can be reduced by mass scaling, which must be set to control the ratio between kinematic energy and internal energy. 16 The target time increment was set to 5e–6 in the step module through trial and error. To further reduce the computational time, only a quarter of the specimen was used to model the deep rolling process, the ball was considered a discrete rigid body, and a hole was added to the model. To improve the accuracy of the results, the significantly affected region had a finer mesh.
The specimen in the model measured 12 mm in the axial direction and 3 mm in the radial direction. The higher density mesh size at the center of the specimen changed with the depth. The smallest mesh was 0.1 × 0.1 × 0.2 mm3 on the surface layer of the specimen. A structured technique was used to generate the mesh, and the element type of the deformable specimen was C3D8R with hourglass control. The number of elements of the deformable specimen was 195,090. The ball diameter was 6.35 m. A sweep technique was used for mesh generation of the ball, with element R3D4.
The boundary conditions of the model are illustrated in Figure 5. The hole surface and two lateral faces were fixed, and the other two faces were treated as symmetric planes. The ball movement was divided into four parts: indentation of the ball under the rolling force, rotation around the specimen, rotation around the ball’s own axis, and movement along the axial direction of the specimen. The kinematics of the ball can be realized through three connectors, 17 as illustrated in Figure 6. The first connector, C1, is multi-point constraint of pin type between reference point RP of the ball and RP1 coinciding with reference point RP. The second connector, C2, is a revolution connector between RP1 and RP. The third connector, C3, is a translator connector between reference point RP2 of the cylinder and RP1. The connectors among the reference points can be realized through the connector elements in the interaction module. The rolling force was calculated as 10

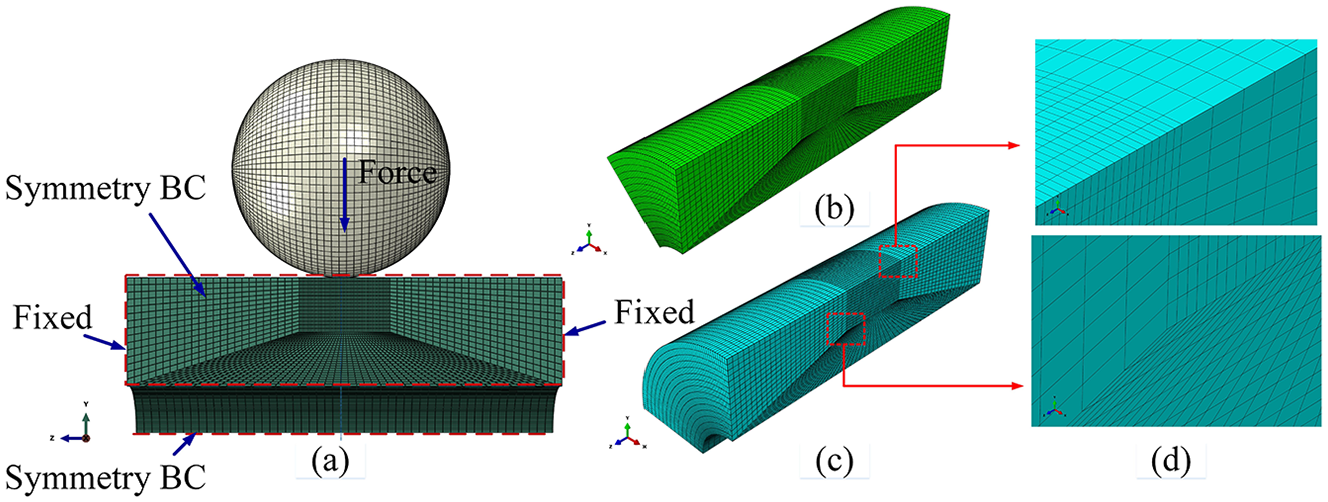
A 3D model of deep rolling: (a) boundary conditions of the model, (b) 45° cut-out, (c) 90° cut-out and (d) detail of refined mesh.
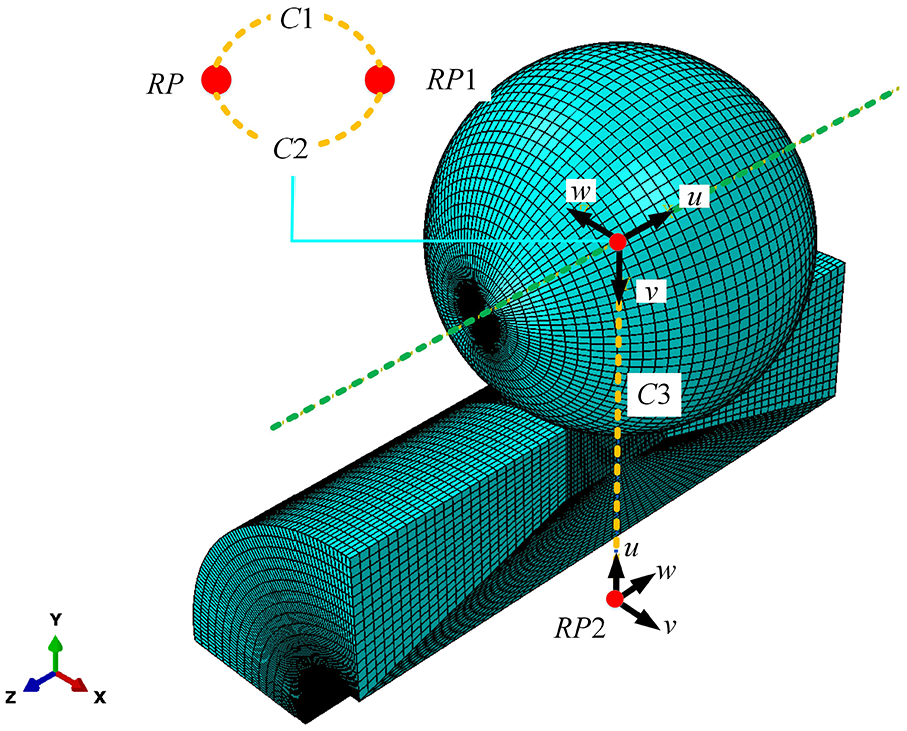
Diagram of three connectors.
where F is the normal force exerted by the tool on the component surface, P is the hydrostatic pressure, and Db is the ball diameter. It was applied on connector C3 along the u direction of the local coordinate system.
The parameters were set the same to compare the simulation results to the experimental results. The deep rolling parameters used to validate the FE model are listed in Table 3. The calculated rolling force is 1202 N. The ball’s rotating speed can be calculated based on the specimen, from which the step time for the rolling process also must be calculated. These two parameters are calculated as 5.2 rad/s and 0.3 s, respectively. It is worth noting that the rolling force should be set to zero at the end of the simulation to avoid high stresses at the edge of the specimen. Surface-to-surface contact was adopted, and the penalty contact method and finite sliding were selected as the mechanical constraint formulation and sliding formulation, respectively. The penalty friction formulation was selected in the FE model, and the friction coefficient was assumed to be 0.2 because its effect on the simulation is negligible. 13
Deep rolling parameters used to verify the FE model.
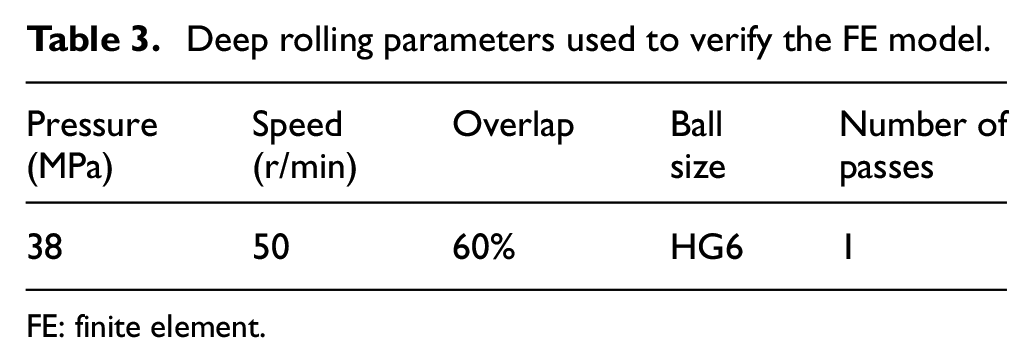
FE: finite element.
The feed rate was modeled as the ball moved at a distance equal to the value of the feed rate along the longitudinal direction. The deep rolling process simulation composed of several dynamic explicit simulations with different starting positions of the ball. The stress and strain results of each simulation were imported into the next simulation as the initial state. At the end, a general static spring back analysis was conducted to relax the stresses of the last explicit simulation.
Deep rolling experiment
The deep rolling part of the material was manufactured by turning, and the influence layer induced by turning was removed by polishing. The deep rolling tool of Ecoroll Company was used in the experiment. The tool was mounted on the tool holder of a CNC lathe with a SIEMNES controller. The material was manufactured to different parameters according to different conditions, as illustrated in Figure 7. Surface roughness was measured using a contact-type surface profiler (MarSurf XT 20, Mahr, Germany). The pressure of the ball was supplied by the hydraulic pump device HGP 6.5, which can provide maximum pressure of 40 MPa. Residual stress was measured by an x-ray stress analyzer (LXRD MG2000, Proto, Canada) using the sin2ψ-method. To obtain the residual stress values at different depths, the thin top layers of the measurement point were removed by electrolytic polishing. Subsequently, the residual stresses on the new surface of the point were measured along both the rolling and feed rate directions. The removed layer was up to the depth where residual stresses remained at a steady level.
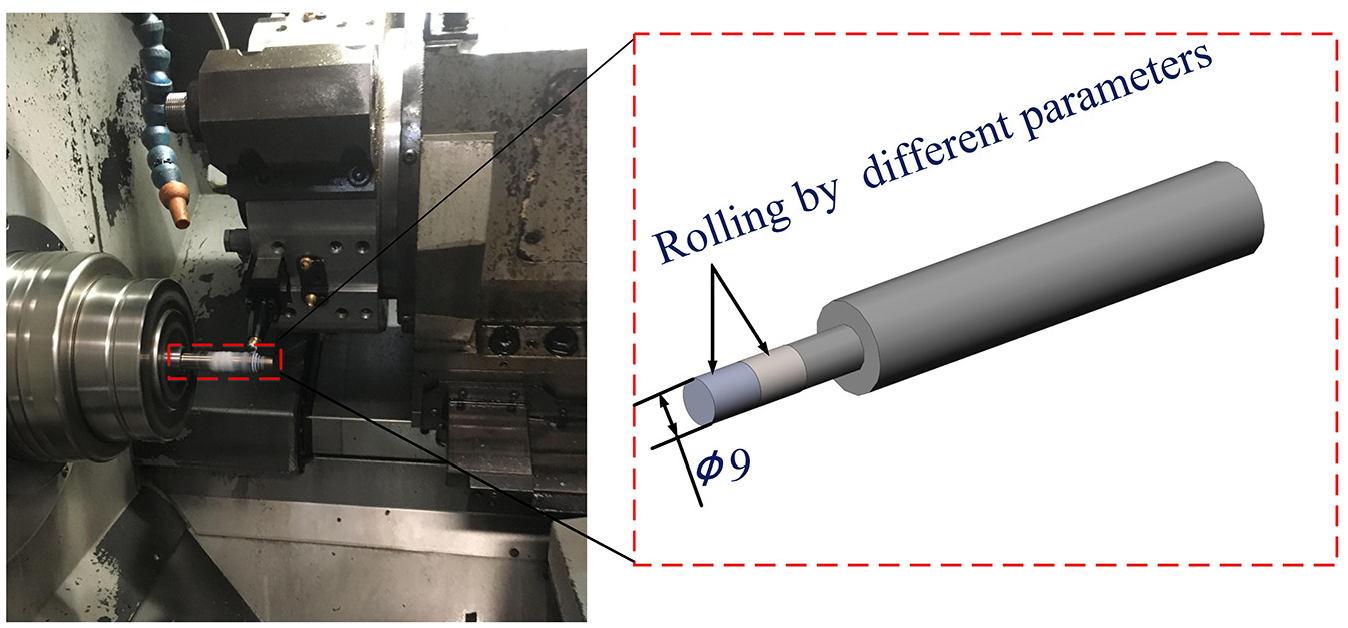
Deep rolling process.
Verification of the FE simulation
The 2D FE simulation
Node paths were established to extract the residual stress value obtained in the final step. The residual stress value at a specific depth is the average value of nodes between A and B, as shown in Figure 8(a). The residual stress distribution along the depth is illustrated in Figure 9, which shows that the residual stress profile of the 2D simulation is similar to that of the experimental results, but there is a large error between the values of residual stress at a specific depth, which is not acceptable.
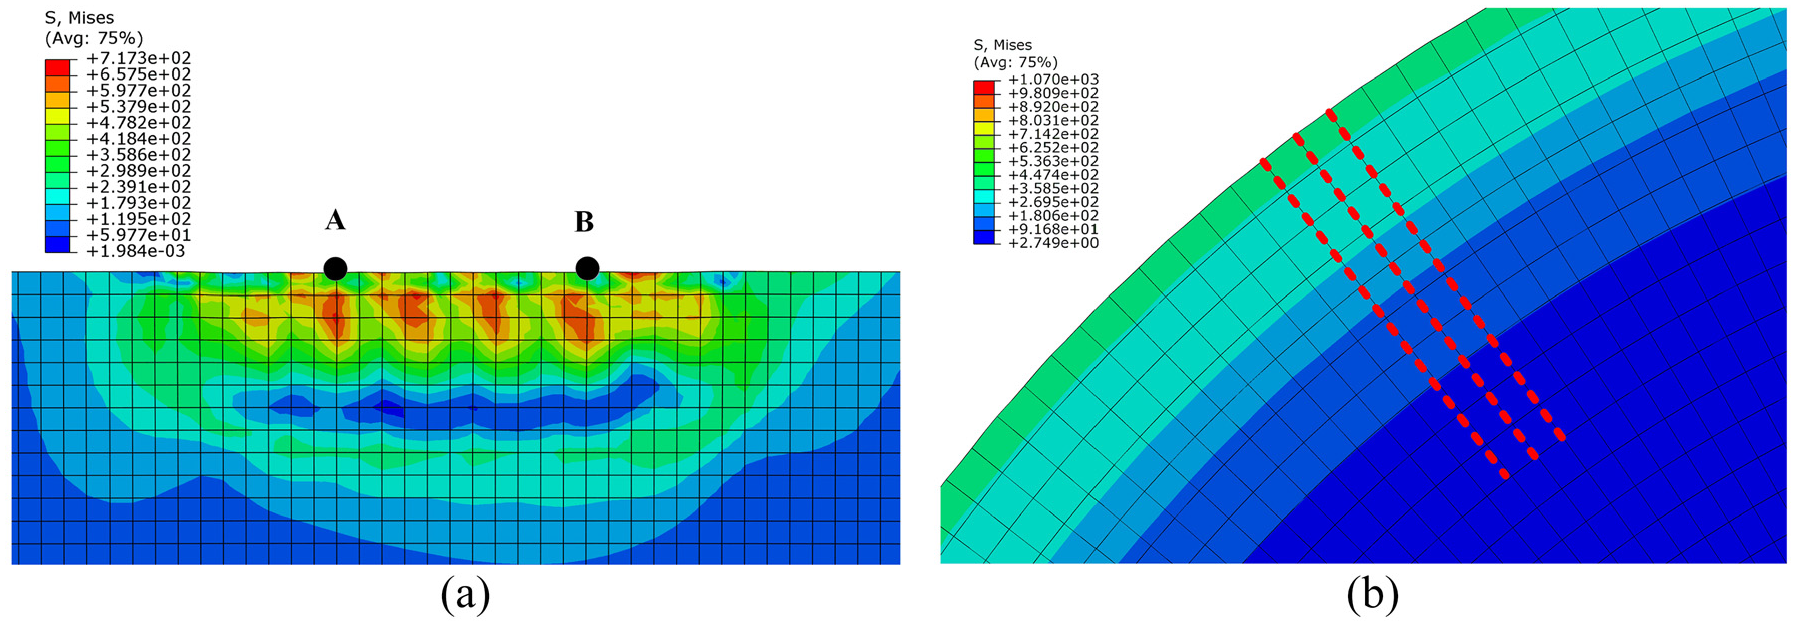
Selected nodes: (a) 2D model and (b) 3D model.
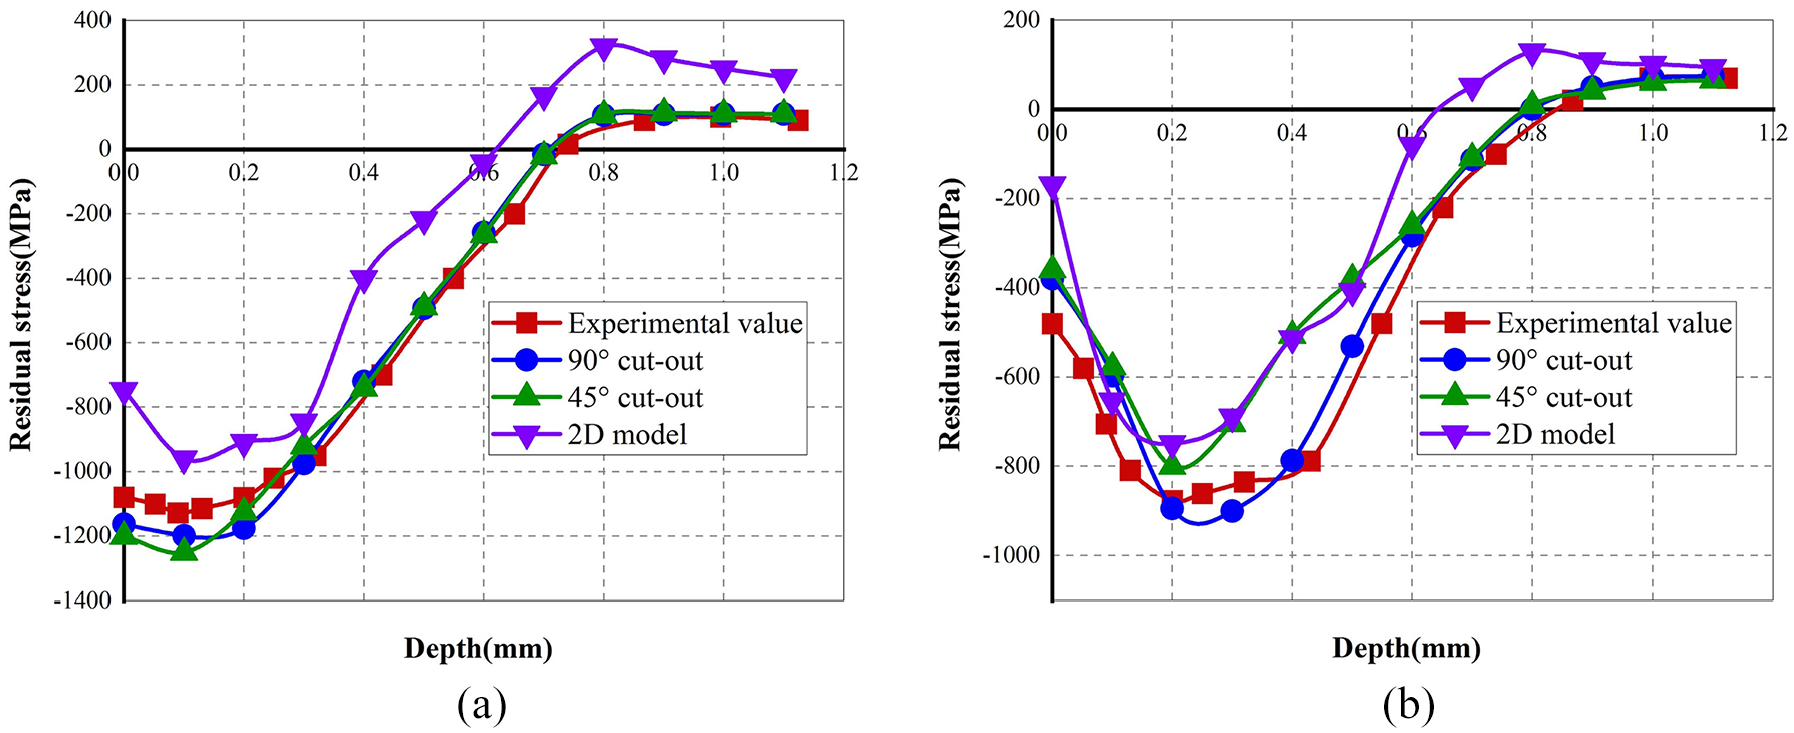
Comparison between experimental value and FE simulation results: (a) longitudinal direction and (b) circumferential direction.
The 3D FE simulation
In the 3D condition, deep rolling simulation was performed on two cut-outs for comparison and to get more accurate simulation results. The two cut-outs were the same except for the angle in the circumferential direction. Node paths were established in the middle section of the cylinder to extract the residual stress value obtained in the final step. The residual stress distribution along the depth is plotted as an average value of nodes at different depths in Figure 8(b).
The simulation results of residual stress distribution along the depth of two cut-outs are illustrated in Figure 9, from which it is seen that the simulation results of two cut-outs agree well with the experimental values. However, in the depth range of 0.2–0.5 mm, the residual stress profile in the circumferential direction of the 45° cut-out has a relatively large error compared to the experimental value. This is caused by the limited size of the cut-out in the circumferential direction. The residual stress profile in both directions of the 90° cut-out model agrees well with the experimental values across the entire depth beneath the surface. The maximum errors in the longitudinal and circumferential directions between the experimental and predicted profiles for the 90° cut-out are 8.9% and 15.6%, respectively. This means that the size of the 90° cut-out not only in the longitudinal direction but also in the circumferential direction is appropriate for deep rolling simulation. Therefore, the 90° cut-out 3D FE model will be used to investigate the effect of deep rolling parameters on the residual stress distribution along the depth.
Results and discussion
Effect of deep rolling pressure
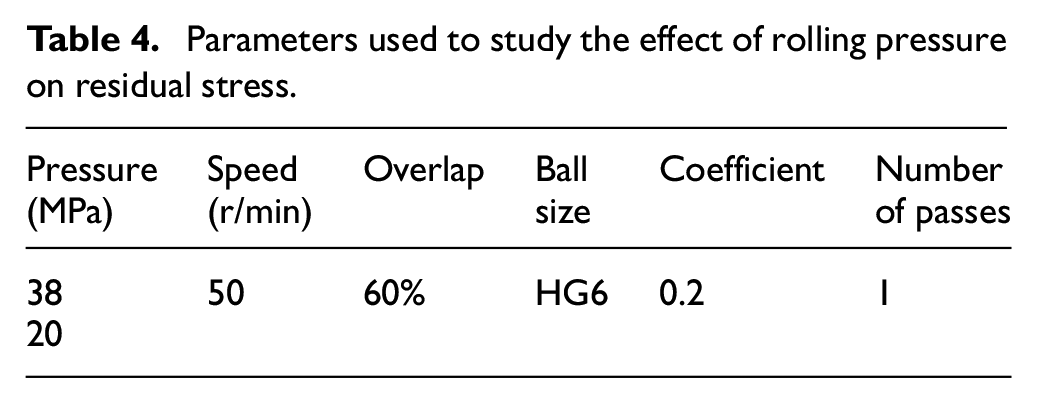
To study the influence of deep rolling pressure on residual stress, as listed in Table 4, the deep rolling pressure was varied between 38 and 20 MPa and the other parameters were kept constant. The influence of deep rolling pressure on residual stress is shown in Figure 10. As seen in Figure 10(a), the higher rolling force results in larger and deeper compressive residual stress in the longitudinal direction. Identical conclusions were obtained by Abrão et al. 18 This phenomenon can be explained by the following equation (7), 19 from which it can be inferred that the growth rate of the contact area cannot keep up with the pressure growth rate, resulting in greater pressure on the contact surface. Thus, the material will experience greater plastic strain, eventually leading to increased residual stress
Parameters used to study the effect of rolling pressure on residual stress.

where
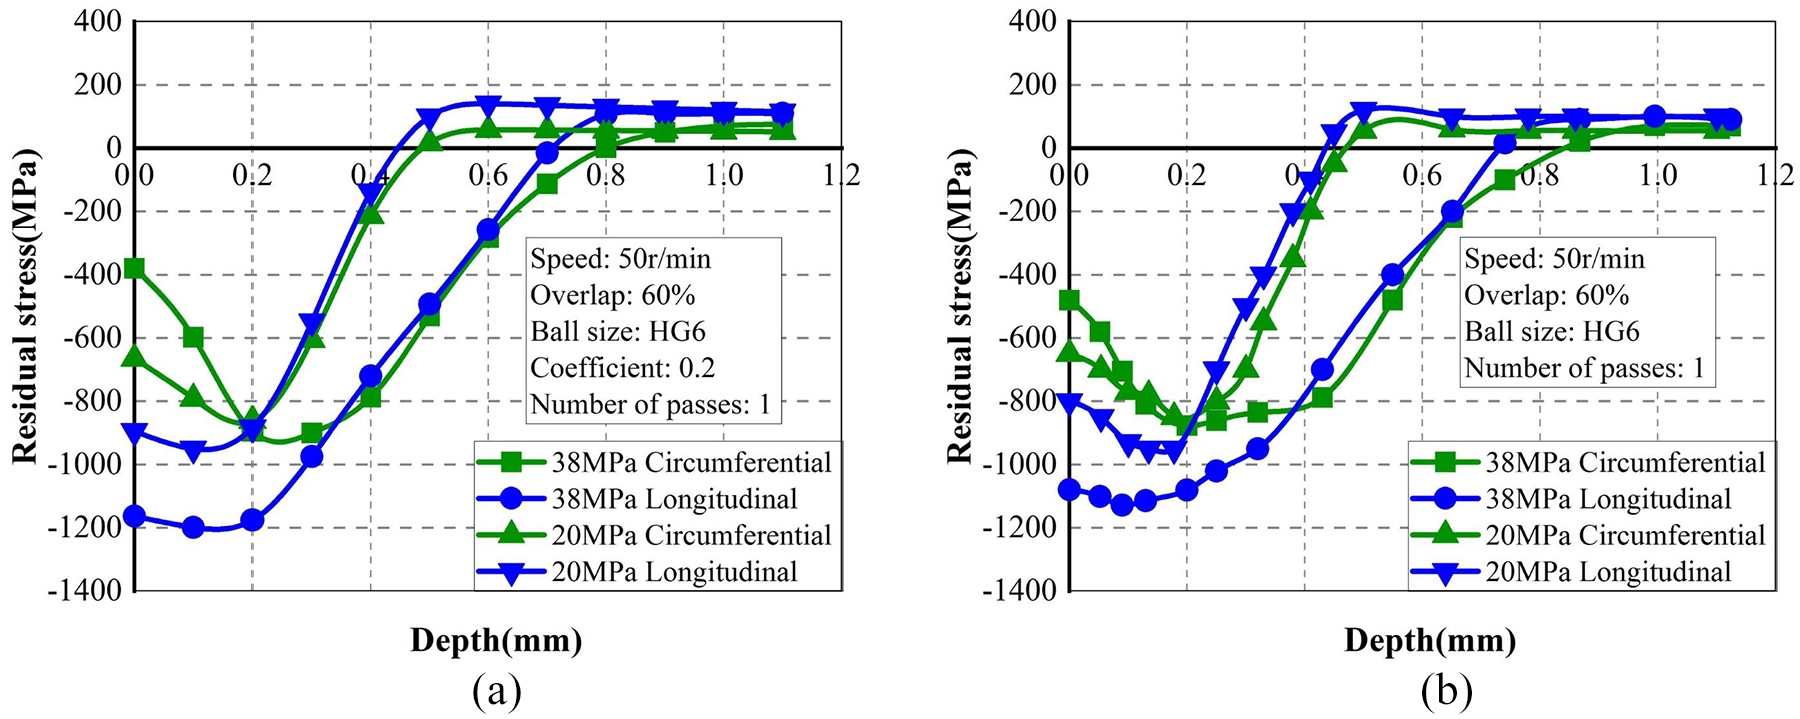
Effect of rolling pressure on the residual stress: (a) simulation results and (b) experimental results.
Although deeper compressive residual stress is induced by increasing deep rolling pressure in the circumferential direction, lower residual stress is obtained in the depth range from 0 to 200 μm. It is also interesting that, in most cases, the position of maximum of residual stresses tends to be subsurface, as seen in many other publications.3,8 An experiment was also carried out to verify the reliability of the simulation results. The experimental results are shown in Figure 10(b) and it is obvious that the FE simulation is consistent with experimental observation.
Effect of overlap
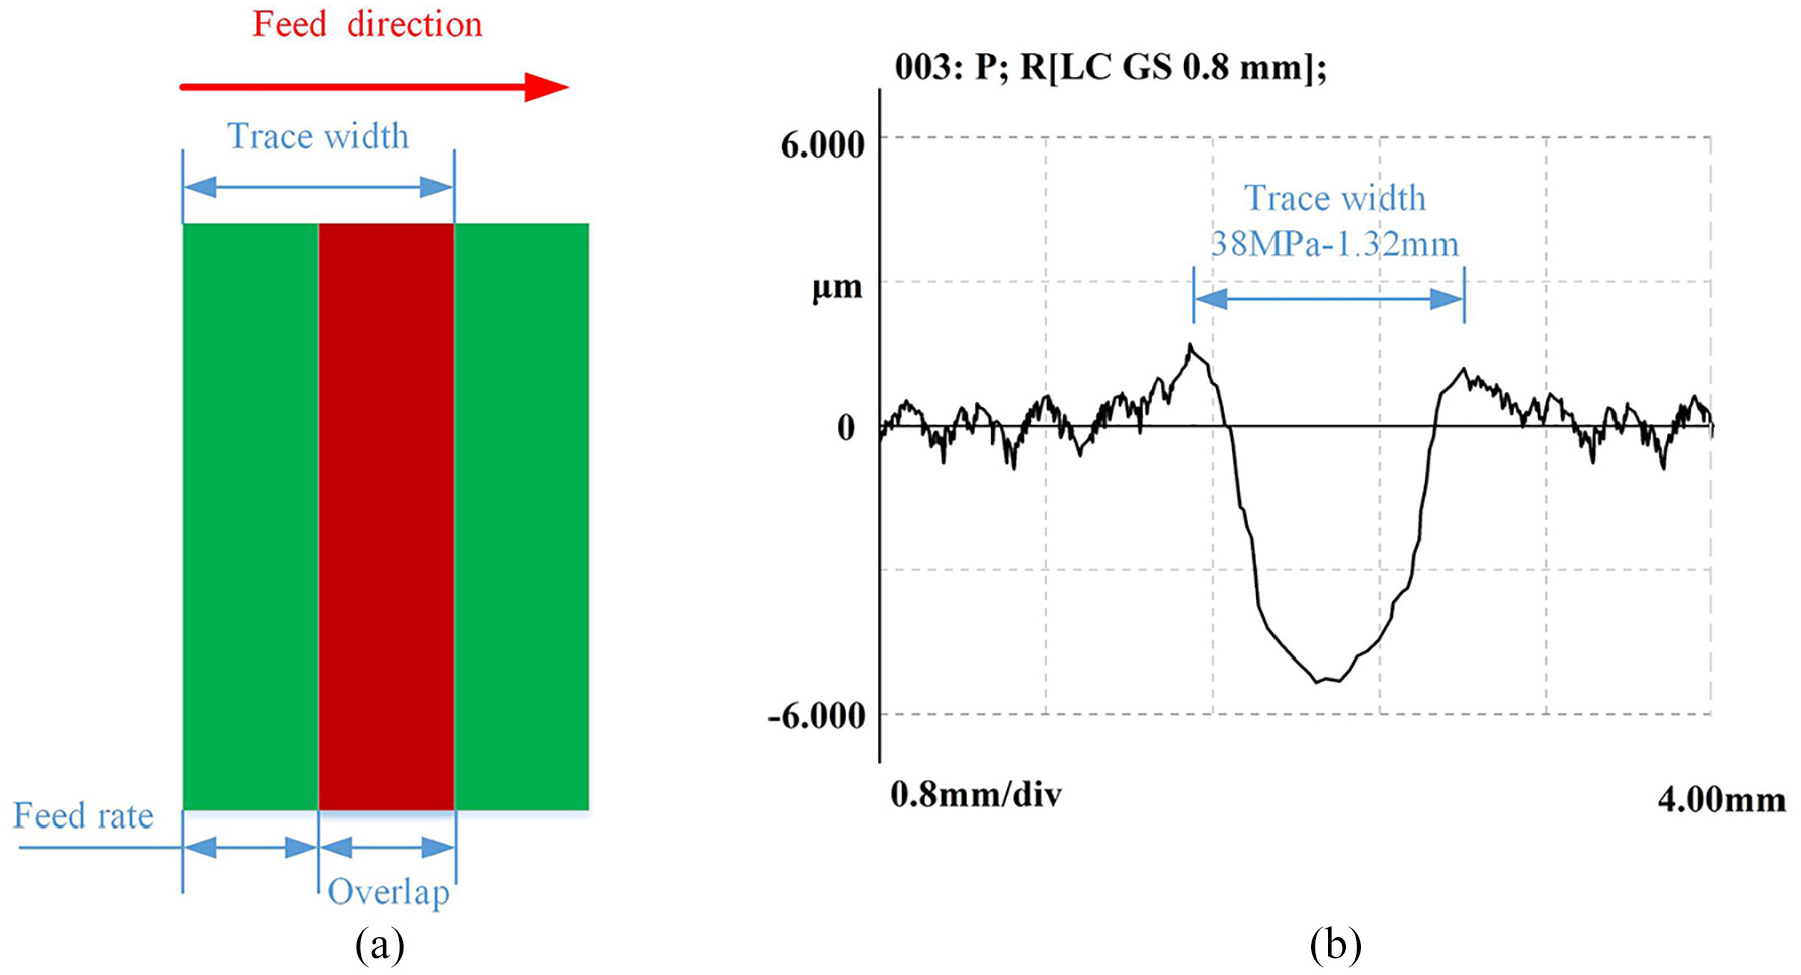
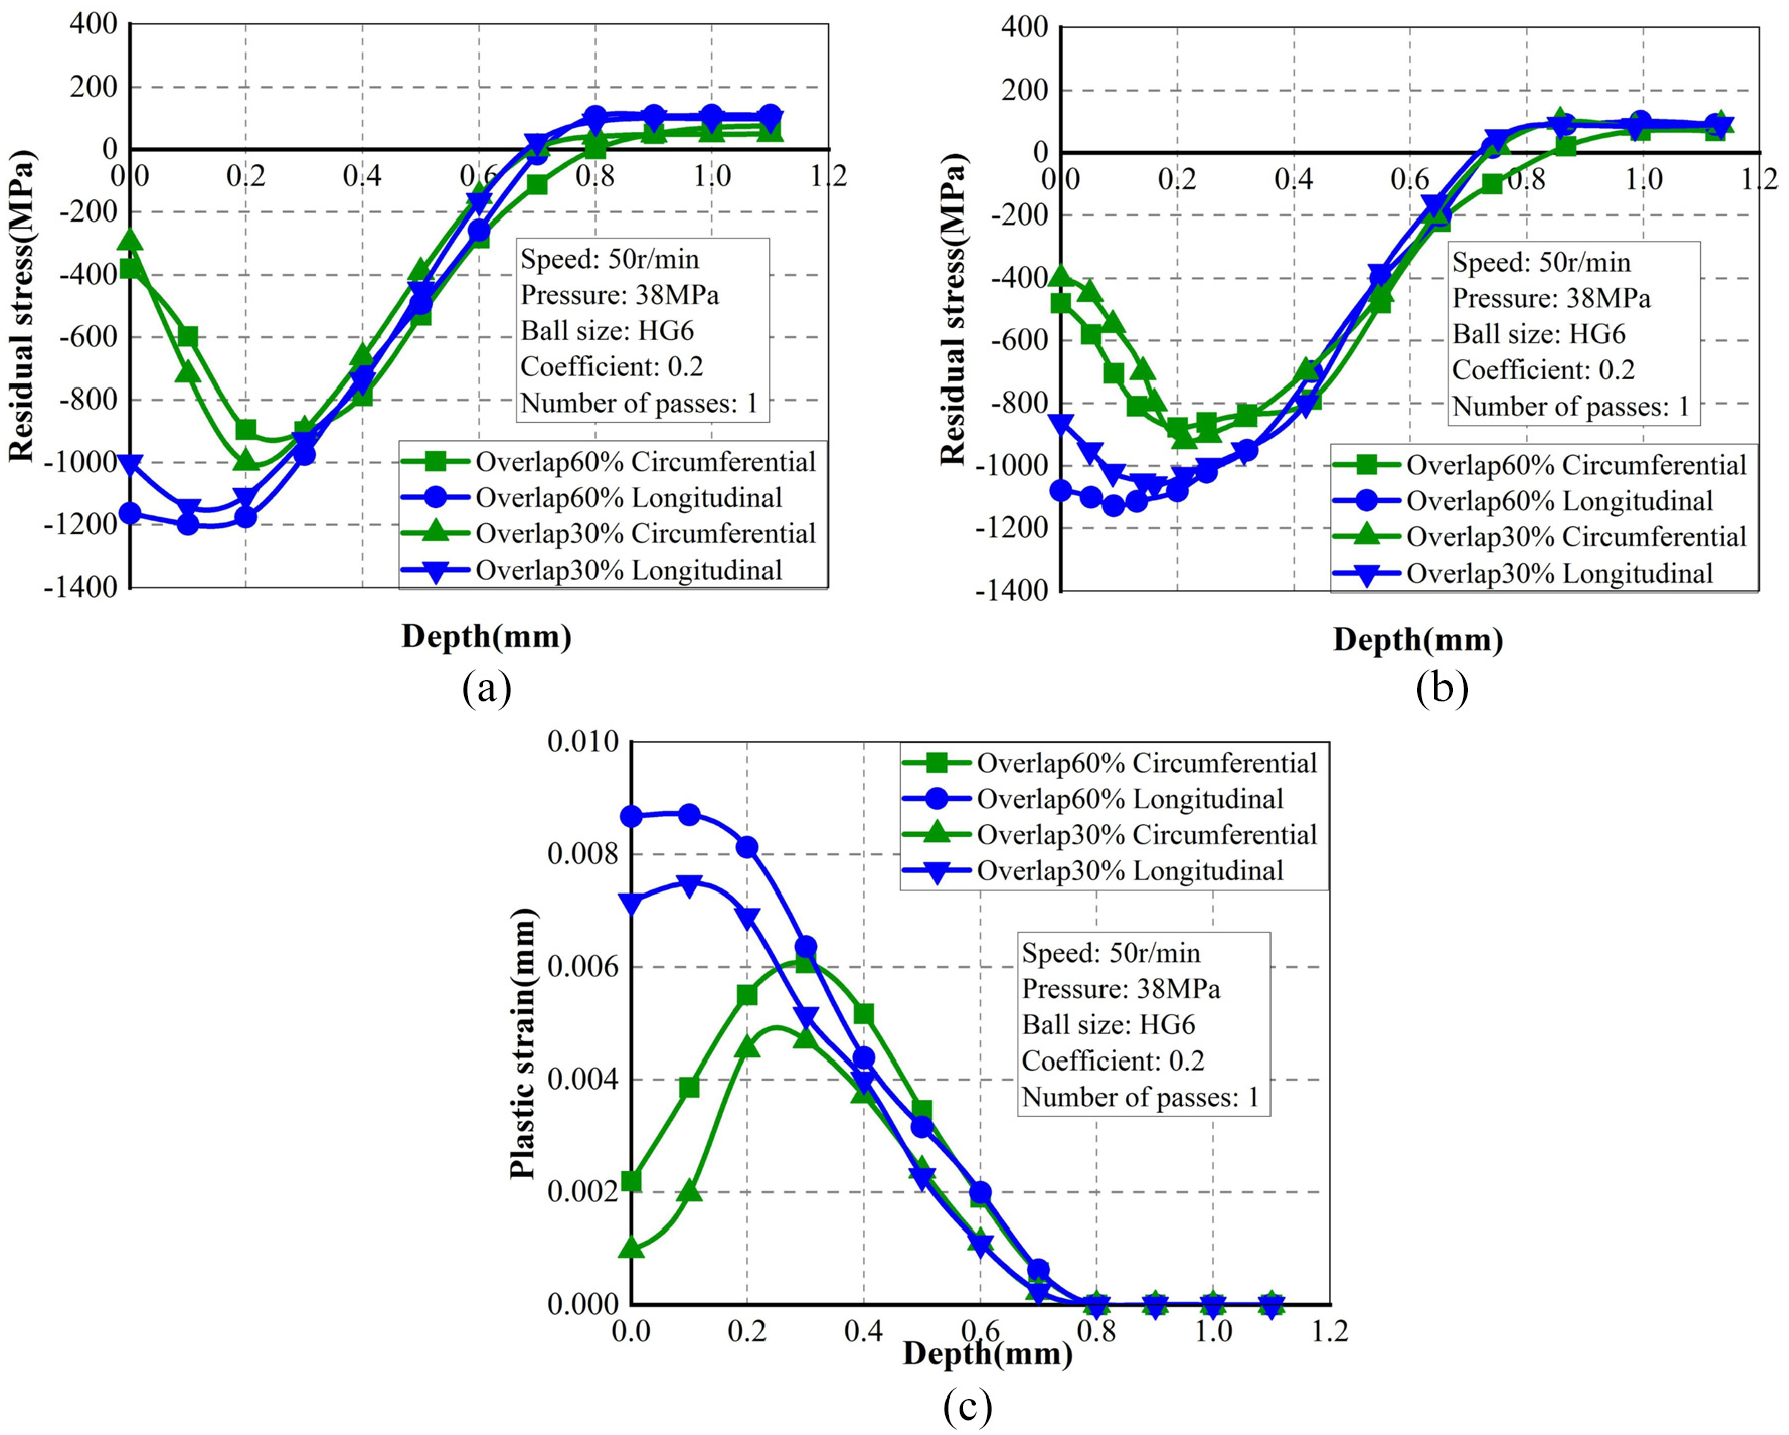
To analyze the effect of overlap on the residual stress, as listed in Table 5, the overlap was varied between 30% and 60% and the other parameters were unchanged. The concept of overlap and its determination are depicted in Figure 11. The overlap was calculated through the track width of a single pass which is experimentally determined by rolling a single track. Figure 12(a) illustrates the effect of overlap on residual stress. It was found that, in the longitudinal direction, the higher overlap produces larger compressive residual stress in the depth range from 0 to 300 μm. However, in the circumferential direction, although higher overlap induces a slightly deeper compressive residual stress layer, the maximum compressive residual stress is smaller than that of the lower overlap. The experimental results, shown in Figure 12(b), show a similar trend with the predicted results, which demonstrates the accuracy of results obtained from the FE simulation. It should be noted that the overlap has a significant effect on the residual stress in both directions. This is because the overlap will induce additional plastic deformation in two directions, which can be observed from the through depth plastic strain profile shown in Figure 12(c).
Parameters used to study the effect of overlap on residual stress.
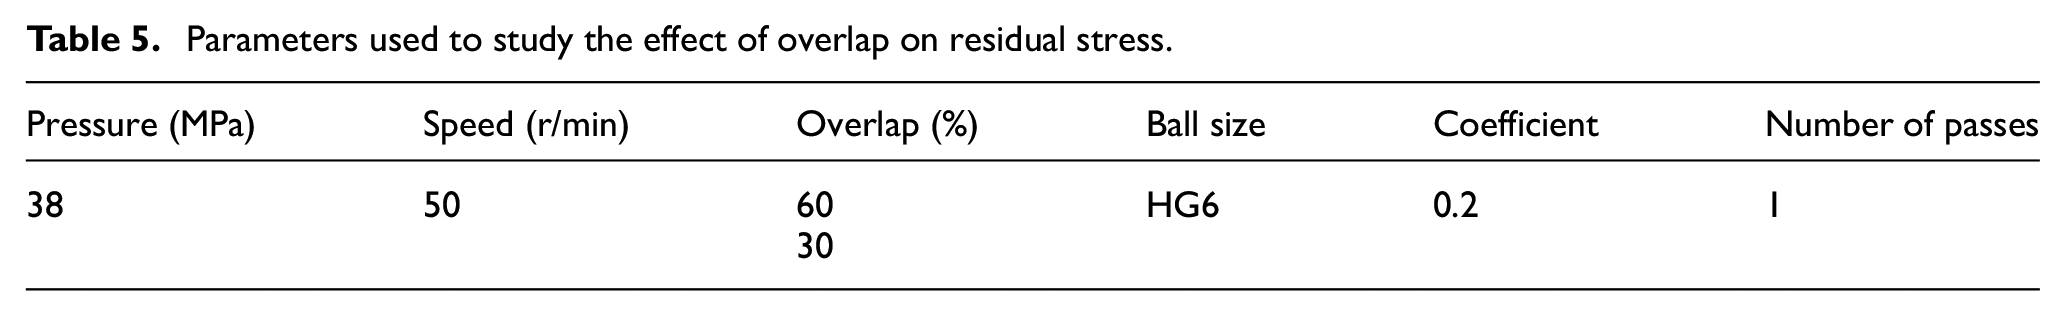
Overlap: (a) concept and (b) determination.
Effect of overlap on the residual stress and through depth plastic strain: (a) predicted value of residual stress,(b) experimental value of residual stress, and (c) predicted plastic strain.
Effect of friction coefficient
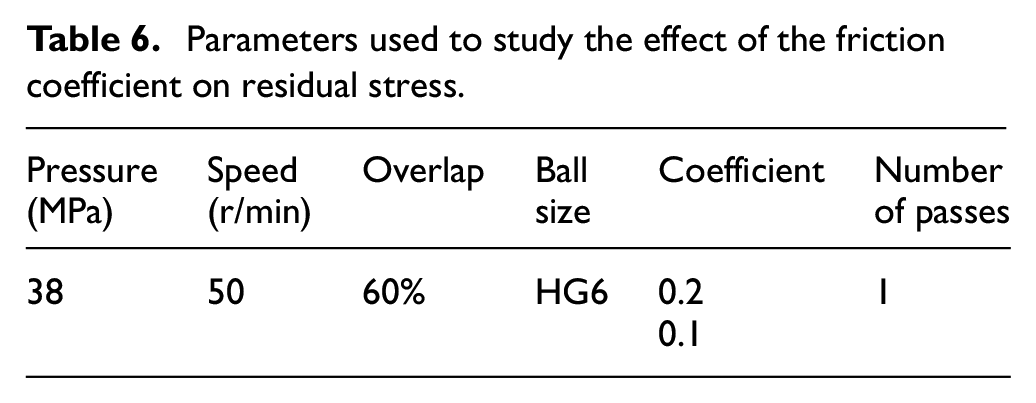
To analyze the effect of the friction coefficient on the residual stress, as shown in Table 6, the friction was varied between 0.1 and 0.2, and the other parameters were unchanged. Figure 13 presents the influence of the friction coefficient on residual stress, indicating that an increased friction coefficient leads to a slight decrease in the residual stress in the circumferential direction. But the residual stress profile in the longitudinal direction is almost the same for two different friction coefficients. Notably, the influence depth of the friction coefficient in the circumferential direction is about 300 μm, and the influence becomes negligible with the further increase in the depth. This indicates that the friction coefficient only slightly affects the near surface region and the stresses in the rolling direction. It may be because the friction force generates shear force on the surface of the component by the slip of the ball, and less friction causes slightly more slip, accounting for the increase in the residual stress in the deep rolling direction. It should be pointed out that the differences of the residual stress for the two coefficients may be within the error of the FE model, hence it can be inferred that the influence of the friction coefficient on the residual stress is insignificance, as seen in the study of Lim et al. 13
Parameters used to study the effect of the friction coefficient on residual stress.
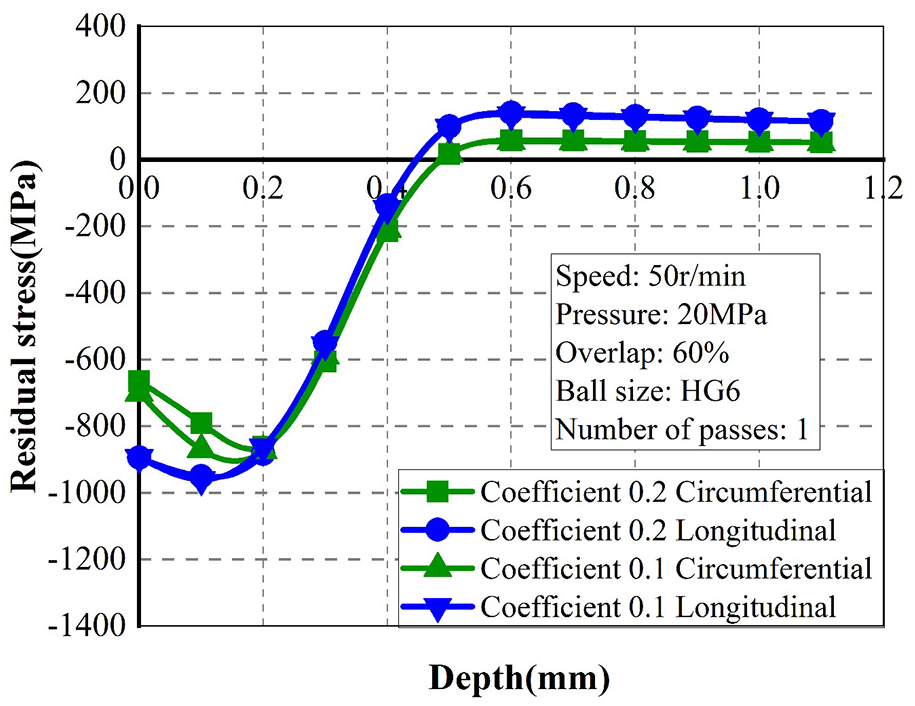
Effect of friction coefficient on the residual stress.
Effect of rolling speed
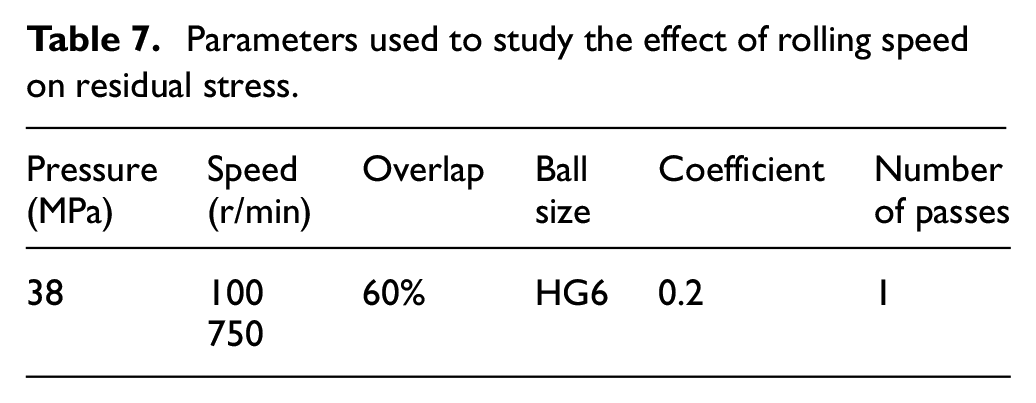
To analyze the effect of rolling speed on the residual stress, experiments were performed on two sets of parameters. As seen in Table 7, the rolling speed varied between 100 and 750 r/min, and the other parameters were kept constant. The influence of the rolling speed on the residual stress is shown in Figure 14. It can be observed that the rolling speed has a significant influence on the near surface residual stress in the circumferential direction, inducing a higher residual stress with the increase in rolling speed. However, in the longitudinal direction, an increased rolling speed has a very slight effect on the residual stress. A similar phenomenon was observed by Rami et al., 20 who concluded that the influence of rolling speed depends on the sensitivity of strain rate of the material. It is easy to find that Ti-6Al-4V is sensitive to strain rate, but an increasing rolling speed has much more influence on the strain rate in the rolling direction than in the longitudinal direction, which leads to dramatically different results of residual stress in two directions.
Parameters used to study the effect of rolling speed on residual stress.
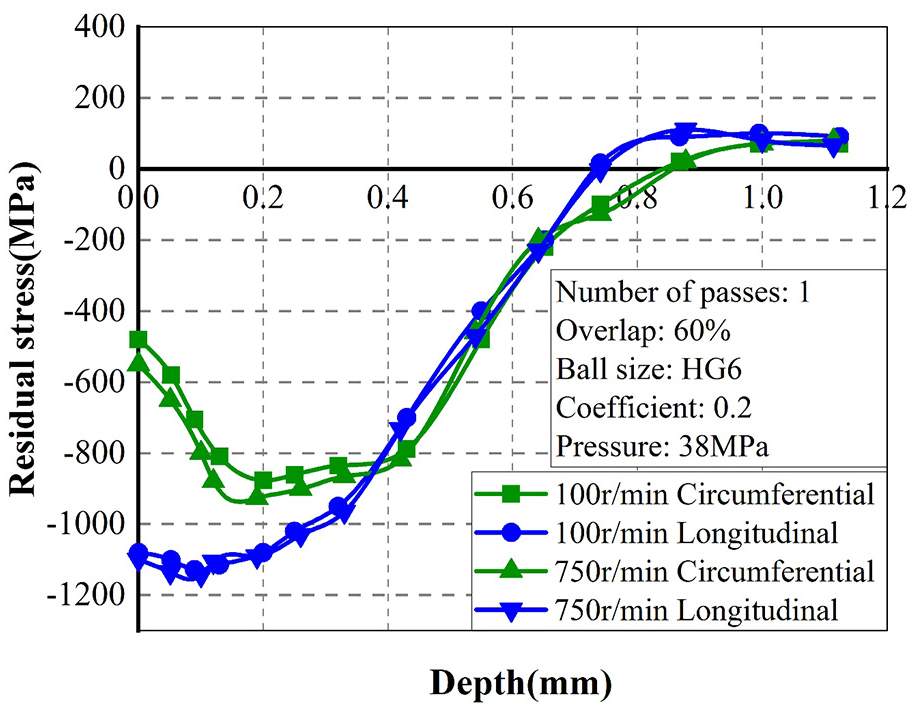
Effect of rolling speed on the residual stress.
Effect of ball size
To analyze the effect of ball size on the residual stress, as shown in Table 8, the ball diameter was varied between 6.35 and 7.93 mm, and the other parameters were kept unchanged. As shown in Figure 15(a), the surface residual stresses in both the longitudinal and circumferential directions decrease slightly with increasing ball diameter. This is because a smaller ball has a smaller contact area, which can deform the asperities on the surface and produce more plastic deformation.21,22 In addition, it is worth mentioning that increasing the ball diameter also leads to a slightly deeper compressive–tensile crossover point, which may be due to increased contact pressure caused by the larger ball size at the same hydraulic pressure. This result was confirmed by Abrão et al. 23 Similar trends were observed from the experimental results in Figure 15(b), which indicates that the influence law obtained from the FE simulation is also reliable.
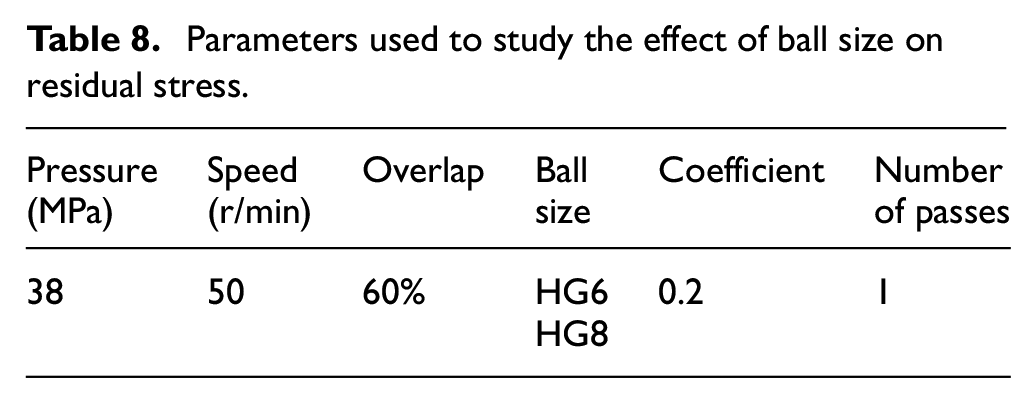
Parameters used to study the effect of ball size on residual stress.
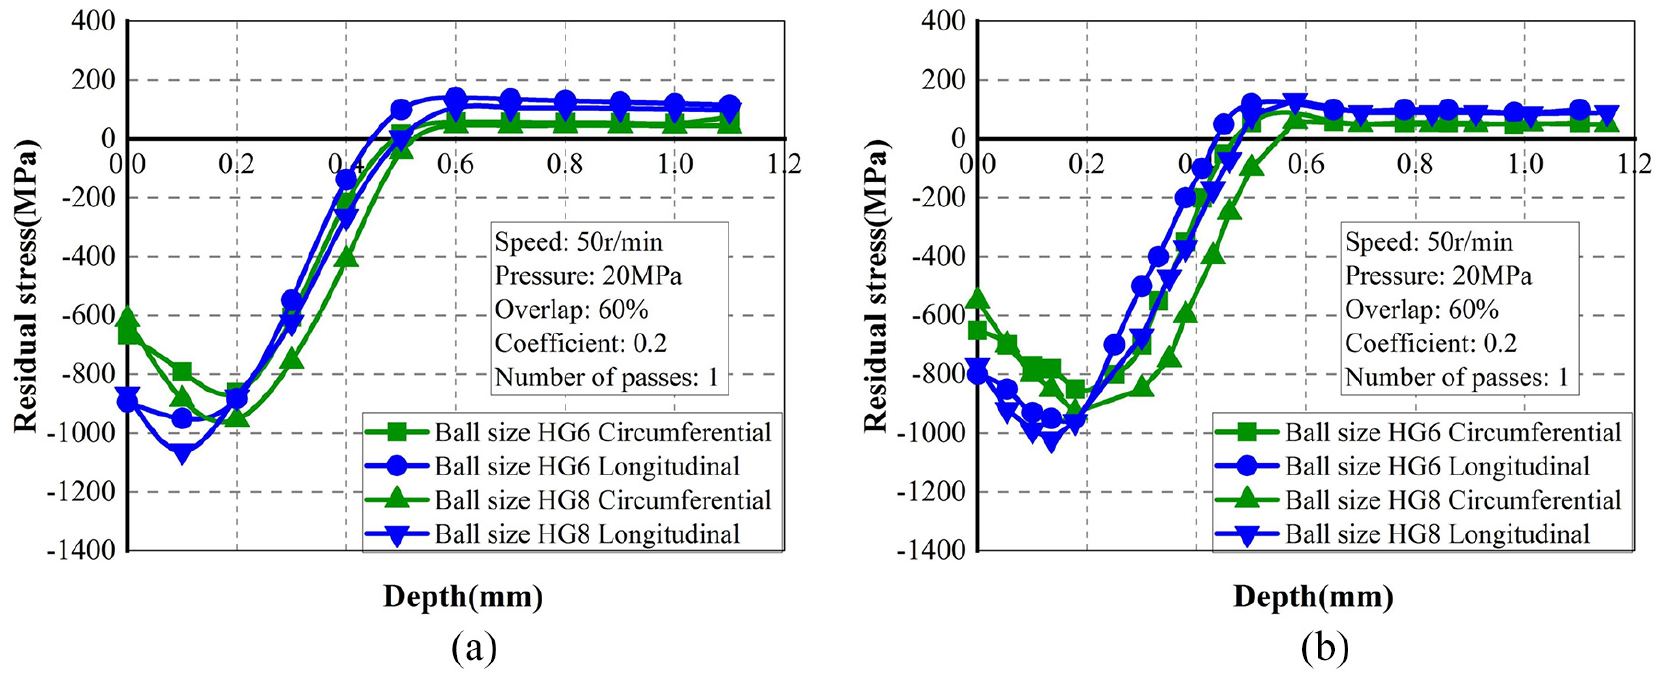
Effect of ball size on the residual stress: (a) simulation results and (b) experimental results.
Effect of number of passes
To analyze the effect of the number of passes on the residual stress, as shown in Table 9, the number of passes was varied between 1 and 2 mm, and the other parameters were held constant. Figure 16(a) shows the influence of the number of passes on the residual stress in two directions. It is observed that the residual stress in the circumferential direction significantly increases with the increasing number of passes, which is consistent with the result of Abrão et al. 18 However, the profiles of residual stress in the longitudinal direction are similar, and the residual stress increases slightly compared to one pass. It can be observed from Figure 16(c) that the earlier saturation of plastic deformation in the longitudinal direction compared to the circumferential direction causes this phenomenon. In addition, the number of passes has a significant influence on the residual stress in the circumferential direction with depths from 0 to 300 μm. Another interesting finding is that higher tensile residual stress is generated in the deeper layer in both directions with decreasing numbers of passes. This is because that residual stress is in self-equilibrium in components, and a higher compressive residual stress means a higher tensile residual stress will be produced to balance it. 24 Figure 16(b) depicts the experimental results of two different passes. It is obvious that the influence law obtained from the experimental results is the same as observed from the FE simulation. It can be concluded that the results obtained from the FE simulation are credible.
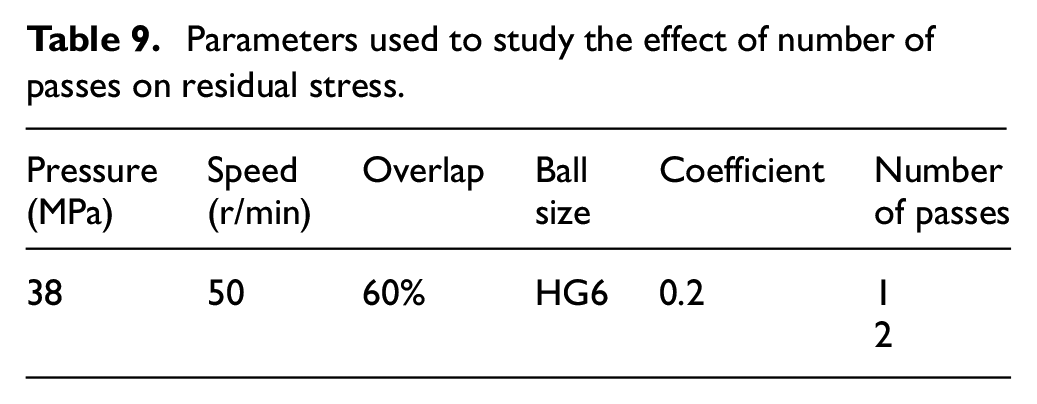
Parameters used to study the effect of number of passes on residual stress.
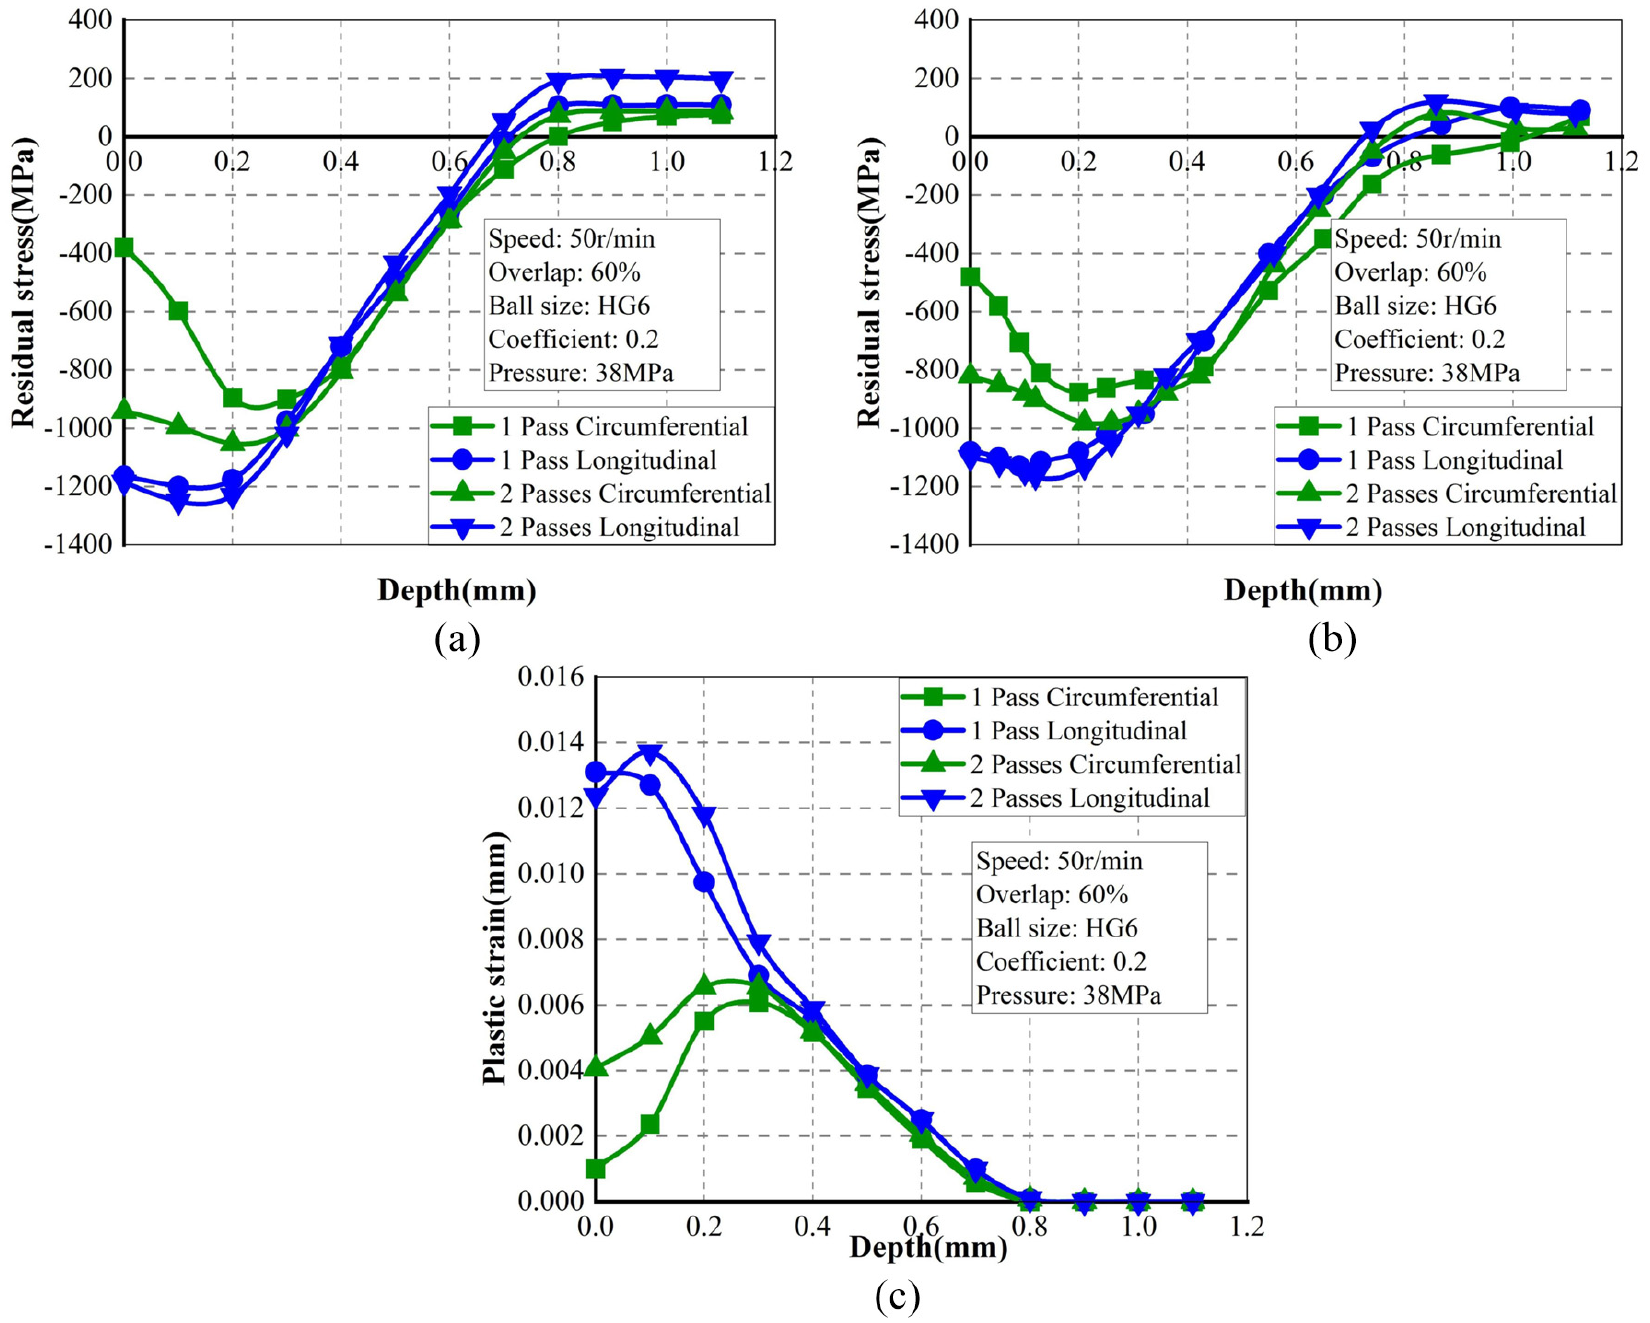
Effect of number of passes on the residual stress: (a) predicted value of residual stress, (b) experimental value of residual stress, and (c) predicted plastic strain.
Conclusion
A Chaboche nonlinear kinematic hardening material model was adopted in the modeling of the deep rolling process. Compared to a 2D model, the results of 3D models, especially the 90°cut-out model, were more accurate.
An increase in the deep rolling pressure leads to larger and deeper compressive residual stress and lower surface residual stress in the circumferential and longitudinal directions. Larger residual stress is induced in the near surface region in the longitudinal direction with higher overlap, and deeper residual stress with lower maximum compressive residual stress is produced in the circumferential direction. The friction increase between the ball and workpiece has a small influence on residual stress in deep rolling direction, inducing decreasing residual stress.
The near surface residual stress in the circumferential direction increases significantly with the rolling speed, whereas the residual stress in the longitudinal direction is scarcely affected by the increased rolling speed. Decreasing surface residual stress and deeper residual stress in both longitudinal and circumferential directions are obtained with increasing ball size. Furthermore, with the increase in deep rolling passes, the residual stress in the circumferential direction increases significantly, whereas it only increases slightly in the longitudinal direction.
Footnotes
Declaration of conflicting interests
The author(s) declared no potential conflicts of interest with respect to the research, authorship, and/or publication of this article.
Funding
The author(s) disclosed receipt of the following financial support for the research, authorship, and/or publication of this article: This work was funded and supported by the National Natural Science Foundation of China (Grant Nos. 91860206, 51875472, and 51905440), the National Science and Technology Major Project (2017-VII-0001-0094), and National Key Research and Development Plan in Shaanxi Province of China (2019ZDLGY02-03).