
Abstract
This study employed wearable inertial sensors integrated with an activity-recognition algorithm to recognize six types of daily activities performed by humans, namely walking, ascending stairs, descending stairs, sitting, standing, and lying. The sensor system consisted of a microcontroller, a three-axis accelerometer, and a three-axis gyro; the algorithm involved collecting and normalizing the activity signals. To simplify the calculation process and to maximize the recognition accuracy, the data were preprocessed through linear discriminant analysis; this reduced their dimensionality and captured their features, thereby reducing the feature space of the accelerometer and gyro signals; they were then verified through the use of six classification algorithms. The new contribution is that after feature extraction, data classification results indicated that an artificial neural network was the most stable and effective of the six algorithms. In the experiment, 20 participants equipped the wearable sensors on their waists to record the aforementioned six types of daily activities and to verify the effectiveness of the sensors. According to the cross-validation results, the combination of linear discriminant analysis and an artificial neural network was the most stable classification algorithm for data generalization; its activity-recognition accuracy was 87.37% on the training data and 80.96% on the test data.
Keywords
Introduction
Recent studies have employed various feature-extraction methods and machine-learning classifiers in wearable devices to collect and analyze measurement data and develop effective human body activity-recognition systems. Zhang et al. 1 proposed an adaptive compressed sensing algorithm for transmission of acceleration data in human body activity recognition. This enabled associating the sparsity of acceleration data with the optimal compression ratio in the learning phase. The optimal compression ratios for the arms and legs were 80% and 60%, respectively. Through the use of block sparse Bayesian learning (BO), the compression ratio identified through an activity-recognition system could increase by 20%, and minimal reconstruction accuracy could be achieved in the system. Yang and Zhang 2 applied a three-axis accelerometer to capture time and frequency domain features and employed a decision tree (DT) classifier for data classification; wearable devices were equipped on wrists to identify five types of motions performed by healthy individuals, such as sitting, walking, jogging, jumping, and cycling. The research presents an implementation of the advanced inertial measurement unit (IMU) with wireless communication technology for mobile health monitoring. 3 Liu et al. 4 equipped wearable devices with nine-axis accelerometers, which comprised accelerometers, gyros, and magnetometer sensors, on their wrists to record eight types of hand motions and classified the data through machine learning. The features were acquired through principal component analysis (PCA) and linear discriminant analysis (LDA). Finally, the data were classified using a support vector machine (SVM), revealing eight data classes with an activity-recognition accuracy of 99.63%. Liu et al. 5 developed a set of wearable devices to monitor the health status of individuals. This technology has garnered an increasing acceptance by the public; the data retrieved using these devices can be used by clinical and medical professionals. Through a non-linear SVM algorithm, the accelerometer identified 20 types of human body activities with an accuracy of 65.08%. Accordingly, most of the feature-reduction methods employed in machine-learning classification involve unsupervised PCA feature–extraction methods and supervised LDA. However, limitations exist in the effectiveness of applying 精準醫療 unsupervised and discriminant analysis feature-extraction methods for activity recognition. The feature vector in PCA exhibits unstable changes in participants’ activity continuation time, 6 and only L– 1 (class number – 1) features can be acquired through discriminant analysis. Therefore, nonparametric feature-extraction methods are employed in preprocessing identification tasks.7,8 The classifier methods have used in many fields such as Internet of Things (IoT), industry, and precision medicine. The minimum distance classifier (MDC) is an example of a commonly used “conventional” classifier. But the results show that the MDC does not perform as well as a neural network when applied to an industrial problem. 9 And hence, we use several classifiers to find out which kinds of algorithms are suitable for human body activities recognition of precision medicine applications.
Today, smartphones have become an indispensable part of daily living worldwide; 91% people worldwide own smartphones. In addition to basic telephone functions, smartphones provide numerous functions, and various sensors, for example accelerometers, are incorporated in smartphones. Smartphone data have been applied to recognize human body activities10,11 Therefore, cost-efficient activity recognition has become a focus in many studies. Databases in smartphones have been applied to activity recognition. 12 Sukor et al. 13 employed the built-in accelerometer in a smartphone to recognize human body activities and applied the acceleration data in an open database as original input signals. The number of attribute dimensions was reduced through PCA, and the time and frequency domain attribute data were captured for classification, yielding an accuracy of 96.11% in training and 92.10% in testing. This study presents a complete design flow of an electronic system developed to support applications in which there are the need to measure motion parameters and transmit them to a remote unit for real-time teleprocessing. 14 The accelerometer methods are also well using to solve industrial problems, a data-driven approach is applied to develop a health monitoring and diagnosis framework for a fused deposition modeling process based on a machine-learning algorithm. 15 The study concludes that those of acceleration data from the frame were most effective for diagnosing health states of the fused deposition modeling process with the non-linear SVM-based mode.
In this study, a wearable inertial sensor system integrated with a nonparametric feature-extraction method and a machine-learning classifier was developed to enhance activity-recognition accuracy in daily living. The wearable devices were equipped on the waists of the participants to track and record their daily activity signals. LDA was performed to reduce dimensionality and the number of feature data. 16 Subsequently, an artificial neural network (ANN) was applied to classify six types of daily living activities.
The remainder of this article is organized as follows. Section “Experimental setup” describes the demographic information and features of the participants and the hardware structure of the wearable inertial sensors. Section “Activity-recognition algorithm” presents the activity-recognition algorithm, which involved collecting activity signals, signal normalization, feature extraction through LDA, and data classification through ANN. Section “Experimental results and discussion” presents and discusses the results of the research. Section “Conclusion” concludes this article.
Experimental setup
Participants
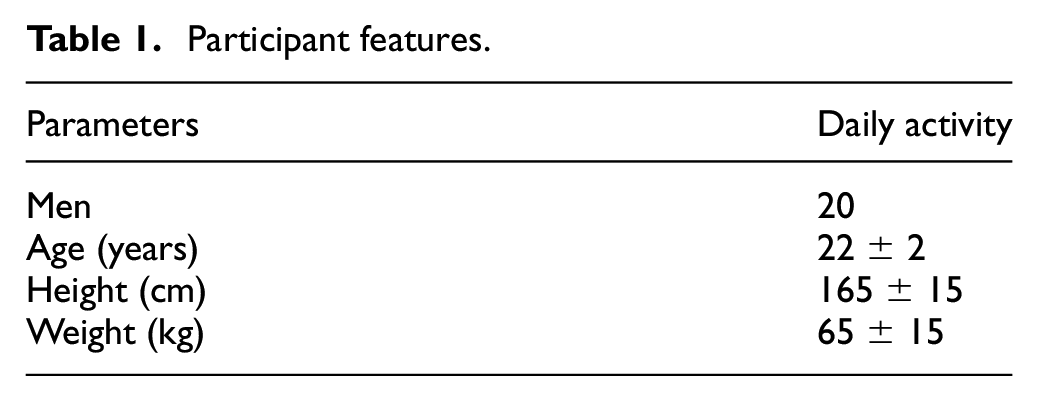
A total of 20 healthy male participants, who were aged 22 ± 2 years and exhibited heights of 165 ± 15 cm and weights of 65 ± 15 kg, were recruited for tracking the signals of six types of their daily activities. Each exercise was performed for 11 times for a total of 66 times. Table 1 lists demographic information. Each participant was requested to equip a wearable inertial sensor on his waist and perform six types of daily activities, namely walking, ascending stairs, descending stairs, sitting, standing, and lying. The inertial sensors in the wearable devices (i.e. accelerometers and gyros) captured the three-axis acceleration and three-axis angular velocity data at the constant speed of 50 Hz. A total of 6600 data were collected, and each datum contained 900 features. Each type of action was performed for 15 min. The activity data were divided into two groups; namely, 4620 data (70% of the total) were used for training and the other 1980 (30%) for testing.
Participant features.
Apparatus
The wearable inertial sensor employed in this study consisted of a three-axis accelerometer and a three-axis gyro. The sensor was equipped on the waist of each participant to record signals of his daily activities (Figure 1). The structure of the wearable device comprised an embedded microcontroller (Raspberry Pi 3), a six-axis inertial sensor (MPU-6050), and a power supply (Figure 2). The microcontroller comprised a Broadcom BCM2387 processor, a 1.2 GHz 4-core ARM Cortex-A53.802.11 structure, and a 2-core Video Core IVR multimedia co-processor as its graphics processing unit and featured a 32-G memory capacity and a size of 85 × 56 × 17 mm; its power supply connected through a micro-USB slot with voltage and current of 5 V and 2.5 A, respectively. The microcontroller collected the numeric signals of human activities from the inertial sensor through the inter-integrated circuit (I2C) and transmitted them to Raspberry Pi 3. The sensor consisted of a three-axis accelerometer, a three-axis gyro, and a 16-bit analog-to-digital converter. The sensor system was used to simultaneously collect the daily activities of human bodies, the resultant accelerations and angular velocities, and the three-dimensional activity spaces of the activities; the system output numeric signals of these activities. The accelerometer detected the acceleration of the inertial sensor on the waist of each participant in the x (right), y (downward), and z (frontal) directions in each test. The ranges of acceleration in these activities were ±2g, ±4g, ±8g, and ±16g; the ranges of angular velocities of said activities as detected through the gyro were ±250°, ±500°, ±1000°, and ±2000° per second. During the tests, the range and sensitivity of the accelerometer were set to ±16g and 2048 LSB/g, respectively; those of the gyro were set to +2000° per second and 16.4 LSB/g, respectively. The output signal sampling frequencies of both the accelerometer and the gyro were set to 50 Hz. The activity-recognition device had a mobile power supply that supplied direct current at 5 V and 2.1 A. Figure 3 illustrates the hardware components of the wearable device, namely the microcontroller (Raspberry Pi 3) and six-axis inertial sensor (MPU-6050).
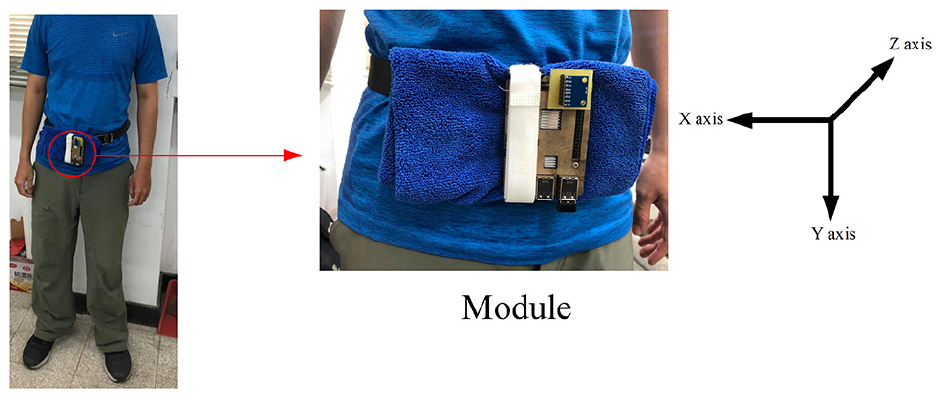
Wearable sensor equipped on the waist of a participant.
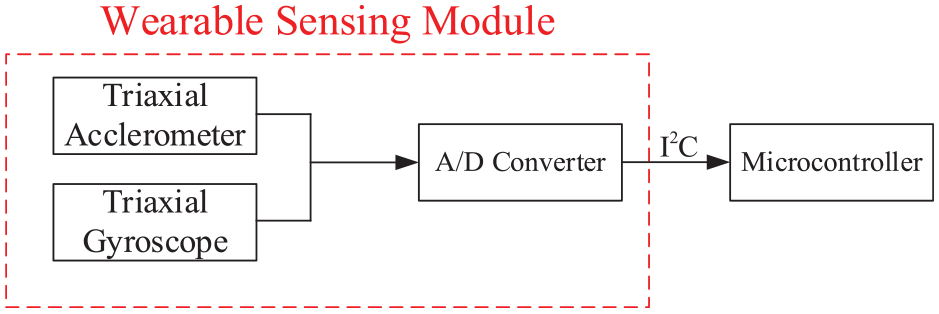
Schematics of the wearable sensor.
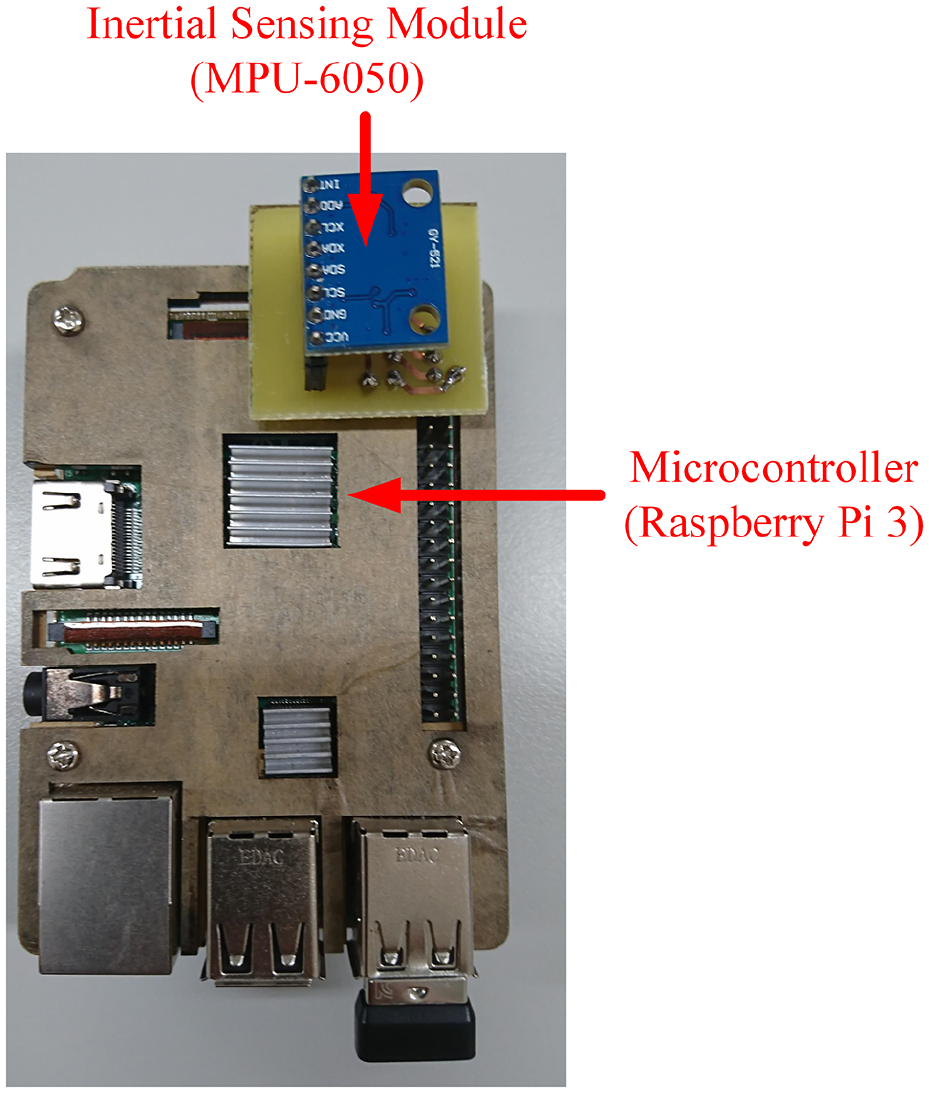
Hardware structure of the wearable sensor.
Activity-recognition algorithm
The activity-recognition algorithm consists of the following processes: (1) activity signal capture, (2) signal normalization, and (3) data preprocessing through LDA for dimension reduction, feature extraction, and feature reduction.
Finally, machine-learning classification algorithms, namely SVM, ANN, k-nearest neighbors (KNN) and DT, were applied to identify the daily human activities. Figure 4 depicts the details of the activity-recognition process.
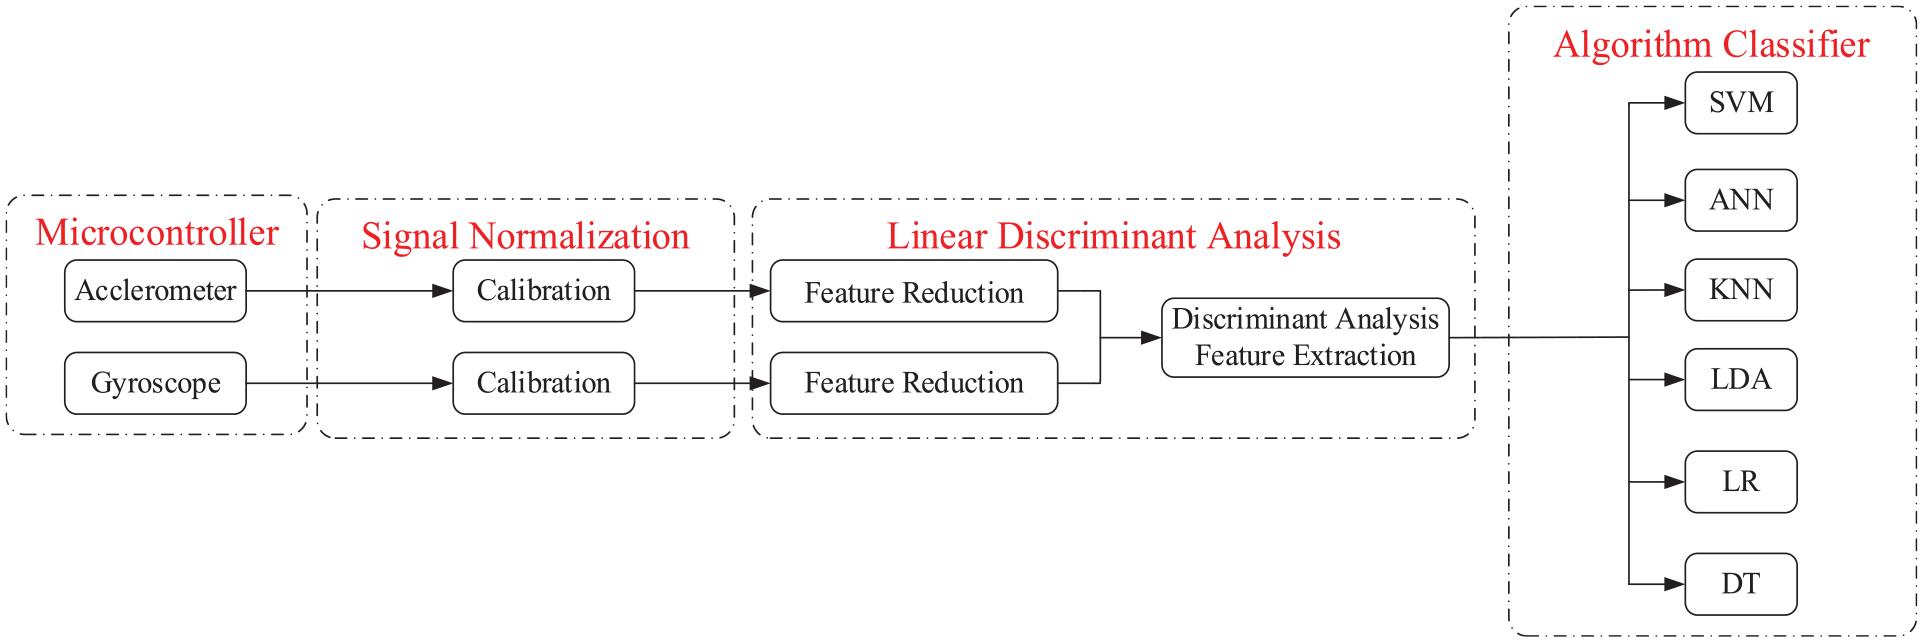
The proposed activity-recognition algorithm.
Motion signal acquisition
The acceleration and angular velocities of six types of activities, namely walking, ascending stairs, descending stairs, sitting, standing, and lying, were recorded through the wearable sensors attached to the waists of the 20 healthy participants.
Signal normalization
Because the numeric precisions of accelerometer and gyro were different, their precision levels were uniformly calibrated to the seventh decimal place, and the numeric values were presented in scientific marks to ensure the length uniformity of each set of accelerometer and gyro data, preventing data input errors in the calculation of preprocessed data.
LDA preprocessing
LDA was applied to reduce the dimensionality of preprocessed data and thereby project data sets to a low-dimensional space with satisfactory class linearity. Because this LDA involved data marking, feature values became significant after feature extraction.
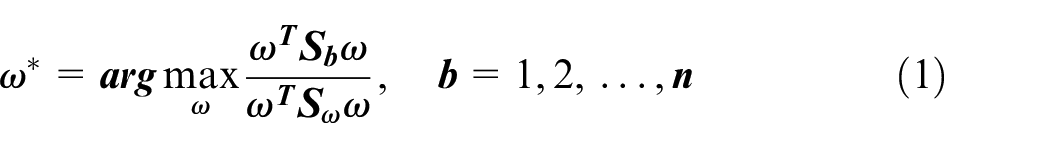
Equation (1) depicts the LDA feature-extraction algorithm proposed by Karg et al.
17
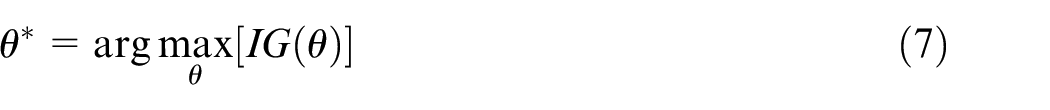
LDA was adopted to identify the optimal data projection direction to minimize the distances between data points within each class and maximize those between classes. Thus, the optimal direction,
Let

Let
where
The optimal result could be obtaining by

where
The sampling frequency of the wearable sensor was 50 Hz. Therefore, matrices with the size of 150 units were employed, and data were stored for every second. The matrices were aligned as an eigenvector with the dimension of 900 (6 × 150) units (6 × 150 indicates six dimensions and 150 samples). On the first row, the vector of each element was marked with its respective class. Both the training and test data were arranged in the format as shown in Figure 5 for classifier input.
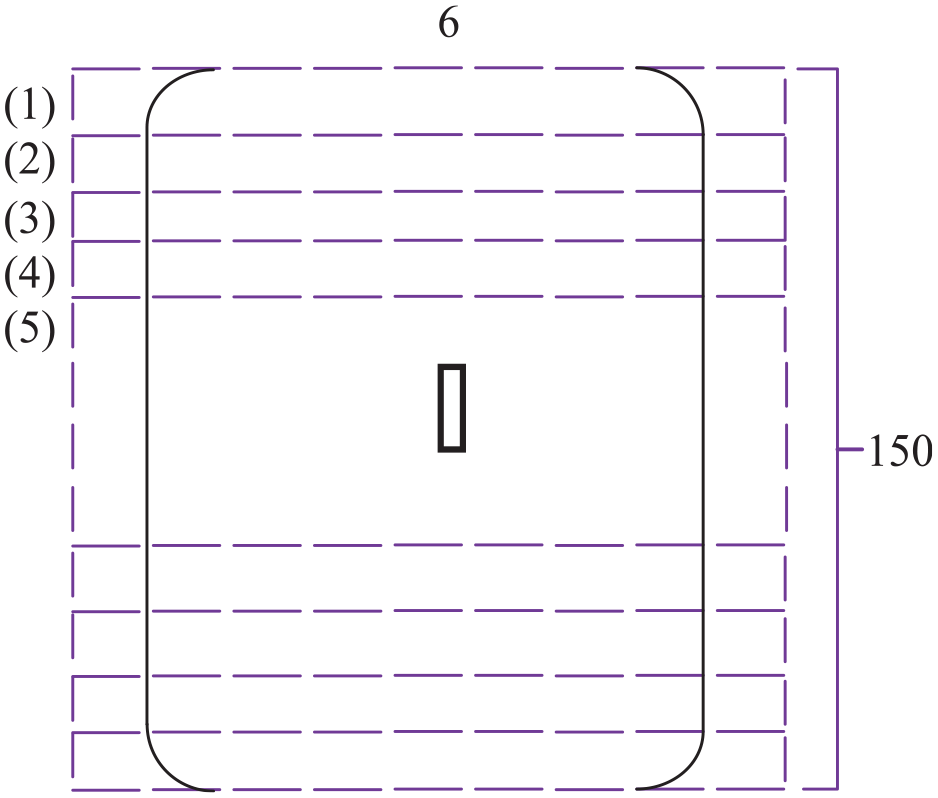
A data set with scanning window which window size is 150.
Classification method
SVM classifier
SVM is an approach for generating a hyperplane in an n-dimensional space. Let n be the number of feature vectors of different classes of input. SVM is a maximum margin classifier, which creates a hyperplane and maximizes the margin between the hyperplane and the nearest feature vector to each of its side. This study employed a library for SVM, which was developed by Chang and Lin 18 for support vector classification and regression as well as multiclass classification support.
After LDA preprocessing, SVM was adopted to classify the data. The equation of a radial basis function kernel is as follows

where
Gaussian SVM adopts a radial basis function kernel function to project an original high-dimensional space to a higher-dimensional space for easy space separation. In this study, a kernel was employed to complete the calculation in a low-dimensional space. Subsequently, a kernel function was used to project the input space to a high-dimensional feature space. Finally, an optimal separating hyperplane was constructed in the high-dimensional space.
ANN classifier
The idea ANN came from biological neurons. In other words ANNs, like humans acquire knowledge through observations, that is, data sets. ANN has a large number of interconnected elements called neurons which work simultaneously to solve a problem. Neural network algorithms has many applications such as pattern recognition, face recognition, and signal processing. 19
Figure 6 shows the structure of an artificial neuron where k is the neuron. The inputs
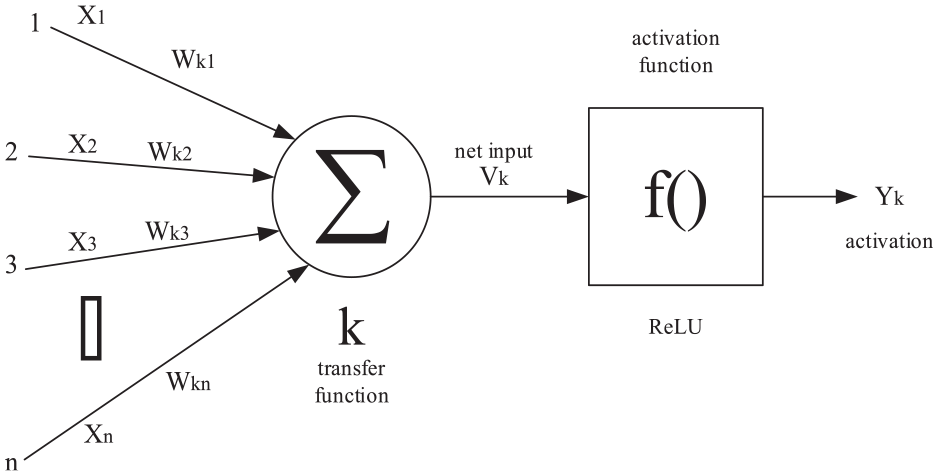
Structure of an artificial neuron.
KNN classifier
KNN is a form of supervised learning that employs training time for a trained machine to learn a model. During the training time, each data are assigned a correct answer, and the machine adjusts its learning method according to the correct answers. 21 KNN involves calculating the distance between each new data point and its neighbors within the feature space of a training sample, selecting the k-nearest neighboring points to the data, and identifying the classes of these points. The new data point is then grouped in the class with the highest number of points.
An excessively small k value leads to an excessively small number of neighbors, reduces classification accuracy, and exacerbates the disturbance by noise, whereas an excessively large k value causes a sample to be classified to the class with the most concentrated training and the lowest number of data. In this study, k was set as 8 for maximal accuracy. KNN, which involves calculating the distance between one data point and its neighbors, is a type of instance-based learning.
The distances between sample points in the feature space were calculated as Euclidean distances. The equation is shown as follows
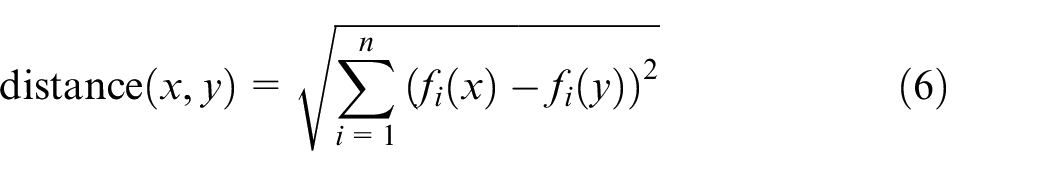
where
DT classifier
Another classifier compared in this article is the DT. The classifiers of this family are nonparametric supervised learning algorithms employed both for classification and regression. Also DTs are based on a training phase aimed at creating a model that recursively partitions the feature space such that the accelerometer signals with the same labels
The choice of the best split falls on the value of
The DT algorithm iterates until the maximum allowable depth (i.e. the maximum number of splits from the root to the leafs of the DT) is reached or a stop condition is satisfied. In this study, the employed stop condition is that a terminal node (i.e. a leaf of the DT) contains less samples than a predefined threshold (i.e. MinNumberObject often expressed in percentage). This stop modality is also called online pruning of the DT. 23 We limit the amount of pruning, and we set the confidence factor equal to 0.01, as reported in the performance comparison.
Experimental results and discussion
The experiment was performed in a personal computer with Microsoft Windows 10, an Intel® Core Processor i5-8500, and 8 GB of RAM. The performance proposed activity-recognition algorithm was verified through cross-validation, which involved equations for accuracy, precision, recall, and error rate
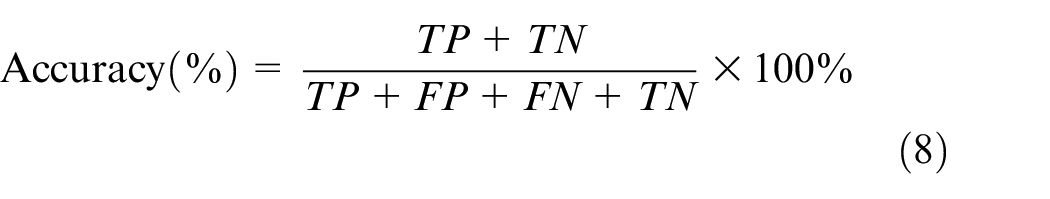
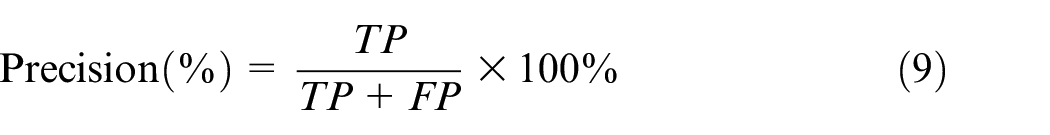
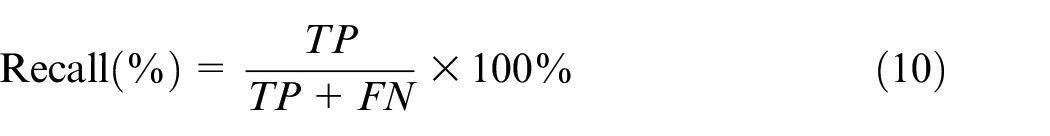

where TP is true positive, TN is true negative, FP is false positive, and FN is false negative.
Training data human daily activity recognition
Training data LDA dimension reduction
In the experiment, each participant performed six types of daily activities in the experiment environment, namely walking, ascending stairs, descending stairs, sitting, standing, and lying. LDA was performed in data preprocessing to identify the optimal projection direction, enabling preclassified data points of the same classes to be grouped together and those of different classes to be separated after their projection in a low-dimensional space. The training data were reduced to two-dimensional (2D) data, and the variables were mapped on a plane. Figure 7 presents the classes of the training data; specifically, walking, ascending stairs, descending stairs, sitting, standing, and lying were respectively marked in cyan, blue, yellow, red, magenta, and green. The x and y axes represent, respectively, LD1 (first element to be retained) and LD2 (second element to be retained). The results revealed that the data on ascending and descending stairs, sitting, and standing were grouped together. This was because, each stair contains a set of platforms, and the participants climbed the stairs in healthy body postures. Moreover, data on sitting and standing were grouped together because both activities exhibit static body states. Data on lying were grouped separately from those of the other types of activities because they involved horizontal body positions, which differed from the other types of activities.
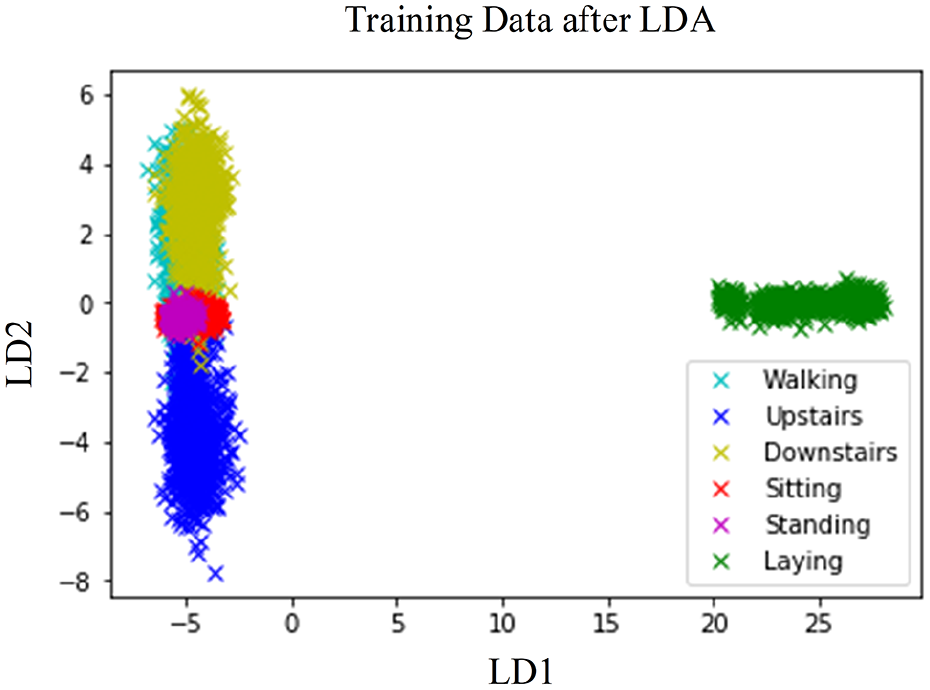
Training data after LDA.
Training data verification of human daily activity recognition
Table 2 lists the activity-recognition performance of the six classifiers after the LDA feature extraction, namely SVM, ANN, KNN, and DT. After data preprocessing had been performed in conjunction with the classification algorithms, the LDA-ANN, LDA-KNN, and LDA-DT exhibited the most ideal recognition performance.
Activity-recognition accuracies of SVM, ANN, KNN, and DT.
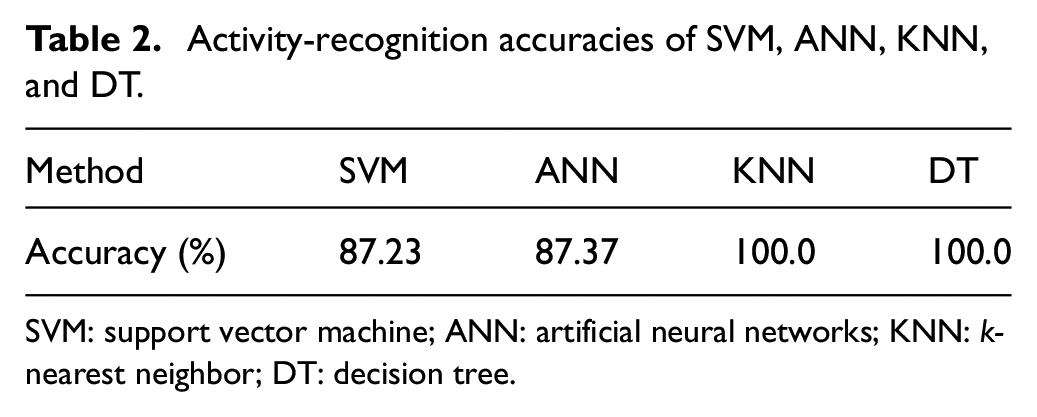
SVM: support vector machine; ANN: artificial neural networks; KNN: k-nearest neighbor; DT: decision tree.
Test data human daily activity recognition
Test data LDA dimension reduction
LDA was performed in data preprocessing to identify the optimal projection direction, enabling preclassified data points of the same classes to be concentrated and those of different classes to be separated after their projection in a low-dimensional space. Similar to the training data, the test data were reduced to 2D data, and the variables were mapped on a plane (Figure 8). The training data clusters were concentrated, whereas the test data clusters were scattered. This was because, the characteristics of the data clusters differed according to the number of their data points.
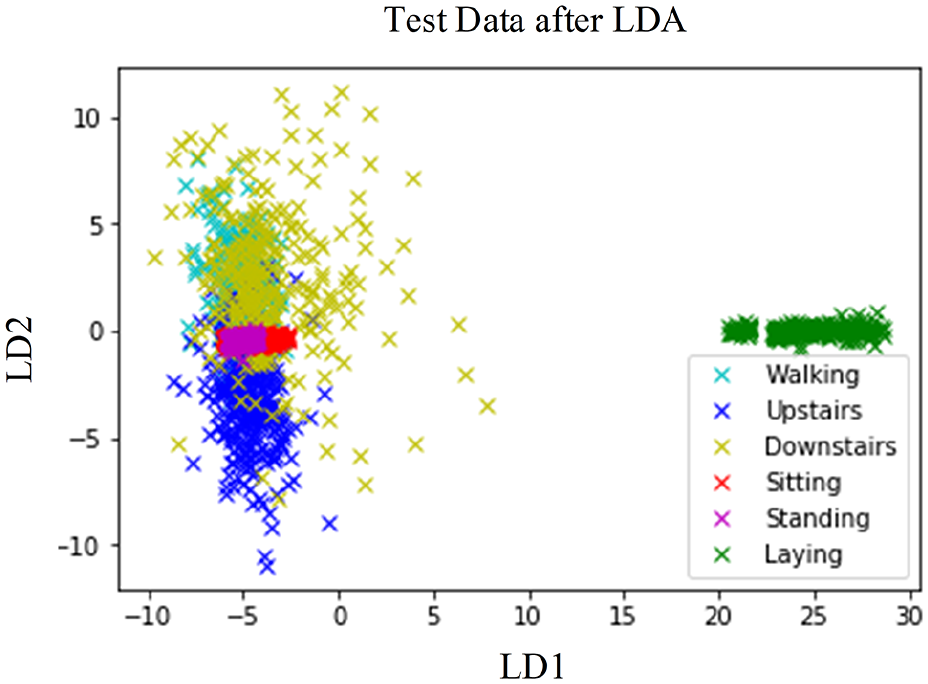
Test data after LDA feature extraction.
Test data verification of human daily activity recognition
Table 3 lists the confusion matrix of ANN after the LDA feature extraction. According to the accuracy comparison as shown in Table 4, LDA-ANN exhibited the most desirable recognition performance.
Confusion matrix for human daily activity recognition using the LDA-ANN scheme verified by cross-validation.
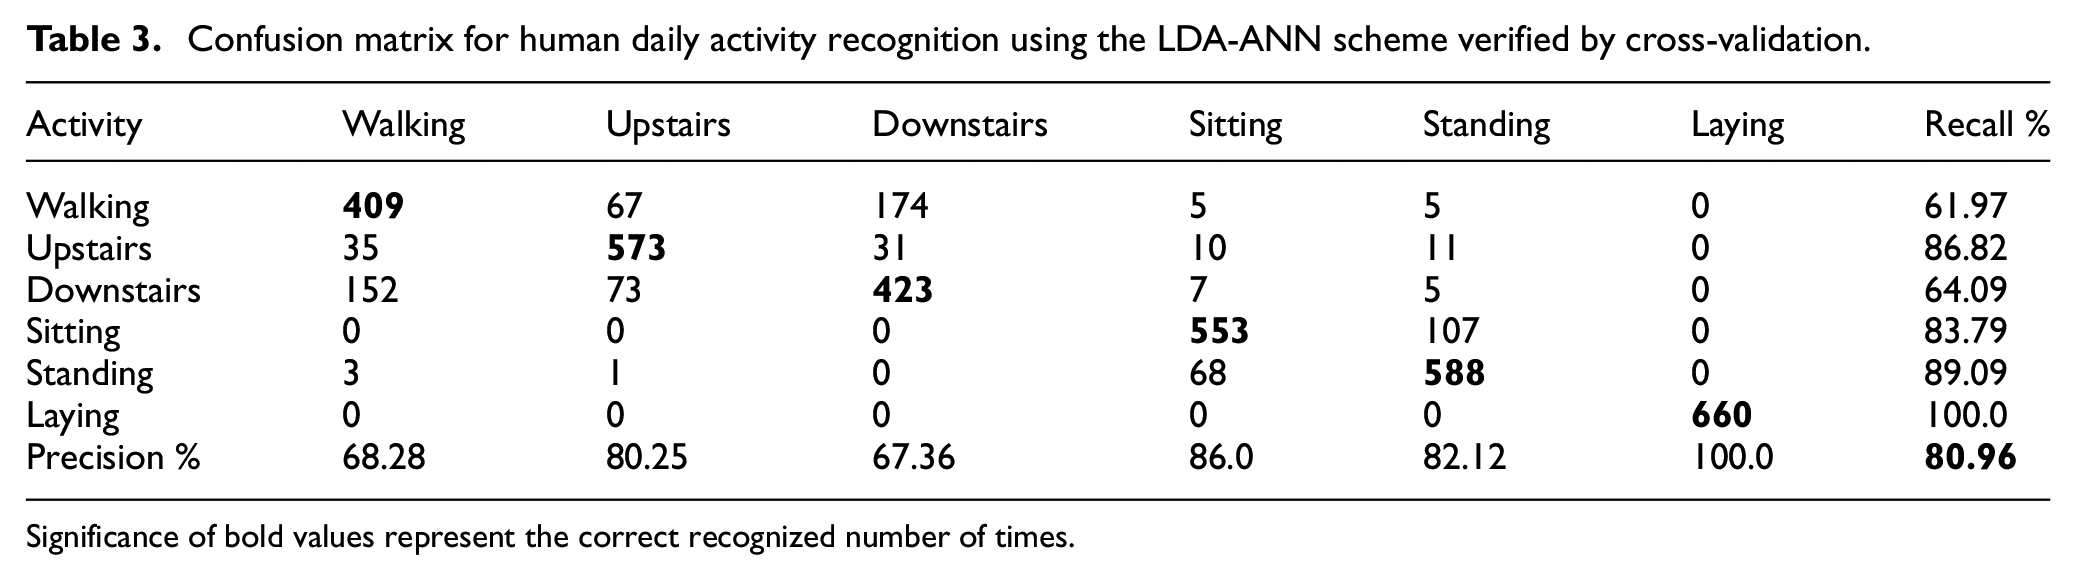
Significance of bold values represent the correct recognized number of times.
Activity-recognition accuracies of SVM, ANN, KNN, and DT.
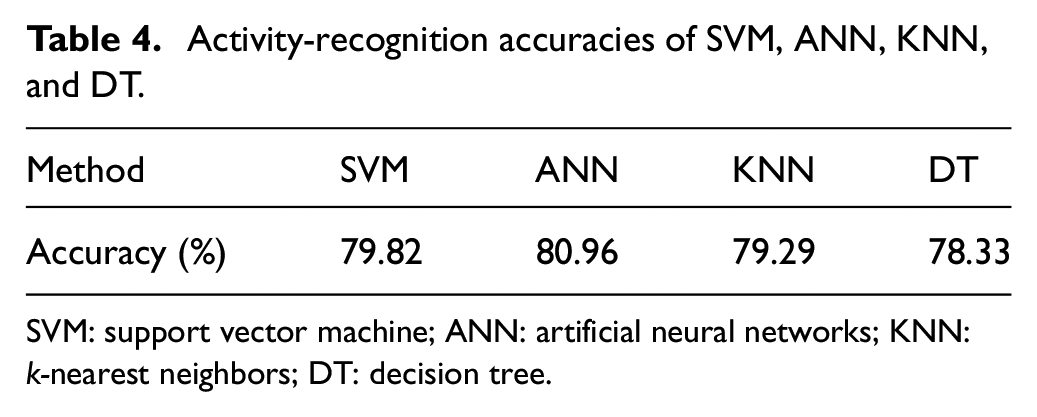
SVM: support vector machine; ANN: artificial neural networks; KNN: k-nearest neighbors; DT: decision tree.
Training data and test data discussion
The LDA-SVM, LDA-ANN, LDA-KNN, and LDA-DT combinations were compared for their activity-recognition accuracies on the training and test data. Table 5 shows the summary of the accuracies of the six activity-recognition algorithms on the data with conventional machine-learning technologies. Table 6 lists a summary of the accuracies of the six activity-recognition algorithms on the data after LDA feature-extraction scheme. Comparing to the Tables 5 and 6, we can find that the accuracy rates are improving after proposed LDA feature-extraction method. The results show that ANN exhibited the highest generalization capacity and was the best fit classifier for the test data in this study.
Accuracies and error rates of SVM, ANN, KNN, and DT on the training and test data without LDA method.

SVM: support vector machine; ANN: artificial neural networks; KNN: k-nearest neighbor; DT: decision tree.
Accuracies and error rates of SVM, ANN, KNN, and DT on the training and test data with LDA method.
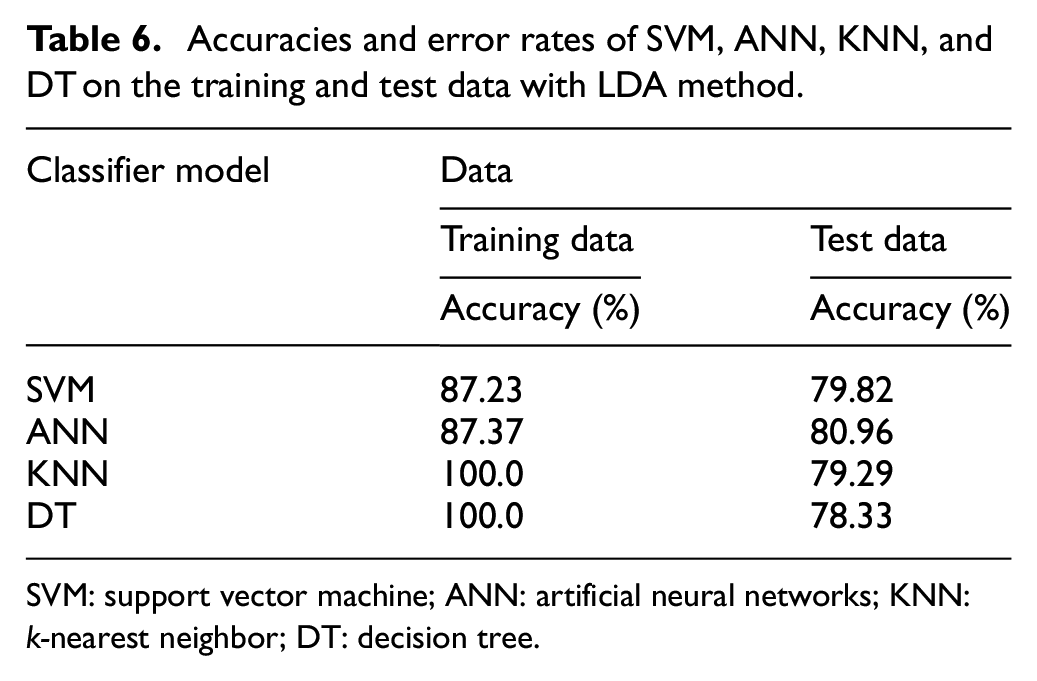
SVM: support vector machine; ANN: artificial neural networks; KNN: k-nearest neighbor; DT: decision tree.
Accordingly, ANN, KNN, and DT exhibited the highest accuracies for the training model; ANN featured satisfactory generalization capacity, KNN enabled rapidly identifying classes corresponding to specific data, and DT enabled rapidly determining the optimal strategy. However, for the test data, KNN and DT underperformed in generalization compared to ANN. In KNN, particularly, the data on walking and descending stairs could be easily confused for each other because of the excessively small distance between the two classes in the feature space. ANN, which incorporated a ReLU function to mitigate the overfitting between classes and gradient disappearance, exhibited the most stable recognition performance. With accuracies of 87.37% on the training data and 80.96% on the test data, LDA-ANN exhibited excellent generalization capacity on both groups of data.
Conclusion
This study incorporated an LDA-ANN classification system, which integrated a hardware wearable inertial sensor and a software activity-recognition algorithm. LDA feature extraction was performed in conjunction with ANN for recognizing the six types of daily activities performed by 20 participants, namely walking, ascending stairs, descending stairs, sitting, standing, and lying. The three-axis acceleration and angular velocity data were collected using the sensor, normalized, and classified through the LDA-ANN algorithm. According to the subsequent cross-validation results, the overall accuracy of the LDA-ANN algorithm was 87.37% on the training data and 80.96% on the test data. Accordingly, LDA-ANN is effective as an activity-recognition algorithm in inertial sensors and can be applied in assessing the body activities of people undergoing rehabilitation exercises.
Footnotes
Declaration of conflicting interests
The author(s) declared no potential conflicts of interest with respect to the research, authorship, and/or publication of this article.
Funding
The author(s) disclosed receipt of the following financial support for the research, authorship, and/or publication of this article: This study was supported in part by the Ministry of Science and Technology MOST (grant no. 108-2221-E-150-022-MY3) and the National Formosa University (grant no. 107AF06).