
Abstract
NiTinol, because of its several superior properties like shape memory effect, pseudoelasticity, corrosion resistance and biocompatibility, has become a promising member for various application areas including biomedical, micro-electro-mechanical system and aerospace. Poor machinability, lack of joining techniques and high cost of the material are presently restricting the use of the material in practical applications to its full potential. Laser welding is the majorly used fabrication technique for this material. The effects of welding on the bead geometry, microstructure, new phase formation, phase transformation temperature for laser welding of 2-mm thick NiTinol sheet in bead-on-plate configuration were investigated through this study using Yb-fiber laser in continuous mode of operation. Moreover, the mechanical properties of the joint were assessed by means of tensile tests and cyclic loading–unloading test. The functionality of the cyclic loading–unloading was tested by analysis of the mechanical hysteresis response up to 6% strain levels. Furthermore, the fractured surface was analyzed by scanning electron microscopy. Results revealed that the microstructure varied across the different zones of welding depending on temperature gradient and solidification rate. The microhardness value of the weld-bead was reduced considerably from that of the parent material. Brittle intermetallic compounds of Ti and Ni were formed during welding. It was also found that the welding greatly influenced the phase transformation temperature, overall mechanical behavior and the mode of failure in comparison with parent material.
Keywords
Introduction
A collection of “functional advanced materials,” having the characteristic of shape memory effect (SME), is known as shape memory alloy (SMA). In the year 1932, Ölander 1 observed the rubber like performance of the AuCd system and first reported the shape memory phenomena. An equiatomic Ni–Ti system, having the trade name of NiTinol, was first discovered by Buehler and Wiley 2 in Naval Ordnance Laboratory in the year 1960. Since its invention, it is the most popular SMA among designers and product developers. From the last decade, this alloy was extensively utilized in the ground of biomedical and medical industry3–5 due to its superior properties like SME, 6 excellent corrosion resistance behavior and very good biocompatibility, superelasticity (SE). 7 Nowadays, these materials are extensively exploited in the field of aerospace, micro-electro-mechanical system (MEMS), civil engineering, automotive industry and power plants.8–12
The mechanical properties of NiTinol, the most versatile SMA, can be attuned by either the variations in chemical composition or by thermomechanical processing. A solid-state diffusionless transformation between austenite phase and the martensite phase was the cause behind functional properties of the alloy. Austenite is known as the stable phase or parent phase, having ordered B2 structure, but martensite is unstable with B19′ monoclinic structure. The martensitic transformation is the main factor responsible for SME and SE. The ability to return to the first stable phase with the use of heat is known as SME. On the other hand, the ability to achieve a full recoverable high strain level due to the formation of stress-induced martensite (SIM) is known as SE. It is clear that the superior properties of SMA are entirely dependent on structure of the alloy, which is basically a function of microstructure and chemical compositions. From the above discussions, it could be said that any fusion welding system must affect the mechanical properties of NiTinol. Despite all the limitations in fabrication of NiTinol components by traditional methods, 13 getting good quality joints in NiTinol without much hampering the superior qualities is mostly desired.
Between all other sources of energy, laser is the typically favored for many engineering applications (such as surface treatment, 14 joining,15–20 etc.) because of the superior properties of the system: high processing speed, capability to attain reasonable control of heat input, minimum residual stress, good weld-bead profile and narrow width of heat-affected zone (HAZ). Formation of brittle intermetallic phases and the precipitation of the same on the grain boundaries significantly affect the mechanical behavior, namely, ultimate tensile strength (UTS) and elongation to rupture of the laser-welded samples. As higher rate of solidification is achieved in laser welding, the precipitation of these brittle phases can be significantly reduced by laser welding. Due to these benefits, laser welding is now widely used for fabrication of different engineering materials including Cu–Ni alloy, 15 aluminum alloy, 16 different types of steel17–19 and plastic. 20
Understanding the consequences of laser welding on the functional behavior such as SME, SE are the primary criteria for successful practical applications of laser-welded NiTinol samples as described by Eggeler et al. 21 The effect of laser welding on the mechanical behavior and functional properties of NiTinol was investigated by several researchers.22–27 It was established through studies that the thermal cycle of laser welding creates a microstructural gradient from weld-bead toward the base material all the way through HAZ.
Oliveira et al. 22 reported that though SME of weld-zone and HAZ were preserved after welding, there might be changes in the transformation temperatures of those regions in comparison with those of the base material. Falvo et al. 23 studied the two-way SME of Nd:YAG laser-welded 1.15-mm thick sheets of NiTinol. They reported a boost in two-way shape memory strain in the base material with the rising number of training cycles. However, the welded specimens showed an augment of the same up to first five cycles and a consequent decrement with further increment of training cycles due to strong plastic deformation phenomena. Tuissi et al. 24 studied the effect of heat treatments in order to optimize the pseudoelasticity for two different conditions: partially annealed and fully recrystallized of Nd:YAG laser-welded NiTinol tapes. They concluded that there is very little modification of SIM and the recovery process of fully recrystallized material in comparison with base. Vieira et al. 26 reported superior mechanical, functional and cyclic behavior of laser-welded cold-rolled plates of NiTinol. The welded samples showed the presence of more recoverable strain than the base material. In their study, Falvo et al. 27 reported the mechanical properties of laser-welded NiTinol sheets. They showed a considerable decrease in both UTS and SME because of very low irrecoverable strain. For the evaluation of mechanical behavior of laser-welded Ni-rich SMA, Schlossmacher et al. 28 also reported the reduction of UTS along with the formation of SIM in Ni-rich SMA. Maletta et al. 29 studied how the laser welding affected the fracture mechanism of NiTinol sheets and reported some attractive comparison among the base material and the welded samples. Chan et al. 30 studied the effect of heat treatment on the cyclic deformation property of laser-welded NiTinol wires. They reported the decrease in tensile strength and fracture to elongation after welding. In the cyclic deformation test, post weld heat treatment (PWHT) up to specific temperature improved the deformation behavior through the reduction of accumulated residual strain. In another work, Chan et al. 31 reported the fatigue behavior of laser-welded NiTinol wires in small strain cycle bending study. Khan and Zhou, 32 in their study, reported the presence of multiple transformation peaks in between the high and low-temperature peaks. These peaks corresponded to R-phase transformation during phase transformation phenomenon. Oliveira et al. 33 also reported the presence of R-phase in the phase transformation sequence of YAG laser-welded austenitic NiTinol. During cooling a two-step conversion (from austenite to R-phase and from R-phase to martensite) occurred, but in heating cycle only one peak corresponding to conversion of martensite to austenite was observed.
From the existing literature, it was clear that the majority of the studies paid attention to the mechanical and functional behavior analysis of laser-welded NiTinol thin wires or sheets having diameter/thickness below 0.5 mm.30,31,34–36 Studies on mechanical properties of laser-welded NiTinol sheets of more than 0.5-mm thickness are very limited.26,36 Vieira et al. 26 reported the superelastic performance of laser-welded NiTinol sheet of 1-mm thickness. Hsu et al. 36 considered the cyclic deformation behavior of laser-welded 2-mm thick sheet.
The thickness of the sheet decides the overall heat content for full penetration welding. In case of thin sheet, though the overall heat content is less than the thick sheet, the solidification process of thick sheet is quick due to high rate of cooling owing to more volume of solid material in thick sheet, helping in rapid conduction of the heat from the weld-pool. As a result of which the solidification mechanism is entirely different for thin and thick sheets. Due to this difference, the thick sheets must have harder and finer microstructure in comparison with thin sheet. Even the tensile strength and the impact test data of the thick sheet showed the variation of result in comparison with thin sheet in case of arc-welded steel joints due to the variations in cooling rate and mode of solidification. 37 In case of thicker sheet, the bead volume should be more than that of thin sheet to make a sufficiently strong joint and as a result of which the residual stresses would increase in case of thick sheet. In case of resistance spot welding of aluminum sheet, same kind of observations was made by Sedighi et al. 38
Basically, thin wires and sheets are used for delicate applications in the field of MEMS and biomedical. On the other hand, the requirements of thick sheets and big diameter wires are vital for different structural applications. Hence, the study of cyclic loading performance, for large number of cycles, of laser-welded sheet of NiTinol with considerable thickness for structural application is a need of the time to recognize the viability of the utilization of laser-welded NiTinol sheets in such structural application. So it can be summarized from the above discussion that the study of mechanical performance of laser welding of 2-mm thick NiTinol sheet would be a completely different work in comparison with the same kind of study carried out for thin sheet or small diameter wire from application point of view as well as mechanism point of view.
The authors previously investigated the effects of process parameters on the quality aspects of weld-bead in laser welding of NiTinol sheets using fiber laser. 39 The present work concentrates on how laser welding affects the functional properties of 2-mm thick sheets of NiTinol in terms of tensile properties, SE and phase transformation behavior. This work mainly emphasized on superelastic behavior of laser-welded NiTinol samples for high number of cycles of cyclic loading.
Experimental details
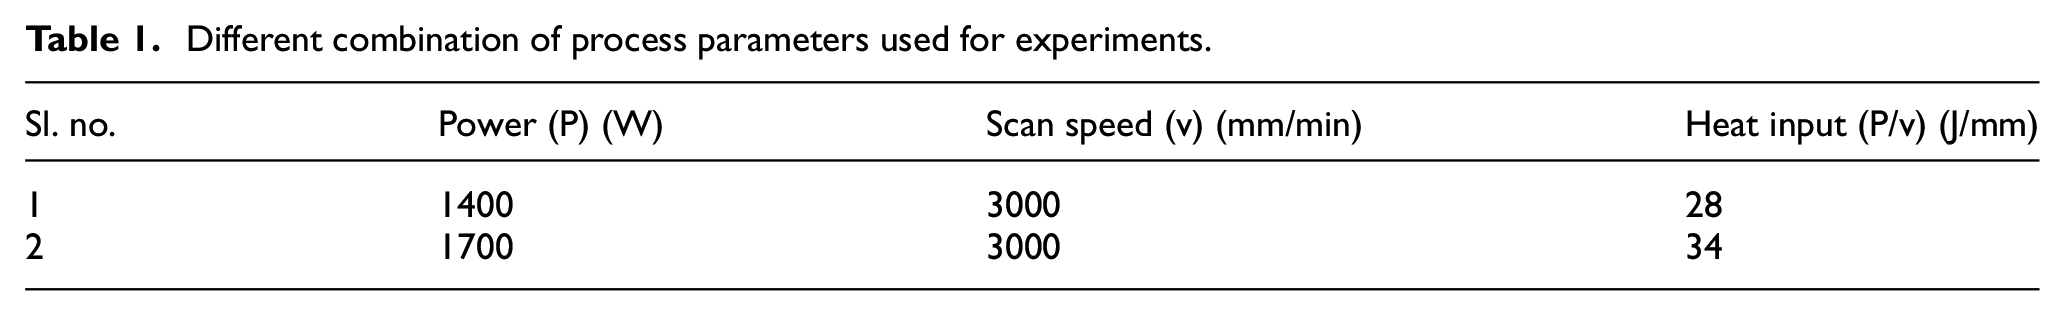
NiTinol sheet, having chemical composition of 52-atomic% Ni and 48-atomic% Ti, of 2-mm thickness was used as work-piece material for bead-on-plate laser welding experimentations. Before welding, the samples were cleaned in an acid solution of HF:HNO3:H2O with a concentration of 1:5:10 to eliminate any kind of surface oxide layers. Then, the samples were ultrasonicated for 5 min in acetone solution to remove any acid residue from the samples. The cleaned samples were welded using a 2-kW Yb-doped fiber laser system of IPG Laser (model: YLR—2000), having a wavelength of 1.06 µm and 200-mm focal length, in continuous mode of operation. A focal spot of diameter 400 µm was set on the top of the sample. The work-piece was protected from atmospheric contamination using Ar as shielding gas at a flow rate of 7 L/min. Table 1 shows the values of laser power and scan speed selected for the experimentation. The overall heat input value was selected in such a way so that full penetration narrow weld-bead with different morphology could be achieved. These values were identified through pilot experiments, done before the actual experimentation. Figure 1 represents the schematic experimental setup.
Different combination of process parameters used for experiments.
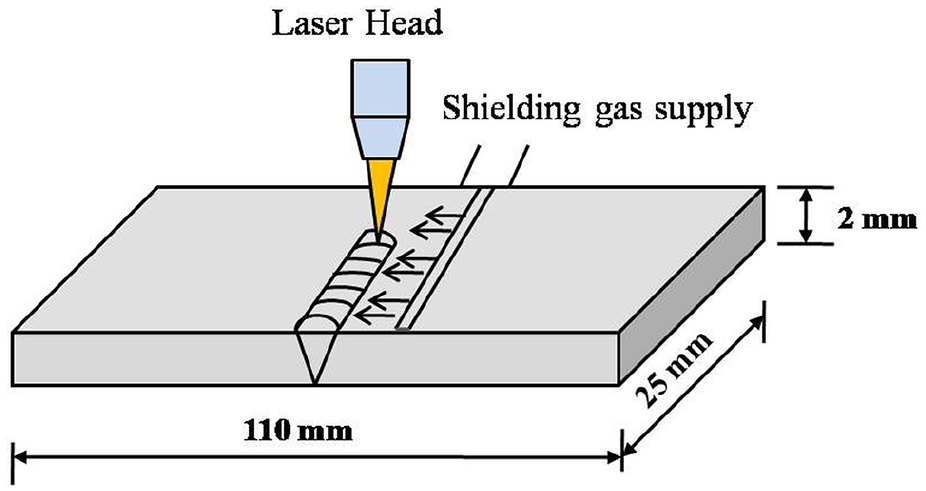
Schematic representation of experimental setup of laser welding system.
After completion of welding, the tracks were cut at some distance from the edge of the plate to get the regularity in cross section of the weld-bead by avoiding the edge effect, and the cut cross section was manually polished by mechanical means. Etching was carried out in an acid solution of HF:HNO3:H2O = 3:7:21 for 30 s to expose the weld-bead profile. Zeiss zoom microscope was utilized to obtain the weld-bead profile geometry data. The metallographic samples were analyzed using inverted optical microscope (model: Axio Vert.A1, make: Zeiss) for obtaining the microstructural information. Microhardness test was conducted on the etched cross section of the bead using Vickers microhardness tester of Omnitech, India (model: S.Auto). For measuring the variation in microhardness across the weld-bead, HAZ and the base material, a load of 50 g with 10-s dwell time was applied by diamond pyramid indenter. To identify the generation of new phases, X-ray diffraction (XRD) analysis of the welded and the parent samples was carried out using PANanalytic EMPYREAN system with Cu-Kα radiation.
ASTM E8/E8M—15a standard was used for cutting tensile test samples using wire electrical discharge machining (wire-EDM) process. A drawing of a typical tensile sample with measurement is given in Figure 2. Tensile test was performed with the help of load cell–type universal testing machine (Instron 8862) at a traverse head speed of 0.5 mm/min, and a regular gauge length of 25 mm was chosen for all mechanical tests. Initially, uniaxial tensile test was executed with a single loading cycle until the rupture took place. After the completion of tensile test, images of the fractured surfaces were captured using the scanning electron microscope of Zeiss (model: EVO 18 Research) to obtain an idea about the type of failure in the test specimens. From this tensile test, the UTS data and elongation until fracture were recorded and those data were used to fix the condition for cyclic loading test with the same gauge length and traverse head speed. Cyclic loading tests for 2%, 4% and 6% strains for 300 cycles for all the welded samples as well as the base material were carried out.
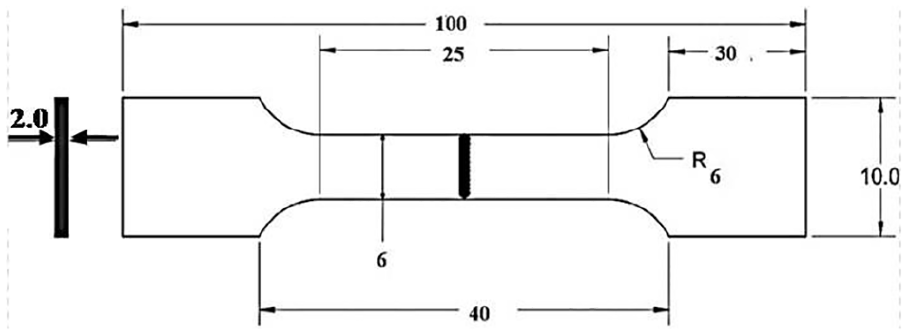
Tensile test samples with measurements.
For characterization of the SME of NiTinol-welded and parent specimens, differential scanning calorimetry (DSC) test was accomplished with the help of PerkinElmer Pyris Diamond DSC system, with chilled cooling system. DSC curves were documented in a temperature range varying from −150 °C to 150 °C using restricted heating and cooling phenomena at a rate of 10 °C/min. The conversion temperatures were calculated using Pyris™ Software, considering the ASTM F2004-05 standard.
Results and discussion
Bead geometry
Figure 3 displays the macrographs of the weld-bead profile for different parametric combinations. It was clear from the study that with the change in heat input, the bead shape got changed. With the increase in heat input, the melt volume of the bead got gradually increased. From the figure, it is clear that at 1400-W power, that is, at heat input value of 28 J/mm, prominent wine-glass-shaped bead, with the wider top and narrow leg, was formed. On the other hand, at 1700-W power, that is, at heat input value of 34 J/mm, the bead was glass-shaped with almost equal top and bottom dimensions and narrow neck portion. Generally, wine-glass-shaped profile was indicative of key-hole mode of welding. Power density was increasing with the increase in heat input, and the power density value for both the cases (>105 W/cm2) was high enough to form the deep penetration mode of welding. The bead shape for 1700 W was different from that of key-hole mode of welding because of the comparatively lower value of scan speed at that level of power. Because of the higher value of heat input and the comparatively low value of scan speed, the liquid phase of the metal contained more amount of heat for a longer time for 1700-W power. As a result of this, the bead shape got changed by increasing the melt pool volume. An in-depth study of the variations of weld-bead profile geometry with operational parameters was reported by the authors previously. 39 A good quality weld-bead should be fully penetrated bead with minimum melt volume. So from Figure 3, it was clear that at 28-J/mm heat input (3000-mm/min scan speed and 1400-W power) could be used for getting good quality fully penetrated bead for 2-mm thick NiTinol sheet welding. Figure 4 gives the quantitative value of top bead width for both the heat input. It was also observed that crater at top and bottom surfaces of the weld-pool were formed at high power level, that is, at 1700 W. In case of welding, generally, highly focused beam of laser is incident on the surfaces to be joined and the material is melted without vaporization. If the transferred energy is very high, the material loss from the weld-pool may occur and it forms crater. 40
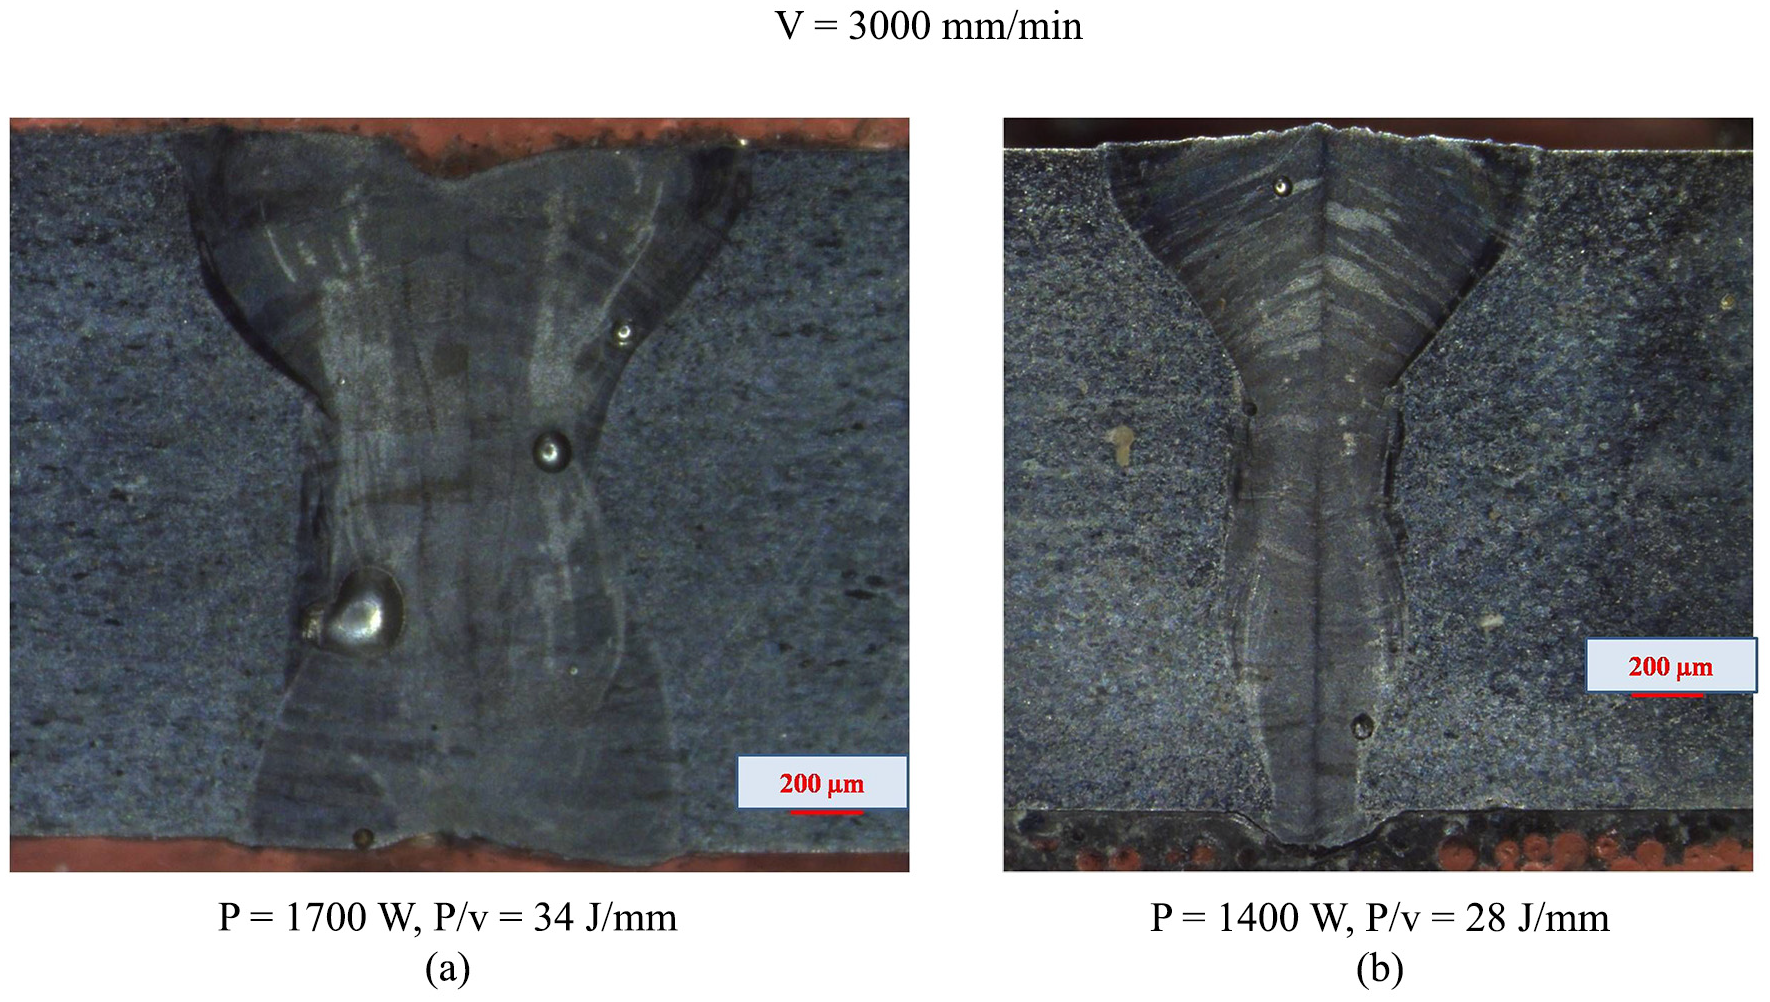
Optical images of weld-bead profiles.
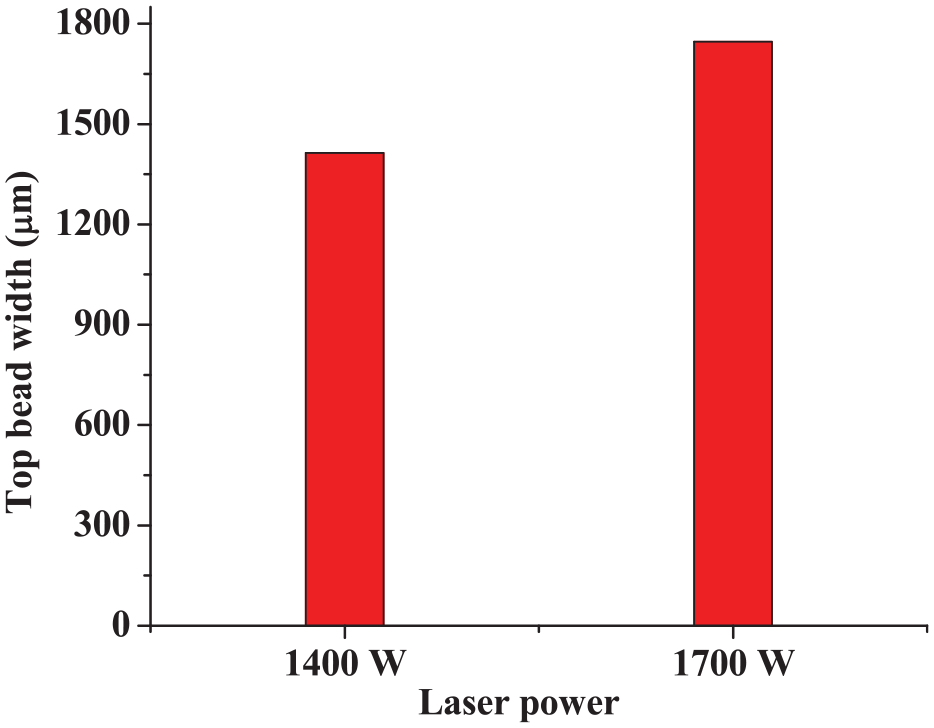
Variations of bead width for different power.
Porosity originated from gas entrapment during welding is clearly visible in Figure 3. From the bead shape, it is clear that the occurrence of porosity is much higher for the wider bead shape having crater on the surfaces. This may be attributed to the higher amount of gas entrapment inside the bead due to loss of material for laser welding done at a sufficient high value of heat input. Due to the presence of porosity, the weld-bead strength would reduce. The formation of such kind of defects could be reduced by closed chamber Ar-gas shielding instead of Ar flow from top and bottom of the plate.
Microstructure
The microstructure of the solidified weld-bead completely depends on the composition of alloy, rate of solidification (R), temperature gradient (G) and under cooling (ΔT). G/R ratio controls the mode of solidification, whereas cooling rate (GR) makes a decision on the dimension of the structure. Solidification rate was steadily increased from the interface toward the weld centerline, whereas temperature gradient got reduced steadily. As a result of which epitaxial grain growth phenomena started from the fusion line (refer Figure 5(a) and (b)). In the beginning of grain growth, partially melted base material grains beside the interface acted as the seeding crystal.
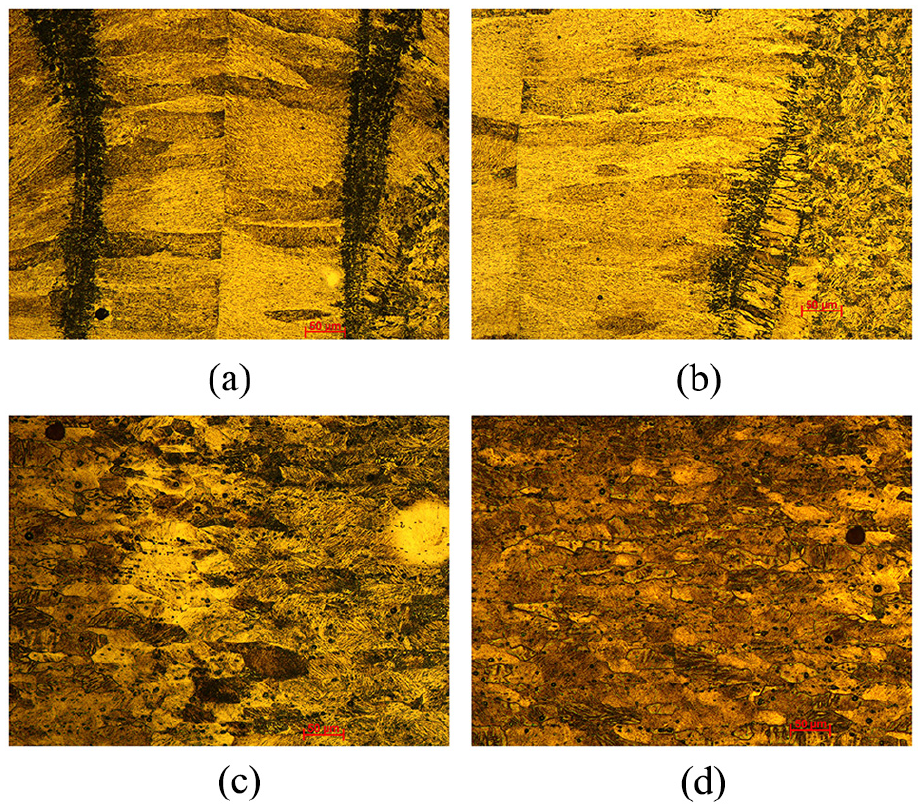
Microstructure of the welded sample for 1400 W: (a) weld-bead centerline; (b) interface of weld-bead and HAZ; (c) HAZ; and (d) base material.
When solidification process continues to the weld center of the bead, dendritic structure was produced. The rapid cooling of the molten pool, after laser power termination, helped in the development of dendritic structure in the weld-bead. A small region of small columnar grains was formed near the fusion interface due to competitive grain growth phenomena. The grains in the center of the bead were almost perpendicular to the weld center (refer Figure 5(a)). HAZ consisted of recrystallized grains with the coarser size (refer Figure 5(c)), whereas the base material grains were finer (refer Figure 5(d)) in size. It was observed that with increase in laser power the microstructure of the weld became coarser because of the high rate of heating and cooling at constant scan speed, which is in line with the previous work of the authors. 39 The presence of some needle like structure in the microstructure of the base material was confirming the presence of some amount of martensite along with the predominant presence of austenite phase.
XRD analysis
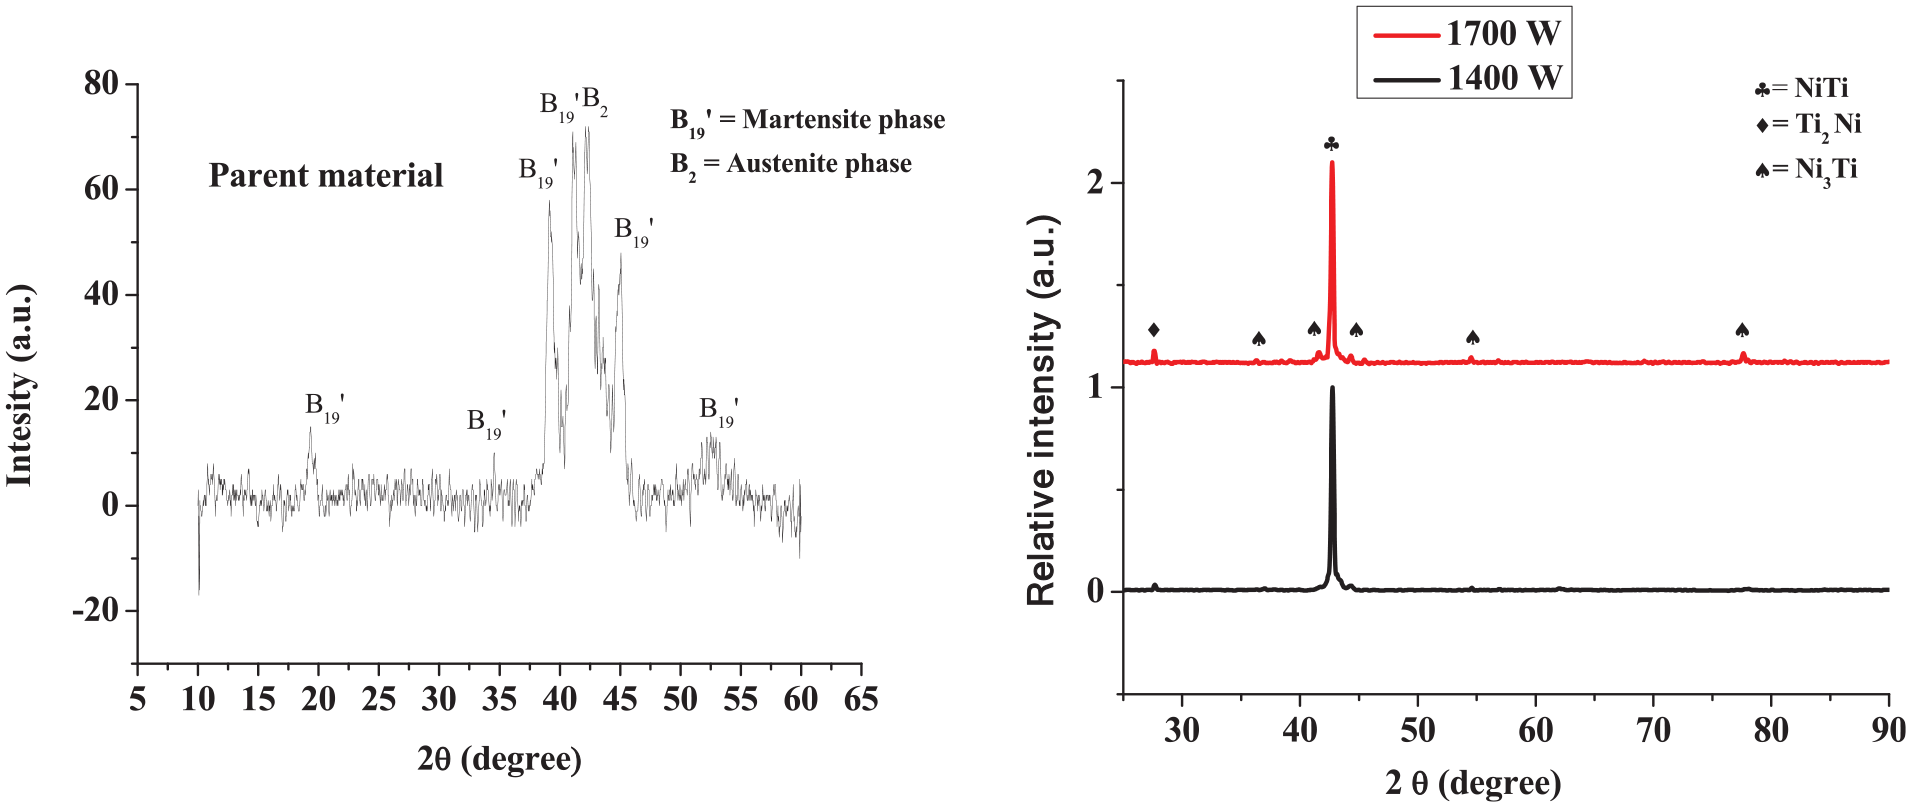
Figure 6 shows the room temperature XRD data in order to identify the different phases present in the base material as well as welded samples. In the base material, both austenite and martensite phases were present. Austenite is the high-temperature stable phase having cubic structure, whereas martensite is the low-temperature phase having monoclinic structure. In the laser-welded samples, creation of different intermetallic phases of Ni and Ti was identified. Predominantly, Ni3Ti and Ti2Ni were formed during welding but their relative amounts were varied with the variation of heat input. As the base material was rich in Ni, the relative quantity of Ni3Ti intermetallic phase was more than that of Ti2Ni. It is clear from the graph that with the increase in heat input the relative intensity of different intermetallic picks was increased.
XRD results for analysis of phases present in the base material and welded samples at different combinations of input parameters.
The study on different phases present in the weld was vital to understand the functional and mechanical properties of the joint. Among various available intermetallic phases of the Ni–Ti system, Ni3Ti41,42 and Ti2Ni43,44 are known for diminishing the joint strength and making the joint brittle because of their inherent brittleness. The precipitation of intermetallics and the alteration of the chemical composition due to the precipitation of these brittle phases had adverse effects on the mechanical properties, 45 shape memory properties of the joint.22,36
Microhardness
Figure 7(a) presents variations of microhardness across the weld-bead for 1700-W power. The minimum value of microhardness was found in the weld-bead, and it was varied from 250 to 268 HVN0.05. Microhardness value gradually increased from the weld-bead interface through HAZ, and it reached the maximum value of 350 HVN0.05 at the base material. The variation in the microhardness was due to the variations in grain size in different zones of welding and the inhomogeneous chemical composition. The coarser the grain, the more will be the reduction in the value of microhardness in the weld-zone from that of the base material. The microstructural and chemical homogeneity in the base material is the reason behind the maximum value of microhardness. Same observations for the reduction of microhardness value in bead were also reported by previous researchers.44,46
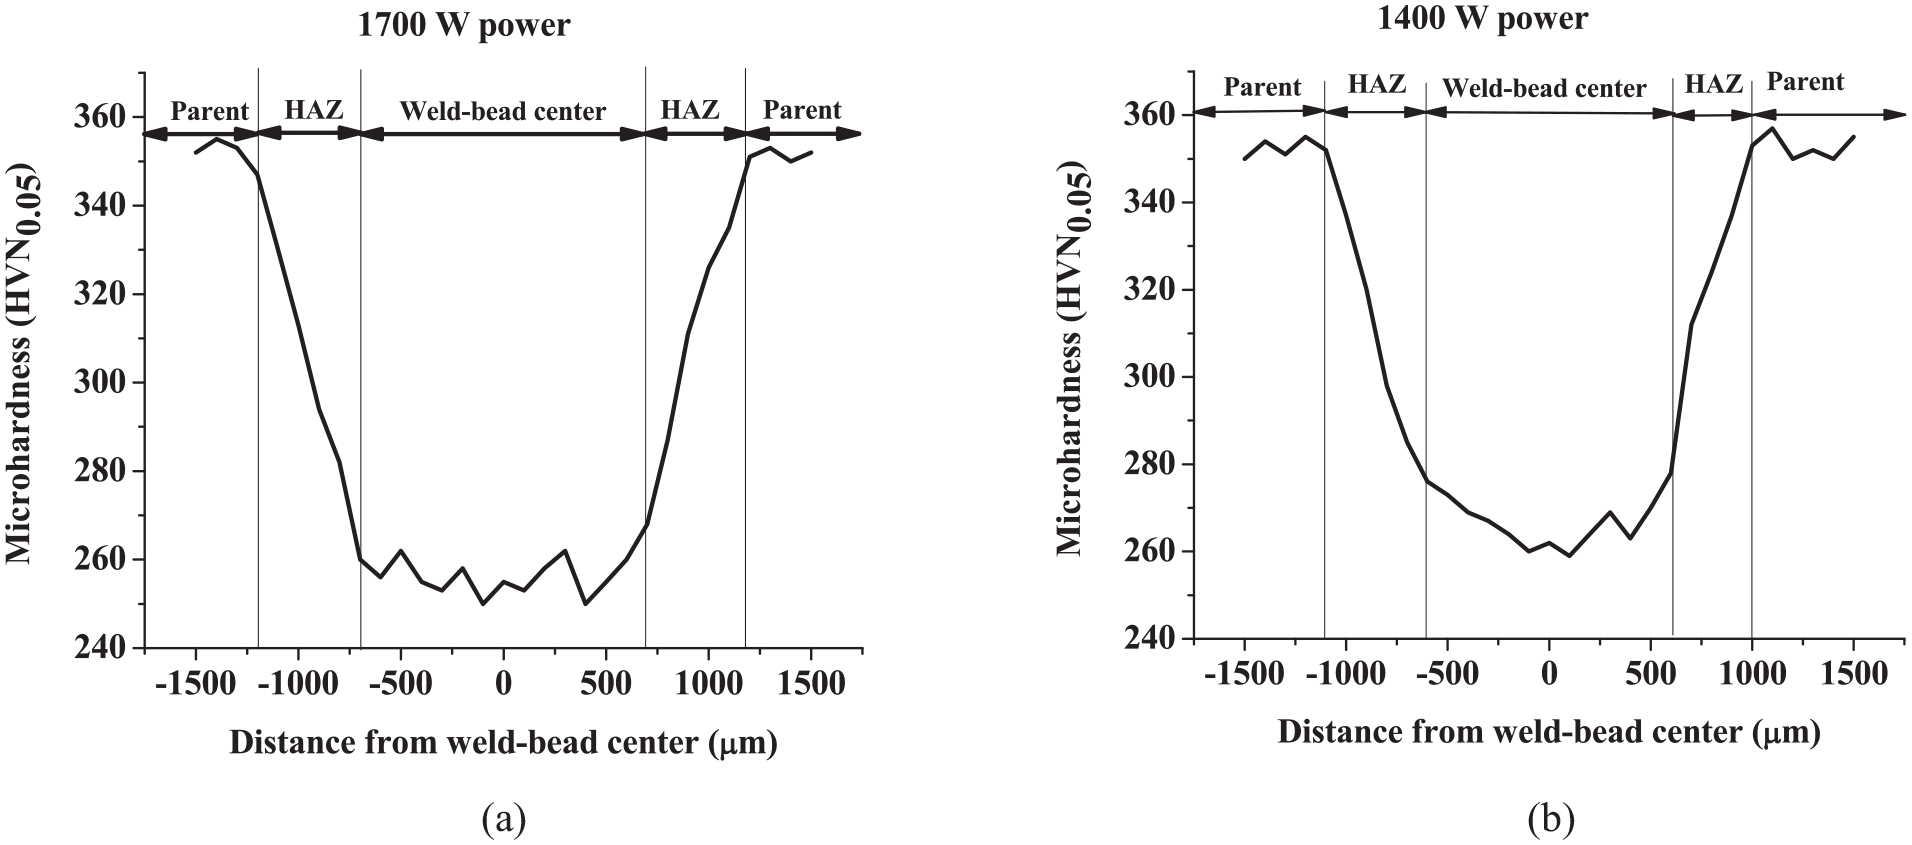
Microhardness profile variations across the bead for (a) P = 1700 W and (b) P = 1400 W.
It was also observed from Figure 7(a) and (b) that with increase in laser power vis-a-vis heat input, the reduction in the value of microhardness was more because of the comparatively coarser grain structure was formed due to high heating and cooling rate.
Differential scanning calorimetric analysis
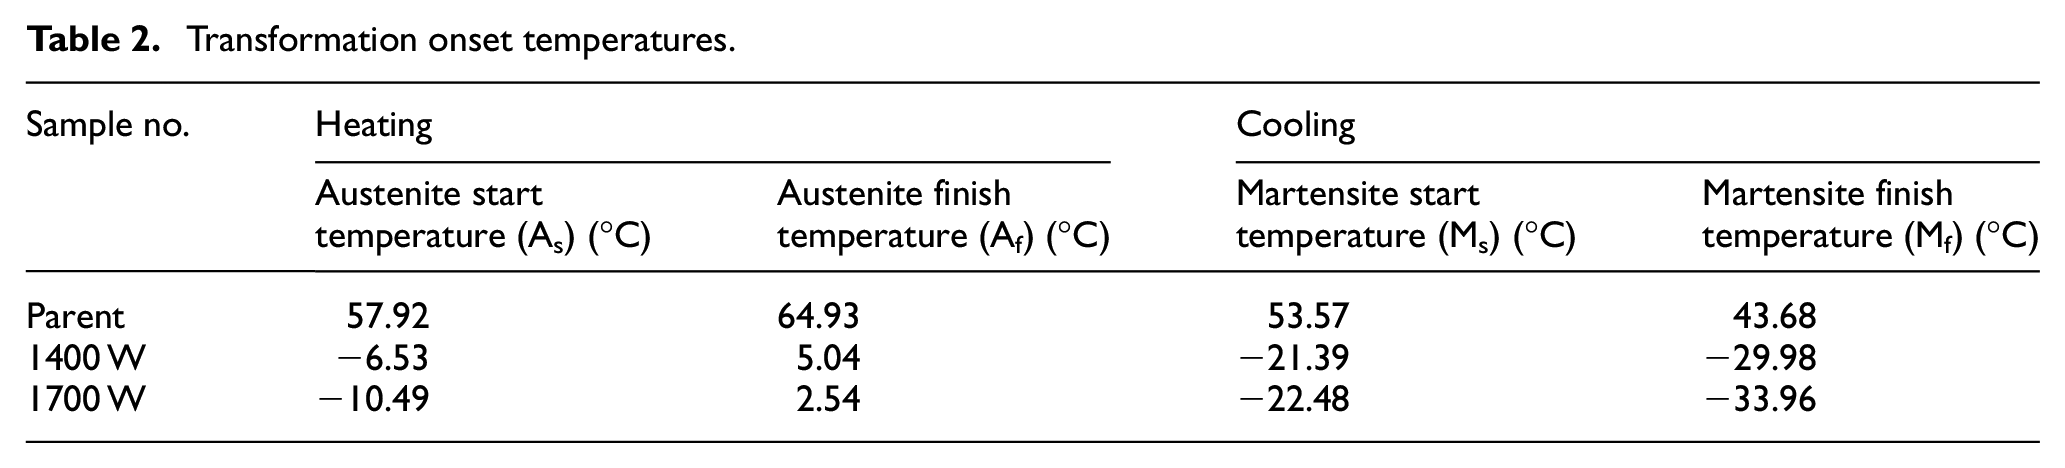
The phase transformation behavior of the base material and laser-welded samples was compared with the help of DSC curves. Figure 8 shows the DSC curves for both welded and un-welded samples. There are two phases of NiTinol. One is high-temperature stable phase, having simple cubic structure, which is known as austenite phase (B2). The other phase, known as martensite phase (B19′), is low-temperature unstable phase with monoclinic structure. The peaks in DSC curves are indicative of solid-state phase transformation between these two phases. One stage transformation sequence in heating and cooling curve was identified for both the parent and laser-welded samples. Table 2 represents the transformation onset temperatures, as obtained from DSC peaks. It is clear from the table that the transformation temperatures got considerably reduced after welding, though the transformation range (difference between the start and finish temperature of each phase) of any phase was almost the same for both welded and parent samples. Basically, the laser welding process generated the lattice dislocation through the deposition of various intermetallic phases which in turn affected the microstructure of the welding and would also increase the residual stress after welding.39,42,47 These were the reason behind the reduction of phase transformation temperature after welding.
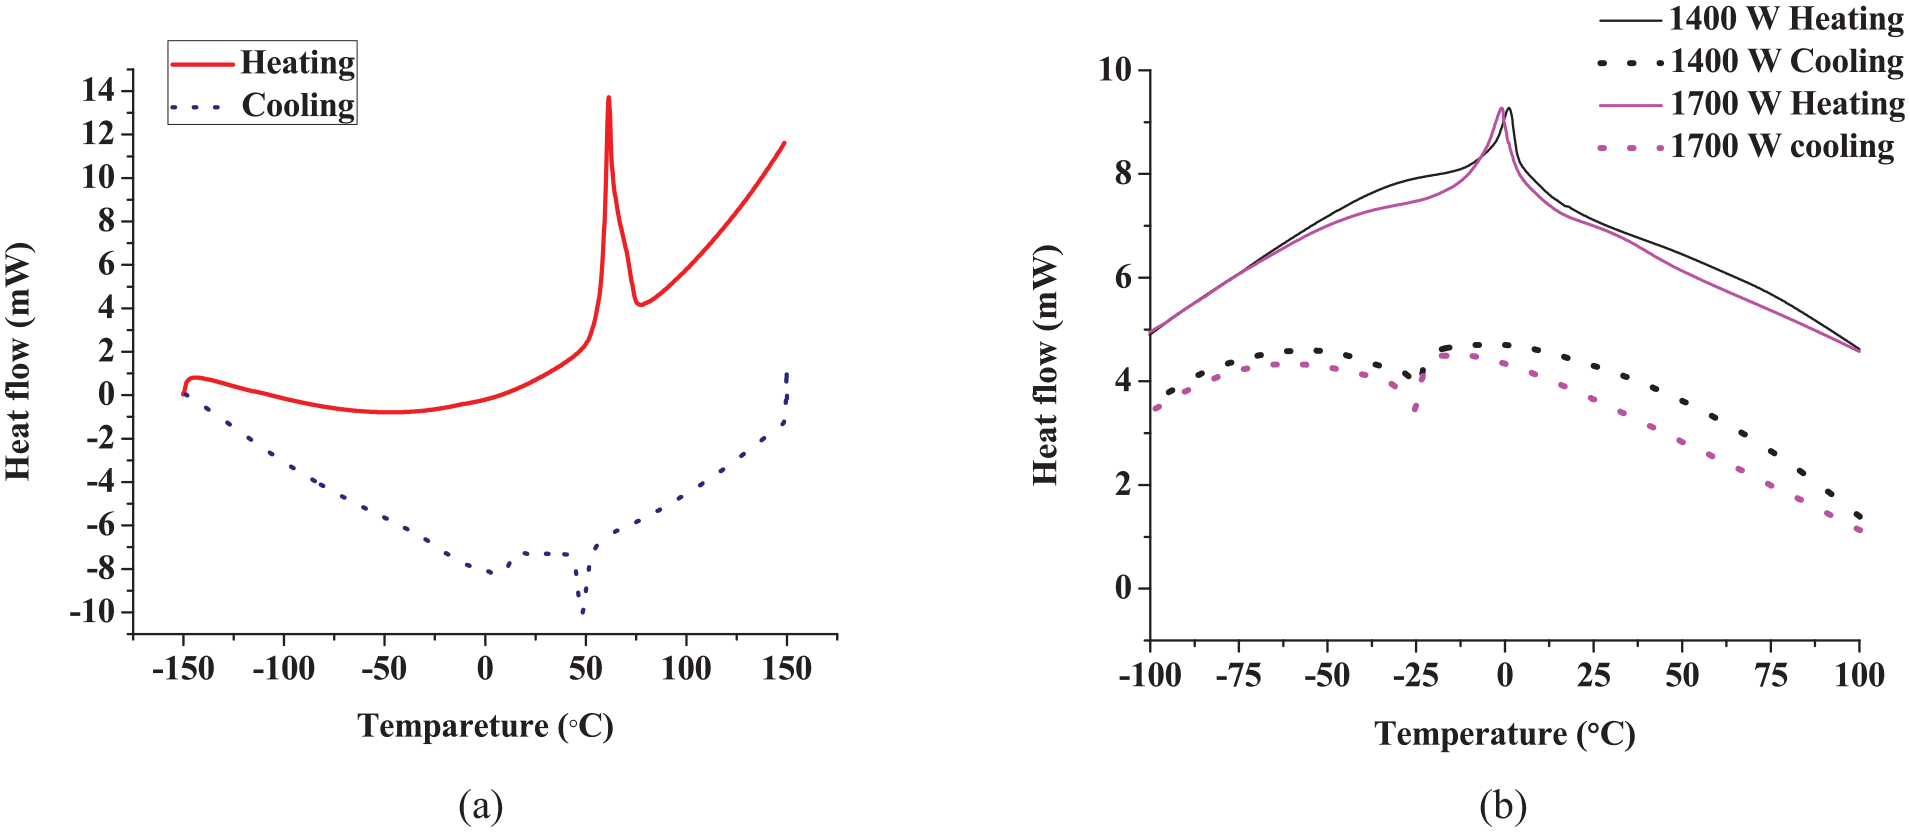
DSC curves showing the phase transformation temperatures for (a) NiTinol base material and (b) welded samples.
Transformation onset temperatures.
Tensile test
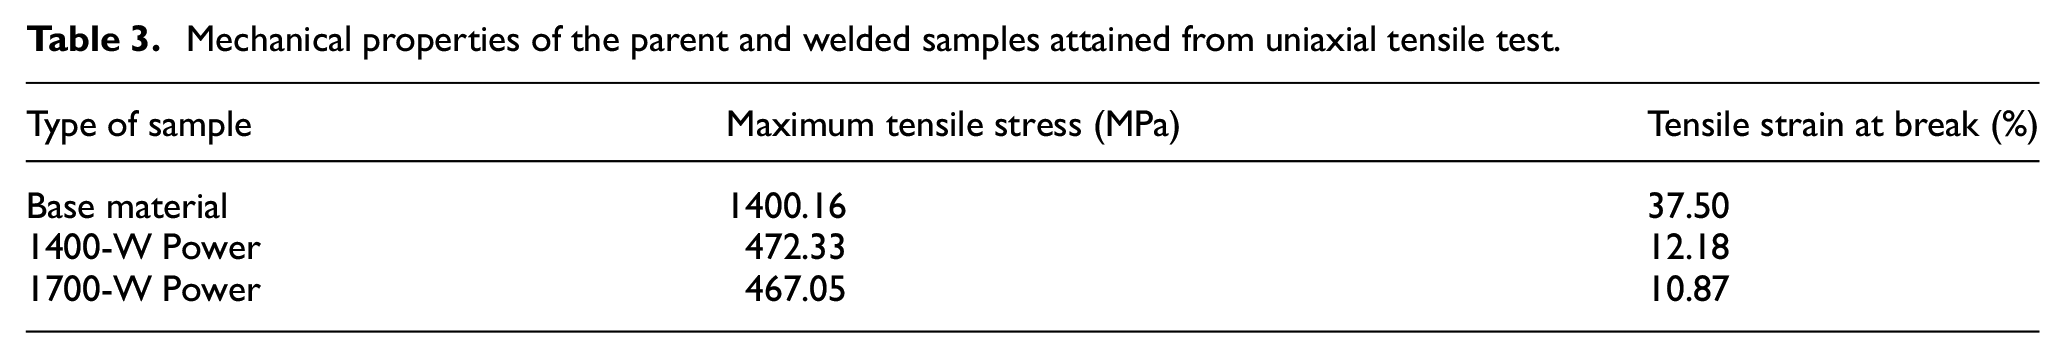
Figure 9 shows the tensile test performance of both the base material as well as the welded samples. A pseudoelastic characteristic with three different zones in the stress–strain curve of the base material was prominent. The stress plateau was formed at a stress level of around 275 MPa for the parent material. With gradual raise of load, the material failed at a stress value of 1400 MPa. From Table 3, it is clear that the maximum strain which material could withstand before failure was 37.50%. In case of laser-welded samples, ultimate tensile stress varied in the range of 460–475 MPa and the maximum attainable strain up to fracture varied from 10.87% to 12.18%. It was also evident from the stress–strain diagram that with the increase in laser power, that is, with the increase in heat input, the tensile properties of the welded samples deteriorated more. The stress plateau was formed around 315-MPa stress level for laser-welded samples, but all three different phases of pseudoelastic behavior were not prominent in the graph, as failure occurred much prior to attain the plastic deformation zone of the welded samples. Though there was no significant difference in the tensile value of the laser-welded samples, it was prominent that with increase in laser power the maximum tensile strength value gradually reduces with reduction in maximum attainable tensile strain value due to coarser structure of the weld with high heat input value.
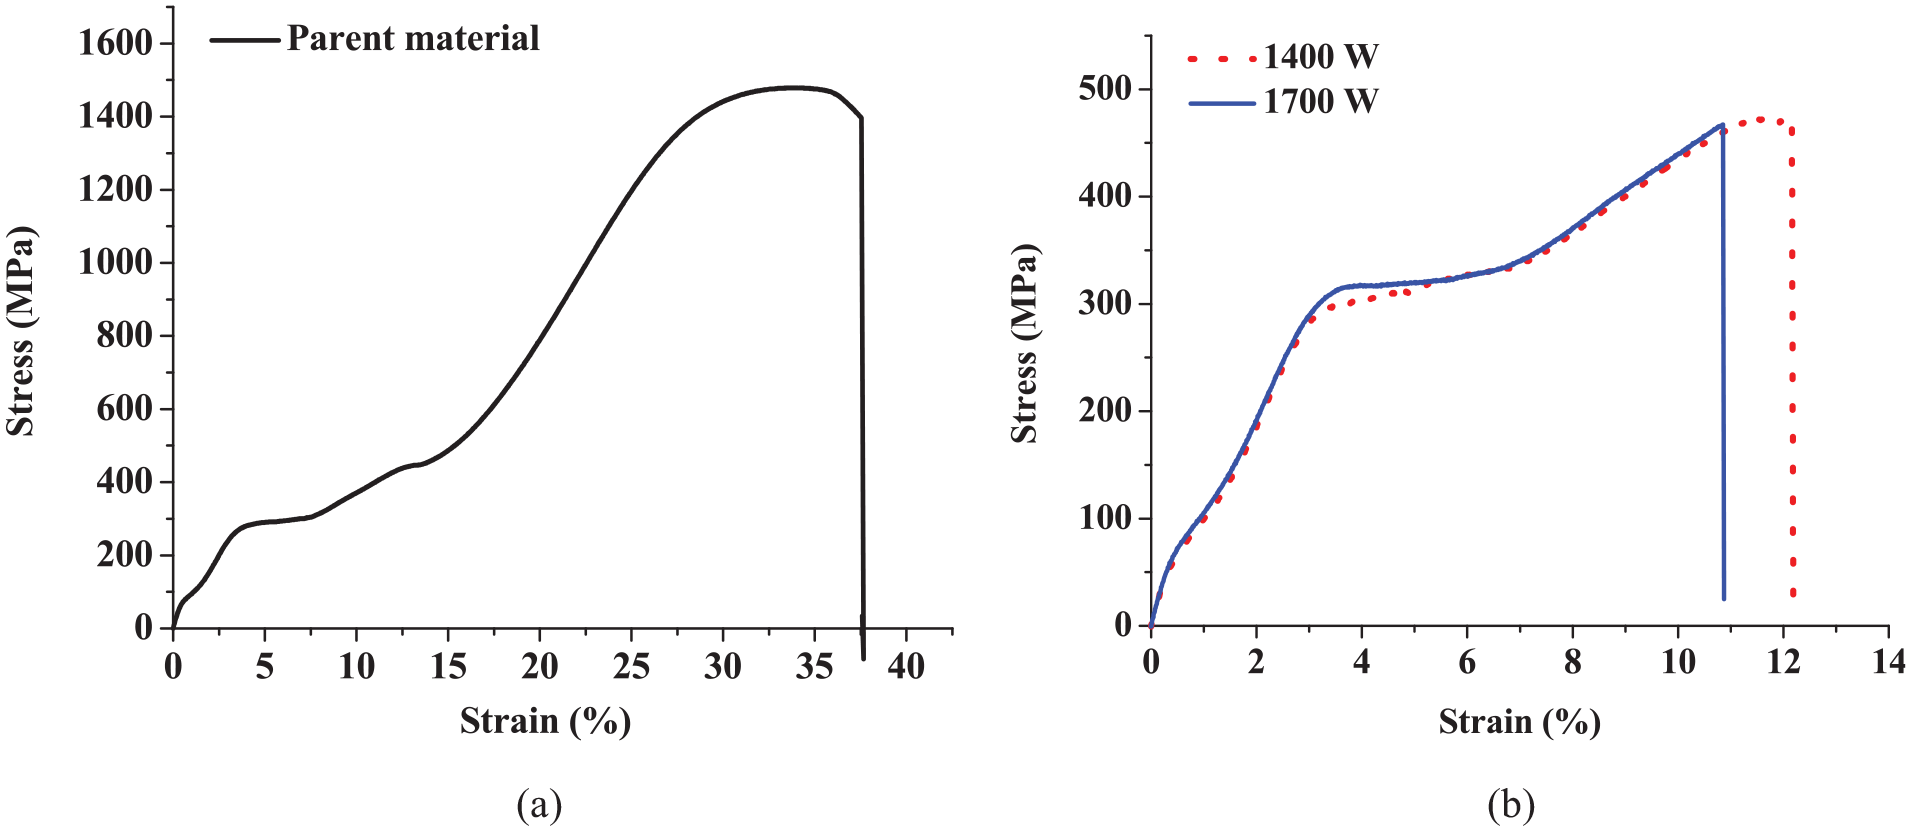
Tensile test graphs showing (a) base material, (b) welded samples achieved for welding at different combination of input parameters.
Mechanical properties of the parent and welded samples attained from uniaxial tensile test.
The reduction in tensile strength of the joint was attributed to different factors including generation of brittle intermetallic phases, precipitation of the intermetallics on the grain boundaries during solidification and the coarser grain structure of the weld and different kinds of welding defects including porosity.26,46
Fracture surface analysis
From the scanning electron microscopy (SEM) image of the fractured surface of the tensile test specimens, it was apparent that the mode of failure was different for parent and welded samples. In case of base material, ductile mode of failure with the formation of dimpled structure on the fractured surface (refer Figure 10(a)) was observed. Presence of both the transgranular cleavage structure and dimple structure on the fractured surface of laser-welded samples was indicative of the mixed mode of failure (refer Figure 10(b)). The formation of brittle intermetallic phases during welding, as identified by XRD analysis, helped to change mode of failure from pure ductile mode of parent sample to mixed mode of failure by introducing transgranular cleavage structure on the fractured surface of welded samples.
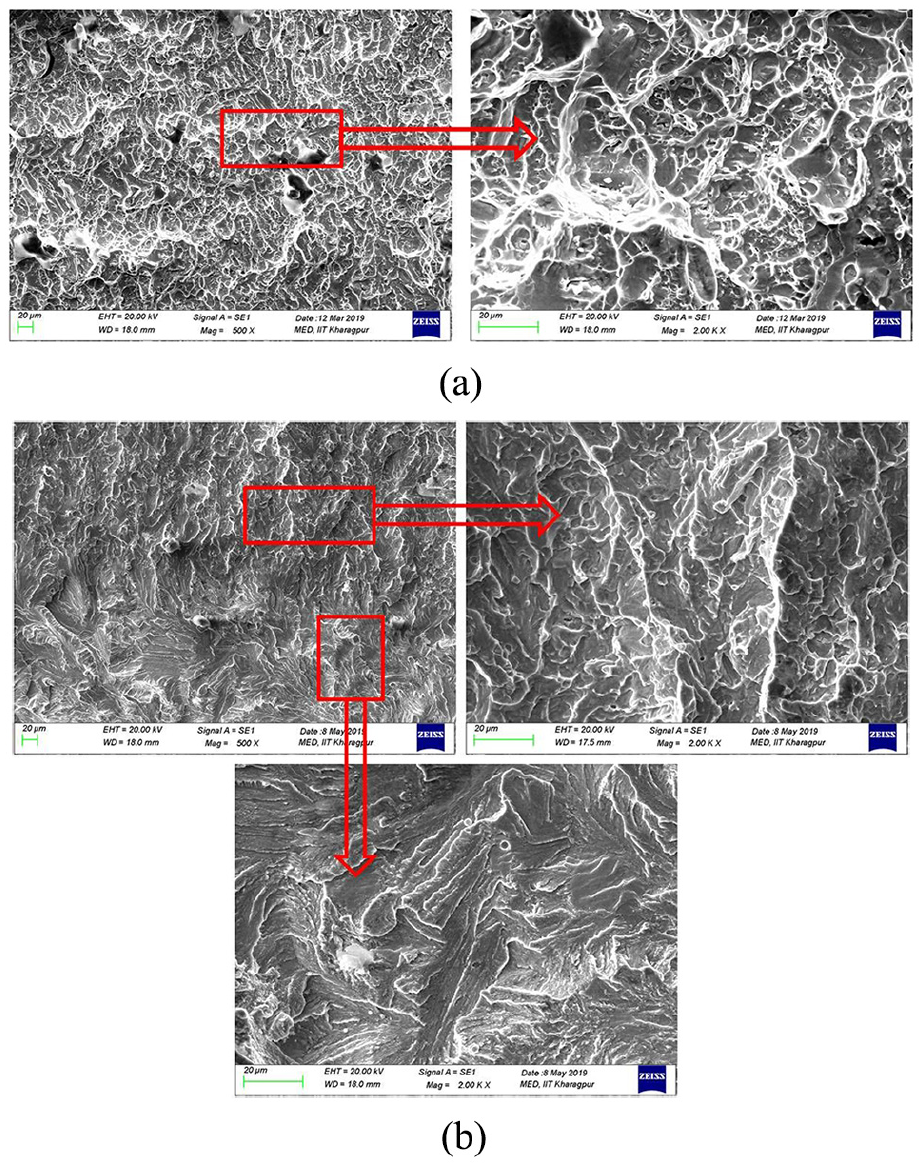
SEM image of fractured surface of tensile test samples: (a) base material; (b) laser-welded samples at 1400 W.
Cyclic load–displacement behavior of NiTinol
Cyclic load–displacement behavior of NiTinol laser-welded samples was compared with that of the base material for different constant strain values. Here, the initial position of the head was considered as the reference point for measurement of displacement incrementally from the reference point. Most of the NiTinol’s fatigue study was performed under constant strain condition. The cyclic stress–strain behavior can be explained from uniaxial tensile stress–strain curve of NiTinol. The stress was linearly increasing with strain in the elastic region of the curve. After reaching the stress plateau, the strain value increased continuously but the stress value became constant due to SIM formation or detwinning mechanism of the martensite. As a result of which stress became constant for a wide range of strain. This makes constant stress-based condition less visible than strain-based condition. Even from the perception of experimental setup, strain-based system requires less complicated equipment in comparison with stress-based system.
The graphs are presented in Figure 11. The constant strain value was selected depending on the uniaxial tensile test result. The constant strain values were varied within the maximum strain that could be achieved before the fracture of the laser-welded sample in simple tension tests. The selected constant strain values are 2%, 4% and 6% for all the welded and base material. Selected 2% strain level was below the stress plateau for the parent samples as well as welded samples, but 4% and 6% strain levels were beyond the beginning of stress plateau for all samples (refer Figure 9(a) and (b)). For 2% strain, the curves, showing the cyclic loading and unloading behavior, were very uniform as the applied strain percent was very less. Though no significant plastic deformation was obtained after each cycle, the hysteresis loop was offset in the tensile direction, which signified elongation of the sample with a resultant permanent shape change of minimal value after a number of tensile cycles. It is also clear that the hysteresis loop became narrower after a number of applied cycles than that of the initial cycles. Narrowing of hysteresis loop and cyclic hardening could be attributed to accumulation of dislocations. From this observation, it could be predicted that the microstructural changes might occurred during tensile cycling. Due to cyclic loading and unloading, the material was stress hardened, as a result of which the maximum load at the maximum strain got increased with the increasing number of cycles. Though the stress hardening of the samples was increased at the faster rate in the initial cycles, the stress got increased in a slower rate after a significant number of cycles causing cyclic stabilization. Even the positive loading condition versus negative loading conditions of the graphs showed a definite anisotropy in the cyclic loading behavior. The absolute value of load in positive loading condition is much higher than that of the negative loading condition. The dissimilarity in positive and negative loading behavior of engineering materials is described as anisotropy. The asymmetry in tension–compression behavior of NiTinol could be attributed to the theory of phase transformation and crystal structure of different phases. The martensite variety generated in tension must be different from those generated by compression. Due to these differences, plateau stress, shape recuperation strain and critical shear stress became different. Even it was clear from the graphs that the maximum load-bearing capability at a constant attainable strain value in the positive direction was gradually reduced with increase in laser heat input.
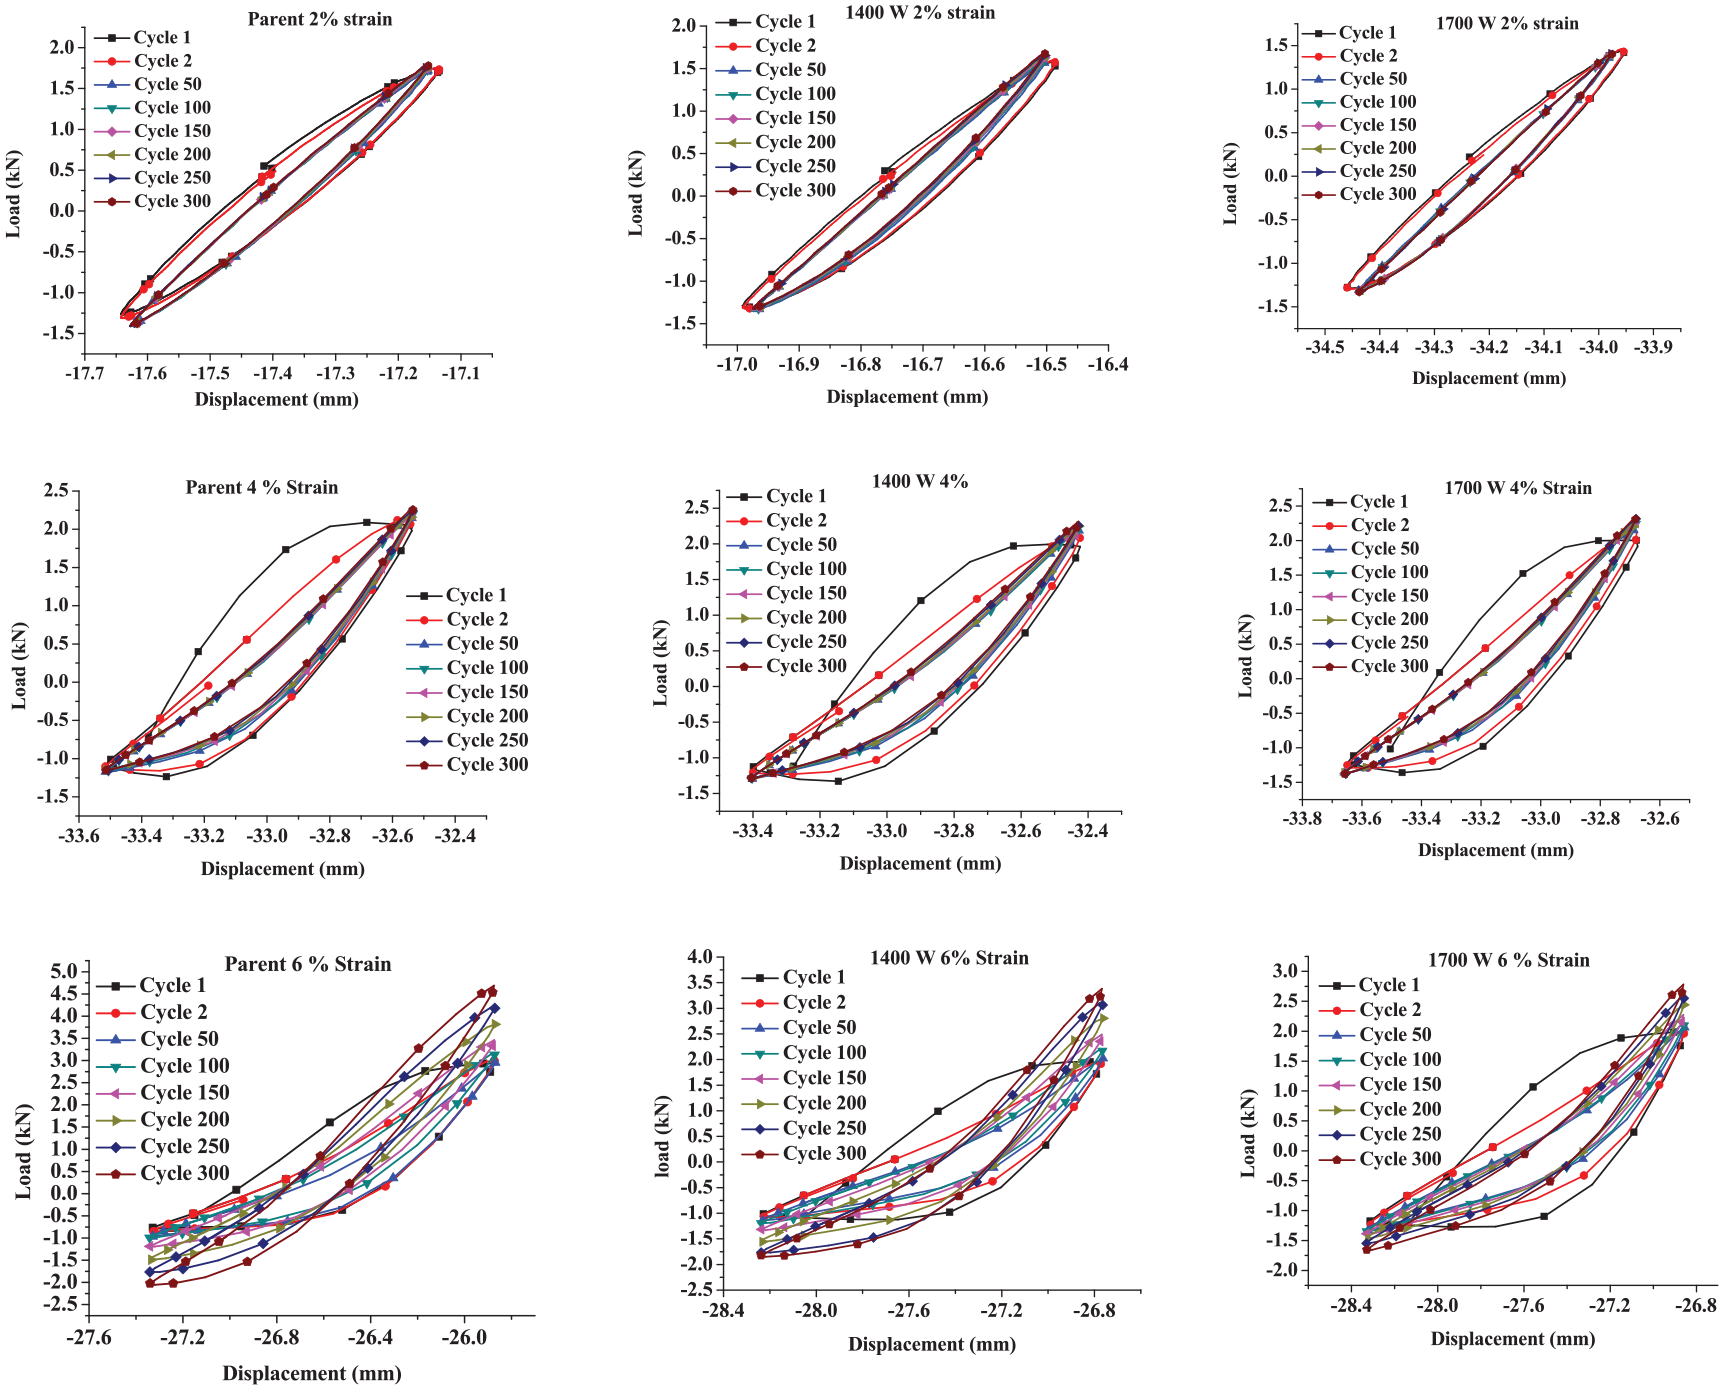
Cyclic load–displacement curves obtained at room temperature under constant strain tension–compression conditions for NiTinol sheet.
Conclusion
From this study of bead-on-plate laser welding of 2-mm thick NiTinol plate, the following conclusions could be drawn:
By changing the heat input value, the melt pool volume could be changed. It was clear that with increase in heat input the volume of the melt pool increased and the bead shape got changed from wine-glass-shaped profile to glass-shaped profile.
Weld-bead was consisted of the dendritic structure. A small region of small columnar grains was formed near the fusion interface. The grains in the center of the bead were almost perpendicular to the weld center. HAZ consisted of recrystallized grains with the coarser size, whereas the base material grains were finer in size.
Brittle intermetallic compounds of Ni and Ti such as Ni3Ti and Ti2Ni were formed during welding.
Microhardness value was gradually reduced from the base material to weld center because of chemical and microstructural dissimilarity of the different zones of the weld.
Phase transformation temperature got reduced after welding due to lattice dislocation through the deposition of various intermetallic phases which in turn affected the microstructure of the welding and would also increase the residual stress.
The mechanical strength of the weld got reduced, and the mode of failure in uniaxial tensile test was converted from pure ductile mode of failure of base material to mixed mode of failure for welded samples.
Cyclic load-position confirmed that laser-welded NiTinol samples were capable of withstanding considerable strain for the large number of cycles though strain hardening took place.
Though laser welding affects the thermomechanical property of NiTinol due to precipitation of different intermetallic compounds on the grain boundaries and lattice dislocation phenomena, laser-welded samples showed useful mechanical performance for different practical applications where a high strain rate cyclic load is applied for large number of cycles.
Footnotes
Declaration of conflicting interests
The author(s) declared no potential conflicts of interest with respect to the research, authorship, and/or publication of this article.
Funding
The author(s) received institute financial support for the research, authorship, and/or publication of this article.