
Abstract
A novel hydrodynamic cavitation–based dispensing process was developed to disperse SiO2 nanoparticles into the base oil, and the effects of process parameters on dispersity and tribological properties of SiO2/oil nanolubricants were studied using the dynamic laser scattering and ring compression tests. With this process, nanolubricants with fine nanoparticles (139–1240 nm) were formulated. A mean particle size reduction of 78% was achieved in 60 min. This process can be scaled up for mass production with relative ease. The formulated SiO2/oil nanolubricants exhibited better tribological performance over that of base oil. Lubrication mechanisms of the SiO2/oil nanolubricant in metal forming were ascertained through analysis of the dispersity of nanolubricants and characterization of dents appearing on the surface of the deforming material. The study revealed the importance of formulating nanolubricants with specific particle size distribution that relate to the surface morphology of the deforming material. In this study, a nanolubricant with particle size of 3.6 μm exhibited better lubrication on ring samples with dent depth of 4.7 μm, implying that most nanoparticles were encapsulated in the dents facilitating hydrostatic lubrication.
Introduction
In recent years, application of nanoparticles as lubricant additives has attracted attention among tribologists and lubricant developers. Extensive research has shown that addition of nanoparticles to the base oil can enhance tribological performance.1–3 These nanolubricants are a colloid system in which nanoparticles are dispersed in base fluids such as mineral oils, liquid paraffin and vegetable oils. In the course of investigating the performance of nanolubricants, a wide range of nanoparticles have been studied including ZnO, CuO, MoS2, WS2, graphite, SiO2, Al2O2, TiO2 and PbS. Detailed surveys of nanoparticles and concentration levels for nanolubricant formulation can be found in literature.1–3
Nanoparticles as lubricant additives are of interest to lubricant developers because they exhibit excellent physical and chemical properties. Their ultrafine size makes it possible for them to enter into the interface with ease. Depending on several factors, namely, concentration, properties of nanoparticles and base fluid, prevailing lubrication regimes and conditions of mating surfaces, nanoparticles can transform the sliding friction to rolling friction or by physically/chemically forming a protective tribofilm on the contact.4,5 Furthermore, the high surface to volume ratio of nanoparticles enhances their chemical reactivity and absorption ability, thus facilitating formation of a lubricant film at the interface. 6 Huang et al. 7 investigated the tribological properties of graphite nanosheet as additives in paraffin oil using the four-ball and pin-on-disc tribotest. A 75% drop in friction was observed with graphite nanosheets compared to the pure paraffin oil. Ghaednia et al. 8 reported that nano-CuO additives reduced the friction coefficient by 23% compared to the base fluid, namely, pure mineral oil.
Among the factors affecting tribological performance of the nanolubricants, concentration of nanoparticles has been widely studied. Xie et al. 9 investigated the influence of MoS2 and SiO2 nanoparticles on tribological behavior of magnesium alloy–steel contact using a reciprocating sliding ball-on-flat tribometer. Excellent lubricant performance was observed for both MoS2 and SiO2 nanolubricant compared to the base lubricants which consisted of EOT5 engine oil. The optimal concentration for nano-MoS2 and nano-SiO2 for anti-friction were 1.0 and 0.7 wt%, respectively. Although numerous studies have investigated optimal nanoparticle concentration,5,10–13 its value strongly depends on the characteristics of nanolubricant and test conditions. This is why the optimal concentrations reported in literature vary greatly, from the low end of 0.1% 5 to high end of 1%. 13
Research studies presented in literature show that properties of nanoparticles and base fluid can influence the performance of nanolubricants in different ways such as (1) compatibility between nanoparticles and base fluid,14,15 (2) structure, 16 (3) size 17 and (4) shape 18 of nanoparticles. Alves et al. 15 studied the anti-friction performance of different combinations of nano-oxides and base oil using the ball-on-disc tribotester. By adding nano-CuO and ZnO in mineral oil, the friction coefficient significant decreased compared with base oil. However, friction improvement was not observed when the nanoparticles were added into the vegetable oil. Rabaso et al. 16 found out that the morphology of nano-MoS2 affected durability of the lubricant in the tribotest. Peng et al. 19 reported that SiO2 nanoparticles with diameter of 58 nm exhibited better tribological properties in load carrying capacity as compared to ones of larger size. The size range in this study was from 58 to 684 nm.
The lubrication regime is another factor in nanolubrication. Ali et al. 20 examined the tribological behavior of piston ring assembly using Al2O3 and TiO2 nanoparticles as additive in engine oil. A substantial drop in friction was observed, in the order of 48%–50%, 33%–44% and 9%–13% for boundary, mixed and hydrodynamic lubrication regimes, respectively. These results show that nanolubricants are most effective in the boundary regime. Depending on the relative size of nanoparticles with respect to the film thickness, improvement in lubrication by nano-additives can be maximized in certain regimes and diminished in others.21–23 Conditions of the mating surface can also influence the anti-friction function of nano-additives, such as the oxide film, 24 coating6,25 and surface roughness. 24 For example, Xia et al. 24 studied the growth behavior of oxide scale formed on the workpiece surface and its effects on the tribological characteristics of the oil-in-water emulsion with nano-TiO2 as additives for application in hot rolling processes. Ball-on-disc tribotest was used. The results from this study showed that the oxide scale plays an important role in the tribological behavior of nano-TiO2 additive and that the level of surface roughness can significantly influence the function of nano-TiO2 additive.
While the tribological benefits of nanolubricants are evident from the research carried out today, practical applications of these nanolubricants in industry require a cost-effective formulation methodology. The effectiveness of nanolubricants depends on numerous factors such as compatibility with base fluid, particle size and morphology, concentration, dispersion stability and surface characteristics of tribopairs. Poor dispersion stability may cause the nanoparticles to agglomerate, resulting in loss of friction reducing ability. There are two techniques which are commonly used for nanoparticle dispersion, namely, mechanical stirring7,16,20 and ultrasonic agitation.9,19 Ultrasonic-based dispersion techniques have been employed in most of the nanolubrication studies carried out to date. They are excellent for producing small quantities but may not be suitable for large quantities. Thus, cost-effective methodologies for producing large volumes of nanolubricants are needed.
Most of the investigations of nanolubricants have focused on bearing-type applications, such as those encountered in engines. Nanolubrication for metalworking processes, such as machining and metal forming, has not received great attention, despite the fact that these processes exhibit severe tribological conditions. Padmini et al. 26 studied the lubrication performance of four types of nanolubricants for machining, H3BO3/coconut oil, MoS2/coconut oil, H3BO3/sesame oil and MoS2/sesame oil. They observed that performance of nanolubricants was better in reducing cutting force, cutting temperature and tool wear. 27 Compared with nanolubrication in machining,28,29 limited research is devoted to nanolubrication in metal forming.30,31 Metal forming processes are subjected to severe sliding while undergoing plastic deformation, usually at a very high interface pressure. For example, in a forging process, the tool-workpiece interface pressure exceeds 2000 MPa.
The overall objective of this study is to develop a hydrodynamic cavitation–based nanoparticle dispersion process for nanolubricant formulation and explore application of nanolubricants for metal forming. The specific objectives are to (1) develop a hydrodynamic cavitation–based system to formulate SiO2/oil nanolubricants, (2) evaluate the process feasibility based on lubricant characteristics and tribological performances and (3) ascertain the lubrication mechanisms of SiO2/oil nanolubricants for metal forming processes.
Hydrodynamic cavitation–based nanoparticle dispersion experimental setup
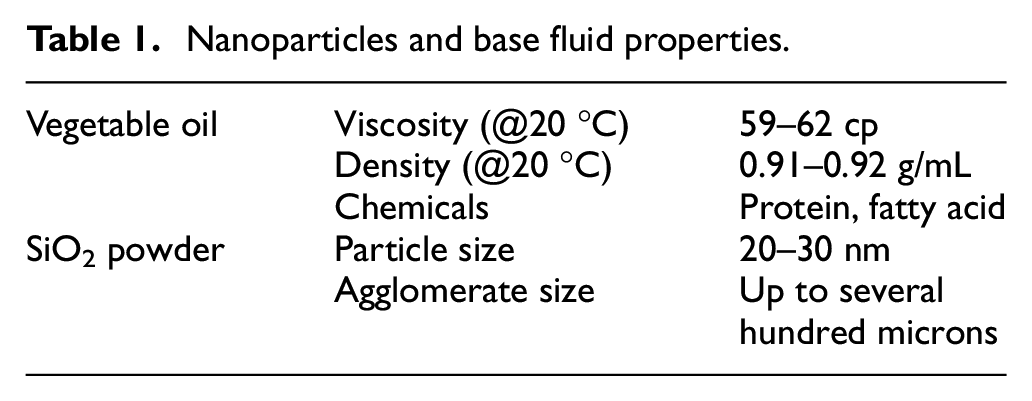
Dispersion of nanoparticles in a base fluid is carried out on a device that makes use of the hydrodynamic cavitation energy. Cavitation occurs when there is a pressure differential in the liquid causing cavities/bubbles to form. It is the collapse of these bubbles that releases energy in the form of shock wave, micro jets, localized heat energy and so on. The nanosuspension used in this study consists of SiO2 particles and vegetable oil at a concentration of 0.5 wt%. The SiO2 particles were procured from US Research Nanomaterials, Inc. Table 1 shows properties of the vegetable oil and SiO2 powder which were used in this study.
Nanoparticles and base fluid properties.
The SiO2 particles in aggregate conditions were dispersed in the oil by a hydrodynamic cavitation–based dispersing system shown in the circuit diagram (Figure 1). The setup consists of a cavitation generator, a cooler, a pump, a motor and a tank. The pump driven by the motor sucks the fluid from the tank and pushes the fluid through the cavitation generator. The cooler is used to maintain the temperature of the fluid. The actual overall system is shown in Figure 2. The core component of the system is the cavitation generator shown in Figure 3 with two pressure gauges connected to the inlet and the outlet ports. When the cavitation generator operates, the fluid is pushed through the gap between a nose-shaped constriction insert (#4 in Figure 4(a)) and the conical wall of the main housing (#5 in Figure 4(a)). The pressure differential created by this gap initiates the cavitation. The pressure differential can be adjusted by the control shaft (#1 in Figure 4(a)). As the bubbles flow to the chamber, their growth and collapse behavior are governed by the chamber insert (#8 in Figure 4(a)). In the setup shown in Figure 4(a), a venture-type chamber insert is used. Figure 4(b) shows a cross section view of the cavitation generator. In Figure 4(b), the fluid flow is shaded in black and the cavitation cloud is shaded in white. The shearing stress in the flow and micro jets from the bubble collapse are responsible for breaking down the nanoparticle agglomerates into fine nanoparticles.
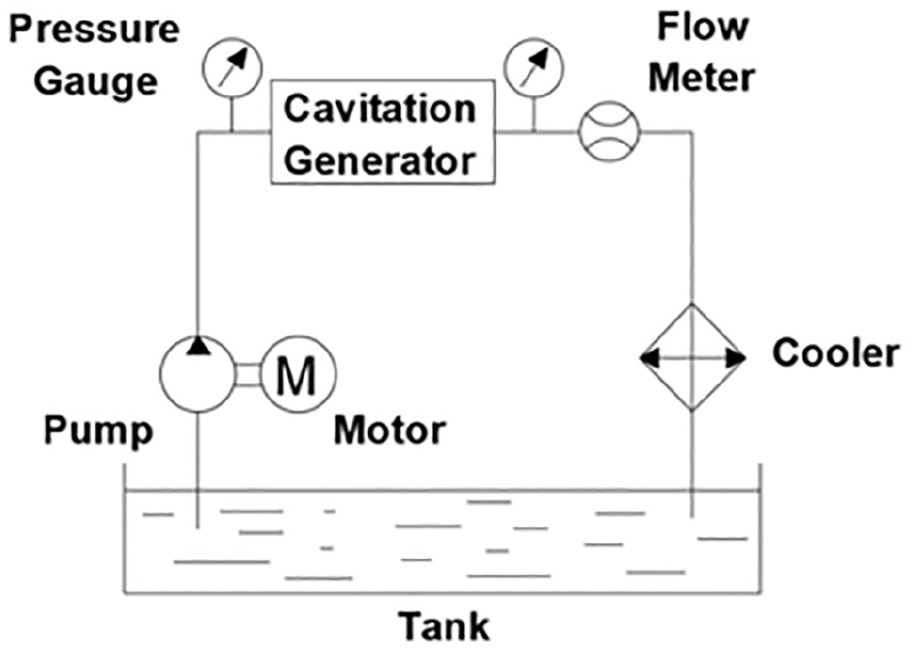
Circuit diagram of hydrodynamic cavitation–based dispensing system.
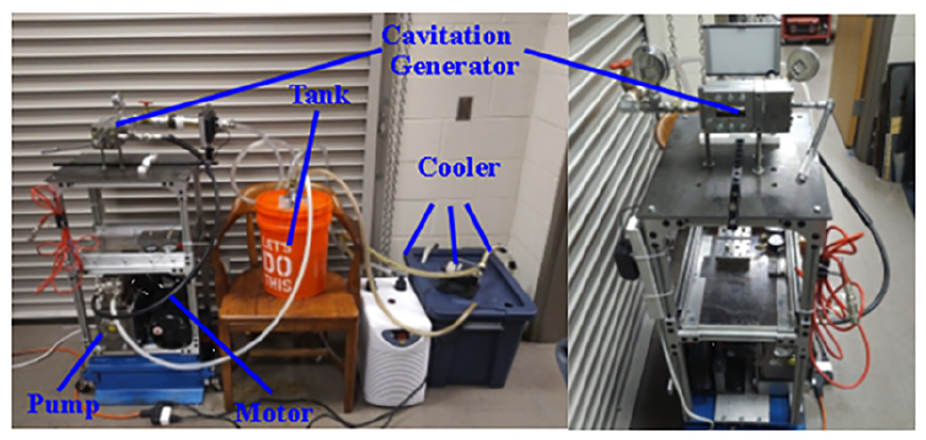
Hydrodynamic cavitation–based dispensing system.
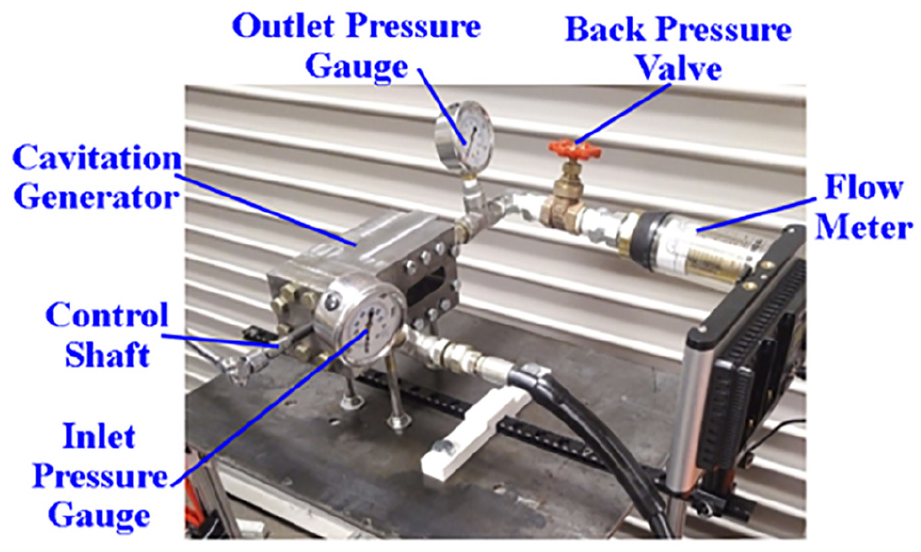
Cavitation generator.
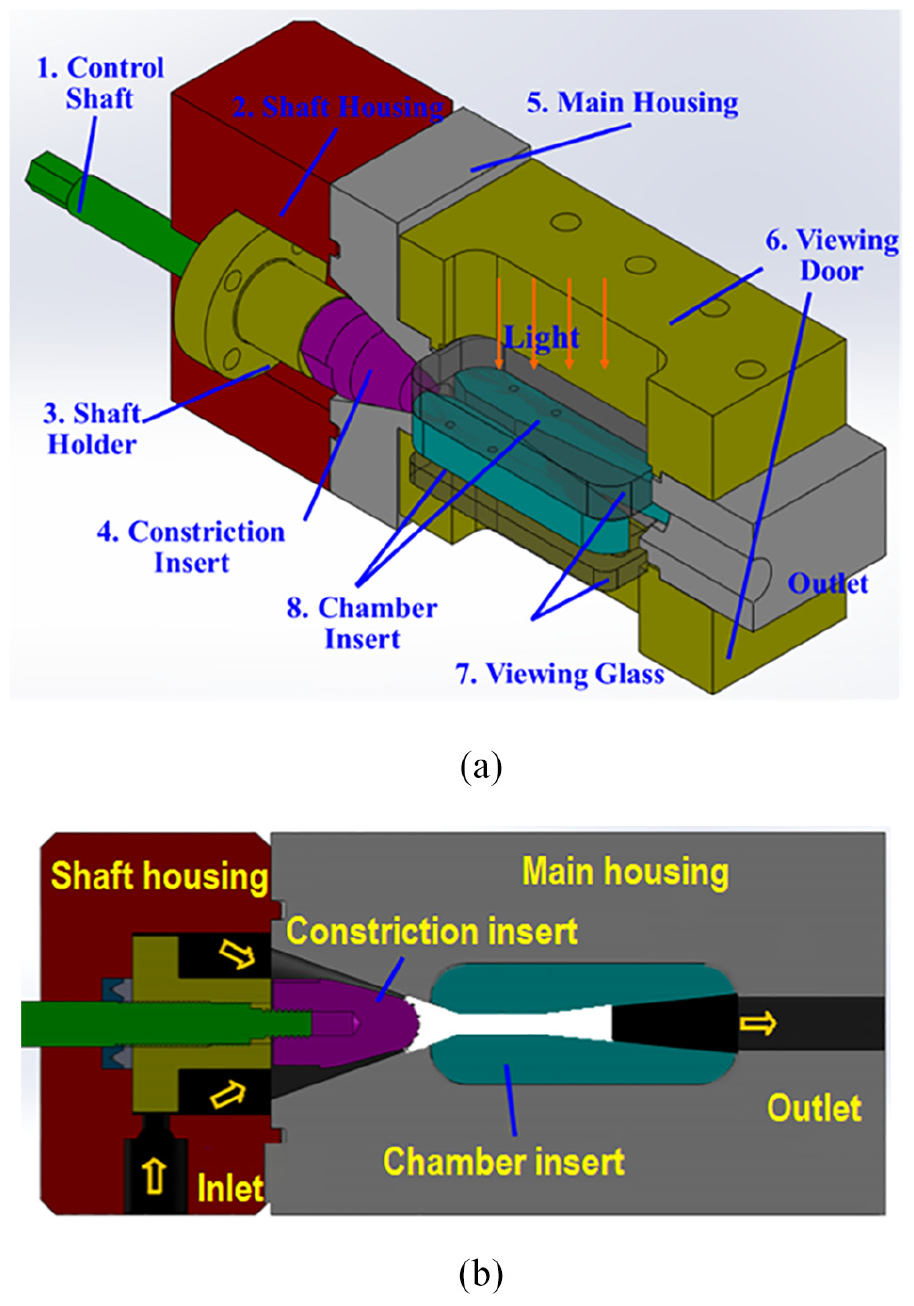
(a) Components of the cavitation generator. (b) Flow domain (black) and bubble cloud of cavitation (white).
Dispersion performance and nanolubricant characteristics
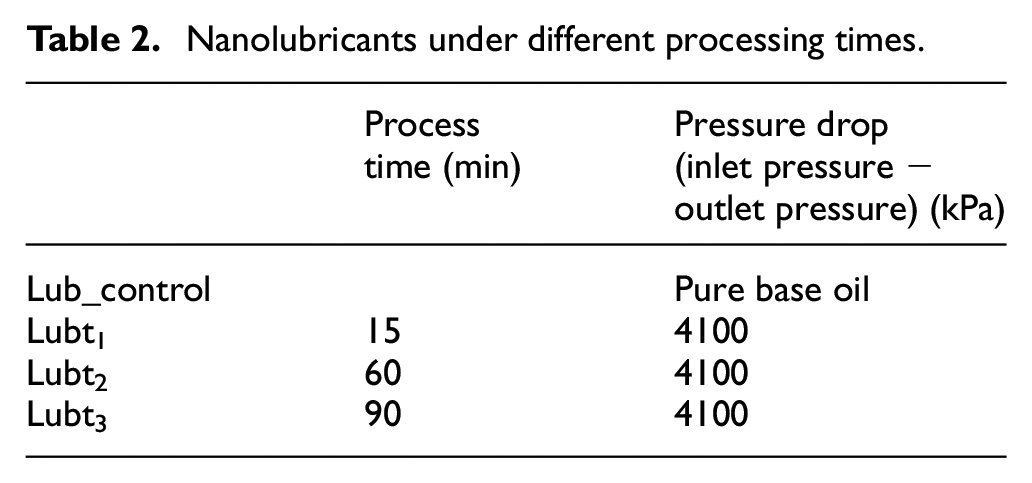
To assess the dispersion performance of the proposed device, effects of the processing time were studied in three levels: t1 (15 min), t2 (60 min) and t3 (90 min). The dispersion performance of the device is evaluated by characteristics of the nanolubricants formulated. The formulated nanolubricants were characterized by determining the particle size distribution (PSD) using the dynamic laser scattering (DLS) technique. The PSD was measured using the DLS analyzer known as Malvern Zetasizer Nano ZS. The PSD is a histogram of the size of nanoparticles dispersed in the base oil. The influence of processing time on PSD of nanolubricants is presented in Figures 5 and 6. Three nanolubricants which are labeled, Lubt1, Lubt2 and Lubt3, are formulated at a fixed pressure drop and under different processing times. They are compared to the pure base oil, which is labeled as Lub_control. The processing condition for these lubricants is shown in Table 2. Figure 5 shows that nanoparticle agglomerates are more finely broken down. As the processing time increases from t1 (15 min) to t2 (60 min), the peak of the profile shifts toward the small particle size, that is, from 5000 to 2000 nm. With further increase in the processing time, the peak of the profile continues to shift to smaller particle size.
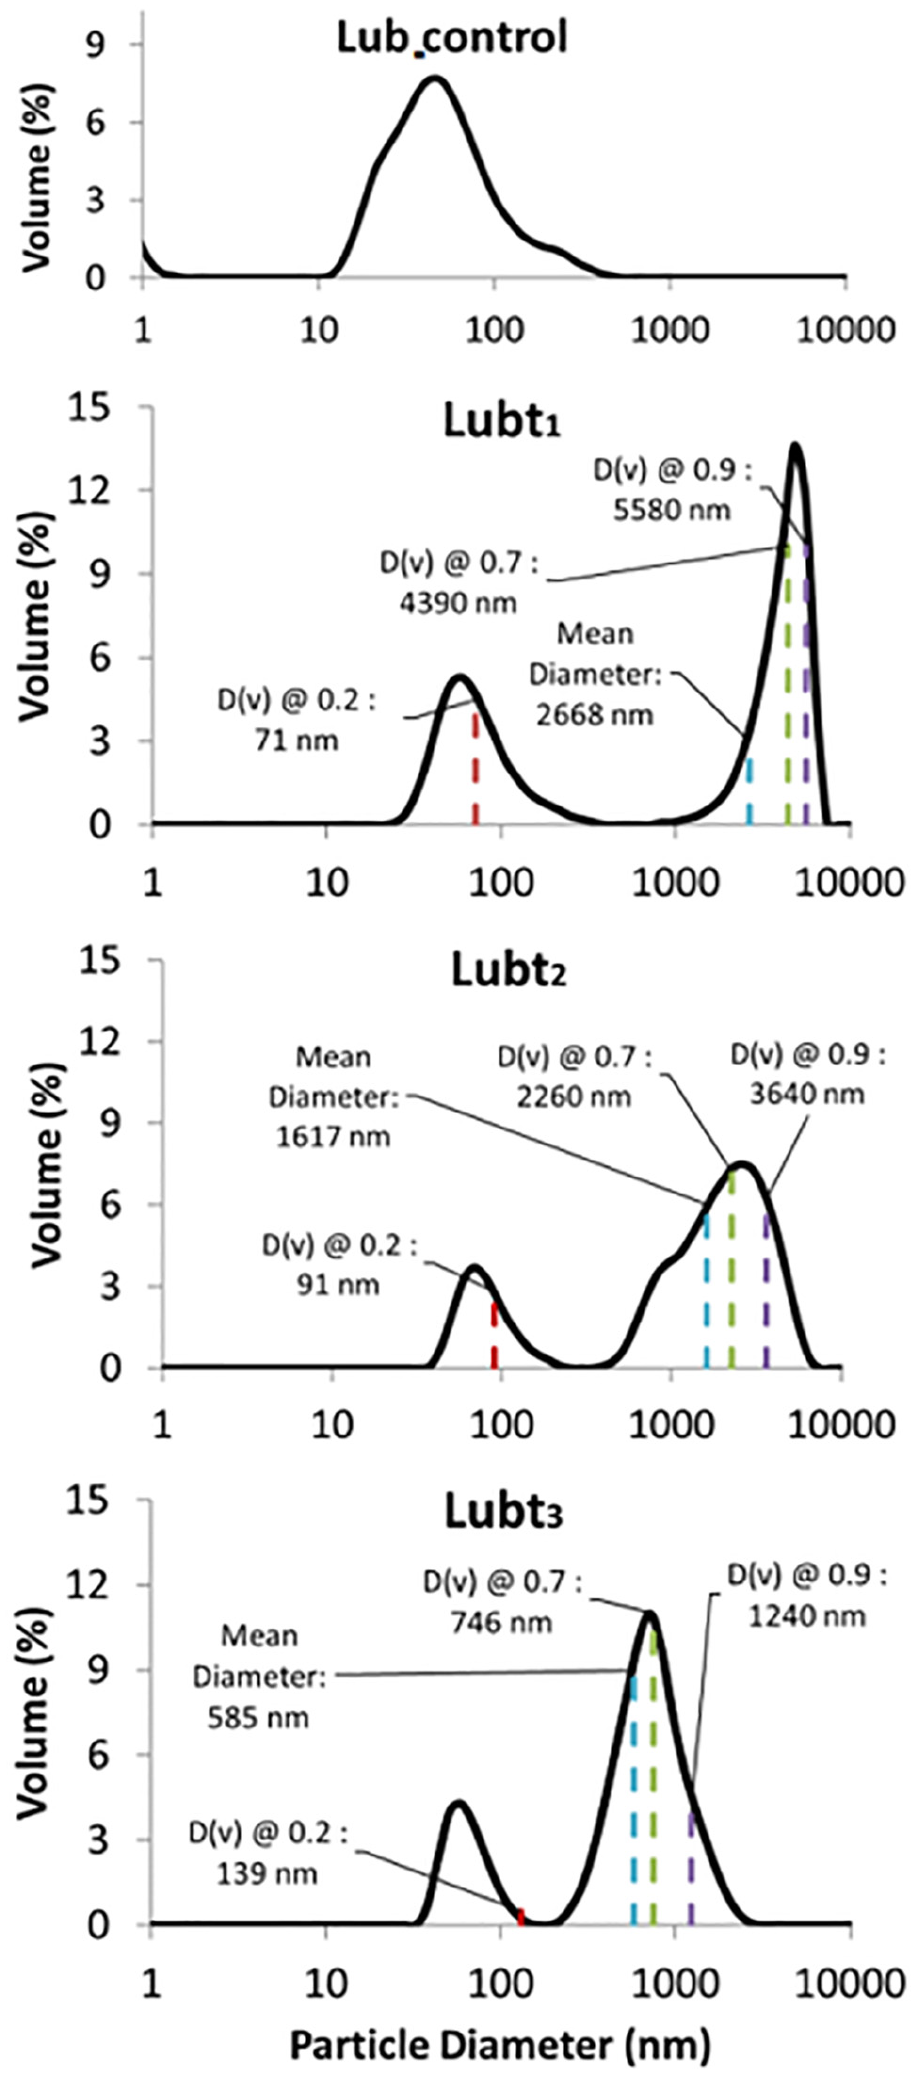
Volume-weighted particle size distribution (PSD) of nanolubricants: Lub_control, Lubt1, Lubt2 and Lubt3.
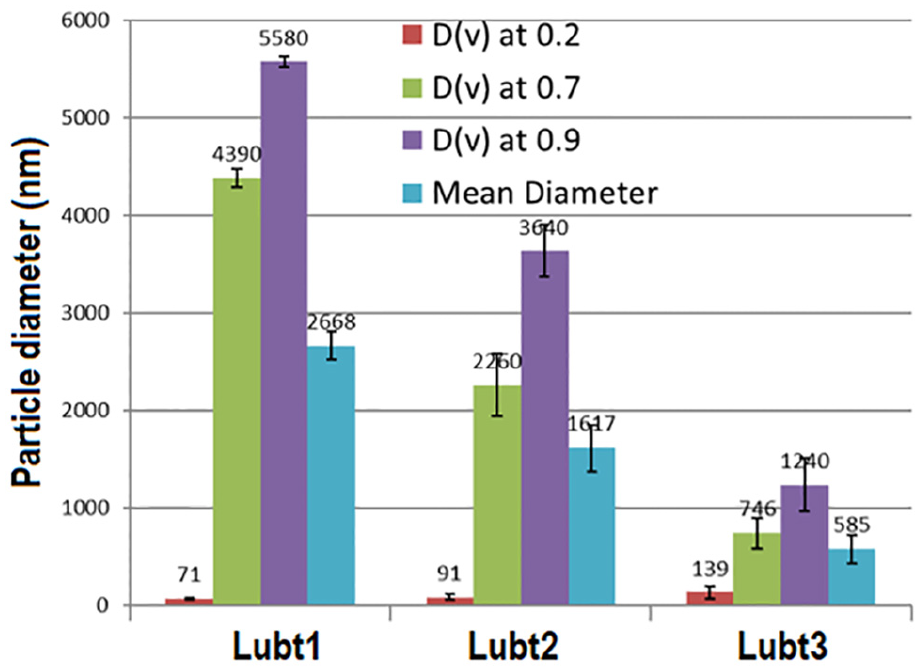
Percentile and mean diameter of nanolubricants under different processing times.
Nanolubricants under different processing times.
The percentile diameter and mean diameter can be extracted from the PSD curve in Figure 5 to statistically described features of the curve. Three percentile diameters denoted as D(v) @ 0.2, D(v) @ 0.7 and D(v) @ 0.9 are adopted. For example, D(v) @ 0.2 is the particle diameter below which 20% of the particles in volume can be found. In Figure 5, D(v) @ 0.2 is thex-coordinate of the red dashed line. If the percentile diameter and the mean diameter marked in Figure 5 are plotted in Figure 6, a proportional relationship between the processing time and the particle size is discovered. D(v) @ 0.7, D(v) @ 0.9 and mean particle diameter decrease with increasing processing time. For example, the mean particle size of 2668 nm at t1 (15 min) decreased to 585 nm at t3 (90 min). Thus, the mean particle diameter is reduced by 78% when the processing time increases from t1 (15 min) to t3 (90 min).
The hydrodynamic cavitation test is equipped with 2.0-kW motor. Because the flow rate of the pump is fixed, the power consumption of the dispersion system varies with the pressure drop of the cavitation generator. The power used for dispersion at the pressure drop of p1 = 4100 kPa is 1.24 kW. As shown in Figure 6, when the processing time is elongated to t3 (90 min), almost all nanoparticle agglomerates are broken up to the submicron size. These data can be used to quantify the capacity of the dispersion system, which is 15 L/h. The simplicity of the hydrodynamic cavitation–based test setup makes it ideal for scaling up as compared to conventional ultrasonic-based systems commonly used in nanolubricant formulations.
Utilization of the formulated nanolubricant in metal forming
The previous section has shown that using appropriate processing time, the proposed system is able to effectively break up the nanoparticle agglomerates. But it is still unknown how much dispersion or refinement of the particle size is needed to achieve a satisfactory lubrication performance in metal forming, that is, the tribological performance of nanolubricants formulated under different processing times need to be evaluated so that an optimal value is determined in terms of tribological performance. A well-known method, the ring compression test, is used for lubricant evaluation. Figure 7 shows a 150-ton hydraulic press and the ring compression test. The sample material used is Aluminum 6061 T6. The ring samples had inner diameter of 16 mm, outer diameter of 32 mm and height of 10 mm. The height reduction is about 30%. The surface roughnesses of ring samples were kept consistent, and the
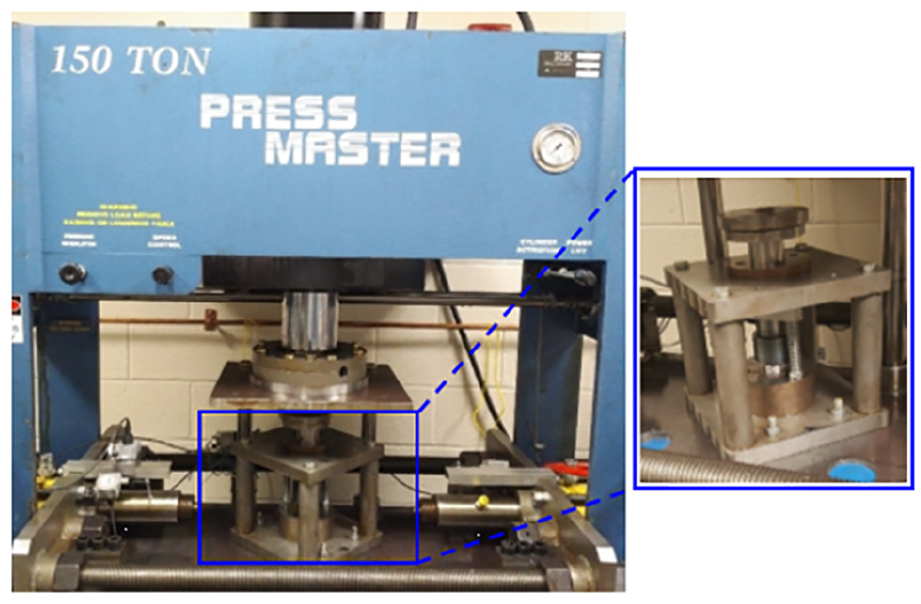
Press and tooling for ring compression test.
The ring samples before and after compression are shown in Figure 8. To account for the presence of SiO2 nanoparticles on the deformed ring samples, a chemical analysis was carried out on the surface of nanolubricant-specimen system using energy dispersive spectroscopy (EDS). The Si compositional map (Figure 9(a)) indicates a high concentration of Si shown as a bright yellow spot on the specimen surface. Figure 9(c) shows that wt% of Si and O at this spot is 11% and 21%, respectively. The SiO2 nanoparticles shown as the white shade in scanning electron microscope (SEM) image (Figure 9(b)) have the size of 1.6–5.2 μm, which is in good agreement with the PSD obtained by the DLS technique.
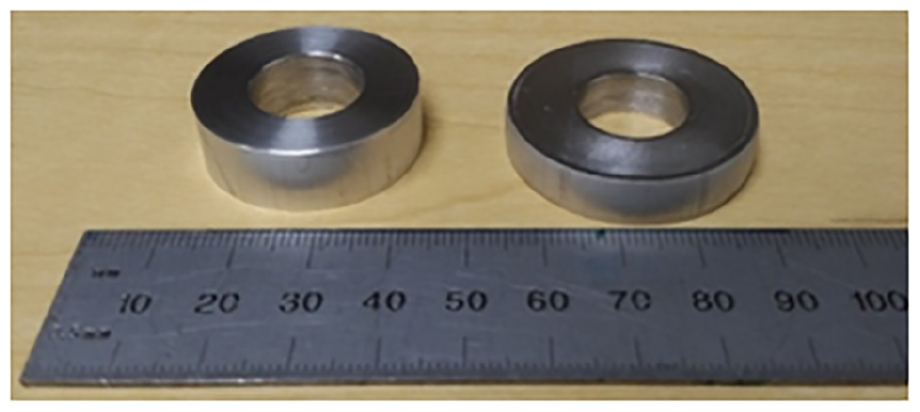
Ring samples before and after compression.
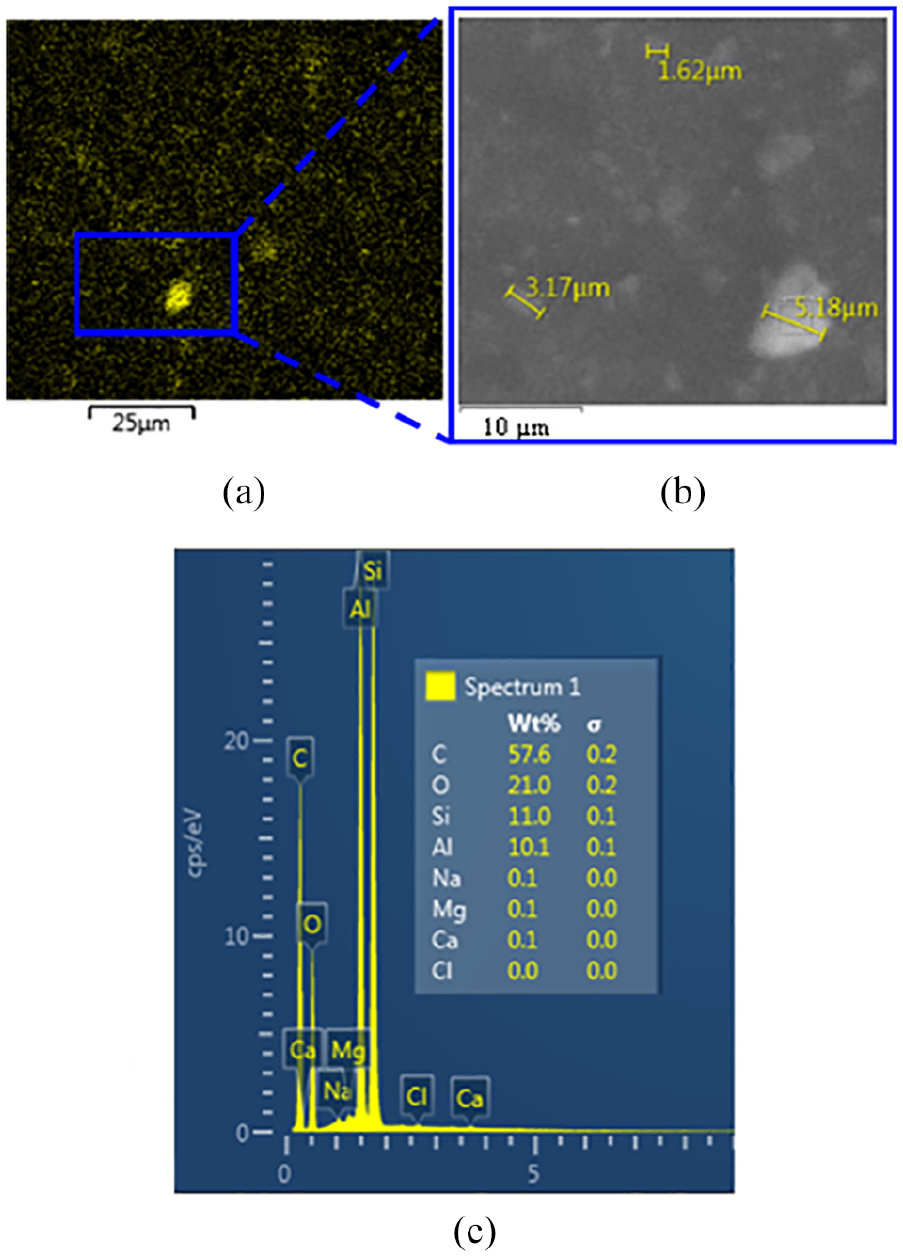
Chemical element distribution showing SiO2 particles on the ring sample.
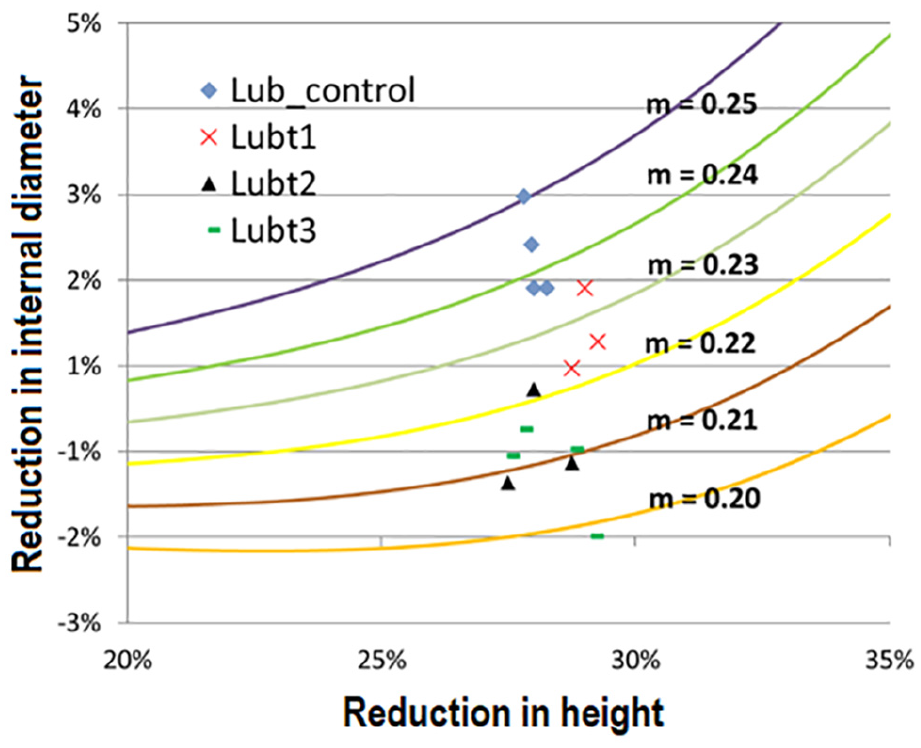
Influence of the processing time on the tribological performance of nanolubricants is discussed using the shear friction factor. Tribological performance of Lubt1, Lubt2 and Lubt3 is evaluated and plotted on Figure 10. The pure base oil is used as the baseline. Their PSD was discussed in section “Dispersion performance and nanolubricant characteristics,” and their process conditions were presented in Table 2. Four ring samples were compressed to evaluate lubrication performance of each lubricant variant. Shear friction factors of the lubricants are extracted from Figure 10 and converted to a bar chart (Figure 11) for the purpose of quantitative analysis.
Shear friction factor calibration curve.
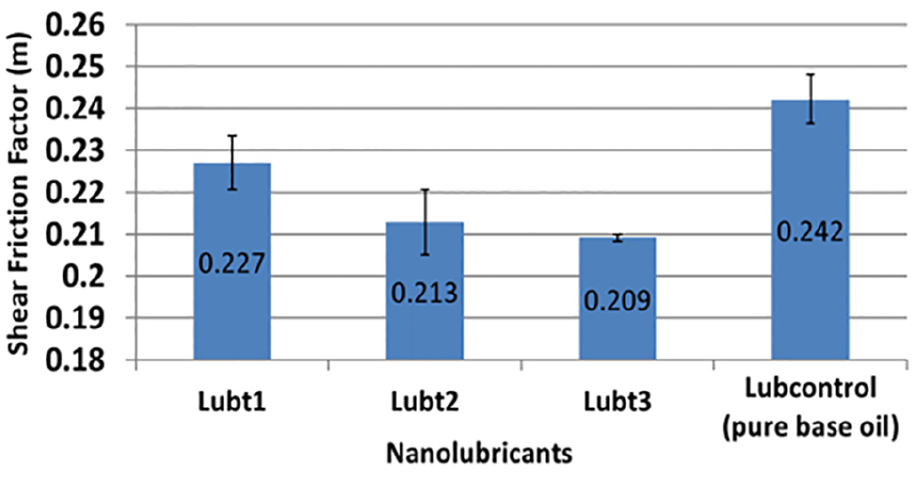
Shear friction factor of nanolubricants under different processing times.
In order to examine the influence of the processing time on tribology performance, data for Lubt1, Lubt2 and Lubt3 are used. It is found out that increase in the process time is favorable for reduction of the shear friction factor. As shown in Figure 11, Lubt2 and Lubt3 have smaller shear friction factor than Lubt1. This is because elongation of the processing time facilitates the breakup of large SiO2 agglomerates. However, due to large standard deviation of the shear friction factor of Lubt2, Lubt2 and Lubt3 exhibit close tribological performance. If the largest processing time is used, the shear friction factor is improved by 13.6% in comparison with that of the pure oil. This lubrication improvement is comparable to the work of Mosleh et al. 30 who found out that addition of MoS2, WS2 or BN nanoparticles reduced the friction coefficient by 10% in forming of titanium sheets. However, no significant reduction in friction was observed in forming of steel sheets.
Lubrication mechanisms of nanolubricant in metal forming
The previous sections showed that with appropriate process parameters, the hydrodynamic cavitation–based dispersion process can be used to formulate large quantities of SiO2/oil nanolubricants with fine nanoparticles. The nanoparticle agglomerates can be broken up to a small size, that is, submicron level. However, once the particle size is refined to a critical value, further refinement does not continuously improve the lubrication performance. We hypothesize this as follows: lubrication performance of nanolubricants depends on the relationship between the nanoparticle size and the surface roughness/morphology of the tribopair, and this relationship dictates the active lubrication mechanism. To test this hypothesis, experiments were carried out by altering the surface roughness of the ring samples, whereas a single nanolubricant with known PSD was used. In this study, one of nanolubricant variants formulated above, namely Lubt2 (Table 2), was tested alongside the ring specimens having different surface roughnesses.
In order to precisely control the surface roughness, ring samples were polished using the SiC sandpapers of different grit sizes, 320 and 1200 grit. For each surface roughness, four samples were prepared. The
Lubrication performance under different surface roughnesses
The tribological performance of Lubt2 under the tribopair having two different surface roughnesses is shown in Figure 12. Figure 12 shows that the 320-grit ring sample exhibited a shear friction factor of 0.21, which is lower than that of the 1200-grit ring samples. In this case, the ring samples with higher surface roughness exhibited better friction condition compared with ring samples with smoother surfaces.
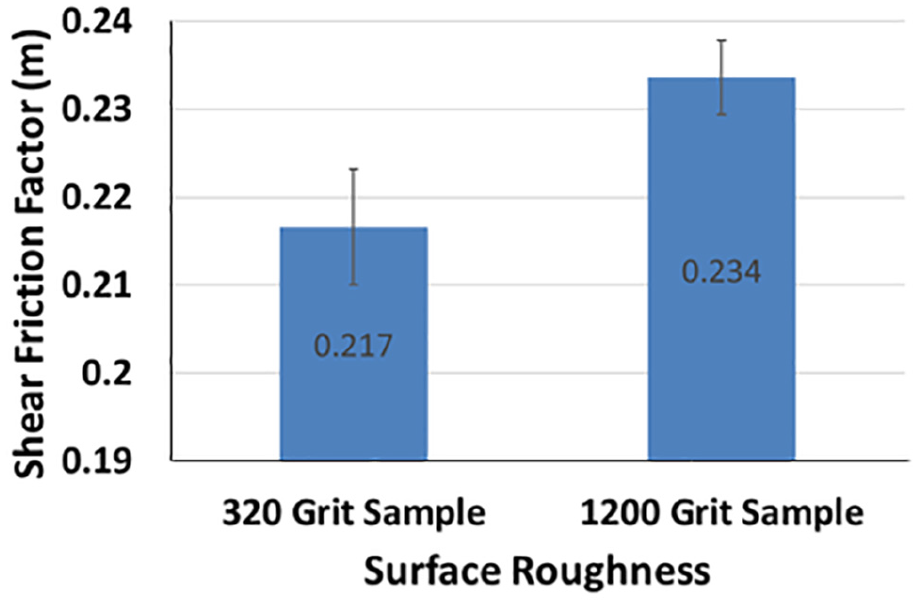
Shear friction factor of nanolubricant for ring samples with different surface roughnesses.
Evolution of surface morphology in tribology test
The ring compression test showed the ring samples with rough surface resulted in the lower friction than those with smooth surface for the same nanolubricant. To ascertain the active lubrication mechanisms which depend on the relationship between the nanoparticle size and surface roughness/morphology of the tribopair, evolution of surface morphology of the deforming ring samples was studied. Figure 13(a) and (b) shows the surface morphology of the ring samples before they were subjected to plastic deformation. Figure 13(c) shows the surface of a deformed ring sample on which micro dents are evenly distributed. Appearance of these dents is combined effect of crack propagation and plastic deformation. 19 A representative size of these dents (black dots) is given in Figure 13(d) and (e). The outer diameter of dents is in the order of 50 μm, and the dent depth is about 4 μm. These micro dents have the potential to create hydrostatic or hydrodynamic lubrication conditions. Due to the fact that metal deformation speed is relatively low, hydrostatic lubrication condition is more plausible to occur than hydrodynamic lubrication condition.
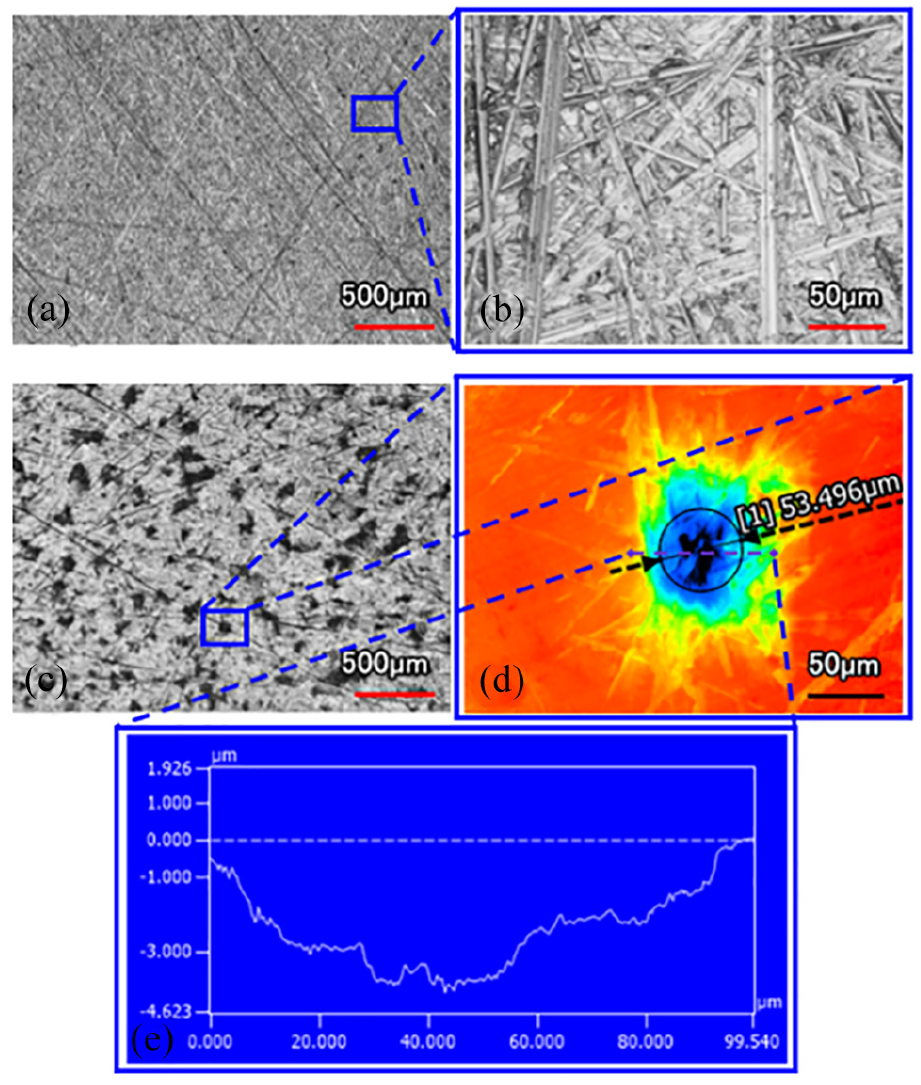
Micrograph of the surface of 320-grit sample: (a) and (b) are before compression; (c) and (d) are after compression; and (e) profile of the dent.
Similar micrographs are plotted for ring samples which were polished by 1200-grit sandpapers (Figure 14). The deformed specimen shows similar dent distribution pattern. The major difference is the size of dents. Figure 14(e) shows a representative dent depth of 2.5 μm for 1200-grit ring sample, which is lower than the dent depth observed for 320-grit ring sample. In this study, the dent depth is viewed as the most significant characteristics of surface morphology for the active lubrication mechanism. Because there are numerous dents on the surface of ring samples and each of them has its own depth, it is of interest to find out the mean depth of hundreds of dents and what range the majority of dent depths falls into. In this section, a mean dent depth chart (Figure 15) and a histogram of dent depth distribution (Figure 16), which depicts the relative number of dents with a certain depth, are used to show the surface morphology. To establish the dent depth distribution, 100 dent depth measurements were randomly taken from each of the ring samples polished by 320- and 1200-grit sandpapers, respectively.
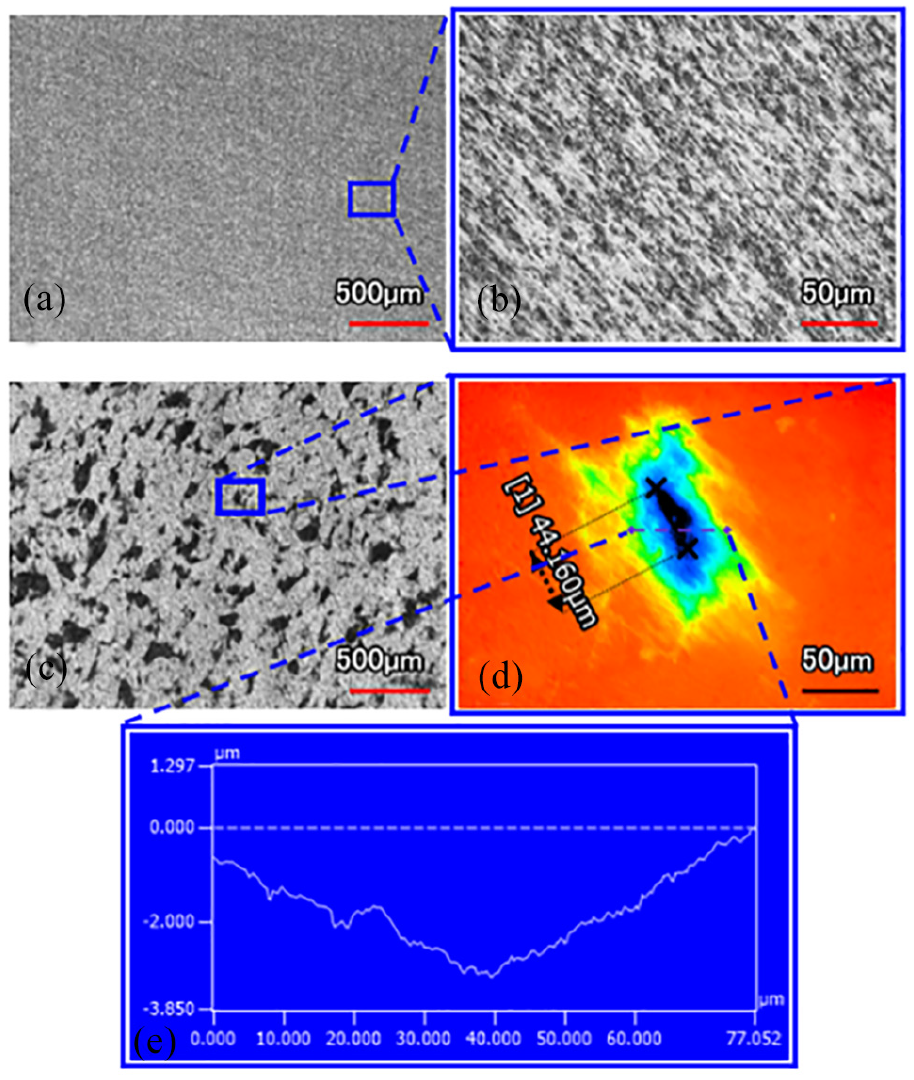
Micrograph of the surface of 1200-grit sample: (a) and (b) are before compression; (c) and (d) are after compression; and (e) profile of the dent.
Figure 15 shows mean value and standard deviation of dent depth of the deformed 320- and 1200-grit ring samples. Because the contact pressure acting on the ring sample varies with the radial distance from its center and the contact pressure affects the surface morphology, measurements of dent depth are categorized into three types based on their radial position: (1) inner section, (2) middle section and (3) outer section. Figure 15 shows that 320-grit ring samples have deeper dents in all locations (i.e. inner, middle and outer sections) compared to the 1200-grit samples after compression. To get a clear picture of the dent depth distributions, Figure 16 shows frequency (the ratio of the number of dents with a certain depth to total number of dents) versus dent depth for 320- and 1200-grit samples. The distribution reveals that the relative number of dents on 320-grit samples which have depth above 3.9 μm is higher than that of their counterparts on 1200-grit sample. Specifically speaking, 86% dents of 320-grit sample have the depth above 3.9 μm, whereas 18% dents of 1200-grit sample have the depth above 3.9 μm. Note that Figure 6 showed 90% nanoparticles in this lubricant have the diameter less than 3.9 μm. This difference in dent depth distribution between 320-grit sample and 1200-grit sample is important for understanding the active lubrication mechanisms as discussed below.
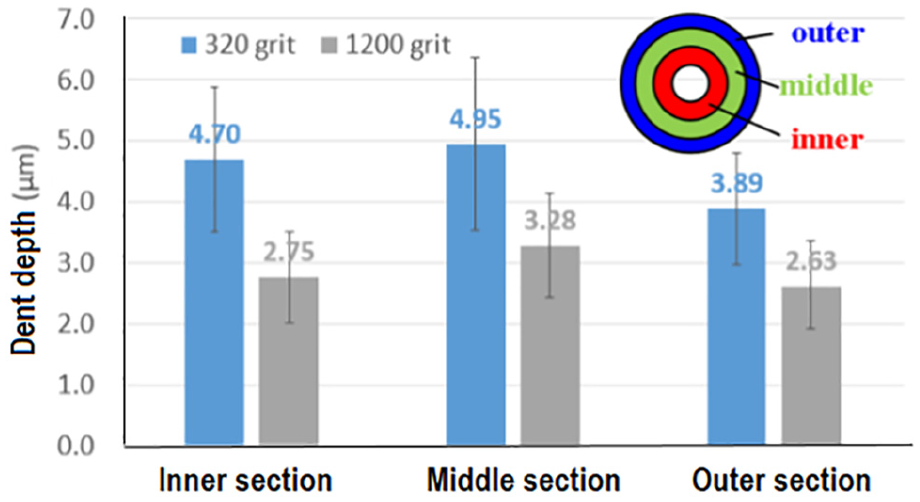
Mean of dent depth on ring samples polished by 320- and 1200-grit sandpaper.
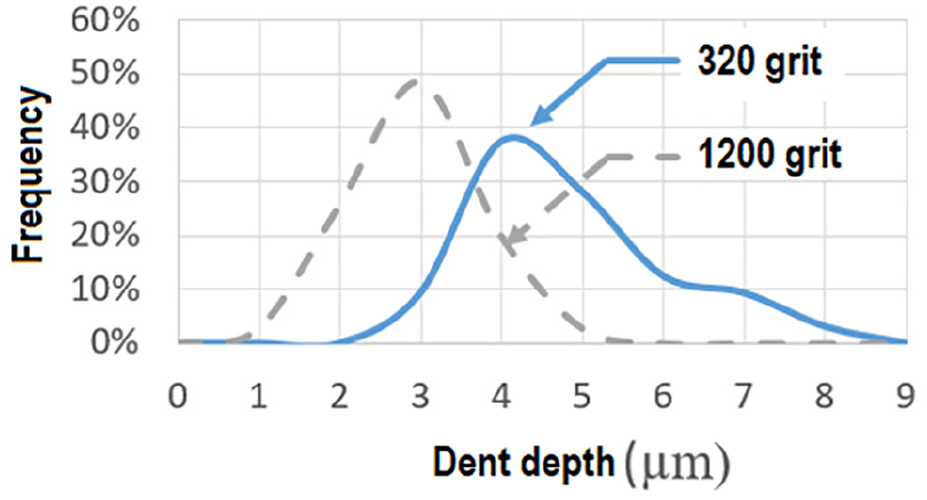
Dent depth distribution on ring samples polished by 320- and 1200-grit sandpaper.
Lubrication mechanisms
By correlating the surface morphology of compressed ring specimens (refer Figures 13–16), and nanolubricant characteristics (refer Figure 6), active lubrication mechanisms exhibited at the tool-workpiece interface can be ascertained. To establish potential lubrication mechanisms, a schematic diagram showing the interaction among nanoparticles, base fluid and tribopairs is used (Figure 17). In Figure 17, small and large SiO2 nanoparticles characterized by PSD given earlier in Figure 6 are shown together with the dent depth designated by δ.
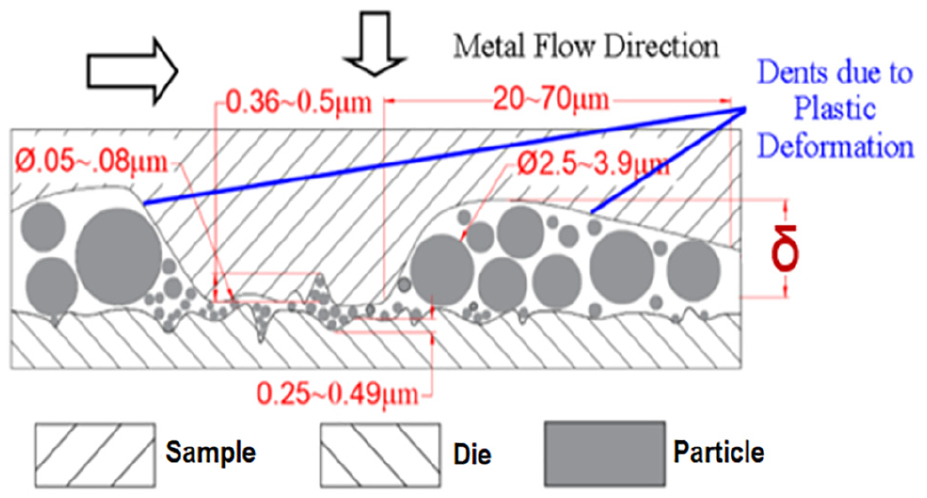
Schematic diagram of die-workpiece interface.
The potential lubrication mechanisms in this case are mainly the adsorption lubrication from the vegetable oil, hydrostatic lubrication, mending and to a less extent rolling effects of the nanoparticles. The presence of hydrostatic lubrication mechanism may have taken place in certain locations on the compressed ring samples as evidenced by evenly distribution of dents shown in Figure 13(c) (for 320-grit sample) and Figure 14(c) (for 1200-grit sample).
The difference in the dent depth on the ring specimens which were polished for different surface roughness (Figures 15 and 16) may alter lubrication mechanisms in the following way: the mean dent depth (δ) for 320-grit ring samples is in the order of 4.7 μm (Figure 15), and a large portion of dents on the 320-grit sample has the depth above 3.9 μm (Figure 16). From the PSD analysis of the nanolubricants, the majority of SiO2 nanoparticles has the diameter less than 3.6 μm (Figure 6). Under this scenario, (1) mending effect, (2) rolling effect of nanoparticles and (3) hydrostatic lubrication mechanism can be activated to reduce the friction at the interface.
In the mending effect, shallow valleys on the die surface are filled by numerous small nanoparticles and dents on the ring samples are also filled with nanoparticles of various sizes. Since the diameter of almost all nanoparticles is lower than of the dent depth (δ) on the ring sample, a combination of base fluid and SiO2 nanoparticles encapsulated in the dent on the ring sample may result in hydrostatic lubrication (less friction). Xia et al. 24 pointed out that a smooth surface adversely affects filling of valleys between asperities by nanoparticles in the thin film regime. However, change in surface roughness was due to oxidation rather than plastic deformation as observed in the present study. A deep dent on a deforming sample relative to the particle diameter can encapsulate multiple layers of nanoparticles and the oil, thus facilitating rolling of nanoparticles. 4 Although nanoparticles of the layer which is adjacent to the deforming material are bound to embed with little opportunity to roll, nanoparticles of other layers are free to roll in the oil. The oil entrapped in the dent can also activate the hydrostatic lubrication. Note that the hydrostatic lubrication is inactive in most of friction/wear test where no significant plastic deformation occurs, because straight furrows are not able to retain the oil under high load compared to dents in a plastically deformed body.
On the contrary, most of dents of 1200-grit sample have the depth (δ) in the order of 2.8 μm (Figure 15) and only a small portion of dents on the 1200-grit sample has the depth above 3.9 μm (Figure 16). While the nanoparticles less than 2.8 μm in size can be accommodated in dents of 1200-grit sample, nanoparticles with the size in the order of 3.6 μm are hardly accommodated. As a result, these large nanoparticles will create solid–solid contact with the die, reduce potential for rolling and create unfavorable conditions for hydrostatic lubrication. These factors lead to higher friction factor for 1200-grit ring samples as compared to 320-grit ring sample. This observation demonstrates the importance of formulating nanolubricants with PSDs that correlate with surface topography of the deforming workpiece.
The scenario where the nanoparticle diameter is larger than the dent depth of the tribopair leads to a higher friction than the opposite scenario, because the hydrostatic lubrication and rolling effect of the nanoparticles are not activated. When the nanoparticle size is not refined to a critical value, which is around the dent depth of the ring sample, only absorption lubrication mechanism and mending effect are active. After the nanoparticle size is reduced to less than the dent depth, two additional lubrication mechanisms, such as the hydrostatic lubrication mechanism and rolling effect, are activated. Further refinement of nanoparticle size does not bring in additional lubrication mechanisms, leading to no further friction reduction.
Conclusion
A hydrodynamic cavitation–based process was developed to disperse SiO2 nanoparticles in a base oil, and effects of the process parameters were investigated. The tribological performance of the formulated nanolubricant was evaluated, and lubrication mechanisms were ascertained. The following conclusions can be drawn from this study:
The study demonstrates that hydrodynamic cavitation–based process can be used to effectively dispense SiO2 nanoparticles in base fluid for large quantities of nanolubricant formulation. The setup can potentially be scaled up for mass production of nanolubricants with high volumetric efficient compared to conventional ultrasonic-based dispersion systems.
The processing time of the proposed process plays a significant role in formulating SiO2/oil nanolubricants. Using the process parameters in this study, the mean diameter of nanoparticles obtained via the hydrodynamic cavitation–based dispersion was 580 nm. From the ring compression test, the shear friction factor for the SiO2/oil nanolubricant was improved by 14% in comparison with that of the pure oil.
The study has found that as the processing time increases, the nanoparticle agglomerates are broken up into smaller particles. At a processing time of 60 min, the volume mean diameter of nanoparticles is reduced from 2668 to 585 nm, which is a 78% reduction.
The lubricant mechanisms of the SiO2/oil nanolubricant in metal forming processes are specific to the relative size of nanoparticles with respect to surface roughness/morphology of the tribopairs. In this study, nanolubricant with particle size of 3.6 μm exhibited better lubrication for ring samples with dent depth of 4.7 μm, implying that nanoparticles were encapsulated in the dents facilitating hydrostatic lubrication.
Footnotes
Declaration of conflicting interests
The author(s) declared no potential conflicts of interest with respect to the research, authorship, and/or publication of this article.
Funding
The author(s) disclosed receipt of the following financial support for the research, authorship, and/or publication of this article: The authors would like to thank the Army Research Office (ARO) for its support under grant number W911NF-6-1-0348, which has made this research possible.