
Abstract
Tungsten heavy alloys are widely used in the manufacturing of weights for aircraft, missiles, boats and race cars; penetrators; radiation shielding; and radioisotope containers. Manufacturing these components needs machining as a secondary operation. Since tungsten heavy alloys are difficult to machine, the in-depth analysis of tool wear growth and mechanism during machining of these alloys becomes essential. Hence, this work focuses on the experimental study of flank wear growth and its effect on other machining outputs for two different tool geometries (−5° and 2° rake angles) during turning of 90 tungsten heavy alloys. The predominant wear mechanism was identified as adhesion based on scanning electron microscopic analysis. Finally, three commonly used analytical tool wear rate models and one newly proposed model (modified Zhao model) were utilized for the prediction of flank wear growth and tool life. It was observed that the modified Zhao model could predict tool flank wear fairly well within error percentage of 4%–7% and thus could be used as a benchmark while machining difficult-to-cut alloys.
Introduction
The tungsten heavy alloy (WHA) is one of the emerging materials in defense and aerospace applications. It is one of the difficult-to-machine materials that cause rapid tool wear because of its high yield strength and hardness.1,2 It is well known that cutting tool wear profoundly affects the parts’ productivity, production costs, dimensional accuracy and workpiece surface integrity. Hence, a better understanding of the wear mechanisms during machining operation remains essential. In general, the distinct wear mechanisms that are predominant under various cutting conditions are as follows: abrasion, adhesion, plastic deformation, oxidation, diffusion and chipping or notching.3–5 Machining of hard materials, as in the case of WHAs, involves discontinuous chip formation, which possibly leads to formation of abrasive or adhesive wear on the flank surface with built-up edge (BUE).6–8 Chen et al. 9 evaluated abrasiveness index and observed diffusion, chemical, abrasive and micro-chipping as the major cause for rapid crater wear, while dry machining high chromium cast iron using polycrystalline cubic boron nitride (PCBN) inserts. Similarly, Kagnaya et al. 10 observed severe wear near chip/tool contact due to abrasion and pullout phenomena during dry machining on AISI 1045 steel using tungsten carbide (WC)-6Co uncoated carbide tools and Zhang et al. also evaluated tool failure for TC21 alloy under dry machining using coated carbide tools, and from scanning electron microscopic (SEM) analysis, it was found that adhesion and chipping were significant factors responsible for tool failure. Tang et al. 11 found that the predominant wear mechanism changed as the hardness of the work material changed for PCBN tool during dry machining of AISI D2 hardened steel by varying the hardness in the range of 40–60 hardness Rockwell C (HRC) under similar cutting conditions. Wu et al. 12 performed tool wear studies on polycrystalline diamond (PCD) tools by performing micro-end milling operation on WC and found the occurrence of brittle fracture and generation of micro-defects on milled surface.
Once the tool wear mechanism has been identified, the prediction of tool wear by analytical method plays a major role in avoiding a large number of trial and error experiments. Usui et al. 13 developed analytical tool wear model which was able to capture crater and flank wear for WC tools for a wide variety of tool shapes and cutting conditions. Similarly, Zhao et al. 14 modified Usui wear model by incorporating temperature-dependent hardness constants, which in turn captured thermal softening effects of the cutting tool. Luo et al. 15 developed a new flank wear model that captured the relative sliding velocity between tool and workpiece, hardness of tool and temperature effects on tool flank wear fairly well. In few of the recent works, finite element (FE) models have been used in conjunction with user-defined subroutines for deriving tool wear model constants to predict the tool wear growth.16–18 Likewise, Li et al. 19 developed a meta-learning tool wear rate model to predict tool wear for dynamic process control system for changing machining conditions. Considering the fact that prediction of tool life using tool life equations is very tedious, there is always a need for an accurate tool wear rate model that are able to capture tool wear mechanism efficiently, particularly, for difficult-to-cut materials such as WHAs. Hence, this work, first, studied the growth of flank wear while machining WHAs for different tool geometries and its effect on other output variables as well as investigated the predominant wear mechanism using SEM analysis. Second, four analytical tool wear rate models, out of which three commonly being used and one newly proposed, were utilized for prediction of flank wear growth and tool life. The predicted results were compared with the experimental findings under similar cutting conditions to identify the best tool wear rate model. The best tool wear rate model could be used as a reference module for prediction of tool life for varied cutting conditions and tool geometries while machining 90 WHA.
Materials and methods
This work has been divided into two parts: Experimental study and analytical approach for determination of flank wear. The workpiece materials were prepared in the form of cylindrical rods with diameter of 10 mm and length of 100 mm. Table 1 lists the chemical composition and physical properties of 90 WHA.
Composition and physical properties of 90 WHA.
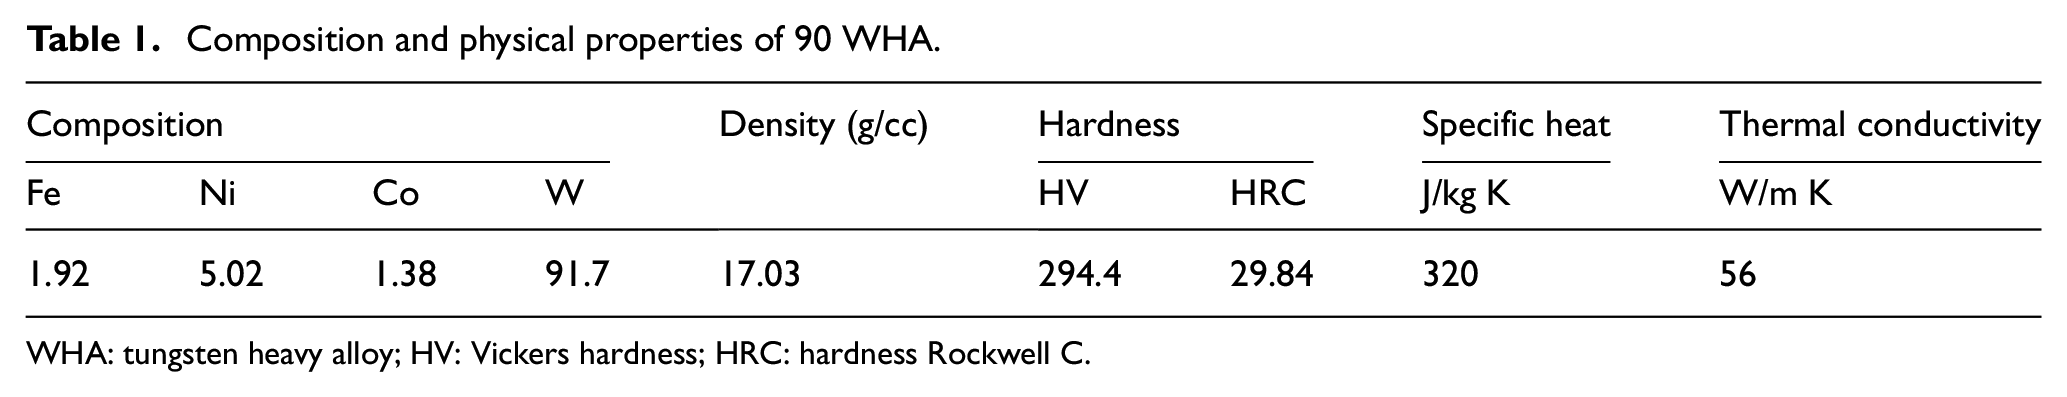
WHA: tungsten heavy alloy; HV: Vickers hardness; HRC: hardness Rockwell C.
Experimental study
In this study, machining tests were conducted by turning of 90 WHA on computer numerical control (CNC) turning center under dry conditions. Uncoated carbide inserts with two different rake angles, that is, −5° and 2° were used. Flank wear tests were performed at constant velocity of 50 m/min, feed rate of 0.1 mm/rev and depth of cut of 0.15 mm using two different types of cutting inserts. The turning operations were continued until the failure criterion was achieved, that is, tool flank wear of 600 µm was reached. The tool life for both the cutting tools was estimated from the flank wear growth curve by considering the time taken to reach the failure criterion. During the flank wear tests, cutting force components, temperatures as well as surface roughness values were also measured simultaneously at specific time intervals. The worn surfaces were then studied using SEM micrographs and elemental analysis was performed using an elemental composition analyzer by coplanar elemental dispersive X-ray spectroscopy (EDS) detector at successive machining time intervals. Table 2 shows the list of equipment used for performing the experimental studies.
Experimental test equipment details.
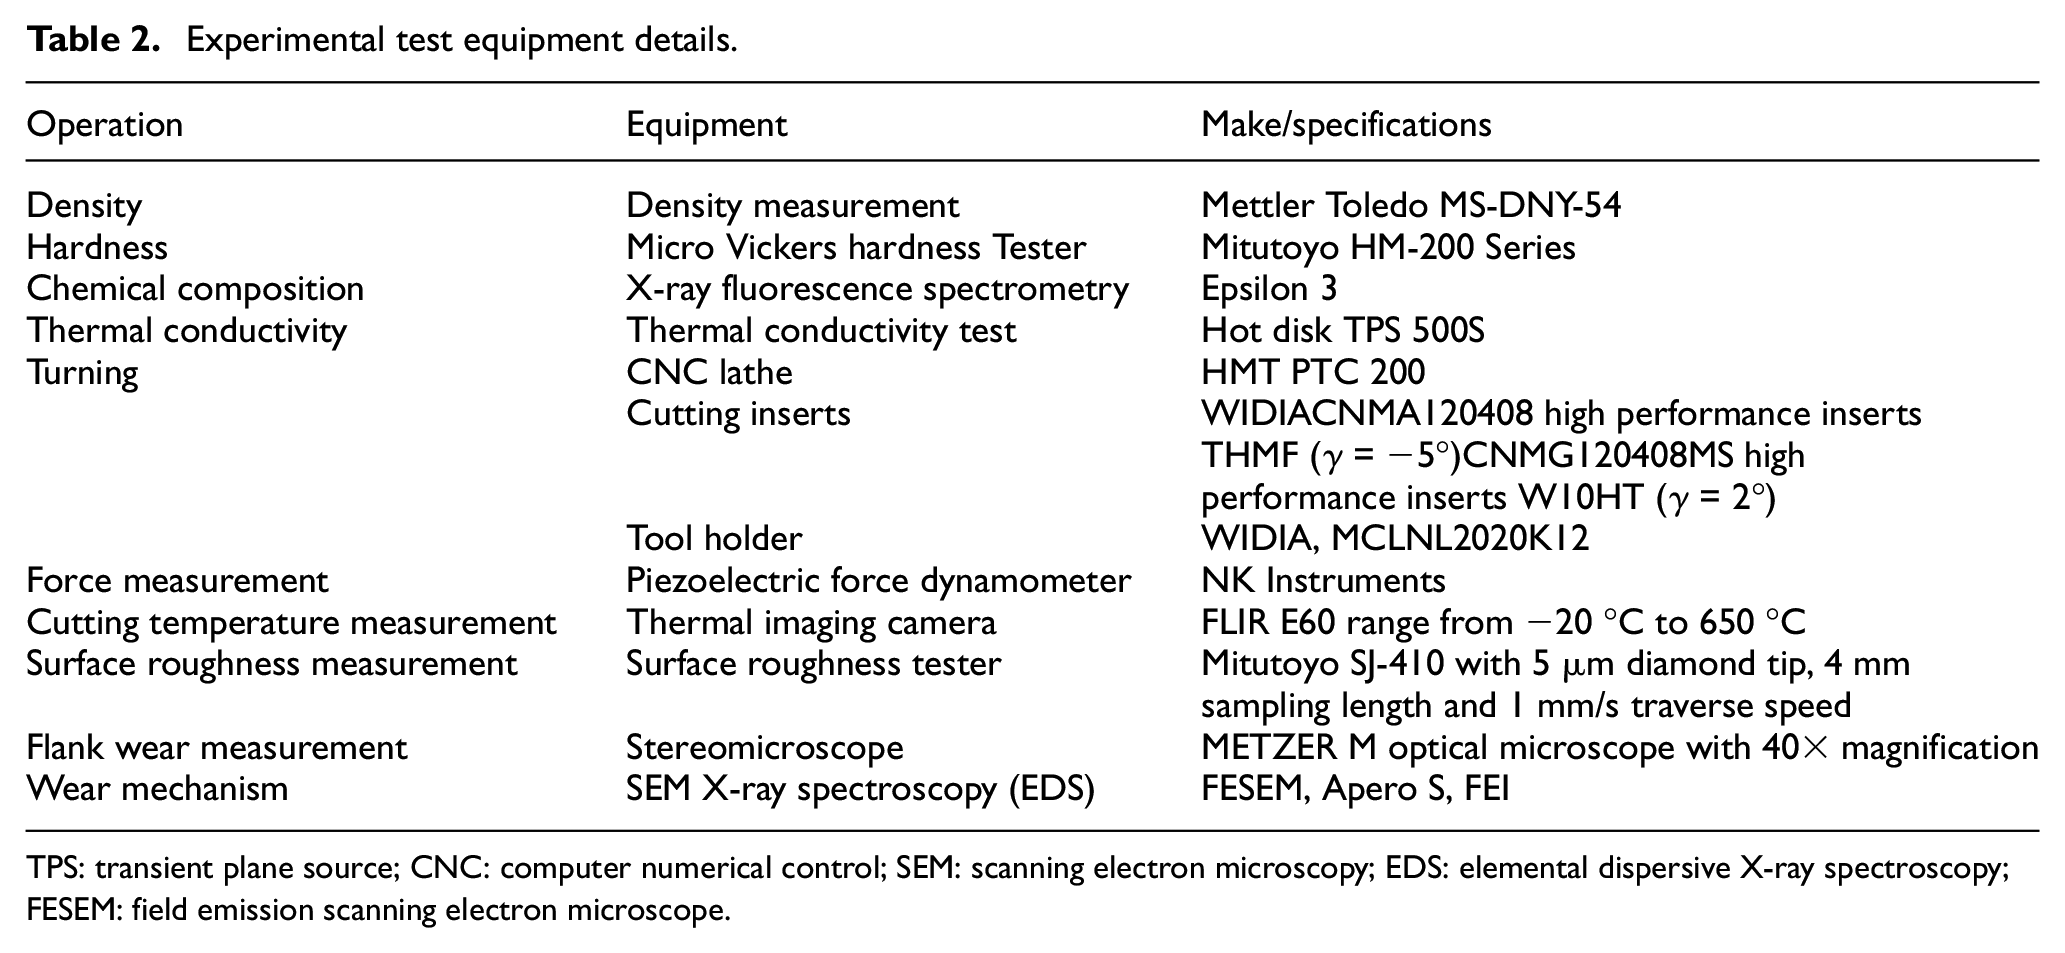
TPS: transient plane source; CNC: computer numerical control; SEM: scanning electron microscopy; EDS: elemental dispersive X-ray spectroscopy; FESEM: field emission scanning electron microscope.
Analytical approach
Analytical tool wear rate models describe the wear growth rate, that is, the rate of volume loss at the tool face (rake or flank) per unit contact area per unit time, as a function of various cutting process variables. 20 The analytical approach requires experimental tests to be continued until the tool wear criterion is reached. The minimum number of trials that must be performed is determined by the number of constants included in the given model. In this work, depending upon the observed wear mechanism, that is, adhesion, four tool wear rate models have been selected; out of which three models were developed by the researchers in the past and one was newly proposed. The tool wear rate models are (1) W1: Usui model, (2) W2: Matsumura model, (3) W3: Zhao model and (4) W4: modified Zhao model.
W1: Usui model
In this model, 13 wear rate is dependent on normal stress, cutting velocity and cutting temperature variation. The predicted wear rate, in terms of adhesive wear volume per unit time, is given as follows
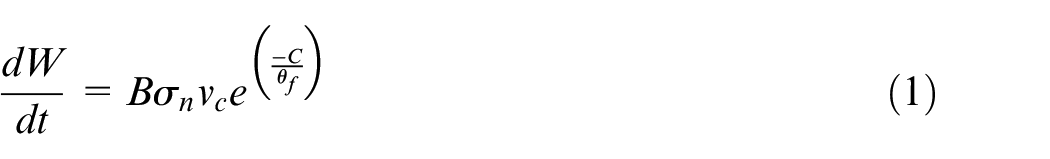
Equation (1) was further integrated and represented as follows
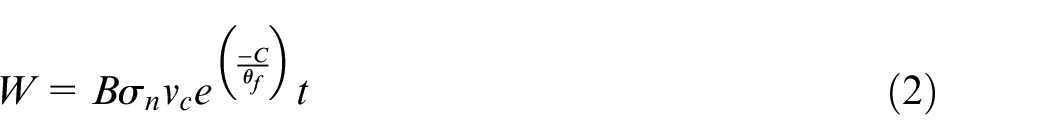
Assuming rake angle as 0° and volume of wear to be equal to flank wear

Hence, equation (2) can be rewritten as
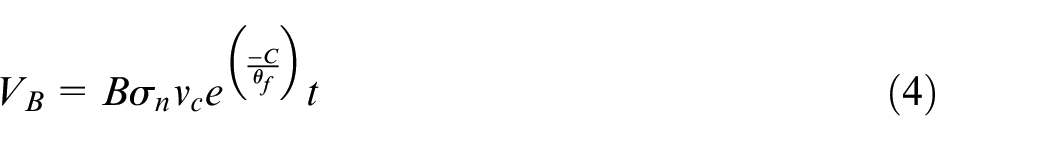
where B = 7.8 × 10⁻⁹ and C = 5301.6,
13


Similarly, cutting temperature

W2: Matsumura model
Matsumura et al. 21 is the modified version of Usui wear rate model which is a function of normal stress, cutting velocity, cutting temperature as well as tool geometry (rake angle and relief angle) with respect to time. The tool flank wear is shown as
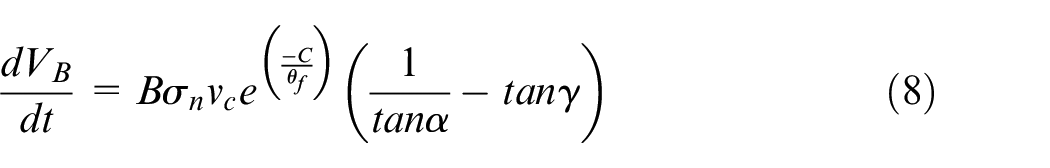
Equation (8) has been further integrated and represented as follows
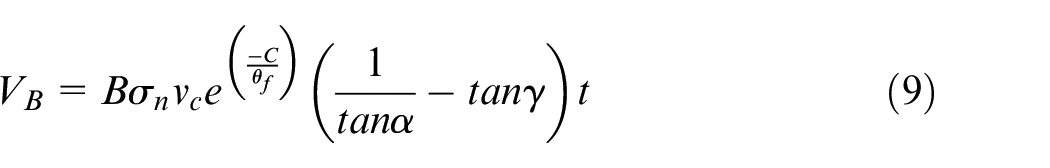
where B and C are the constants taken from W1 model, σn values were calculated using thrust force similar to W1 model using equation (5) and (6) and θf values were calculated using equation (7). α was taken as 5° and γ rake angle was taken as per experimental settings.
W3: Zhao model
The models W1 and W2 consider tool hardness, indirectly, in terms of wear constants. This indicates that the tool hardness would remain constant for any variation of temperature, which is not true. In order to overcome this limitation, Zhao et al. 14 introduced the effect of tool hardness with respect to change in temperature, cutting velocity, relief angle and normal stress with time progression during machining which is expressed as follows

where D depends on tool wear experiments; Z is temperature-dependent tool hardness as shown in equation (11); hardness constants A1= 0.000006, A2 = −0.054, A3= 0.5853 and A4= 1517
14
; and
W4: modified Zhao model
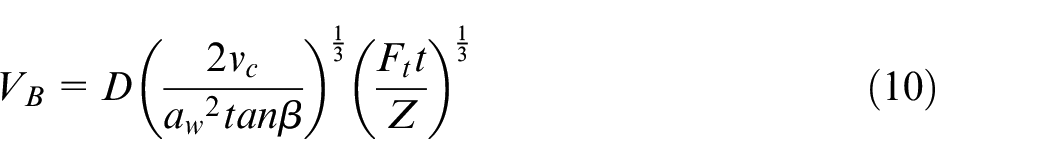
The proposed model is a modified form of Zhao model which included rake angle as an additional input parameter along with other factors considered in Zhao model. Besides, the modified Zhao model altered the temperature expression used in Zhao model by incorporating nonlinear temperature variation to capture temperature rise during flank wear growth more precisely. Note that all the three models considered temperature variation to be linear which is not true. The primary objective is to develop a robust wear rate model that fits well for varied rake angles and capture nonlinear temperature behavior. The fundamental relation between flank wear and various input parameters is shown below 15
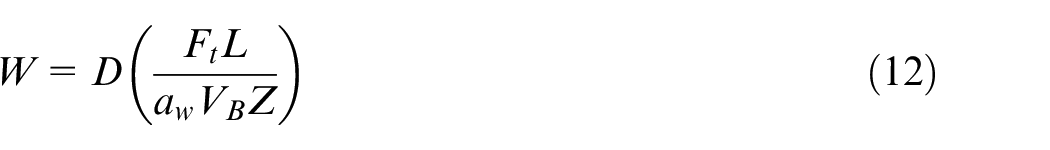
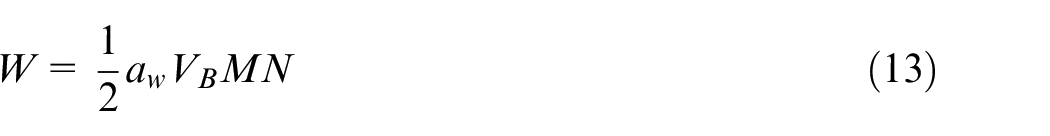
Figure 1 presents the schematic diagram of a cutting tool showing the wear land and cutting tool angles. Wear volume is converted to wear land measurement VB in equation (13) according to Stephenson analysis 22
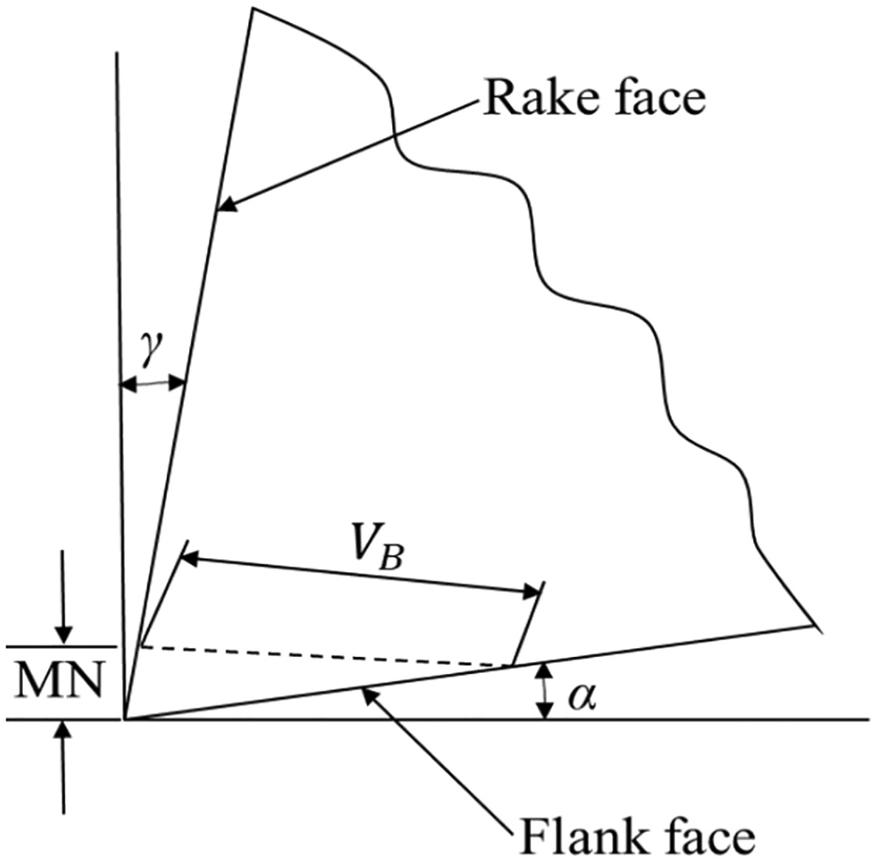
Schematic diagram of cutting tool with rake angle γ and relief angle α.
Wear land can be measured in terms of rake angle and relief angle (see Figure 1) and hence, expressed in equation (14)
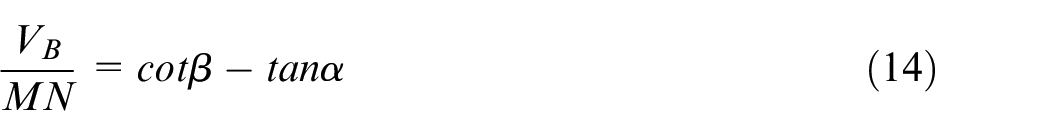
Furthermore, wear land MN from equation (14) has been substituted in equation (13) and expressed as follows
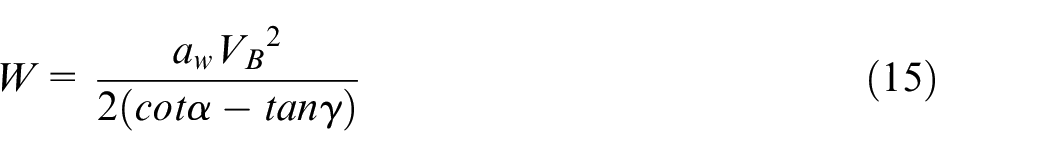
VB is a variable which increases with the development of flank wear. By substituting equation (15) in equation (12), flank wear can be expressed as follows
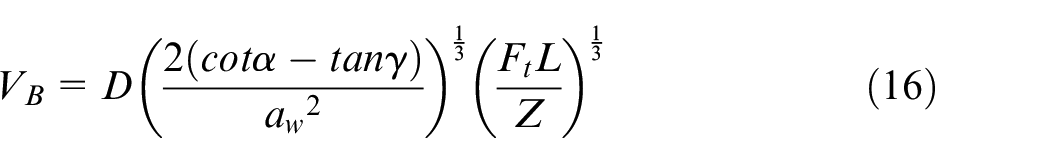
Since L = VCt, equation (16) can further be expressed as
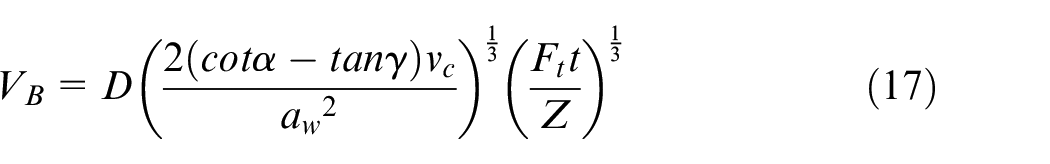
where D depends on tool wear experiments;


Equations (18) and (19) require measurement of
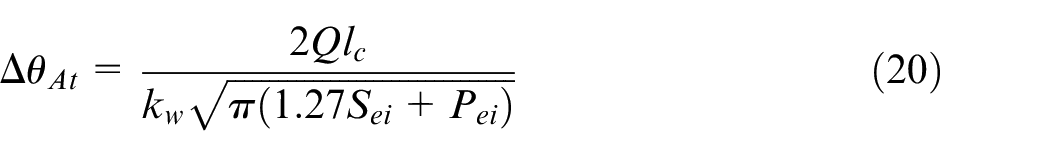
where
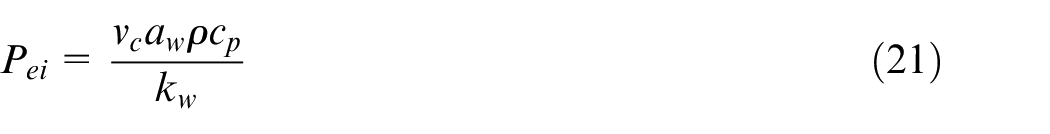

Figure 2 shows the stepwise approach for calculating the flank wear growth analytically using four tool wear rate models.
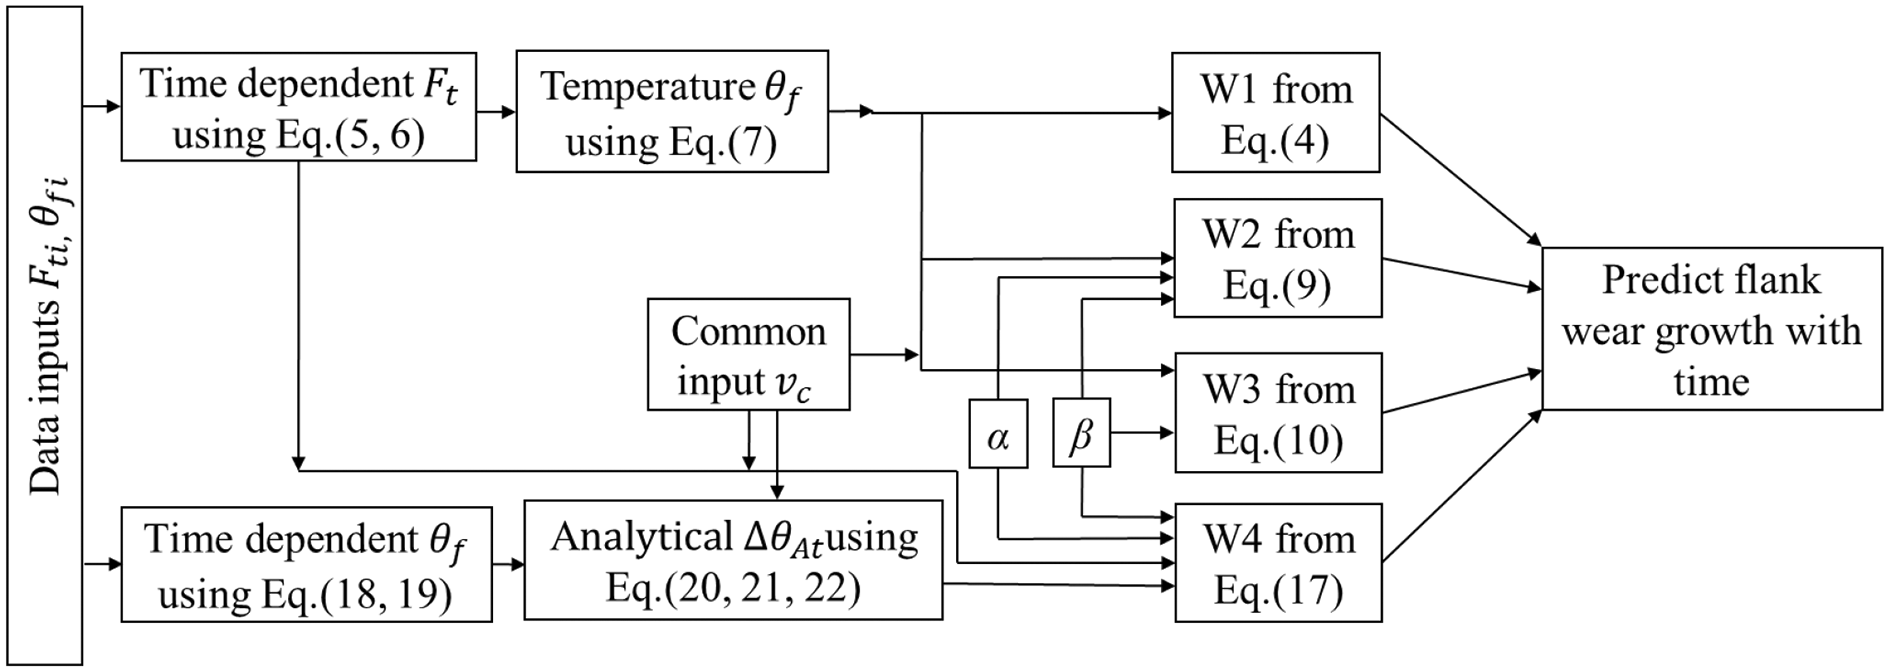
Stepwise approach for flank wear growth prediction analytically.
Figure 3 shows the overall methodology adopted in this work for experimental studies and analytical predictions.
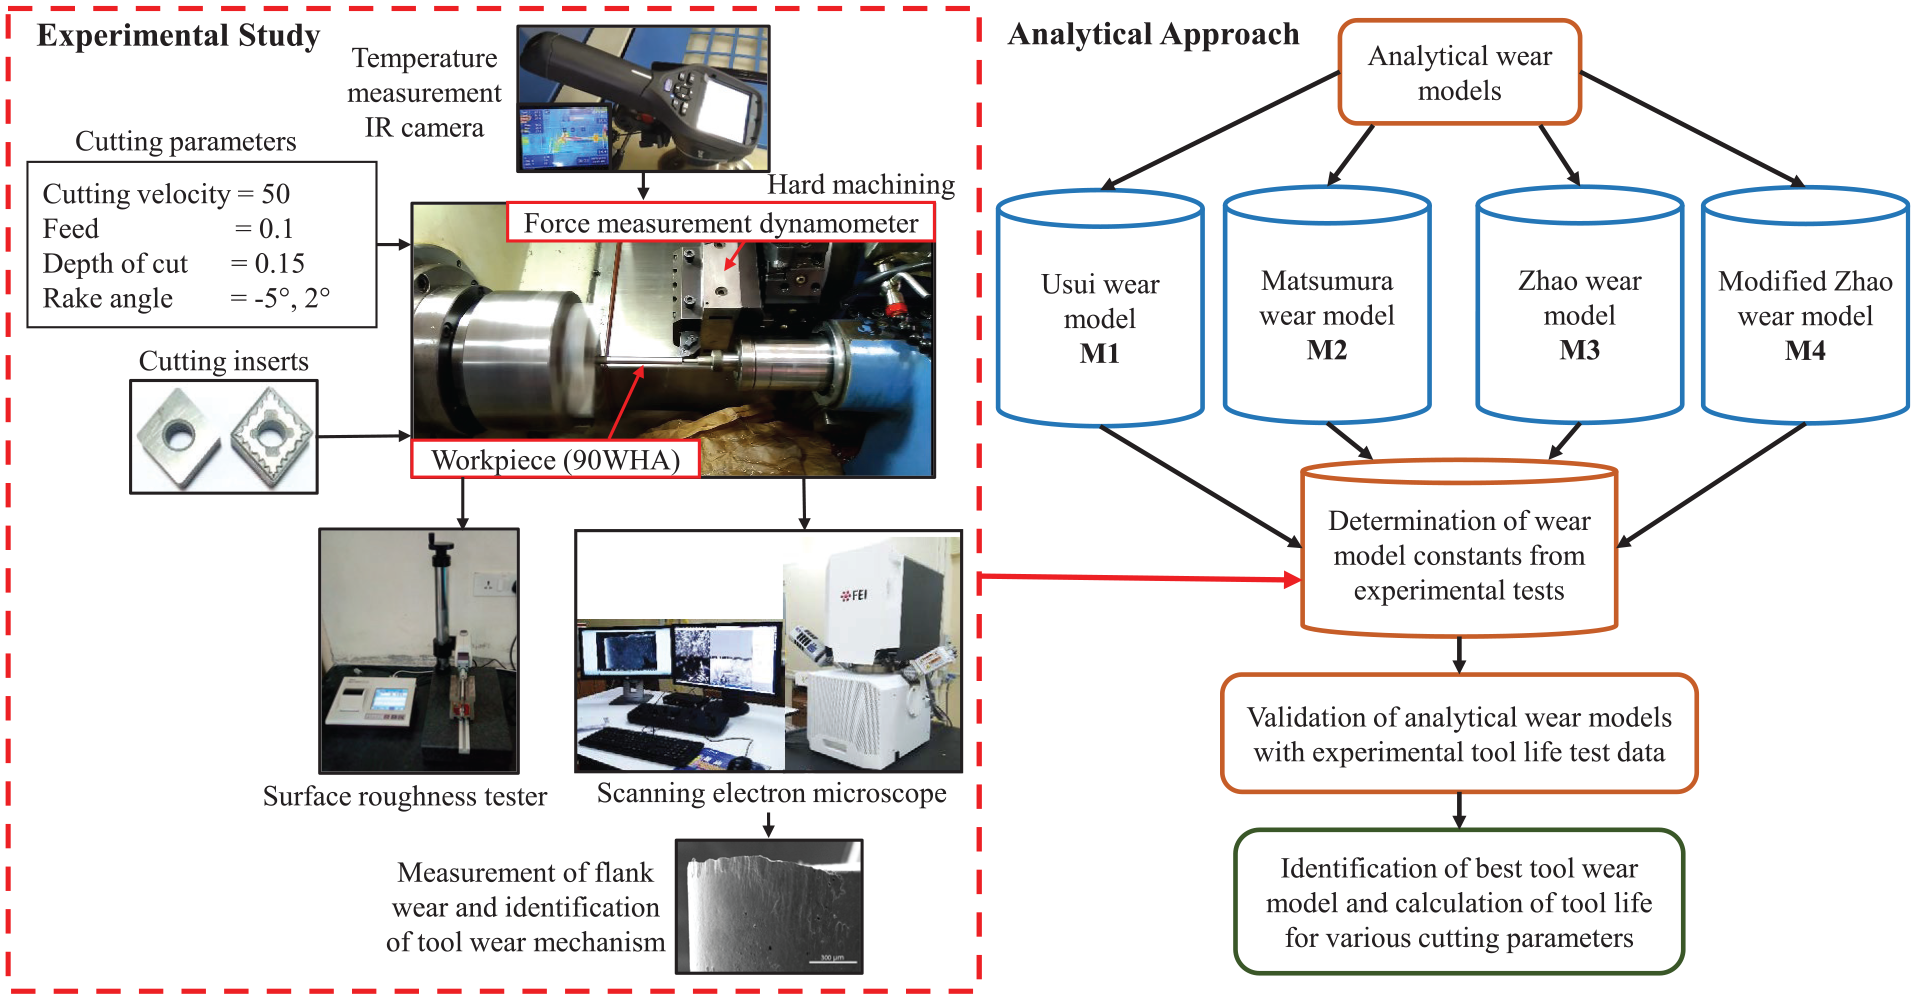
Overview of the methodology adopted.
Experimental results
Determination of tool life
Tool flank wear progression along with SEM images and BUE measurements for two different tool geometries (−5° and 2° rake angles) has been shown in Figure 4. The images were taken at regular time intervals as the wear progressed and presented according to three distinct regions of wear growth curve, namely, initial or rapid growth region, steady state region and catastrophic failure region. As presented in Figure 4(a) and (b), tool life came out to be 18 and 14.82 min for −5° and 2° rake angles, respectively. Though the difference in the values of estimated tool life was not much for the given tool geometries, SEM images showed a certain amount of difference in flank wear growth pattern. The development of BUE was observed during initial and steady state region for both cases. Based on the measured tool life values, it can be stated that the cutting tool with negative rake angle performed reasonably well as compared to that of positive rake angle for machining 90 WHA under similar cutting conditions. This was expected because negative rake angle leads to higher wedge angle which results in increased strength of tool tip, thus making the tool more sustainable under severe cutting conditions.
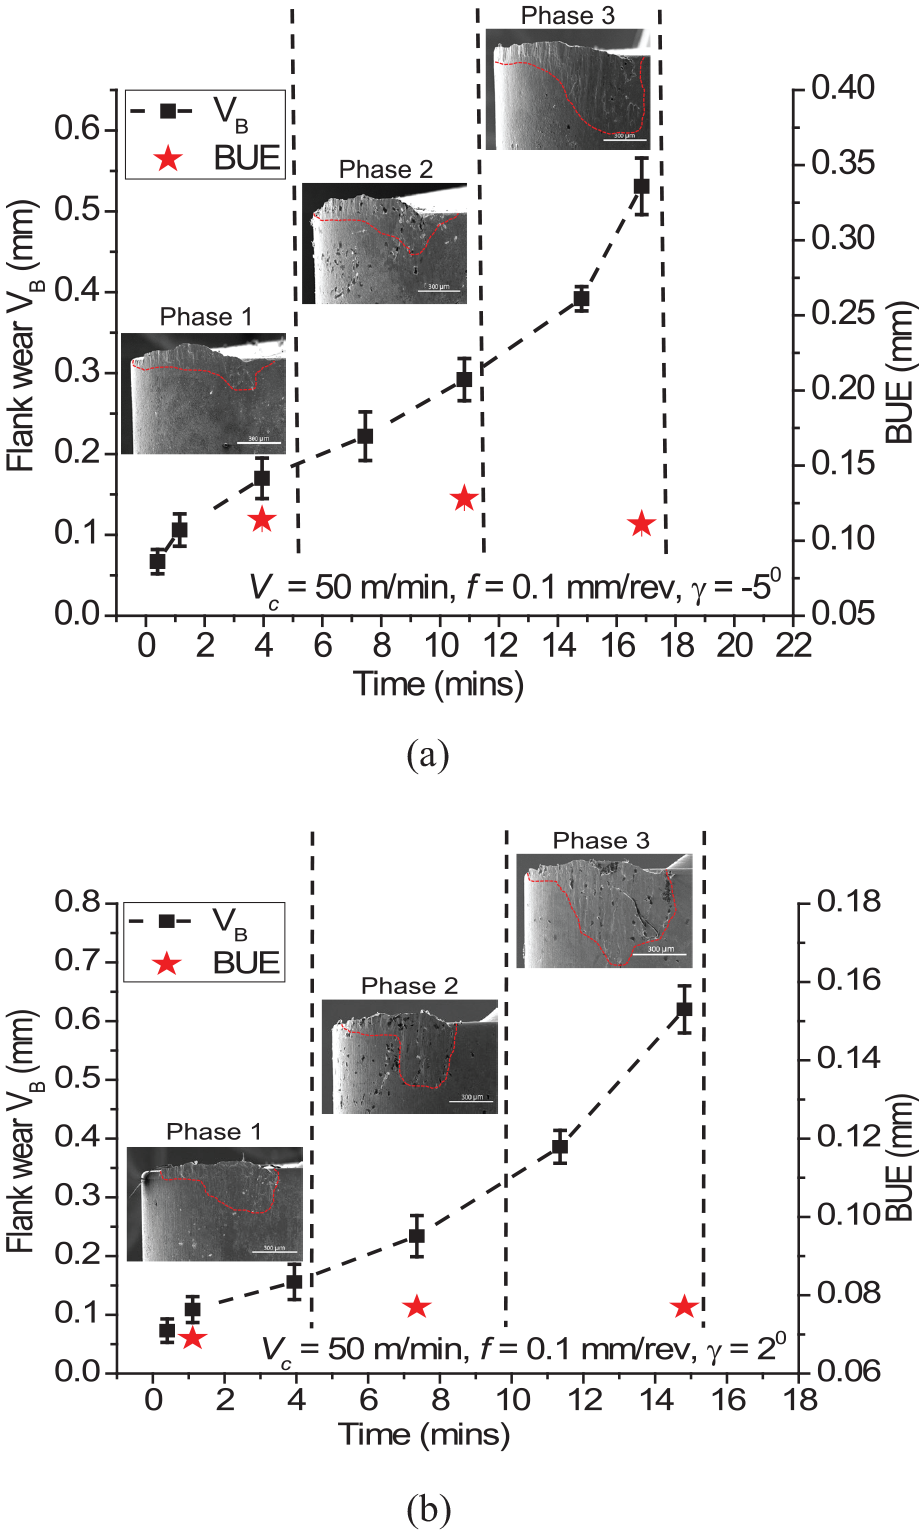
Flank wear measurements, SEM micrographs and BUE measurement for (a) −5° and (b) 2° rake angles and development of BUE with respect to three regions of flank wear growth.
Figure 5 shows the variation in chip morphology as the flank wear progressed. Discontinuous chips were observed during machining using negative rake angle (−5°). The chips became highly fragmented in the catastrophic failure region for −5° rake angle. It was observed that there was prominent BUE in the first two regions. The presence of BUE on the tool tip possibly changes the effective rake angle. Consequently, in the initial and steady state regions, chips obtained were slightly continuous. But as the BUE reduces, chips produced are highly fragmented or discontinuous. Whereas, for 2° rake angle, chips were not as fragmented as observed in case of −5° rake angle. Furthermore, not much change in chip morphology was observed with respect to the flank wear progress. Also, BUE formation for 2° rake angle was not as prominent as in the case of −5°.
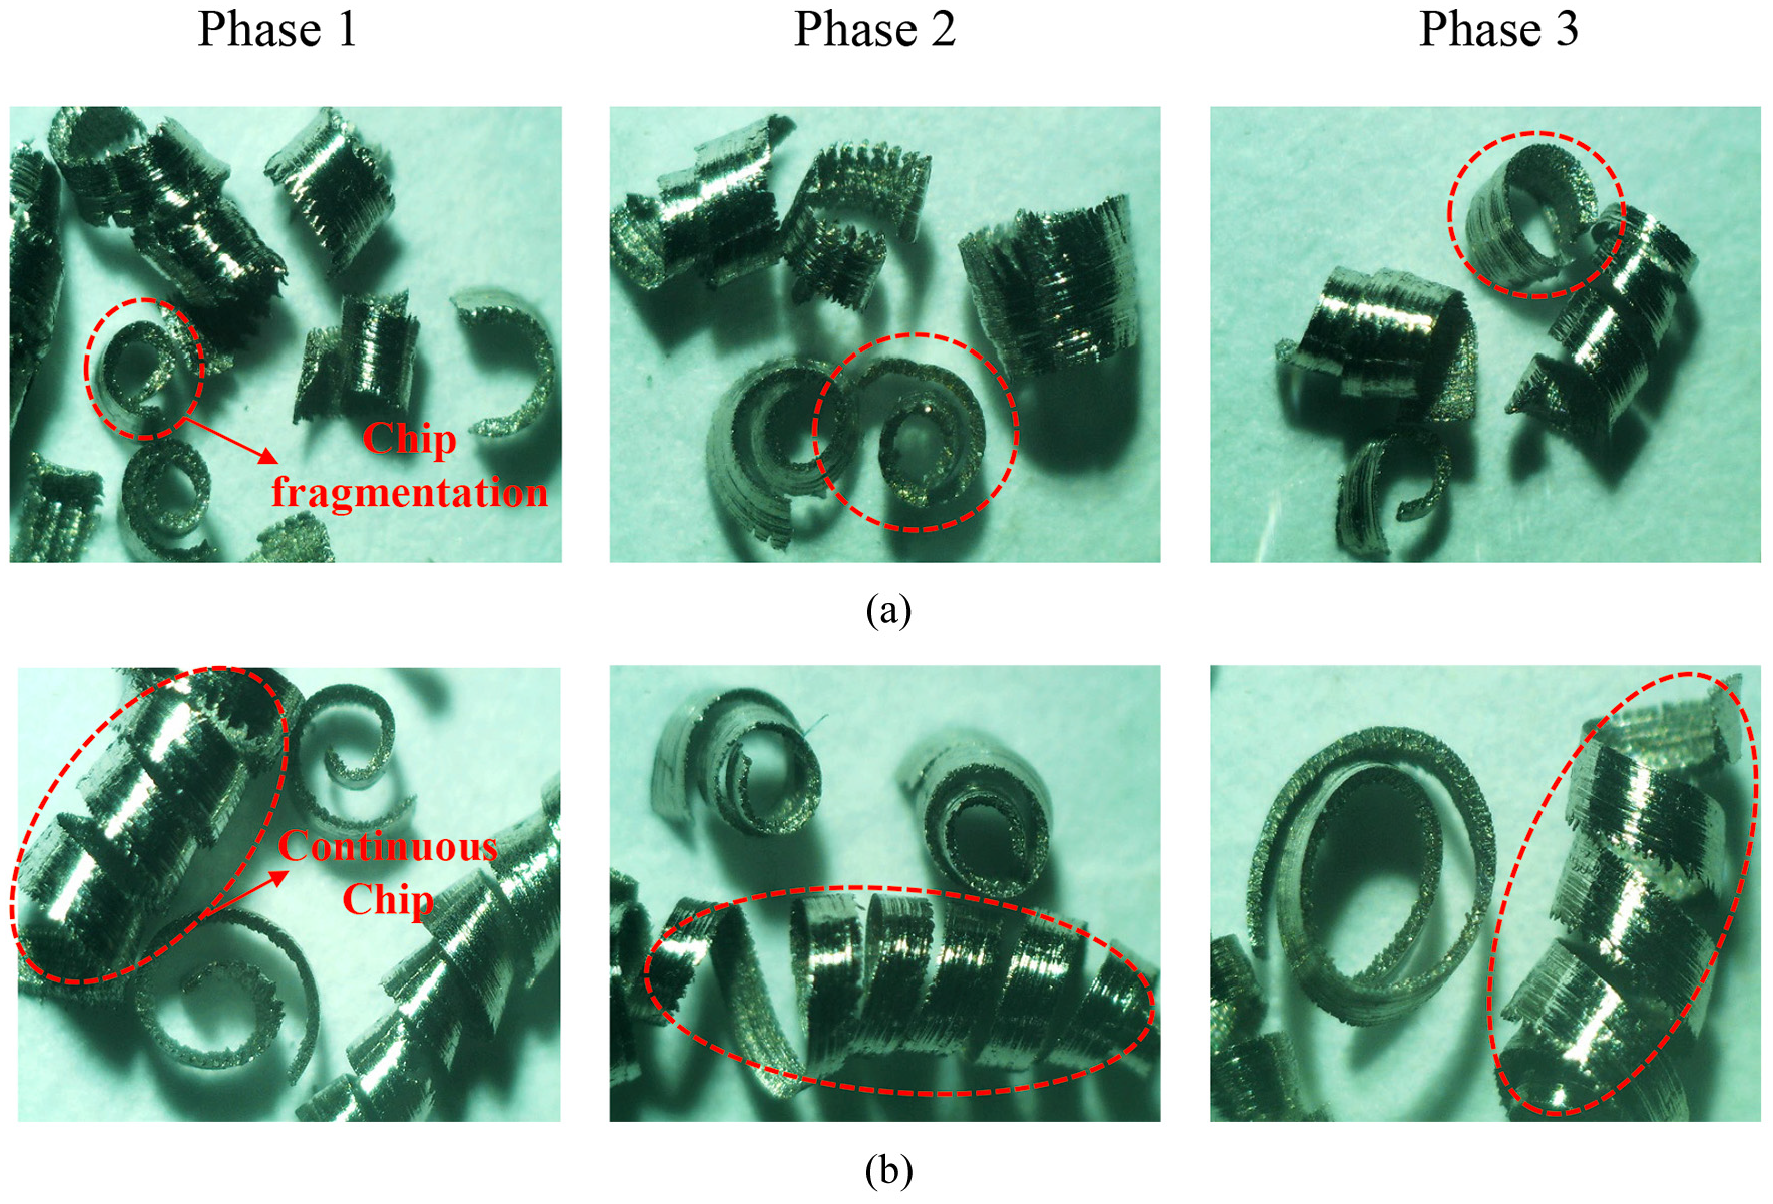
Variation of chip morphology with the flank wear progress for (a) −5° and (b) 2° rake angles.
Effect of flank wear on machining outputs
Figure 6(a) and (b) show the correlation between flank wear and cutting force components with respect to time for the rake angles of −5° and 2°, respectively.
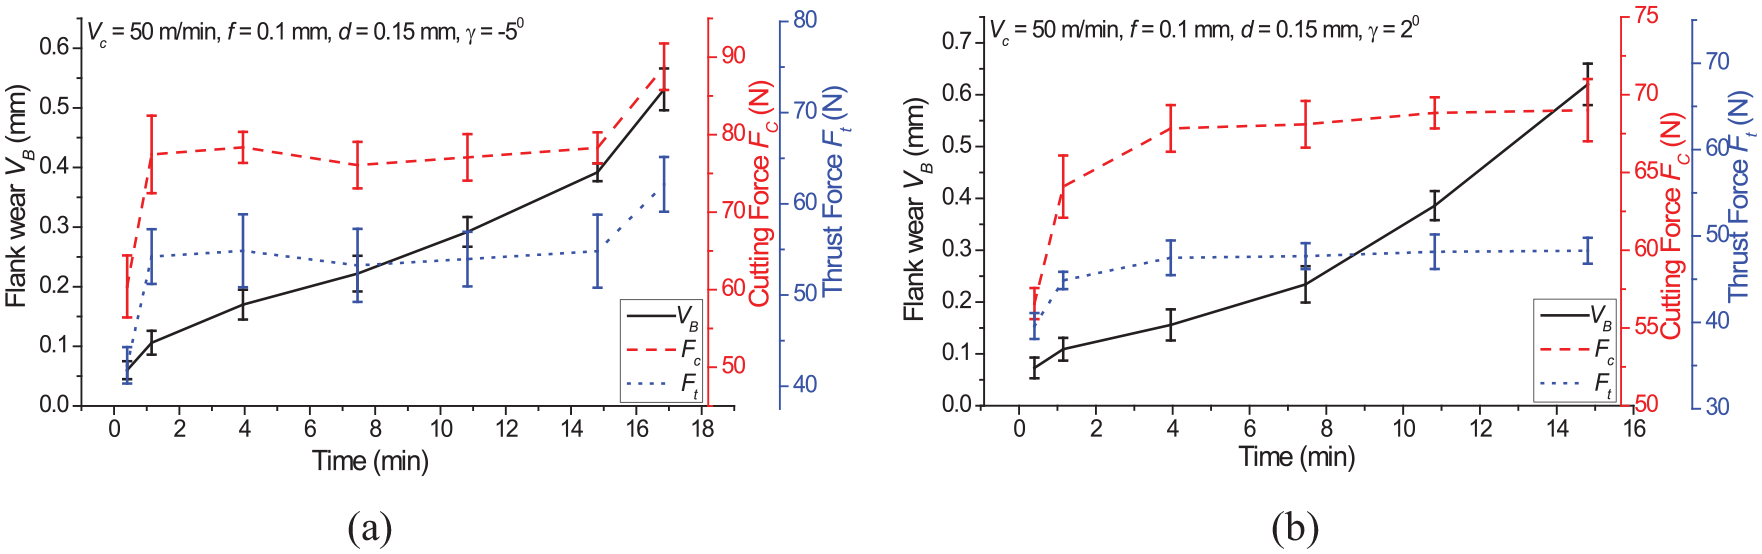
Variation of flank wear, cutting force and thrust force with respect to time for rake angles of (a) −5° and (b) 2°.
The trend for force components closely matched with all the three phases of flank wear growth, especially for −5° rake angle, showing three distinct regions similar to that of flank wear. A steep increase in force components was observed in the initial phase for both the tool geometries. This sudden increase in cutting force may be attributed to the development of BUE on tool tip as discussed earlier and similar observations were found by Zhang et al. 25 for TC21 titanium alloy with coated carbide tools. However, for the 2° rake angle, the forces increased gradually reaching a maximum value, nearly same as that obtained in the case of −5° rake angle. A similar pattern was observed for the temperature measured as the flank wear progressed. Figure 7(a) and (b) show the correlation between flank wear and cutting temperature with respect to time for the rake angles of −5° and 2°, respectively. In Figure 7(a), the sharp increase in cutting temperature can be attributed to the development of prominent BUE on the tool tip in initial as well as steady regions of flank wear growth. Because of such a steep increase in cutting temperature, thermal softening became the dominant factor over strain hardening and consequently cutting force components achieved a steady state. Similar observation was found by Sun et al. 26 during laser-assisted machining of Ti-6Al-4V. Further in the catastrophic failure region, BUE reduced considerably, thereby reducing the cutting temperature. However, further reduction in cutting temperature could be possible because of the formation of highly fragmented chips with the flank wear progression. It is noted that there could be possible chances of getting an error while measuring the cutting temperatures experimentally for highly fragmented chips. In Figure 7(b), for positive rake angle, a gradual increase in cutting temperature was observed as the flank wear progressed.
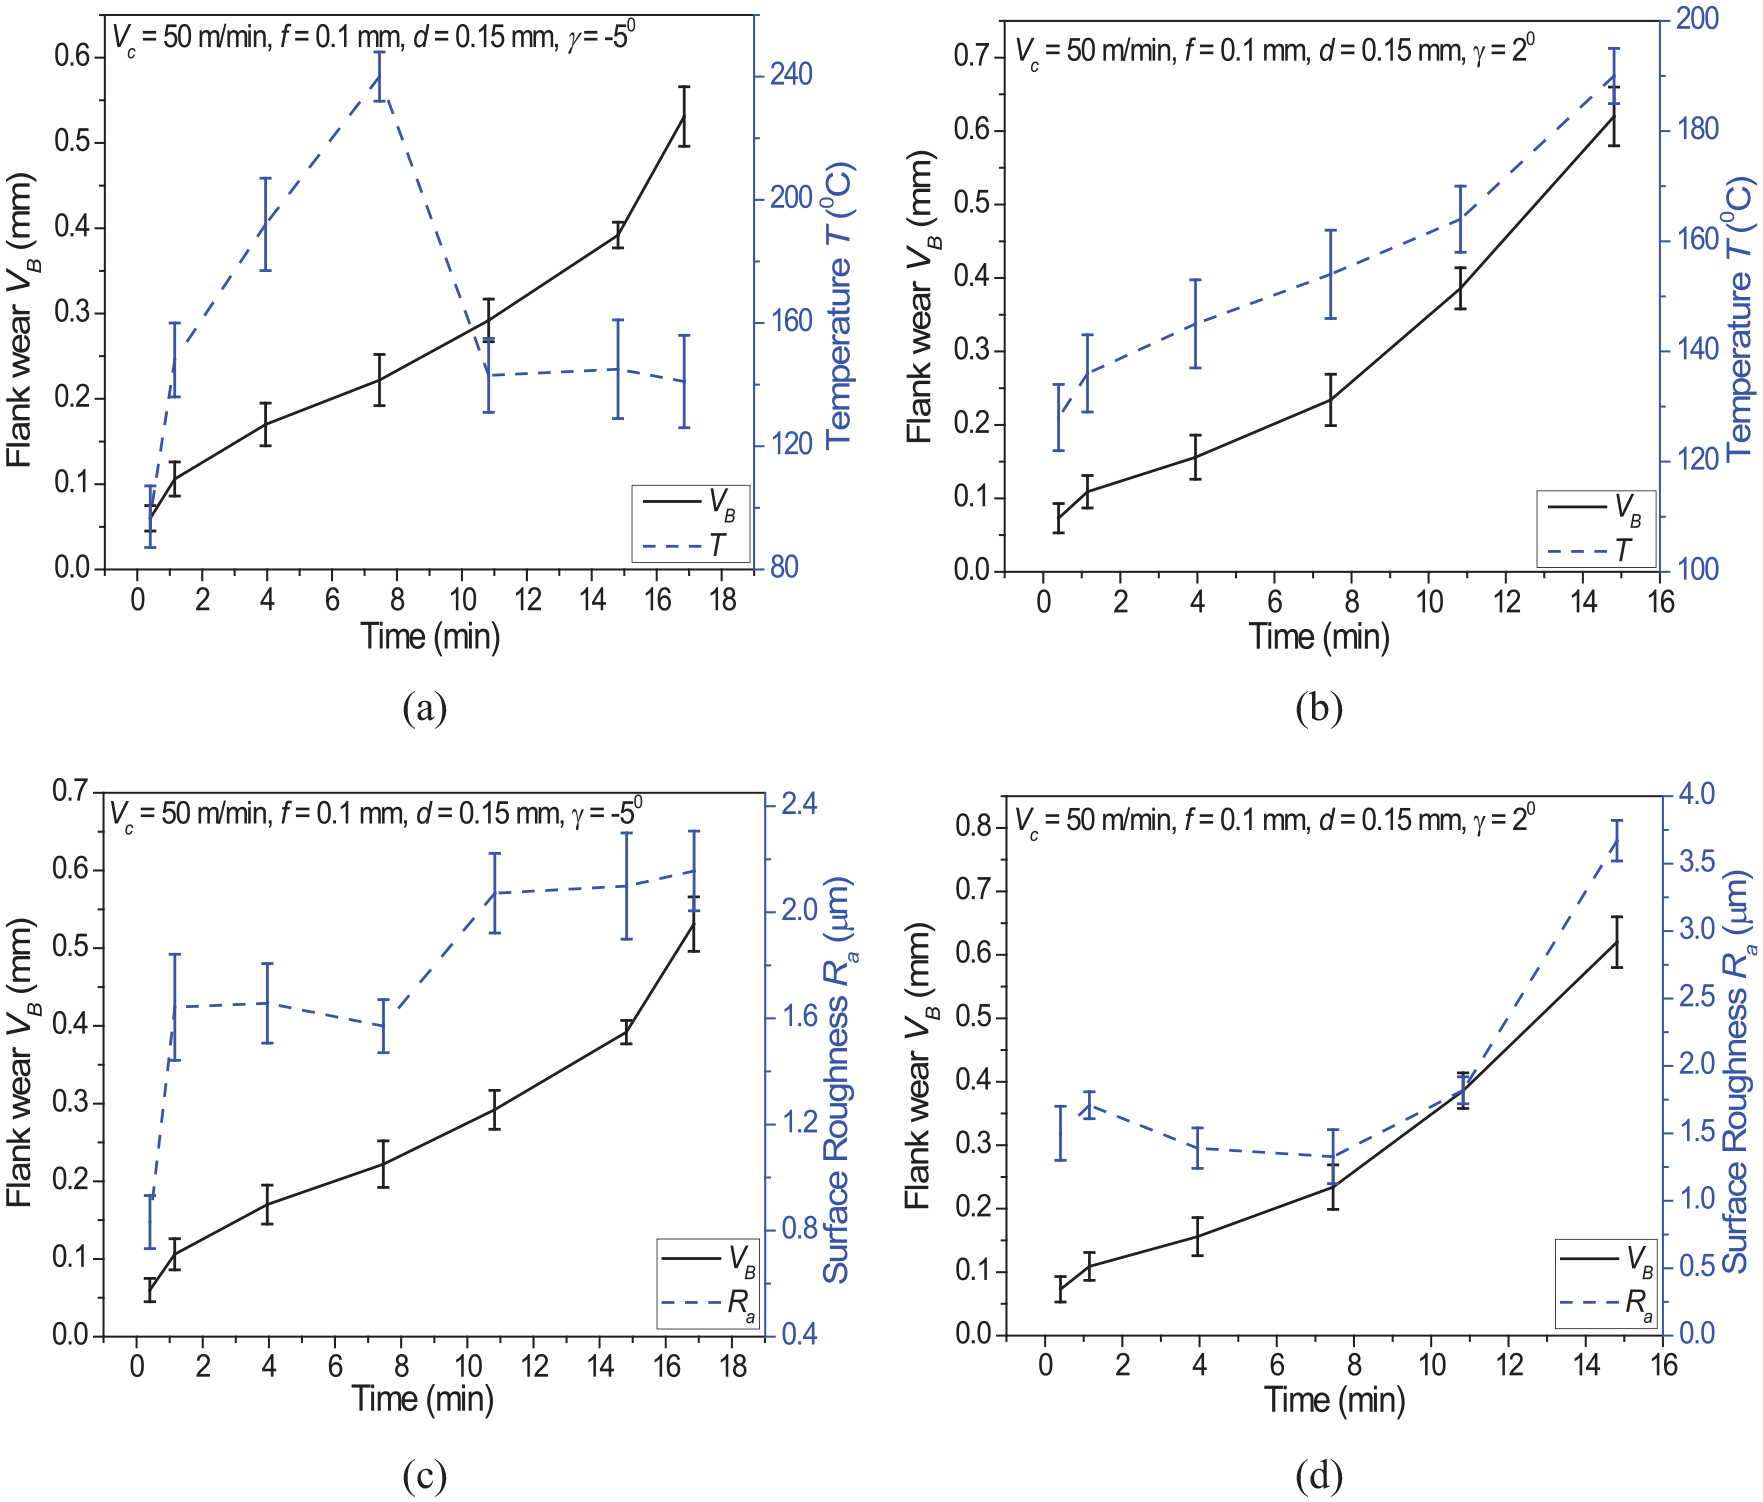
Variation of flank wear and cutting temperature with respect to time for rake angles of (a) −5° and (b) 2°. Variation of flank wear and surface roughness with respect to time for rake angles of (c) −5° and (d) 2°.
Similarly, the effect of flank wear on surface roughness was studied (Figure 7(c) and (d)) for both tool geometries. In both cases, it was evident that with the increase in flank wear, surface roughness increased. The surface roughness value reached a maximum value in the catastrophic failure region. It is observed that surface roughness values are lower in case of negative rake angle with a maximum value not exceeding 2.2 μm. Whereas for the positive rake angle, the maximum value of surface roughness is closer to 3.7 μm.
Thus, overall, it can be inferred as the cutting temperature increased, flank wear increased, and as the flank wear increased, there was a considerable increase in forces. The increase in forces could lead to vibrations which in turn would prove detrimental to the surface finish of the workpiece, thus leading to higher surface roughness values. Hence, this indicates that machining is a complex process, wherein the machining outputs are interdependent.
SEM analysis and identification of wear mechanism
Figure 8 shows the SEM micrograph of the flank surface of the fresh (unused cutting edge) cutting tool and the corresponding EDS analysis of the surface. The micrograph showed the arrangement of WC-Co microstructure on the surface of the unworn surface. While EDS analysis confirmed the chemical composition of the uncoated carbide inserts. These results would suffice as a reference for studying the worn surfaces of the given carbide inserts.
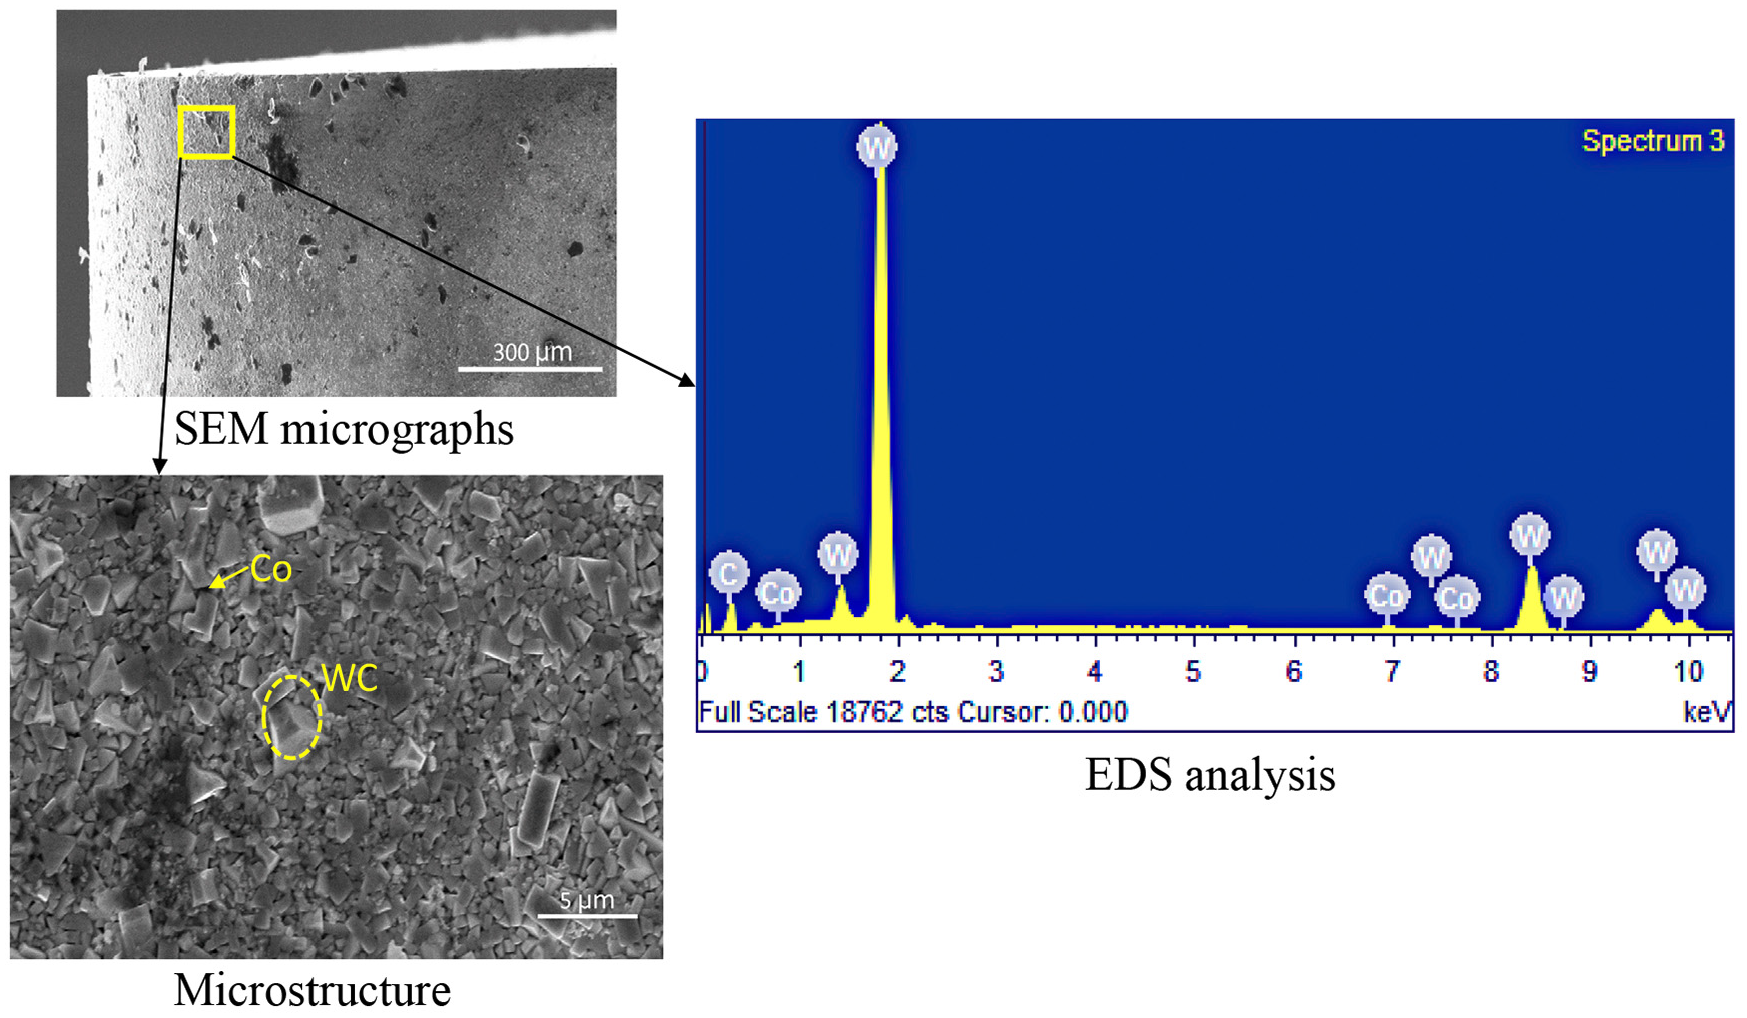
SEM micrographs, microstructure and EDS analysis of the unworn surface for the uncoated carbide inserts.
Figure 9 shows the SEM micrographs and the corresponding EDS analysis of the worn surface for the uncoated carbide inserts in the catastrophic failure region for rake angles of −5° and 2°, respectively. In Figure 9, the microstructural arrangements in the SEM micrographs appeared disorganized as compared to the initial one (see Figure 8). Such disarrangement could be due to abrasion that would lead to micro-cracks at WC/WC or at WC/Co interfaces or chipping due to the alternative stress.4,10 Consequently, few deep grooves or slip line traces on the surface of WC grains on the worn flank surface were observed. In addition, a prominent adhesion layer was also found. This may be attributed to a combination of high friction forces between the tool and the chip and high cutting temperatures in the catastrophic failure region. The EDS analysis in Figure 9(a) and (b) showed the presence of W-Ni-Fe elements. This indicated that the elements present in the adhesion layer are the same as that of the workpiece material, thus confirming adhesion as one of the predominant mechanisms. Furthermore, it was observed that Co and W elements have not diffused into the adhesion layer. Hence, the SEM micrographs showed the occurrence of both abrasion and adhesion. However, the accumulation of workpiece elements as adhesion layers was more prominent for both the tool geometries as compared to that of abrasive micro-scratches on the worn surface. Hence, in this work, adhesion was considered as the dominant mechanism, while machining 90 WHA using uncoated carbide for both −5° and 2° rake angles.
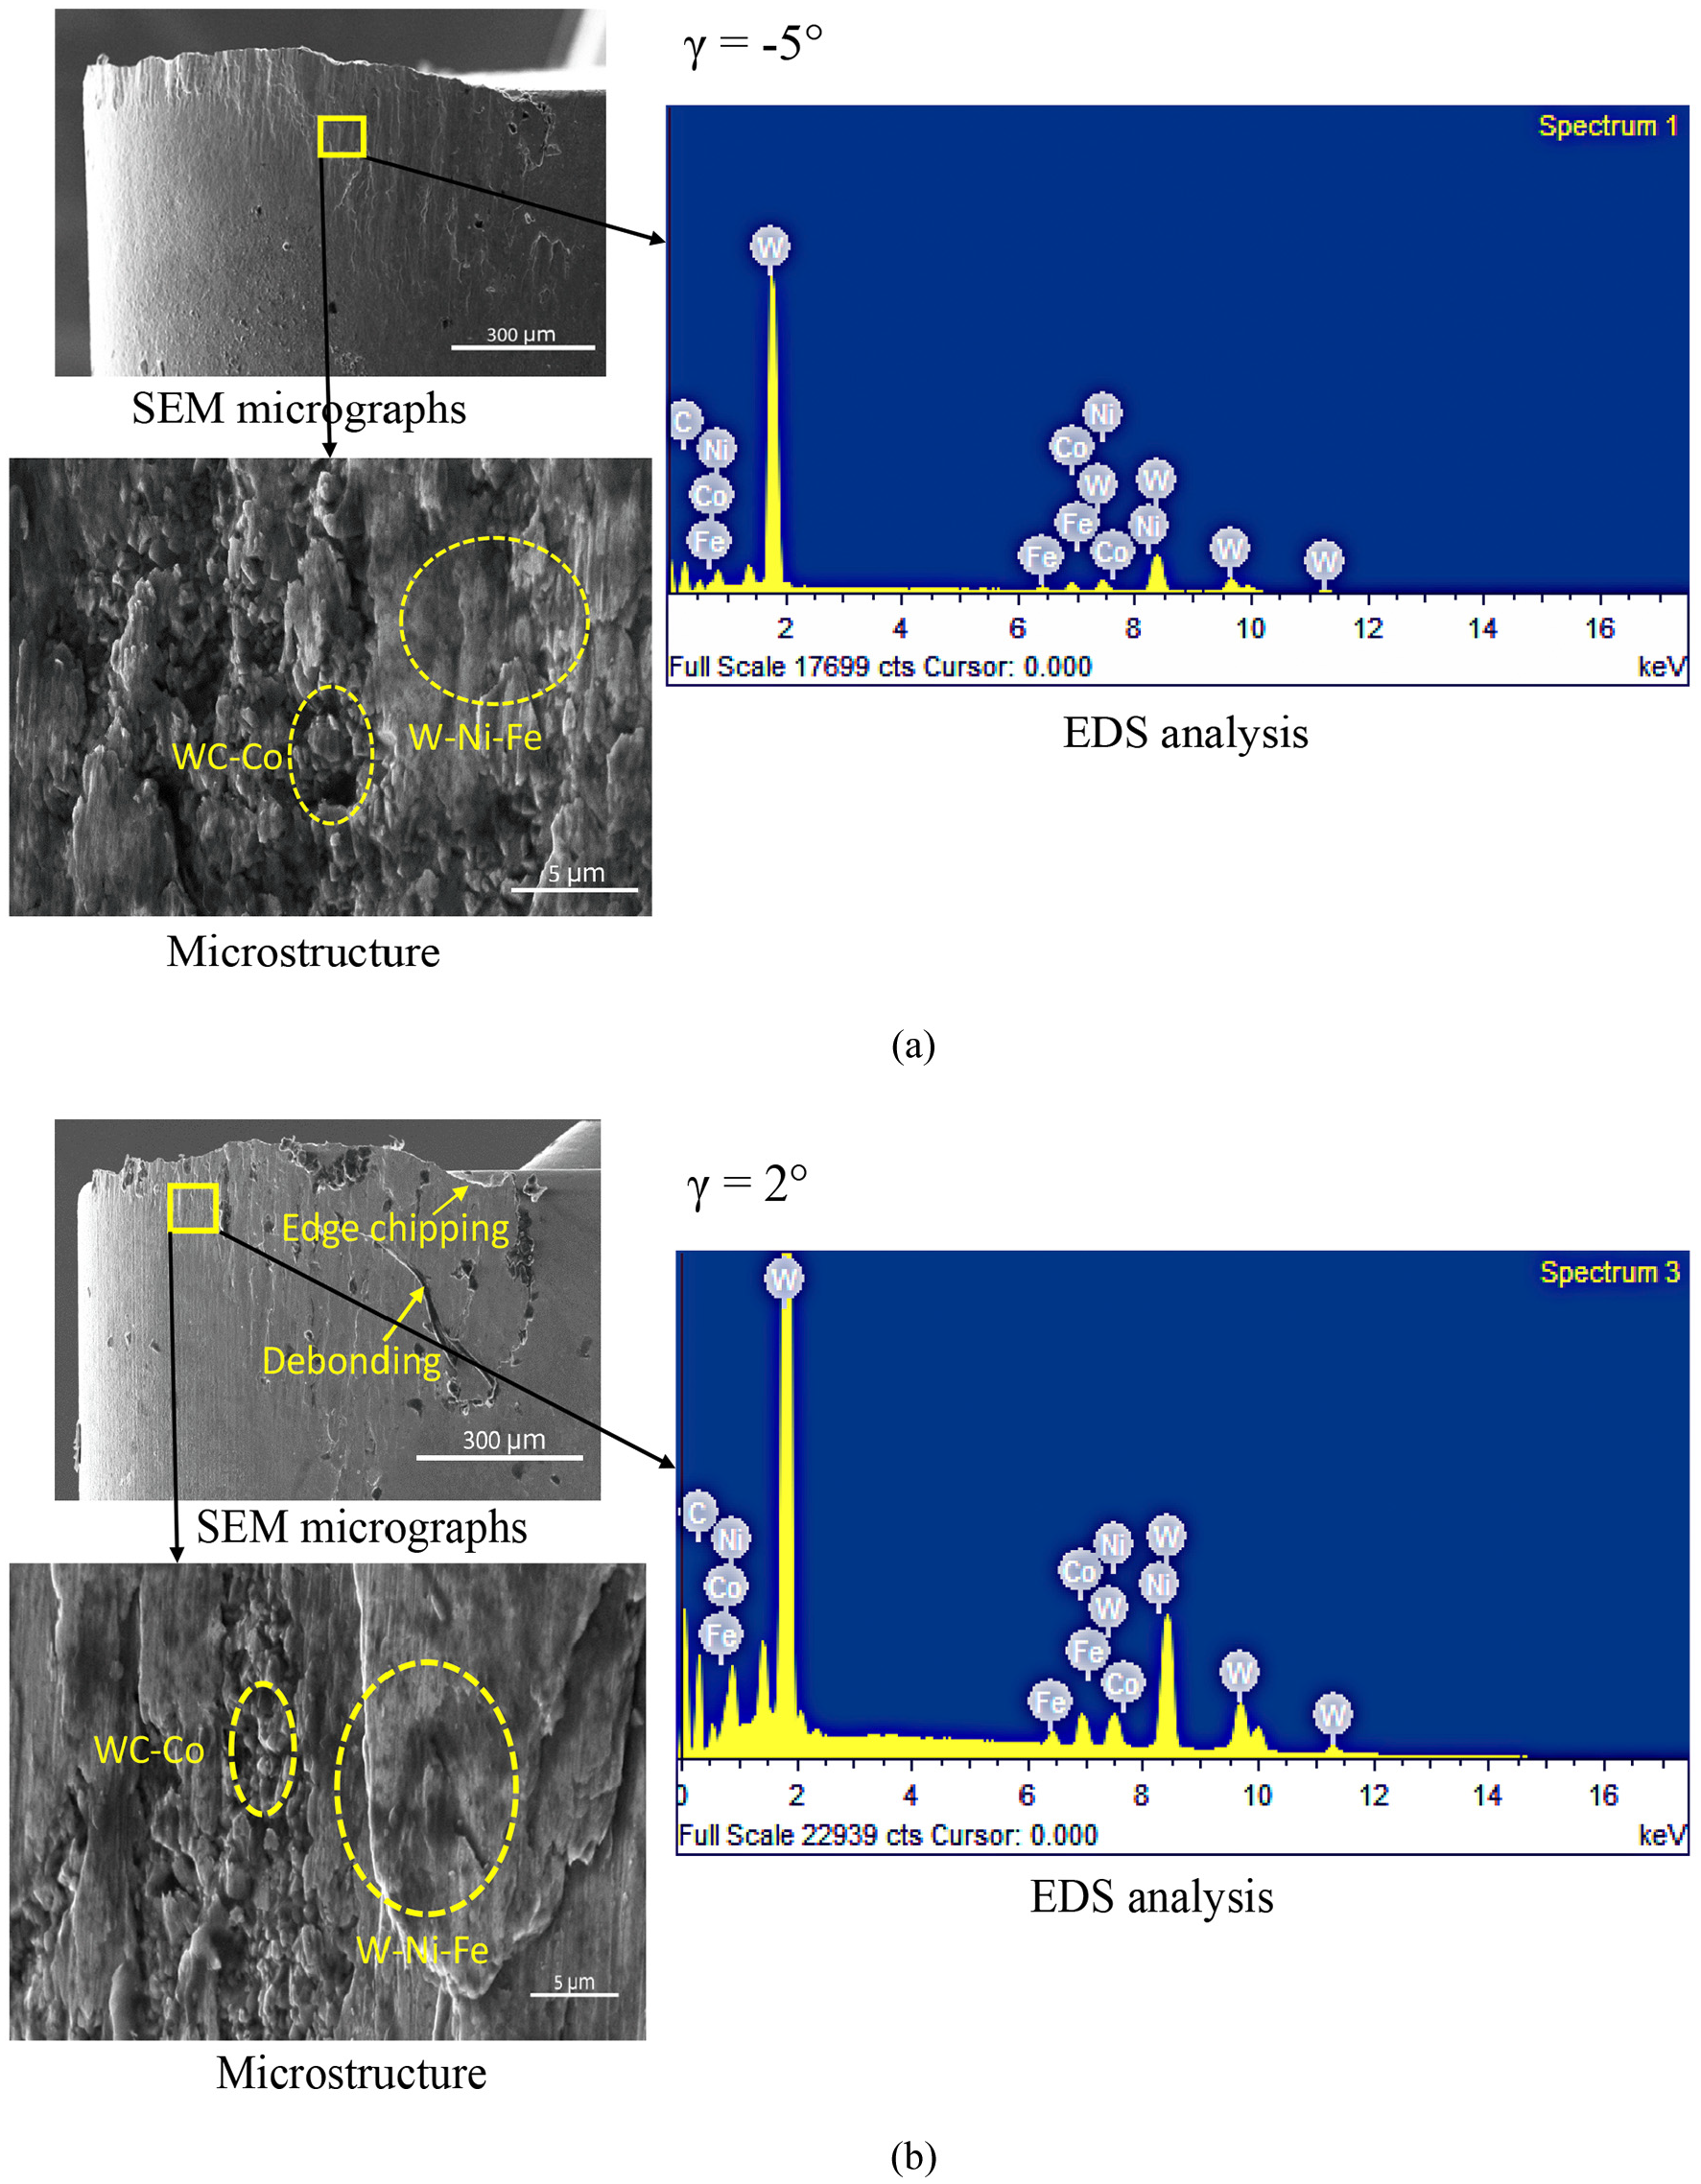
SEM micrographs, microstructure and EDS analysis of the worn surface for the uncoated carbide insert with (a) −5° and (b) 2° rake angles in the catastrophic failure region.
In the case of 2° rake angle (Figure 9(b)), deep scars appeared similar to the micrographs obtained by Kagnaya et al. 10 It was also reported that the adhesive layer at the tool–chip separation zone was formed according to a “formation–stacking–pulling out” process which may get removed periodically by the chip and such removal can be further amplified by the debonding of WC fragments. In order to confirm debonding, further investigations were performed on cutting insert with 2° rake angle by etching the worn surface in the ultrasonic cleaner for 1 h using methanol solution and then observing at higher magnification using SEM. Figure 10(a) and (b) shows the deep scars before etching which appeared similar to the debonding phenomenon and the wear scars after etching, respectively. It can be seen that the adhered layer on tool disappeared after etching, leaving few abrasion marks on the flank surface. This confirmed that it was an accumulation of workpiece material elements in the form of adhesive layer that got dissolved when etching was done. However, further use of this cutting tool would have led to debonding and, consequently, complete damage of tool tip.
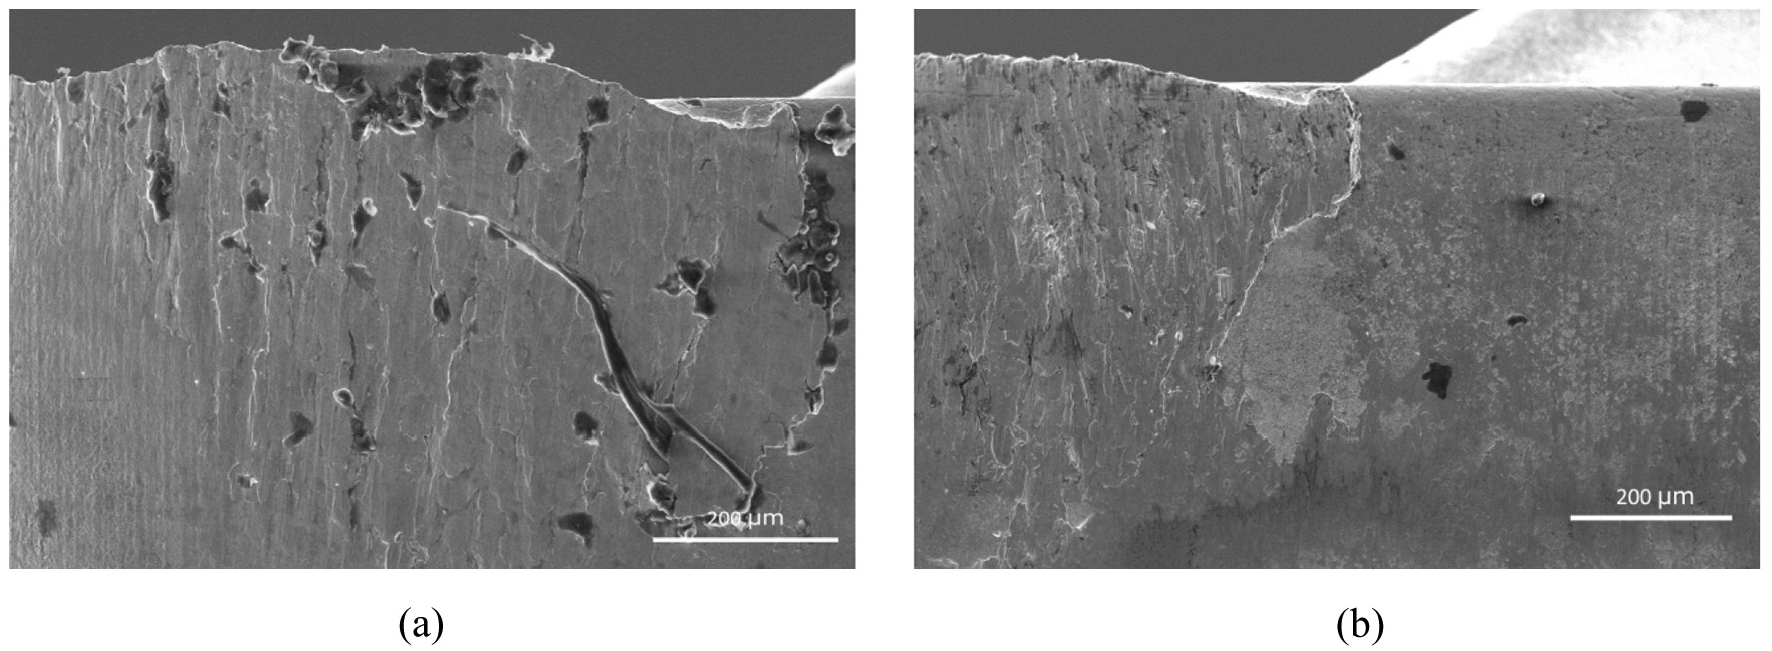
SEM micrograph of worn flank surface for 2° rake angle (a) before etching (b) after etching.
Flank wear prediction using analytical models
Comparison and experimental validation of tool wear rate models
The flank wear growth curves were predicted using W1, W2, W3 and W4 and compared with the experimental ones under similar cutting conditions. Since the predominant wear mechanism was found to be adhesion, the analytical models that considered adhesive wear mechanism were selected for this work. Figure 11 shows the predicted flank wear growth and their validation with the experimentally measured ones for rakes angles of −5° and 2°, respectively.
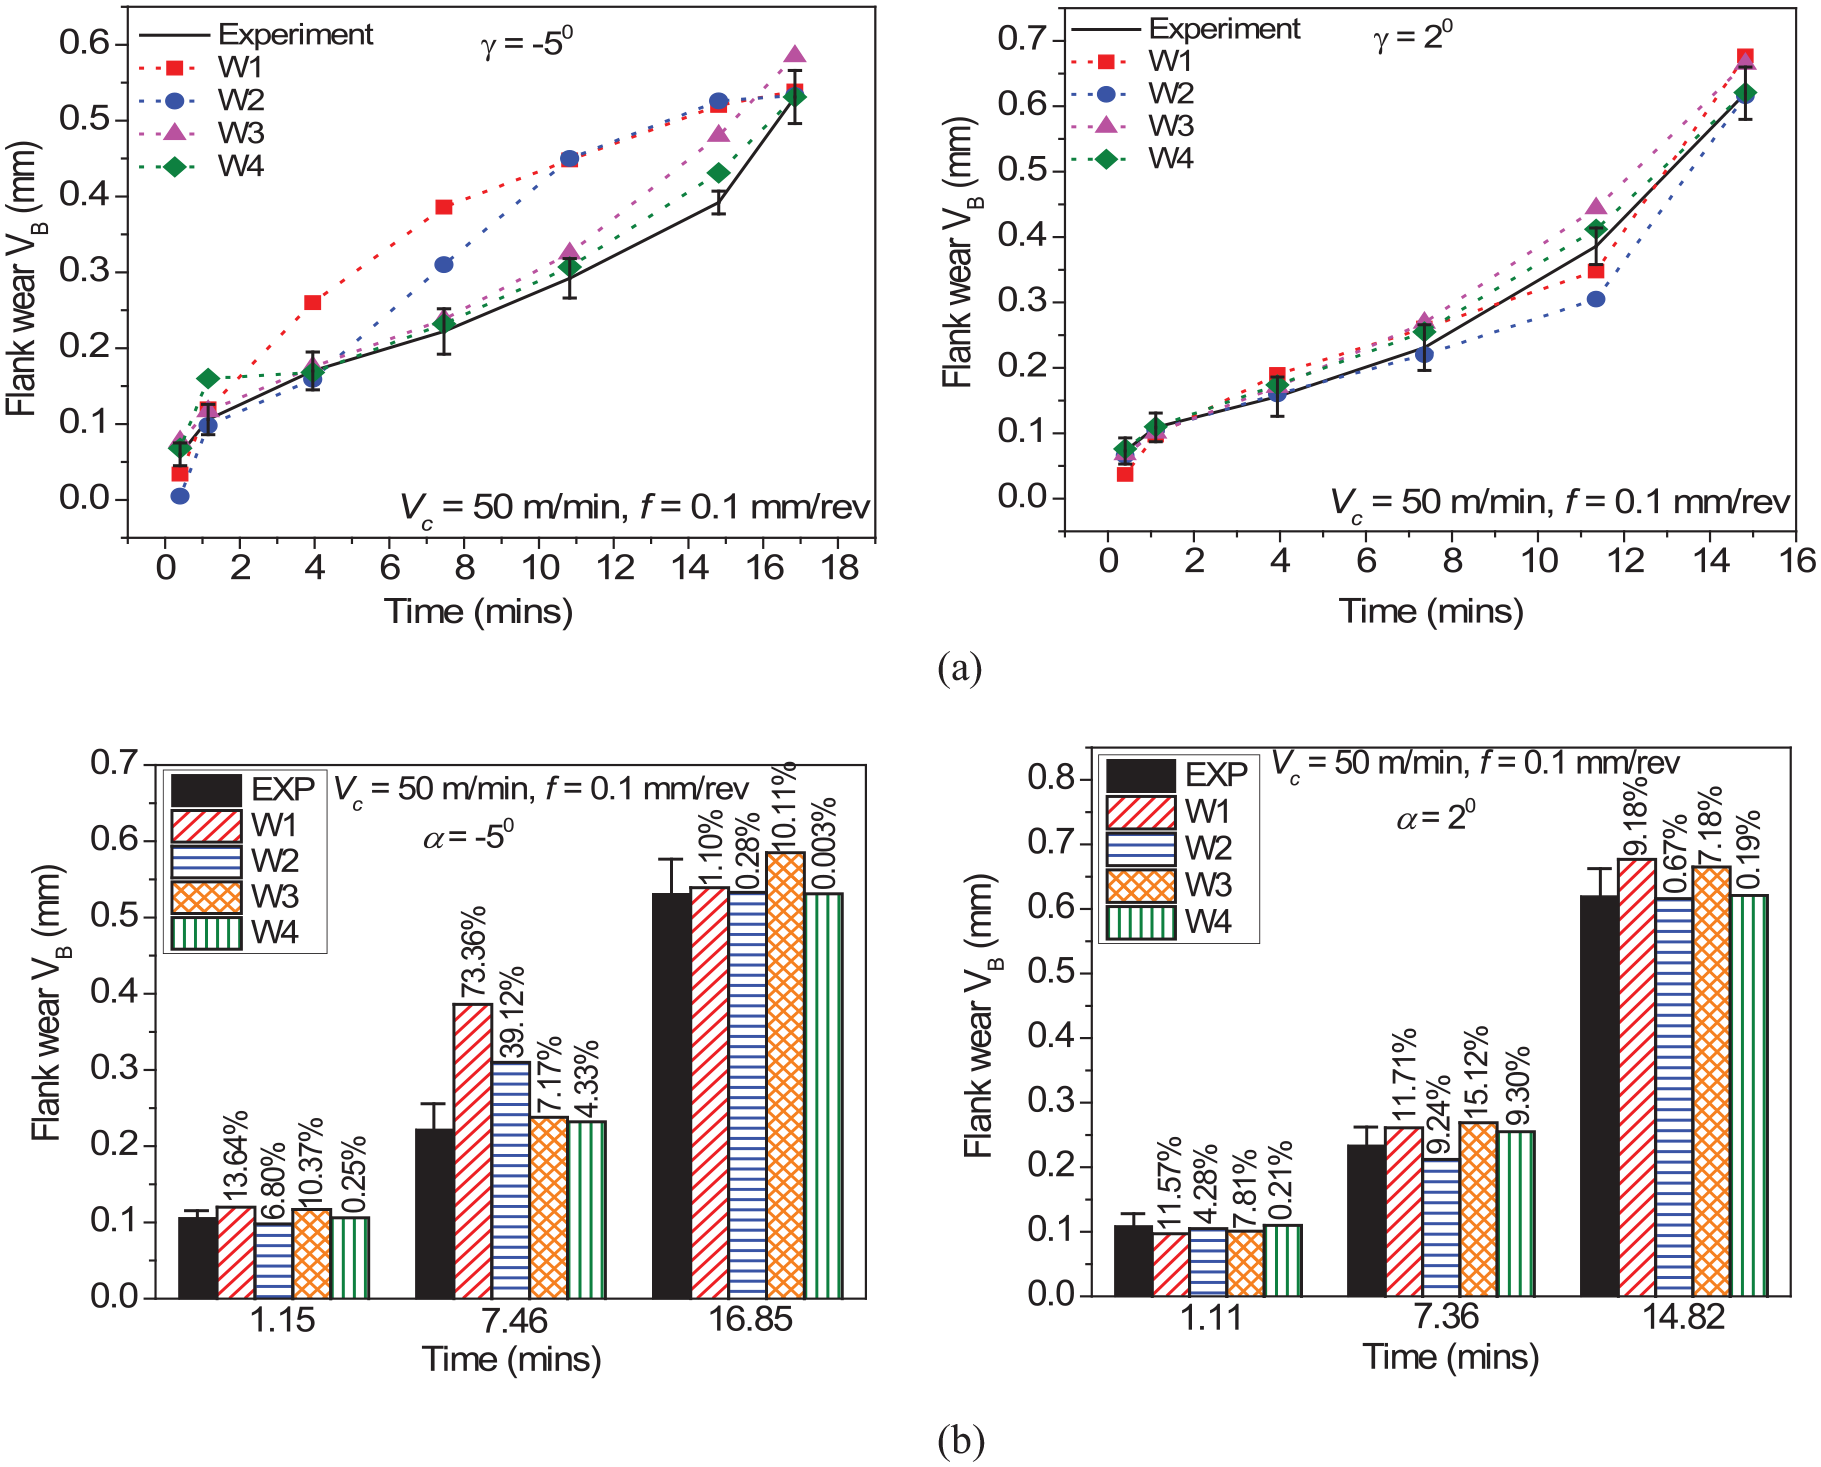
Comparison of tool life with respect to experimental and predicted tool wear models for −5° and 2° rake angles: (a) flank wear growth and (b) error percentage with experiment.
For −5° rake angle, it was observed that all the four models were able to predict flank wear growth with respect to machining time. But, W1 and W2 models could not capture the steady state wear region satisfactorily. This could be due to incapability of the models to capture the temperature-dependent tool hardness. On the contrary, flank wear growth curves predicted by W3 and W4 models could show the three regions of flank wear growth distinctly. However, larger deviation was observed for the model W3, particularly in the catastrophic failure region, as compared to that of W4. It is known that during the flank wear growth, till the steady growth region, the temperature is not that sensitive, but when the flank wear enters catastrophic failure region, temperature plays a significant role in accelerating the wear. Since W4 is the only model that considered nonlinear temperature variations, it could show better results as compared to others. Similarly, in the case of 2° rake angle, all the models could predict the flank wear growth fairly well, including W1 and W2 which had failed to replicate the steady region satisfactorily for −5° rake angle. Figure 11(b) shows the percentage error of the predicted flank wear as the flank wear progressed with respect to the experimental ones. Overall, it was observed that the newly proposed model came out to be the best model for predicting flank wear growth for both the positive as well as negative rake angles with error percentage as low as 0.003%. It is noted that one of the most commonly used model W1, that is, Usui model showed larger deviations, especially for the negative rake angle.
Prediction of tool life analytically
The model which showed the best results out of all, that is, W4 was used further to determine the tool life at varying cutting speeds. Experimental tool life tests were also conducted under similar cutting conditions and measured values of tool life are compared with the predicted ones. The primary objective was to check the robustness of the proposed model under varied cutting conditions. Figure 12 presents the predicted values of tool life using W4 at different cutting speeds for −5° rake angle as well as the error percentages with respect to that of measured values. It was observed that W4 could replicate the effect of the cutting speeds on tool life fairly well; that is, as the cutting speed increased, there was a decrease in tool life. Such observation was in accordance with Taylor’s tool life equation. Also, this was much expected considering the fact that higher cutting speeds lead to higher material removal rate and, consequently, higher cutting temperatures and thermal softening of tool. 27 Furthermore, the predicted values of tool life closely matched the experimental ones with error percentage well within 7%.
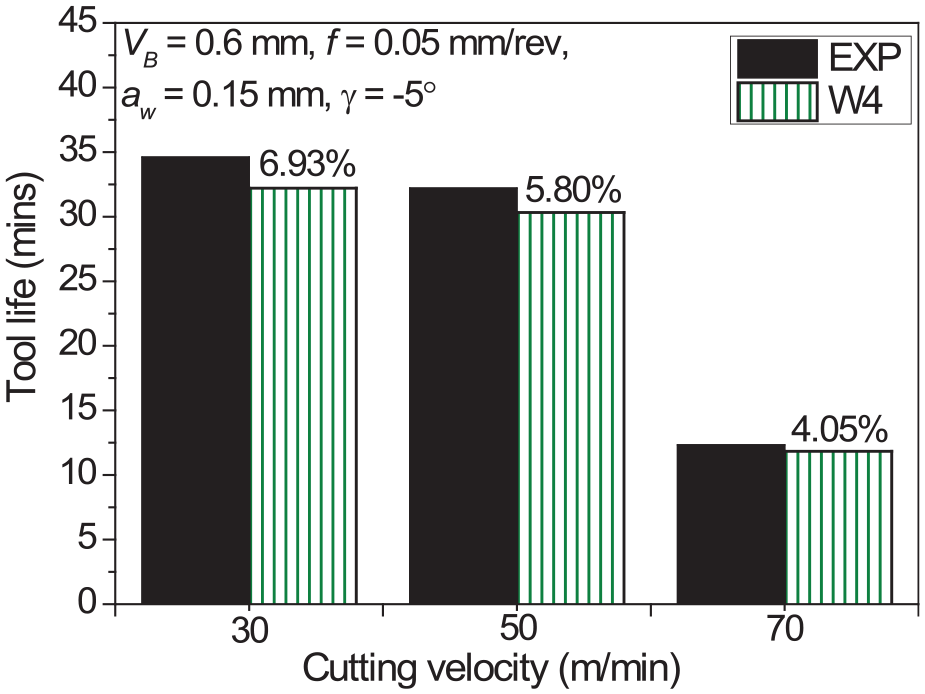
Comparison of experimental and W4 predicted tool life for varying cutting velocity at −5° rake angle.
As a whole, it can be stated that the proposed model W4 came out to be a good choice when compared with the tool wear models that are commonly being used to predict tool life analytically under varied cutting conditions. It is to be noted that the same model can also be extended not only for predicting the tool life for different grades of WHAs but also for cooling or lubrication conditions. Although the mathematical equations did not consider any parameters that are directly related to lubrication conditions, but it considers the effect of cooling and lubrication indirectly in the form of outputs such as cutting forces and temperatures. Since these outputs are affected by cooling or lubrication conditions considerably, the effect of the latter on tool wear growth gets captured inevitably.
It is also observed that approaches based on artificial intelligence techniques, such as fuzzy logic, neural networks and meta-learning models, have emerged in the recent past for monitoring and prediction of tool wear. 19 There is no doubt that such approaches have shown substantial improvements in the accuracy of predicting tool wear. However, the drawback of such an approach is that it is based on an empirical model which generally needs extensive experimental data. 28 In addition, these empirical models fail to explain the physical meaning. Whereas, the proposed model in this work includes mathematical equations representing the corresponding physical laws, thus giving a better insight of tool wear growth with respect to input and other output parameters. Hence, one feasible way could be to combine these approaches, if possible, to get the benefit of both.
Conclusion
The experimental studies showed that machining is a complex process wherein not only input parameters affect the machining outputs but also the machining outputs are interdependent. The results clearly showed that there exists a strong relationship between flank wear and other machining outputs, namely, force components, cutting temperature, chip morphology and surface roughness. Based on the measured tool life values, it can be stated that the cutting tool with negative rake angle performed reasonably well as compared to that of a positive rake angle for machining 90 WHA under similar cutting conditions. The SEM micrographs showed the occurrence of both abrasion and adhesion. However, adhesion was considered as the dominant mechanism while machining. Consequently, four tool wear rate models based on adhesion were considered for tool life predictions. Out of four models, the modified Zhao model showed superior results as compared to other models both for positive and negative rake angles under varied cutting conditions. The error percentage for the predicted tool life using model W4 was well within 4%–7%. The model, so proposed, can also be extended for varied lubrication conditions. However, there is always a scope for further improvement by combining the analytical approach with the emerging novel techniques.
Footnotes
Appendix 1
Declaration of conflicting interests
The author(s) declared no potential conflicts of interest with respect to the research, authorship, and/or publication of this article.
Funding
The author(s) received no financial support for the research, authorship, and/or publication of this article.