
Abstract
In micromilling the silicon carbide particle–reinforced aluminum matrix composites, cutting forces can provide a better insight of the cutting mechanism. In this article, an analytical model for force prediction in micromilling composites is developed considering the size effect of the matrix. In modeling, for the matrix, the cutting area is divided into shearing area and plowing area and the removal forces are established considering chip formation and edge forces; for the particle, the removal forces are established based on Griffith fracture theory. The model is verified by micromilling experiments. The influences of the process parameters (milling width, milling depth, and feed per tooth) on the milling force were studied. It shows that the maximum milling force increased with the increase in the feed per tooth and the milling depth and increases first and then stabilizes with the increase in milling width; the average milling force increases with the increase in the three parameters. In addition, the contribution of the particle fracture force is analyzed, and it is found that the contribution of the particle fracture force is affected by the feed per tooth, which basically accounts for about 23% of the maximum milling force and accounts for 23%–30% of the average milling force.
Keywords
Introduction
Due to the high-strength-to-weight ratio and improved thermo-mechanical properties, silicon carbide particle–reinforced aluminum matrix (SiCp/Al) composites are being used in many fields, such as avionics packaging, microfluidic channels, micronozzle array, microsensors, space mirror substrate, and so on.1–4
Miniature composite components in the aforementioned applications usually have millimeter-level geometries with micron-level accuracy. However, the machinability and surface quality of this material are poor because of particles’ extreme abrasive properties and the different removal characteristic of the matrix and the reinforcement.5,6 Even though some of these components can be made by fabrication methods or net forming methods, the micromilling technique is indispensable considering the cost, precision, and flexibility of three-dimensional process. 7
Cutting forces have an important influence on material removal and surface quality and are also important for evaluating machine tool energy consumption and bearing capacity of various components. 8 So far many efforts have been made for modeling of cutting forces in micromachining of metals.9–14 Compared with micromachining homogeneous materials, cutting force generation mechanism of metal matrix composites is more complex because of the different physical properties of the matrix and the particles, 15 and cutting forces of machining composites will be affected by the existence of reinforcements. 16
Kishawy et al. 17 proposed an energy-based analytical model by calculating the total energy per unit volume, which involved the specific energy for plastic deformation of matrix and the energy consumed for fracture of reinforcement, to predict the normal force. Pramanik et al. 18 developed a mechanics model for cutting force prediction when a machining SiC/Al2O3 composites. In this model, cutting force is considered to consist of components due to chip formation, plowing, particle fracture, and displacement. Considering the frictional characteristics of chip-tool and work-tool interfaces and ignoring the particle fracture, Dabade et al. 19 developed a cutting force prediction model in turning SiCp/Al composites. On that basis, Sikder and Kishawy 20 proposed a modified analytical model including the shearing and plowing forces of the matrix and the particle fracture force, in which Johnson–Cook constitutive model was used for the matrix. Ghandehariun et al. 21 further presented an energy-based analytical model for normal force prediction considering the energies of plastic deformations, different types of friction at various interfaces, and fracture of particles. Du et al. 22 presented an analytical cutting force for mill-grinding SiCp/Al composites. In that model, the chip formation force and frictional force components and debonding and particle fracture force components are considered. Zhou and Zheng 23 presented a mechanics model for predicting side and end grinding forces in ultrasonic vibration assisted grinding of SiCp/Al composites. In side grinding force model, the major components are the normal force and tangential force in which the analytical expressions for the chip formation force based on Rayleigh’s probability density function, the frictional force, and the particle fracture force based on Griffith theory are established, respectively. In end grinding force model, the axial force is developed based on the indentation theory. By milling process, Liu et al. 24 constructed a model for nanoscale particle–reinforced magnesium matrix composites, in which the particles were considered to be removed by elastic deformation and movement. Xiong et al. 25 built a model to calculate the forces at the maximum cutting thickness in milling the in-situ TiB2/Al composite, assuming the composite as a homogeneous material. Deng et al. 26 presented a novel analytical model to predict the cutting forces in micromilling of this material considering particle debonding caused by interface failure. In the model, several aspects of the cutting force are considered, including particles debonding force, particles cracking force, and shearing and plowing forces of metal matrix.
Based on the available literatures, it can be seen that the removal characteristics of the matrix and particle in machining composites are the key factors in modeling cutting forces. 27 The force during cutting process and grinding process are mainly studied, and the current research is mainly focused on the interaction between particle and matrix and particle and particle fracture. However, in our previous research,28,29 it showed that in microcutting process, with the chip thickness decreasing to the micron scale, the size effect phenomenon of the matrix becomes prominent in cutting region, which affects the cutting force distinctly. However, the cutting force model of machining composites in current research paid little attention to the size effect in modeling the force of removing matrix, which was usually calculated by the model used in conventional scale machining.
Therefore, considering the micromilling characteristics of the matrix and removing force of the particles, especially the influence of the size effect of the matrix on cutting force, this article develops an analytical force prediction model of micromilling composites is developed. It can be conducive to provide a better insight into micromilling process of particle-reinforced matrix composites and also provide a basis for the selection of process parameters.
Modeling process of micromilling force
A coordinate system is set for the micromilling process, in which the feed direction is selected as the X-axis positive direction, and the clockwise direction of the tool rotation is set as positive direction of rotation angle, as shown in Figure 1. The milling forces Fx and Fy are modeled. The eccentricity, vibration, deformation, and radial runout of the tool are ignored.
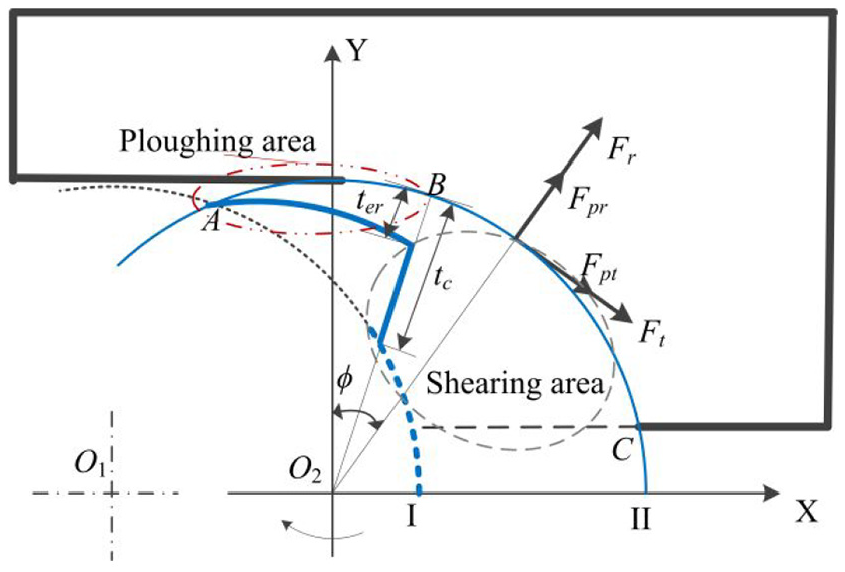
Micromilling process and setting of the coordinate system.
Matrix
The matrix is Al2024, which is a typical plastic material. During the micromilling process, the cutting process in a single cycle can be divided into two regimes 30 (plowing area and shearing area) due to the change in the instantaneous cutting thickness, as shown in Figure 1. In shearing area, the matrix deforms plastically and removed, and the cutting force can be expressed as a function of cutting area. In plowing area, the matrix deforms elastically and plastically, and the cutting force can be expressed as a function of plowed volume. Finally, force prediction models of these two regimes are constructed, respectively.
Shearing area
In this region, the matrix undergoes plastic deformation and is removed by the cutter as cutting chip, which is similar to the conventional milling process. In this process, the instantaneous cutting thickness can be expressed as
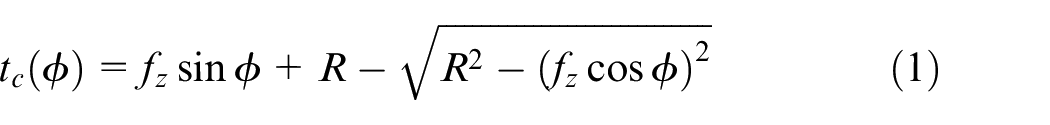
where fz is the feed per tooth, ϕ is the rotation angel of the milling cutter, and R is the tool radius. Since fz≪R, this thickness can be approximate to

The cutting force model of each blade in this area can be calculated as 31
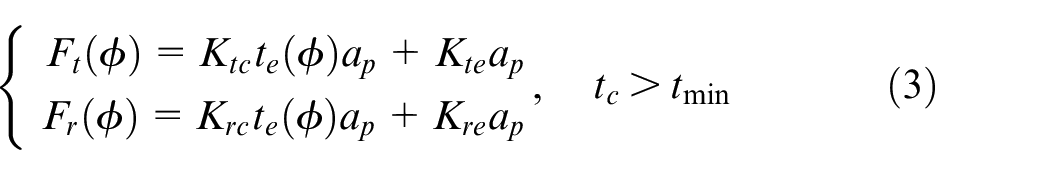
where Ft(ϕ) is the tangential force in the shearing area, Fr(ϕ) is the radial force in the shearing area, Ktc and Krc are the coefficients of the tangential and radial chip formation forces, Kte and Kre are the coefficients of the tangential and radial edge forces, and tmin is the minimum cutting thickness.
Plowing area
If tc is smaller than tmin, the deformation of the machined material becomes mixed elastic-plastic. A constant percentage of machined material recovers elastically after cutting tool passes through, and the remaining portion of the machined material undergoes plastic deformation. The corresponding elastic recovery rate is expressed by the ratio pe

where XR is the rheological factor based on experimental data.30,31
Then, the elastic recovery depth ter of machined material in this area is

The forces can be calculated as a function being proportional to the plowed volume between the micro end mill and the workpiece.31,32 The plowed area of the plowed material is set as Ap, shown as the cross-line area in Figure 2. Then, the cutting volume is Apap, where ap is the cutting depth.
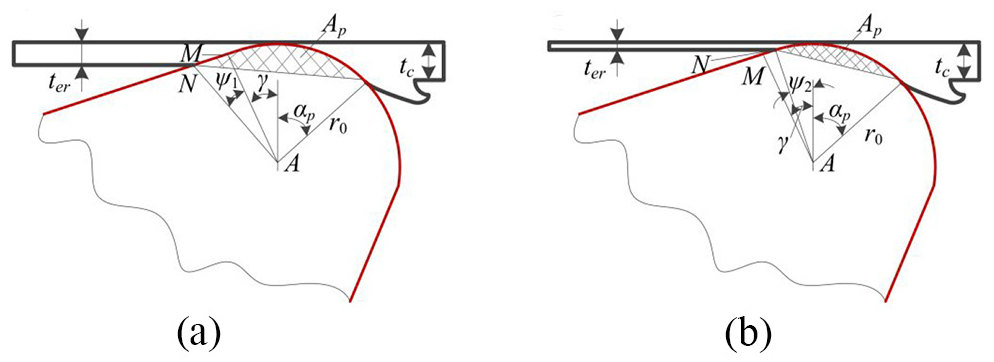
Interference area of the plowed material: (a) ter⩾r0(1 − cosγ) and (b) ter < r0(1 − cosγ).
As shown in Figure 2(a), if ter⩾r0(1 − cosγ), the plowed area is calculated as30,33
where γ is the clearance angle (constant, 10°), αp is the critical angle of the minimum chip thickness with respect to the vertical direction, ψ1 is the angle between AM and AN, as shown in Figure 2(a), where A is the center of tool, M is the end point of the tool edge, and N is the intersection point of the tool edge and the elastic recovery surface of the material. The angle ψ1 and αp can be calculated as
As shown in Figure 2(b), if ter < r0(1 − cosγ), the plowed area is30,33
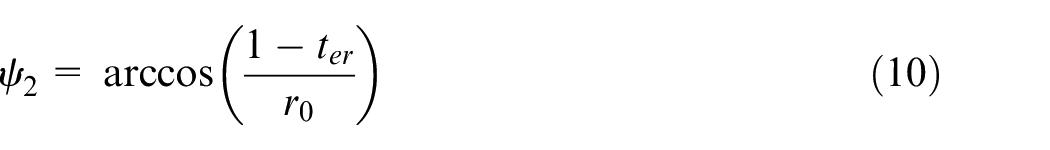
where ψ2 is the angle between AN and vertical direction, as shown in Figure 2(b). It can be calculated as
The plowing force is proportional to the plowed volume between the micro end mill and the workpiece. Thus, the forces can be modeled as 30
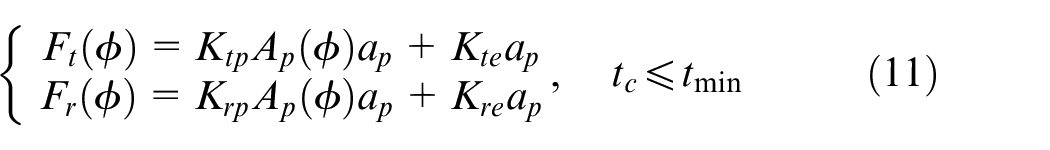
where Ktp and Krp are the coefficients of the tangential and radial chip formation forces in the plowing area, respectively.
Reinforcement
As the micromilling depth is small, the tool mainly cuts the upper part of the particles, and most of the particles will be cracked and removed. 28 Moreover, with high cutting speed, the particles are mainly cut through directly by cutting tool with little debonding. Therefore, the debonding force of the particles in this article is neglected. The fracture force of the reinforcement is modeled.
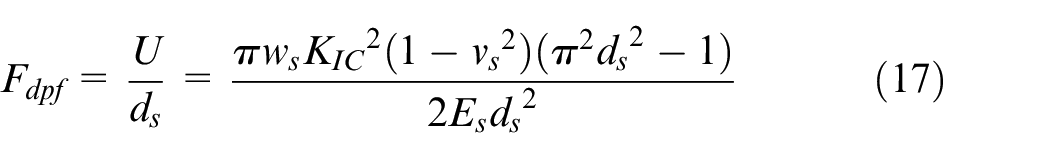
The destruction of the particles and the initiation and expansion of the cracks require energy, so an energy model is used to calculate the cutting force in this process. 17 It is assumed that the crack damage is controlled by the statistical behavior of the stress and strength of the particles. 34 Based on Griffith fracture theory, the energy for removing individual particle is
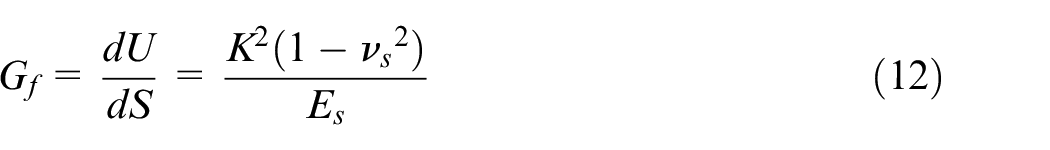


where U is the strain energy, S is the area of the interface crack, K is the stress intensity, vs is the Poisson’s ratio of the SiC material, Es is the elastic modulus of the SiC material, σf is the fracture strength of the particle, ls and ws are the length and width of the initial interface crack, KIC is the fracture toughness of particulate material, and ds is the particle size.
Then, the strain energy U can be calculated as
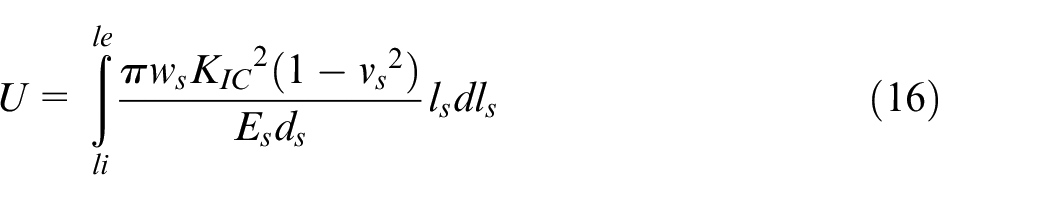
where li is the length of the initial crack, and le is the width of the final crack.
Then, according to the relationship of energy and force, the removal force of a single particle can be calculated as22,26
In order to obtain total particle fracture force during milling process, the number of removed particles is necessary. According to the volume fraction of the composite, the number of the particles in per unit volume can be obtained as
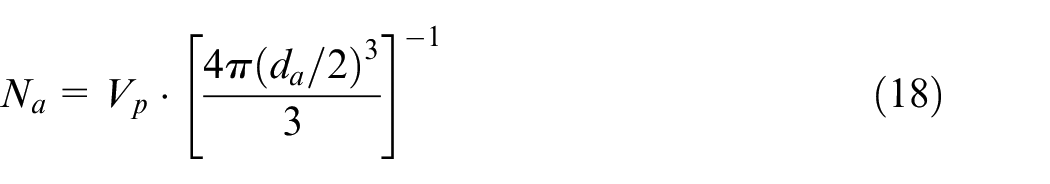
where Vp is the volume fraction of SiC particles, and da is the average particle size.
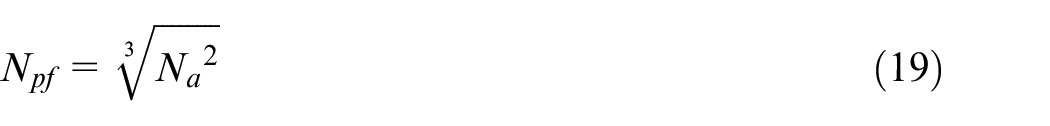
In micromilling process, the feed per tooth is small, resulting in almost all of the particles in the milled section being cut and fractured. Therefore, it can be considered that all of the Na particles are removed, and then the number of fractured particles per unit area is
Finally, the particle fracture force can be calculated as 26

where Kp is the compensation factor, introduced by consideration of the random distribution of particles.
As shown in Figure 1, the tangential and radial fracture forces of the particle can be finally obtained as
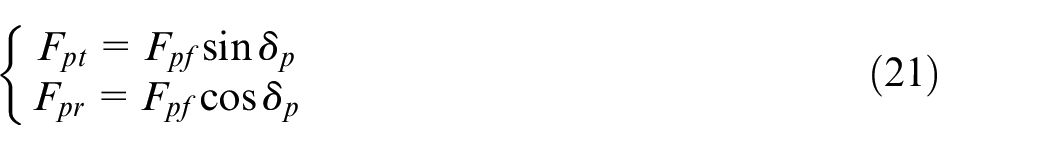
where δp is the angle between the tangential force and radial force of removing particle and can be calculated as 13

where ρ0 is the rake angel, and η0 is the angle between slip lines and the build-up surface. 13 They are both constant in this article.
Then, by setting Kpt=KpNpfFdpfsinδp and Kpr=KpNpfFdpfcosδp, the forces of removing particles are
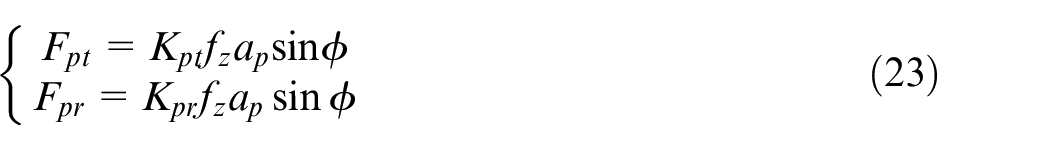
where Kpt and Kpr are the force coefficients acquired by experiments.
Composite
According to the coordinate system established in Figure 1, the removal forces of the matrix and particle are added together and converted as
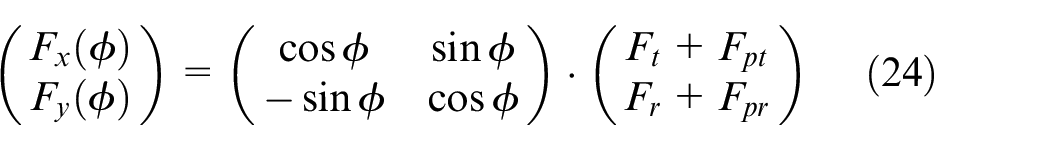
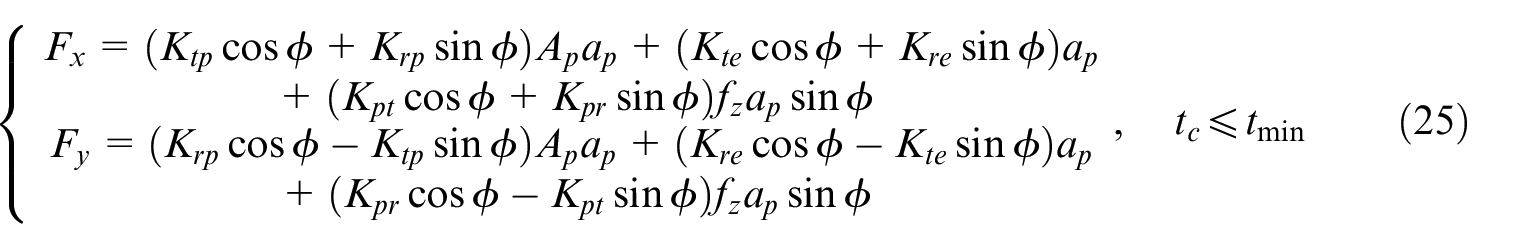
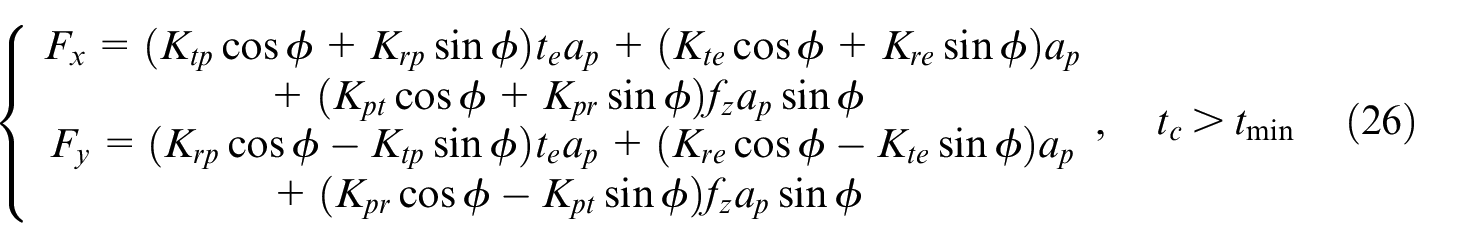
Substituting equations (3), (11), and (23) into equation (24), the final micromilling force models are obtained as equations (25) and (26)
Results and discussion
According to equations (25) and (26), there are eight identification coefficients needed to be determined first to obtain the milling force model. Therefore, micromilling experiment is conducted on a DMG Ultrasonic 70-5 linear ultrasonic machining center. A single-edge polycrystalline diamond (PCD) cutter is used as the milling cutter, whose diameter is 2 mm, cutting edge radius is 3 μm, rake angle is 0°, and relief angle is 10°. A 45% volume fraction SiCp/Al2024 composite is used and the average particle size is 5 μm. The Kistler 9256C dynamometer is used to acquire the force data. Schematic of orthogonal cutting experiment system is shown in Figure 3. The collection data are selected from stable cutting state, and MATLAB software is used for subsequent processing.
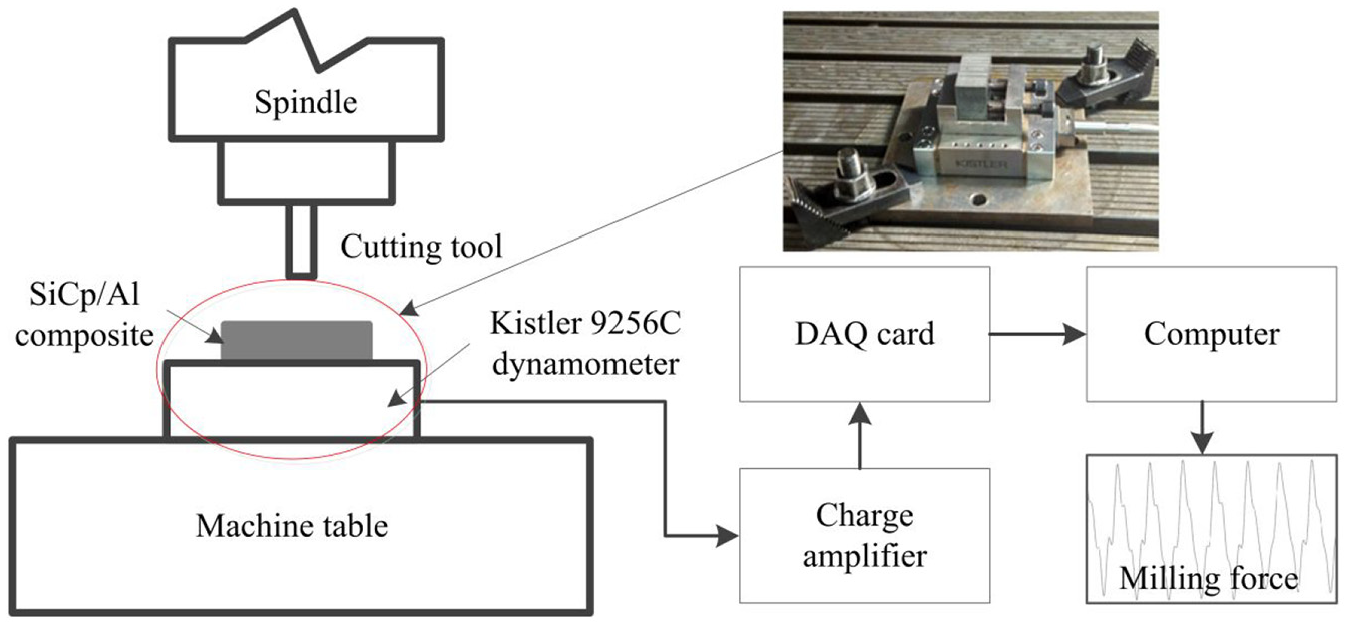
Schematic of orthogonal cutting experiment system.
Calculating of the force coefficients
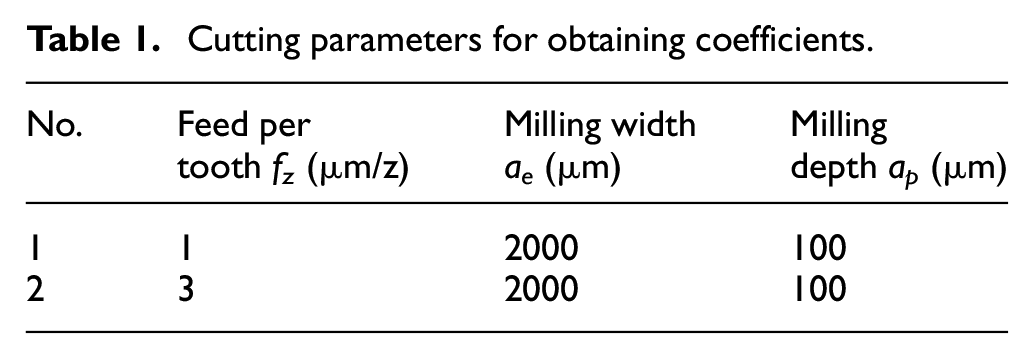
Slot-milling experiments are conducted and cutting parameters are shown in Table 1. Each group is repeated three times. The spindle speed is 15,000 r/min, and the sampling frequency is 5000 Hz. Therefore, 20 points are collected in one cycle with an interval of 18°. Because the milling cutter is single-edged, the effective cutting process is only half a cycle and 10 points in the process are selected. The force data (rotation angles and force values) of 50 cycles in the stable milling state are extracted and averaged each time. Then, the curves of milling force Fx and Fy with rotation angle are obtained.
Cutting parameters for obtaining coefficients.
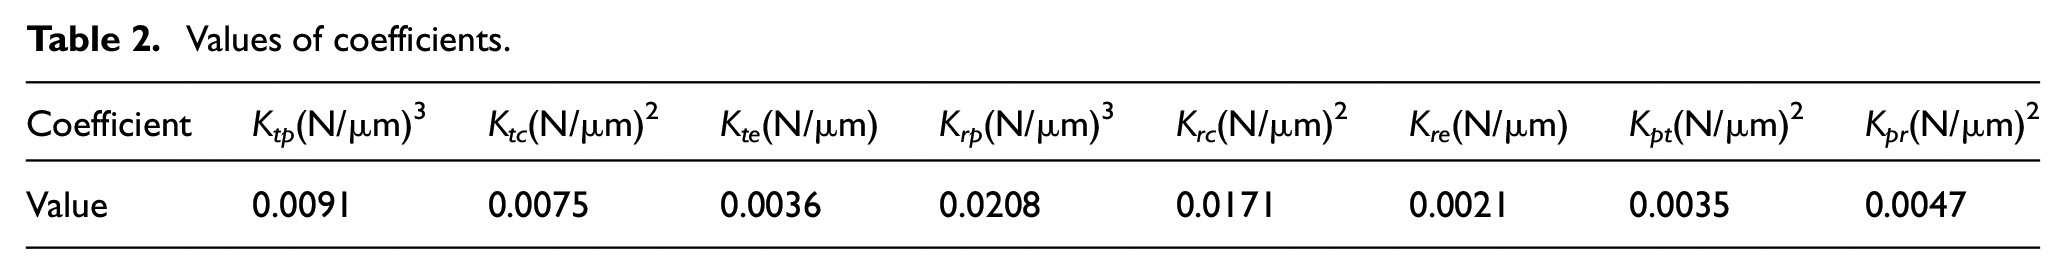
There are eight identification coefficients to be determined, which means there should be at least eight independent constraint equations. To ensure the accuracy of the results, the X- and Y-directional data are all processed at the same time. According to cutting parameters and data point selection method, 40 constraint equations are constructed to calculate the identification coefficients. At the same time, considering the continuity of the model value at the minimum cutting thickness, four additional constraint equations (X- and Y-directions) can be added. Using MATLAB software, based on the 44 constraint equations, the identification coefficients are calculated, and the values of each coefficient are finally shown in Table 2. The corresponding comparison of the predicted and extracted points can be seen in Figure 4.
Values of coefficients.
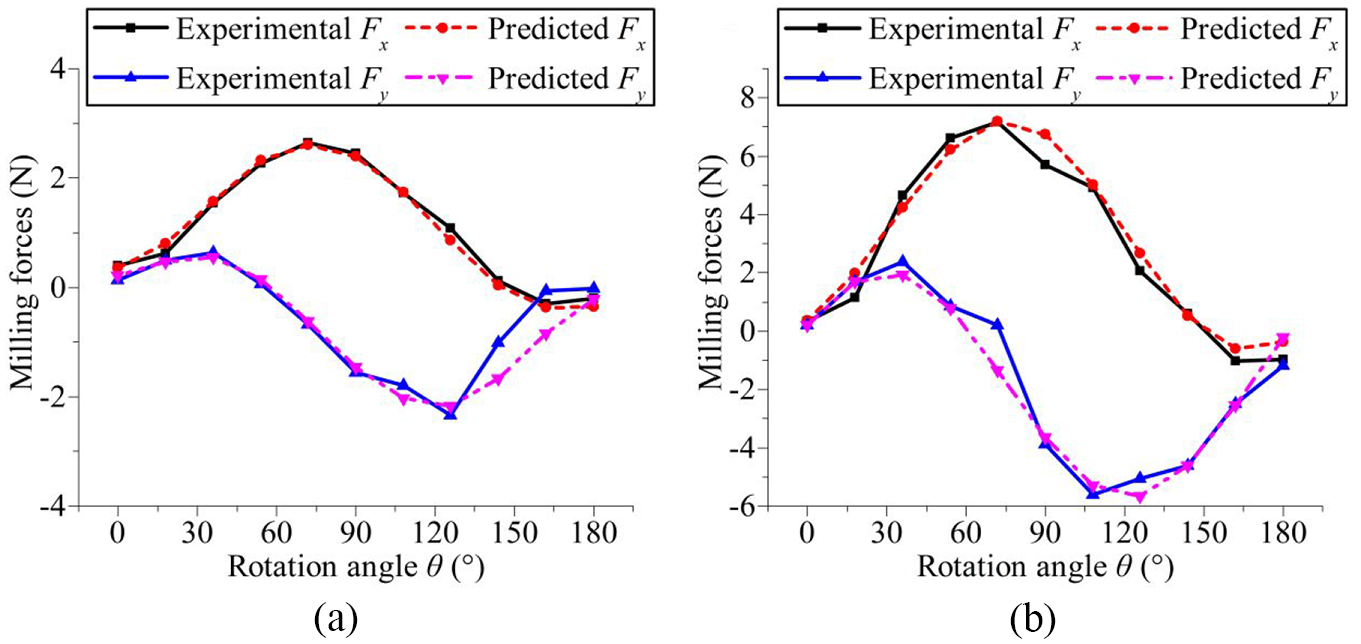
Comparison of the experimental and predicted results as feed per tooth is (a) 1 μm/z and (b) 3 μm/z.
Model verification
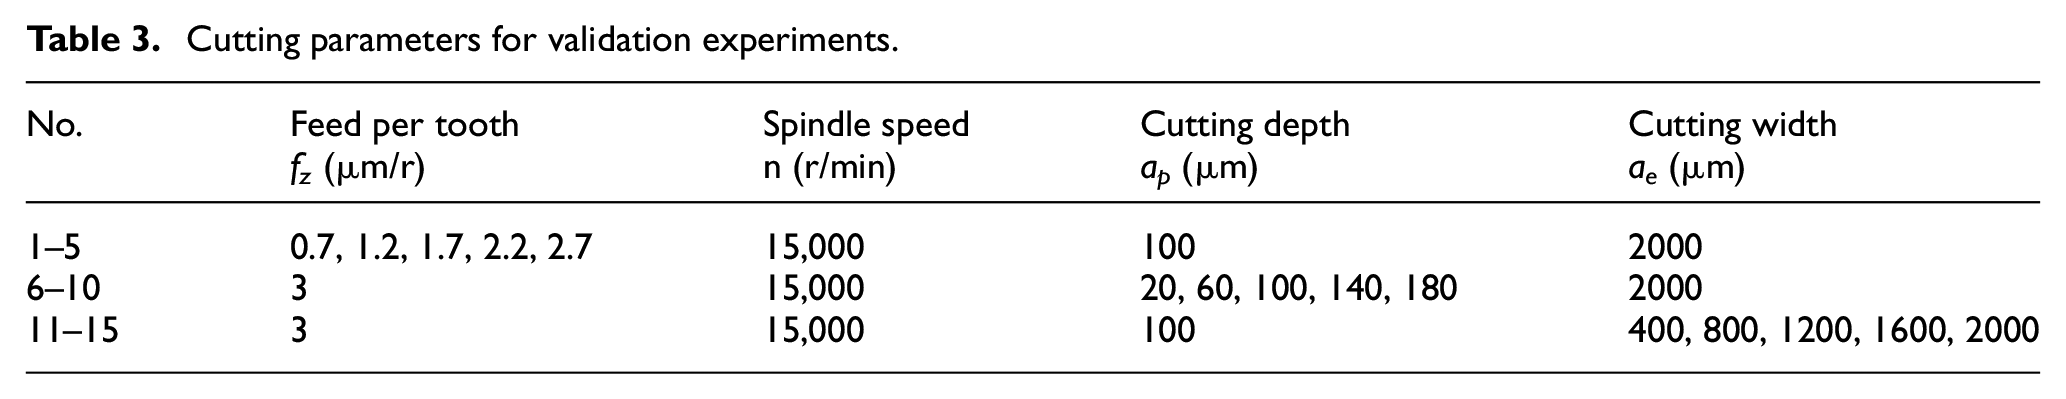
To verify the prediction model, the maximum forces of the experiment and the predict model were compared. Single factor experiment was used and the used cutting parameters are shown in Table 3.
Cutting parameters for validation experiments.
The results are shown in Figure 5. The predicted results of Fx and Fy were found to agree well with the experimental values, and the influence of the parameters on the predicted and experimental milling forces were consistent. The average percentage of errors between experimental and predicted results of Fx and Fy were 10.04% and 8.79%, respectively. In addition, it can be found that the predicted was higher than the experimental, which might be caused by the assumptions and simplifications in the modeling process. In the modeling process, it was assumed that particles appear in each cutting surface, which somewhat reduced the influence of random distribution of particles. Therefore, the predicted results will be higher than the experiment.
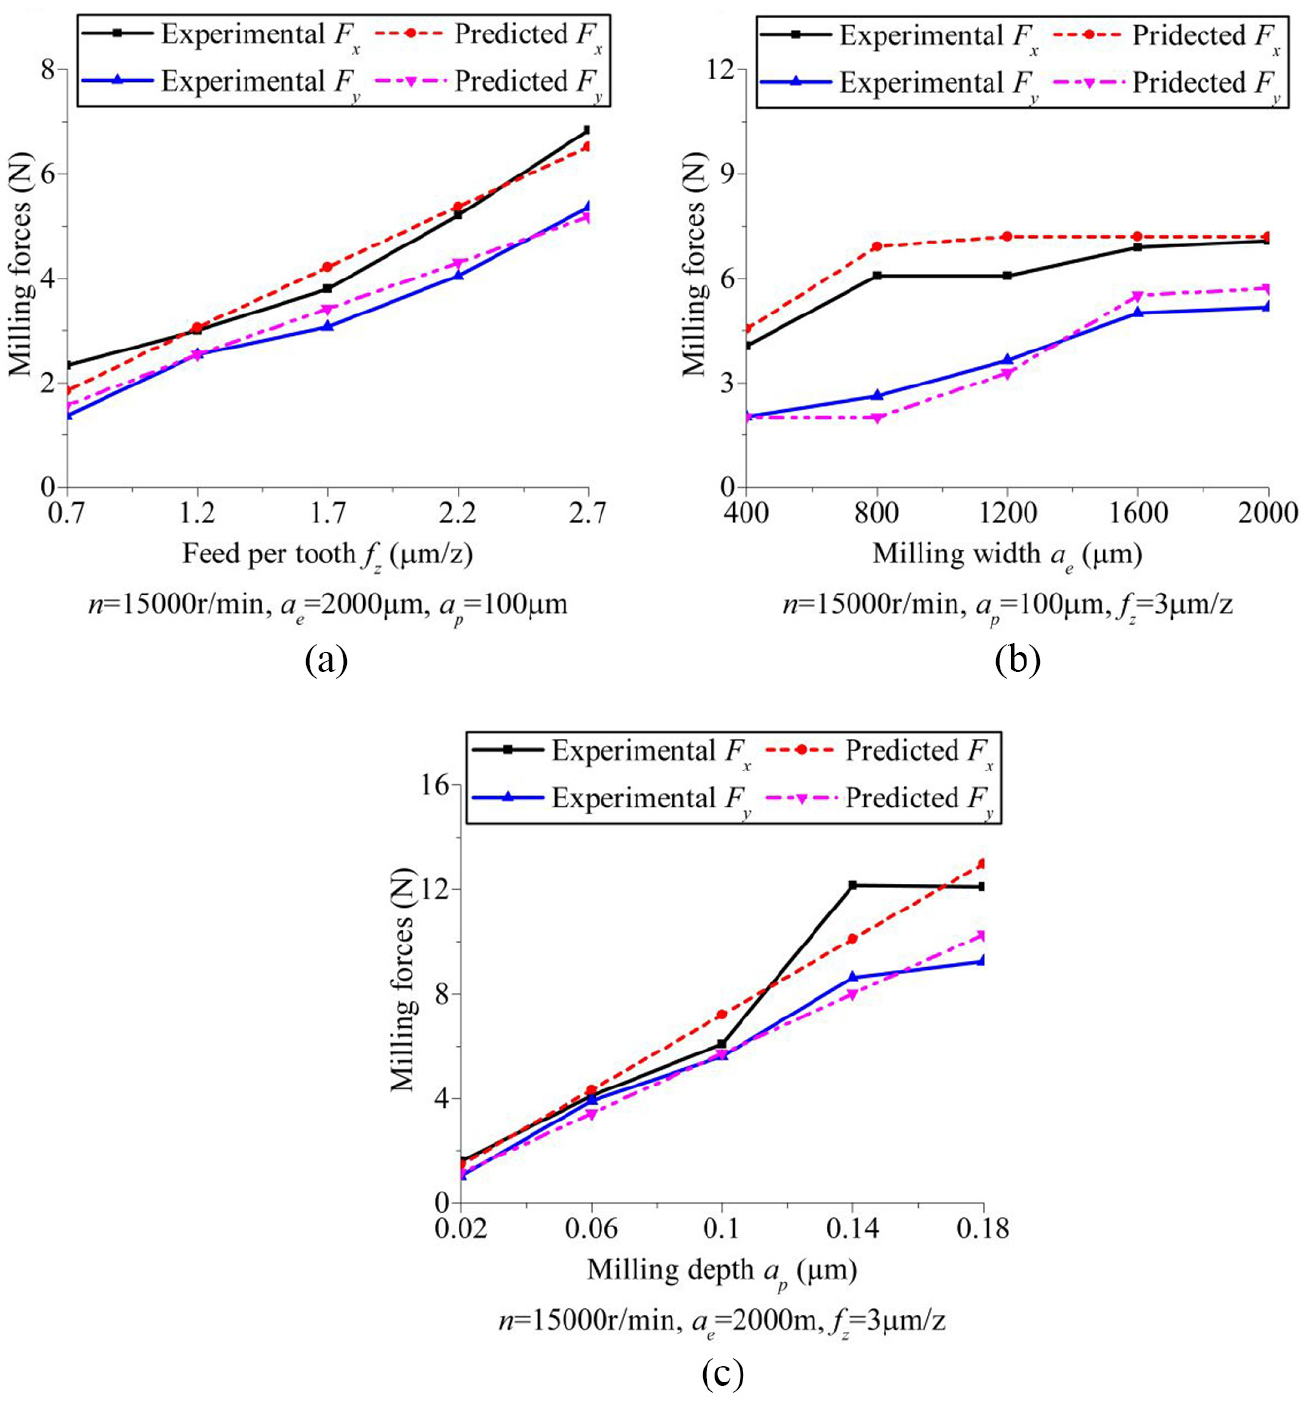
Influence of cutting parameters on the predicted and experimental milling forces: (a) feed per tooth; (b) milling depth; and (c) milling width.
Effect of milling parameters on milling force
According to the milling force model, the effects of milling width, feed per tooth, and milling depth on maximum and average milling forces are studied.
The effects of milling width on milling forces in the X- and Y-directions are shown in Figure 6. It can be found that Fxmax increases first and then remains stable with the increase in milling width. Fymax increased slightly with the increase in ae when ae ⩽ 0.4 mm and then maintains a certain value; when ae > 1 mm, Fymax increases with the increase in ae; when ae⩾ 1.8 mm, Fymax remains stable. As the milling width changes, the maximum turning-out angle changes, causing changes in the effective milling part, and finally the effect on the maximum milling force shows the changing trend in Figure 6(a). The effects of the milling width on the average milling forces Fxavg and Fyavg are shown in Figure 6(b). With the increase in ae, Fxavg increases first and then decreases. Fyavg changes relatively sharply. It first increases with the increase in milling width, and then decreases to a minimum and then increases. During the milling cycle, the direction of the milling force has changed, so the average force change is relatively obvious, especially in the Y-direction.
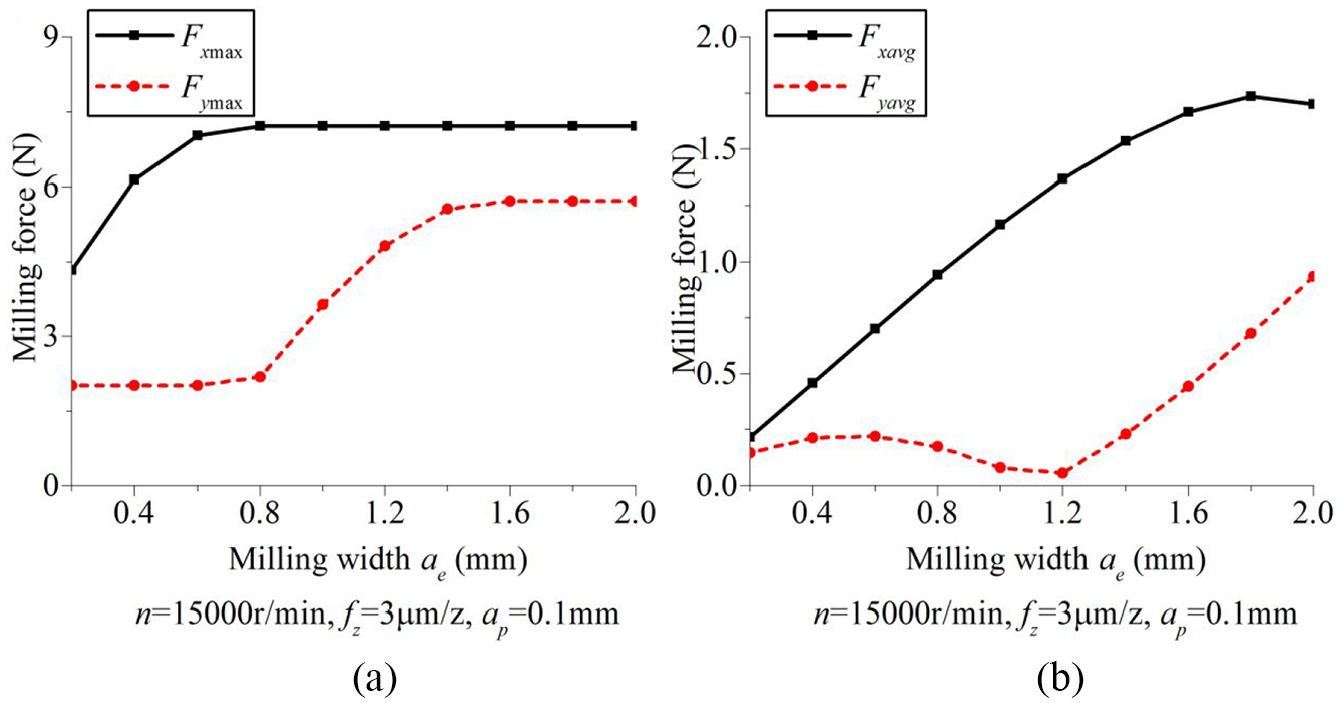
Influences of milling width on (a) maximum forces and (b) average milling force.
The effect of the feed per tooth on the milling forces in the X- and Y-directions is shown in Figure 7. Fxmax and Fymax increase linearly with the increase in the feed per tooth except when fz⩽ 0.75 μm/z. The changing trend in average milling force is similar to the maximum milling force. when fz⩽ 0.75 μm/z, the chip thickness is less than tmin, so the milling force is mainly the plowing force, which is a function of volume. When fz > 0.75 μm/z, the position of the maximum milling force is mainly shear force, which is a function of the cutting thickness, so the maximum milling force is linearly increased with the increase in fz.
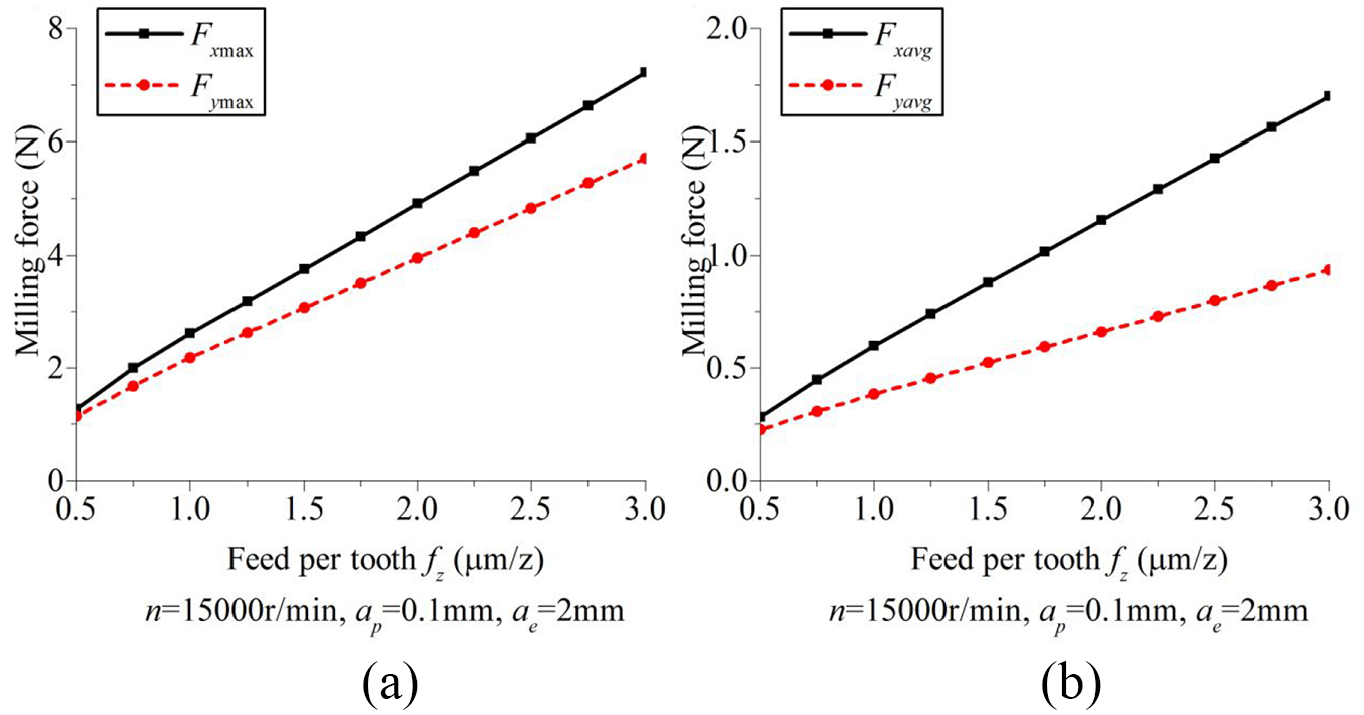
Influences of feed per tooth on (a) maximum milling forces and (b) average milling forces.
The effects of the milling depth on the maximum and average milling forces in the X- and Y-directions are shown in Figure 8. Fxmax, Fymax, Fxavg, and Fyavg all increase linearly with the increase in milling depth. In the constructed milling force model, the tangential and radial forces are directly proportional to the milling depth. Therefore, as the milling depth increases, the maximum milling force and the average milling force increase linearly.
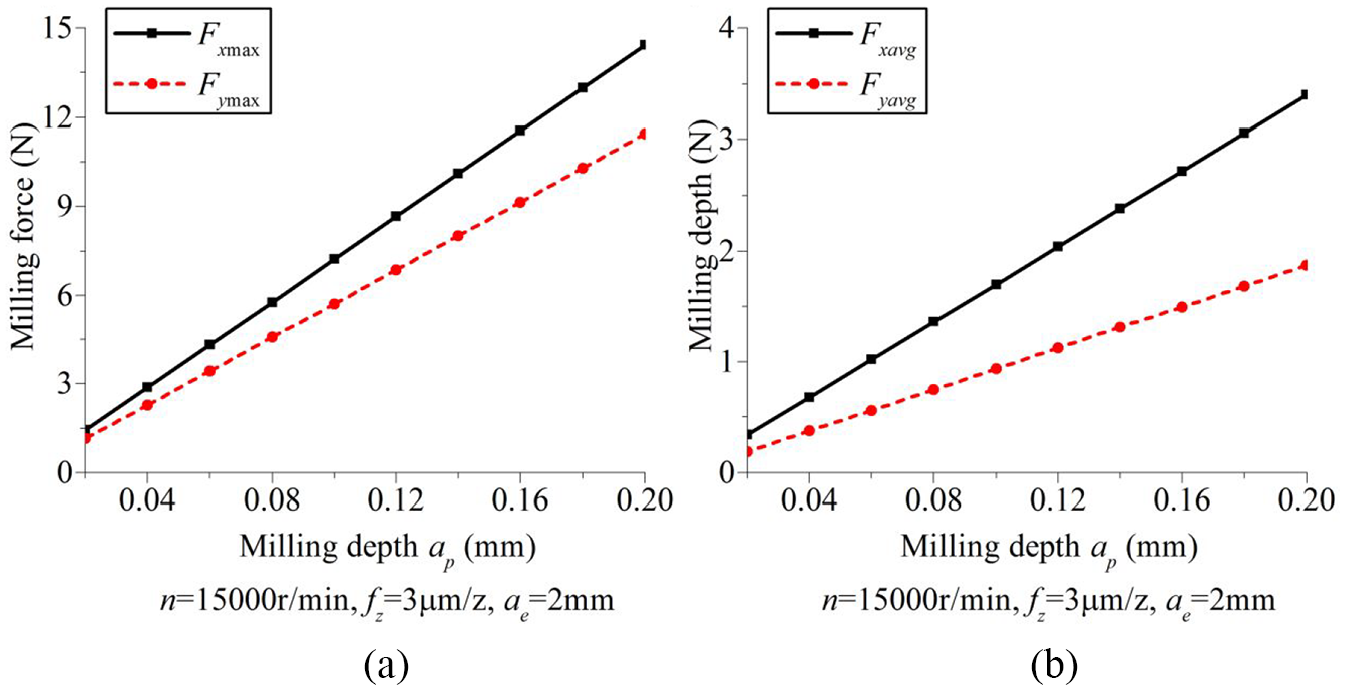
Influences of milling depth on the milling forces: (a) maximum forces and (b) average forces.
Effect of particle fracture on milling forces
The contributions of the particle fracture force to the milling force at different feeds per tooth are shown in Figure 9. It can be seen that the influence degree of the particle fracture force on the average and maximum values of Fx and Fy increases with the increase in fz, but the change in amplitude decreases. The particle fracture force accounts for about 23% of Fxmax, about 20% of Fxavg, and about 24% of Fymax. However, its proportion of Fyavg is about 23%–30% and is greatly affected by the feed per tooth.
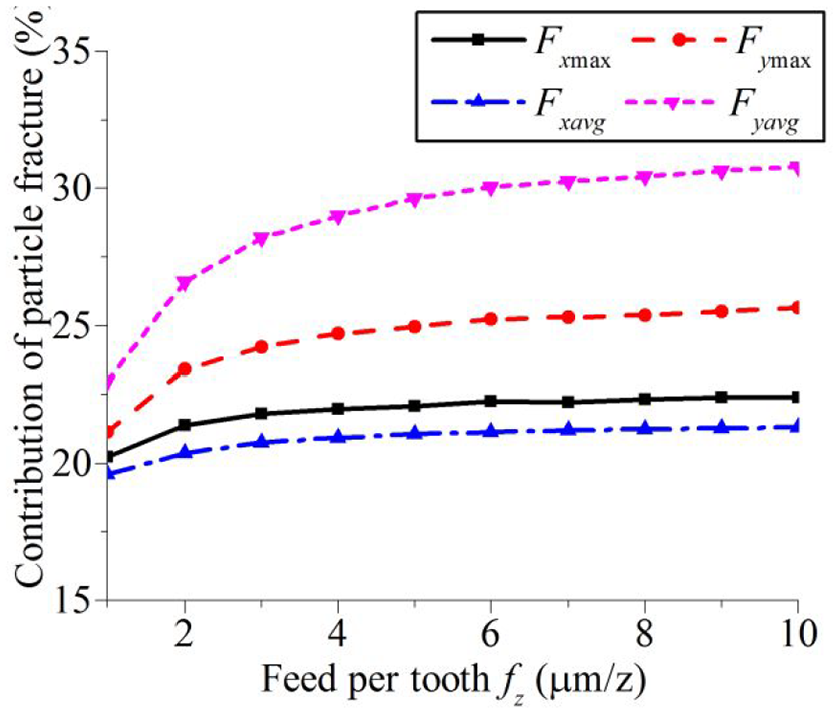
Contribution of particle fracture forces to milling forces.
Figure 10 shows the ratio of the particle fracture force to the maximum and average milling resultant force. It can be seen that the influence degree of the particle fracture force on the resultant milling force increases with the increase in the feed per tooth, but the range becomes weaker, and it gradually stabilizes in a value about 23%. It shows that the particle fracture force contributes a lot to the force during the whole milling process, and a small feed per tooth is conducive to reducing the proportion of the particle fracture.
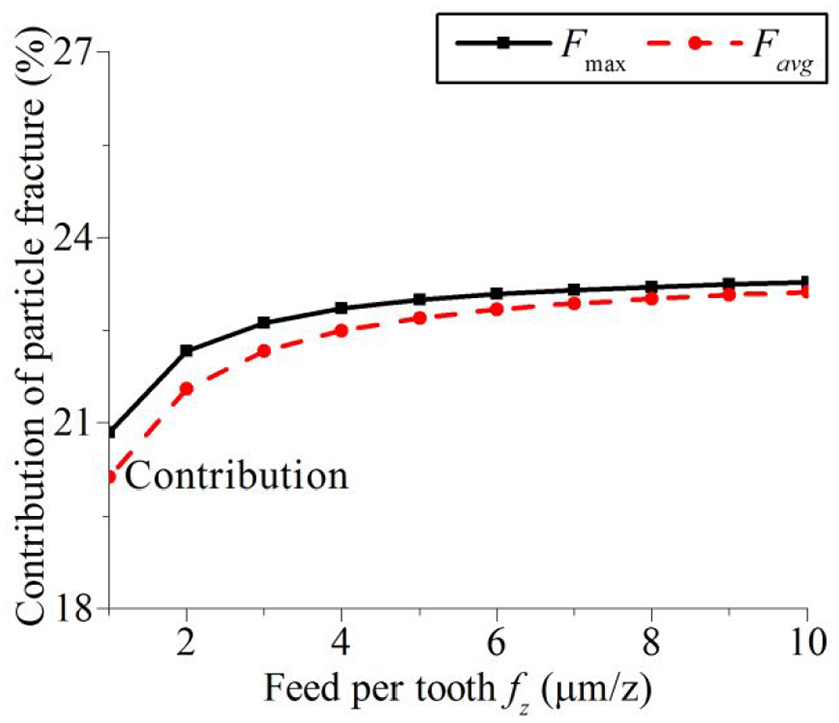
Contribution of particle fracture forces on resultant milling force.
Conclusion
Based on the micromilling characteristics, an analytical model of micromilling force during machining the SiCp/Al composite was established and verified in this article. The following conclusions are drawn:
The results show that the predicted results are in good agreement with the experimental results. The average errors of the maximum milling force in the X- and Y-directions are 10.04% and 8.79%, and the influence trends of parameters agree well. Therefore, this model could be used for predicting the micromilling forces of the SiCp/Al composites effectively.
The influence of process parameters (milling width, milling depth, and feed per tooth) on the milling force is analyzed. It is found that the milling force in the X- and Y-directions increases with the increase in the feed per tooth and the milling depth; with the increase in milling width, the maximum milling force in X-direction increases first and then remains stable, the average force increases first and then decreases; while the milling force of the Y-direction fluctuates greatly.
The particle fracture force increases with the increase in the feed per tooth and has a great influence on the milling force. In the X-direction, the particle fracture force accounts for about 23% of the maximum milling force, about 20% of the average milling force; in the Y-direction, the force accounts for about 24% of the maximum milling force, 23%–30% of the average milling force. Similarly, the contribution of the particle fracture force on the average and the maximum resultant milling force increases with the increase in feed amount per tooth and gradually stabilizes at about 23%. A small feed per tooth is conducive to reducing the proportion of particle fracture.
Footnotes
Declaration of conflicting interests
The author(s) declared no potential conflicts of interest with respect to the research, authorship, and/or publication of this article.
Funding
The author(s) disclosed receipt of the following financial support for the research, authorship, and/or publication of this article: This work was supported by the National Natural Science Foundation of China (Project No. 51675135).