
Abstract
It is important to monitor the rolled strip thickness standard to minimize material waste and loss of profit due to strip flatness defects, and also to maintain the product’s size and dimensional homogeneity. Several online measurement techniques are available but none of this can give an in situ measurement within the roll bite. Due to this, a novice experimental method utilizing ultrasonic reflection sensor mounted on one roll was developed for in situ measurement of strip thickness and roll-bite length during cold rolling process. A pitch–catch method was used whereby a piezoelectric element generated an ultrasonic pulse and transmitted to the contact interface evaluated on a pilot mill. The reflected signal was captured by a second piezoelectric element and analysed to determine the condition at the strip–roll interface. This approach was implemented on a pilot mill and reflections from various locations in the roll bite during the rolling were recorded. Recorded signals were used to estimate the rolled strip thickness and roll-bite length after the rolling process.
Introduction
In metal rolling, measurement and control of rolled strip thickness are great important factors to improve the quality of the final manufactured products as well as minimize rejects, processing time and breaks during the manufacturing process. 1 However, there is a significant paucity in the development of in situ measurement techniques in metal rolling processes. Currently, contact mechanical devices based on strength or pressure transducers are employed in metal–roll interface conditions measurement. This principle based on the fact that the radial force along the rolling direction is directly proportional to the tension profile in the rolled product. 2
Furthermore, non-contact devices based on optical principles of triangulation and structured light were also developed for metal–roll interface measurement. 3 However, unsuitability of using mechanical devices for very thick or very hot rolled products is one of the major issues with the mechanical principle for interface conditions measurement during rolling process. 4 Optical principle provides the advantage of non-contact sensors at the metal–roll interface for high-quality surface integrity measurement during manufacturing process but installation and the use of optical systems are not suitable in a very harsh environment, thereby limiting its applications in the metal rolling industry.1,5
Previously, pulse-echo ultrasonic technique has been used to study metal–roll interface conditions within the roll bite during the cold metal rolling process.6–8 In these studies, ultrasonic sensors were mounted on a plug pressurized in the radial holes drilled in the roll and facing outwards from the roll. Transmitted and reflected signals apparent to the roll bite were employed to calculate the actual rolled strip thickness against the roll-bite distance in rolling direction during the rolling process. The installation of sensor in this technique was complex and required significant roll modification and also, the plug caused marks on the surface of the strip during the rolling process. However, the study has proven that ultrasonic method could be used to study metal–roll interface conditions during rolling operation.
Therefore, this research work intends to use ultrasonic approach to develop non-intrusive ultrasonic technique capable of measuring rolled strip thickness and roll-bite length during the cold metal rolling using pitch–catch configurations.
Background theory
Reflection of ultrasonic waves at dry interface
Contact mechanical surfaces are not perfectly smooth; they exhibit surface roughness which manifested in the form of asperities. When two rough surfaces are loaded, solid–solid contact is limited to the surface roughness/asperities junctions, with pockets of air at the void between the asperities. When ultrasonic waves incident at the contact interface of two materials, part of the waves is transmitted at the asperity junctions while the remainder is reflected at the solid–air–solid interface. The pockets of air around the asperities act as acoustic reflectors (as depicted in Figure 1(a)). The amount of sound transmitted depends on the wavelength of the sound wave relative to the air gap.
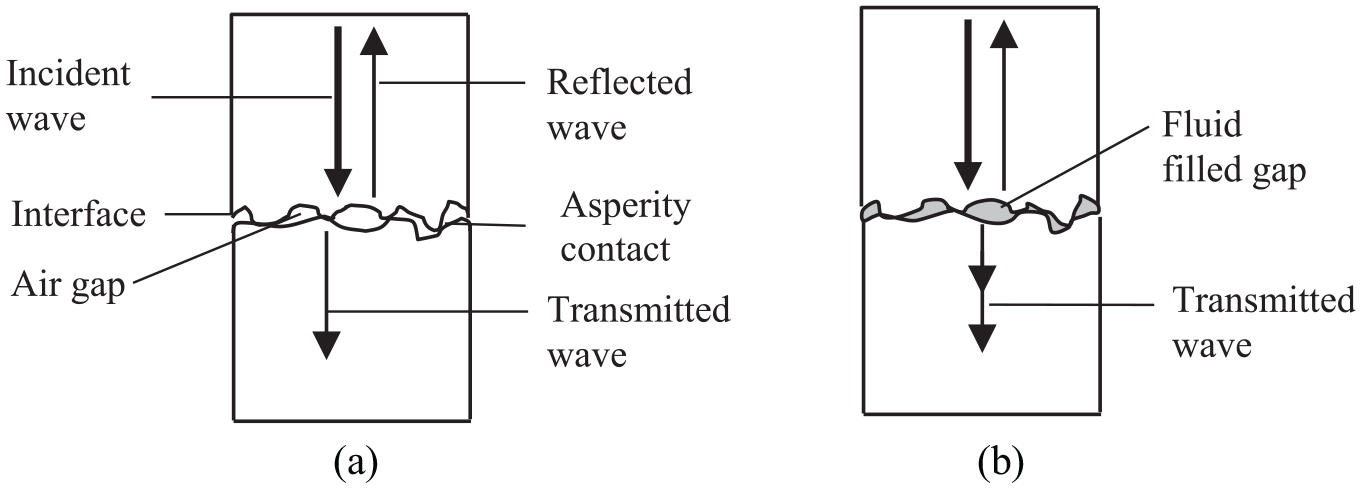
Ultrasonic reflection and transmission at rough (a) dry interface and (b) wet interface.
If the incident waves are normal to a contact interface and mode changes are neglected, the reflection coefficient, R, which is the relative amplitude of the ultrasonic waves that is reflected, is given as
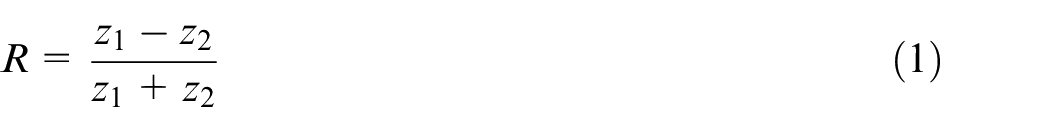
where z1 and z2 are the acoustic impedance of the materials on either side of the contact interface. When dry contact is loaded, the asperities deform and cause the area of contact to increase, and thus enabling a larger proportion of the incident ultrasound to be transmitted through to the interface.
Kendall and Tabor 9 and Tattersall 10 modelled the asperity interactions of the rough interface as a series of parallel springs (Figure 2). The reflection coefficient was found to depend on the interfacial stiffness, K. The interaction by an incident ultrasonic wave, therefore, results in a reflection coefficient governed by the relationship
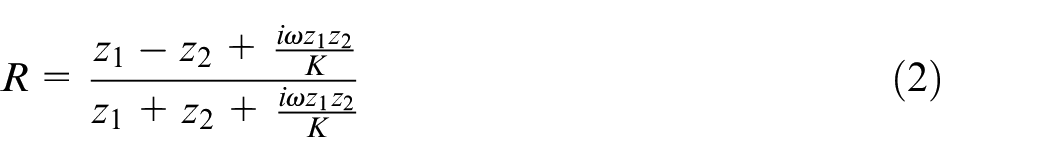
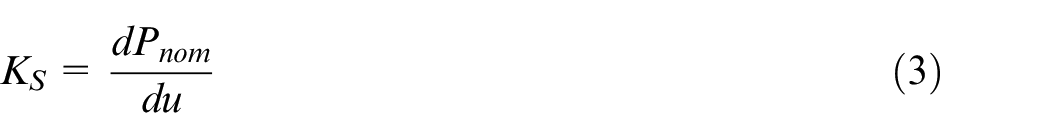
where K is the equivalent spring stiffness and ω is the angular frequency of the ultrasonic wave. The stiffness, which is expressed per unit area, is defined as the change in nominal contact pressure, Pnom, required to cause unit approach of mean lines of the two surfaces. For a dry contact, K is governed by the normal stiffness asperities alone, KS, given as 11
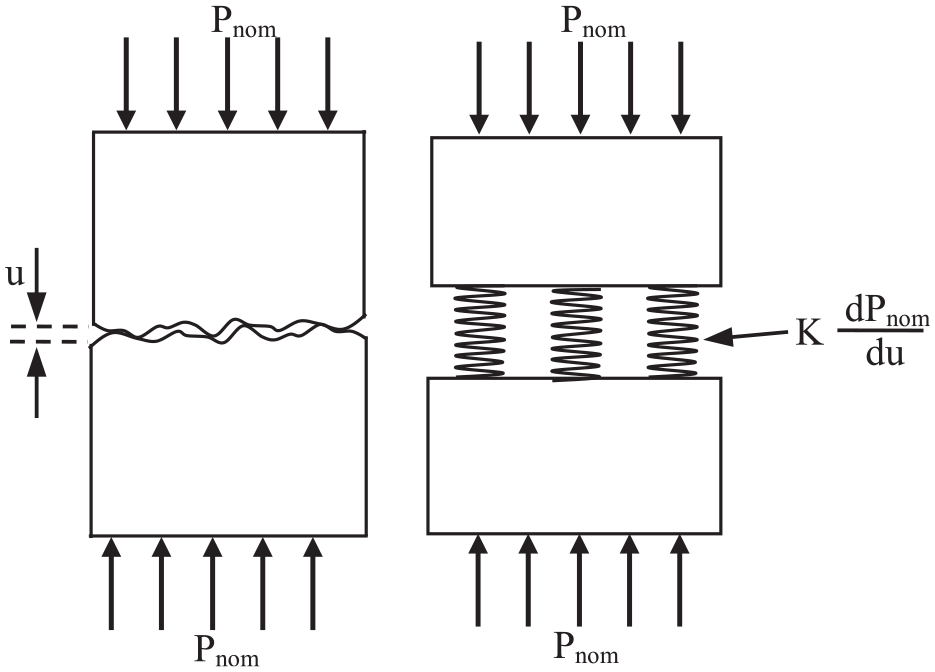
Schematic representation of an interface using the spring model.
Reflection of ultrasonic waves at wet interface
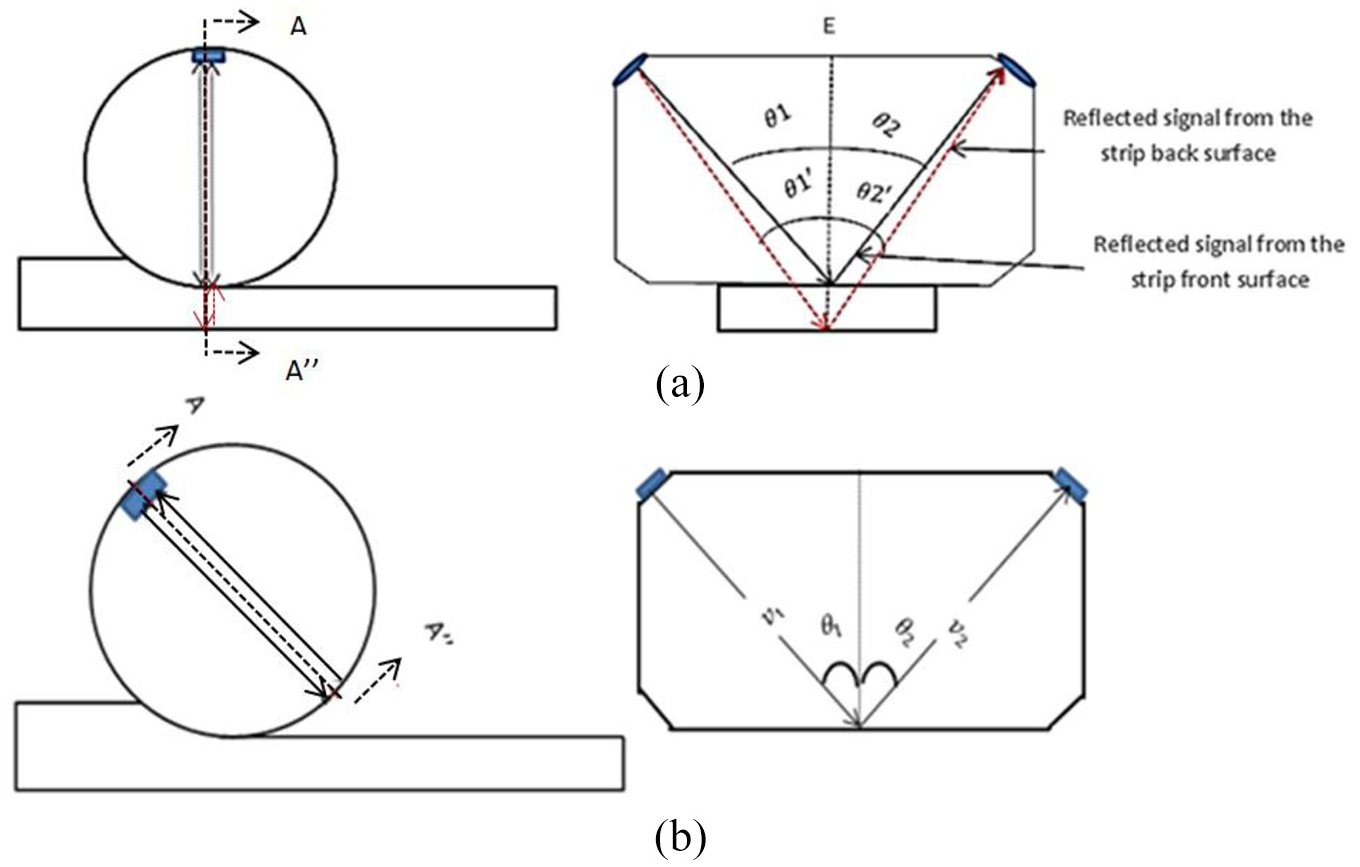
If a fluid is introduced into the interface, as shown in Figure 1(b), both the metal–metal asperity contact and the thin fluid film transmit a proportion of the incident ultrasonic energy. The liquid stiffness component, KL, which increases inversely with layer thickness of the liquid, acts in parallel to KS and this is governed by the bulk modulus (B) and thickness (h) of the fluid as shown in equation (4) 12
Therefore, for a static lubricated rough surface contact, the total distributed stiffness, K, is given by the sum of the solid and liquid components.
Ultrasound and metal–roll geometry
Reflected ultrasound signals from contact interface can be used to determine lubricant film thickness using one of three approaches: time-of-flight (ToF) for thick films, the resonant-layer model for intermediate films or the spring-layer model for very thin films (typically less than 20 µm). 13 For this research work, ToF of ultrasonic pitch and catch technique would be used.
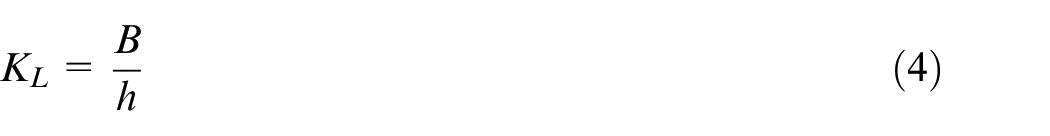
When ultrasonic wave hit the interface of the roll strip at an inclined angle, its reflection is captured at the other side of the roll at the same angle of incidence (Figure 3). The incidence and reflected waves are denoted by
The sensor (a) over the roll–strip contact and (b) away from the roll–strip contact.
In this study, the strip thickness is computed upon the difference in ToF of ultrasonic signals and the speed of sound signal in the loaded material. Although the speed of sound in material is stress dependent (acoustoelasticity), the effect of change in stress material due to loading on the ToF in this study is very negligible.5,13,14 Hence, there is no special calibration for considering the measured loads and technique.
Experimental procedure
Transducer design and instrumentation
Low cost, off-the-shelf longitudinal and shear piezoelectric transducers, with a central frequency of 10 and 5 MHz, respectively, made from lead–zirconate–titanate (PZT) were used for the experiment. The piezoelectric element had a thickness of 0.2 mm and a diameter of 7.0 mm and was pre-sputtered with wrap-around silver electrodes. When excited in the disc form, they emitted a gradually diverging ultrasonic sound five times that of the thickness of the ring. Hence, the sensors were modified to form narrow strips of 7-mm-long and 2-mm-wide active area in order to have a good spatial resolution.
The modified sensors were permanently bonded directly onto the modified region of the roll, as shown in Figure 4, using M-Bond 610 (Vishay) adhesive. Coaxial data wires were soldered to the terminals of the sensors. The sensors along with the wire at the soldered point were then covered with epoxy resin to protect it from damage during handling.
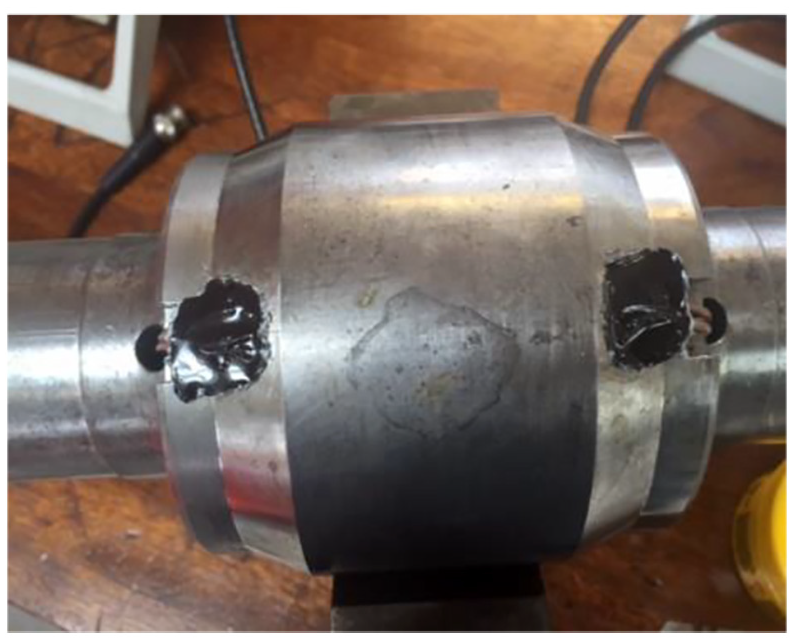
Instrumented roll showing sensor position.
Data acquisition equipment and test rig
A PC (FMS100 system) fitted with an ultrasonic pulser/receiver unit (UPR) and digitiser cards was used to generate ultrasonic signals and measure ultrasonic reflections from the roll–strip interfaces during the rolling experiment (Figure 5).
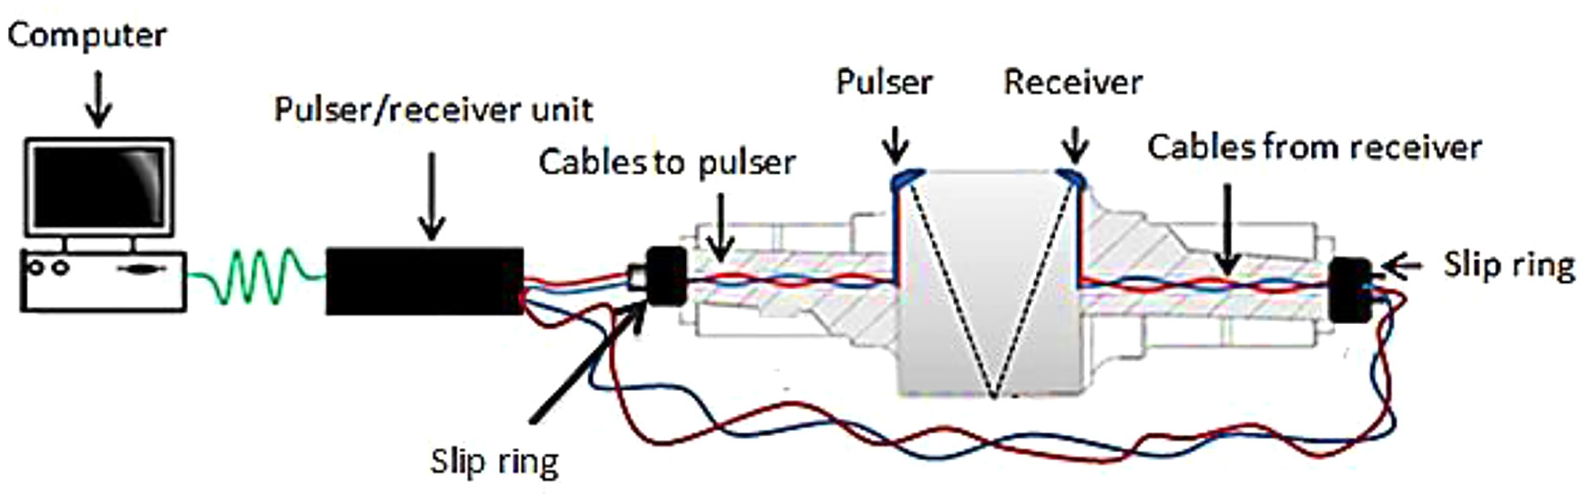
Schematic component diagram for the ultrasonic data acquisition system.
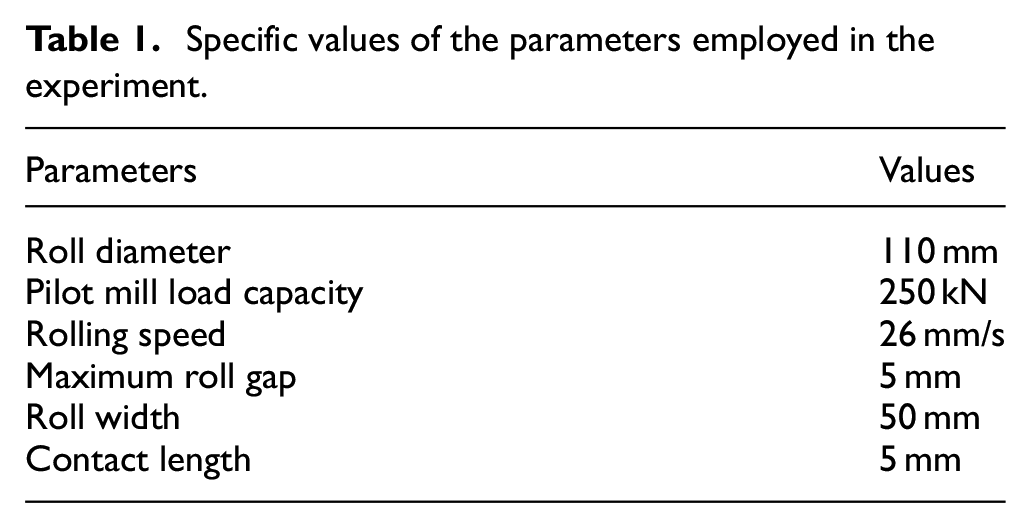
The pilot mill employed in this metal rolling experiment is a two-roll mill type (Figure 6), with upper and lower cylindrical rolls rotating in opposite directions. The average surface roughness of the roll was measured as Rq = 0.7 µm and the surface hardness of the metal roll was determined as 750 HV. Two load cells were mounted between the upper roll machine frames of the machine to measure the rolling force, while screw adjustment rods on both stand sides of the machine frame were used to regulate the rolling force. The machine permits both dynamic and stationary operating conditions. The specification parameters of the pilot mill employed during the experiment are listed in Table 1.
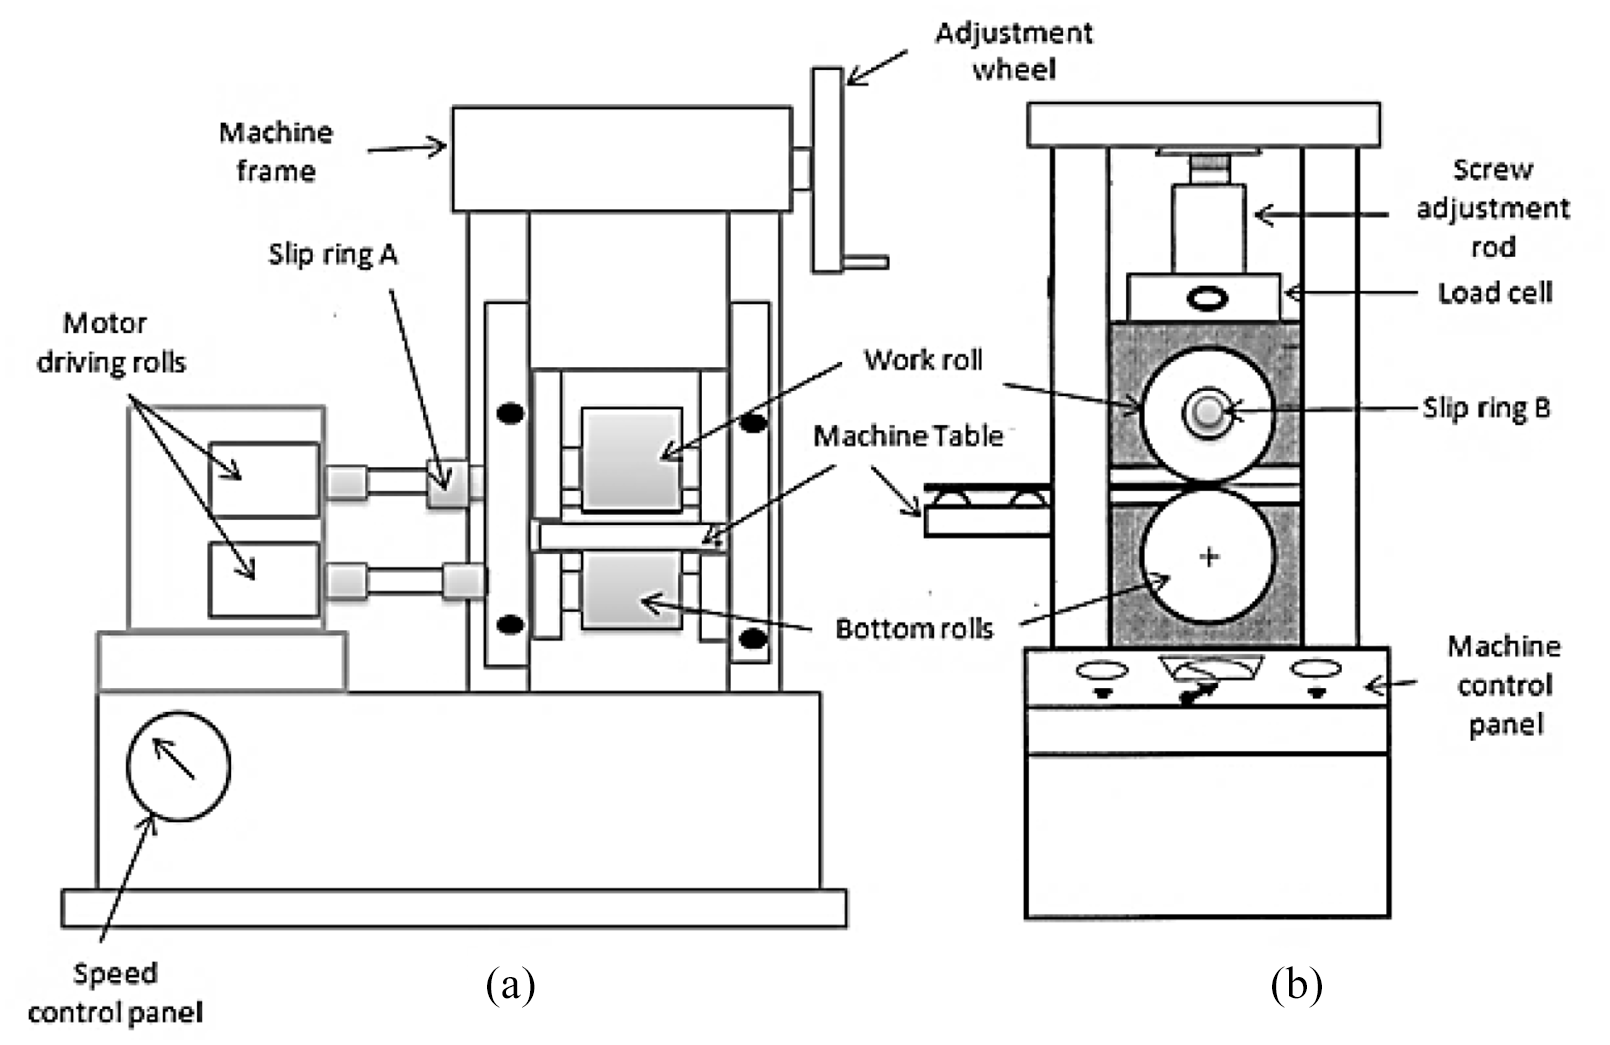
Sketch of (a) front and (b) side view of the pilot mill employed.
Specific values of the parameters employed in the experiment.
Test specimen
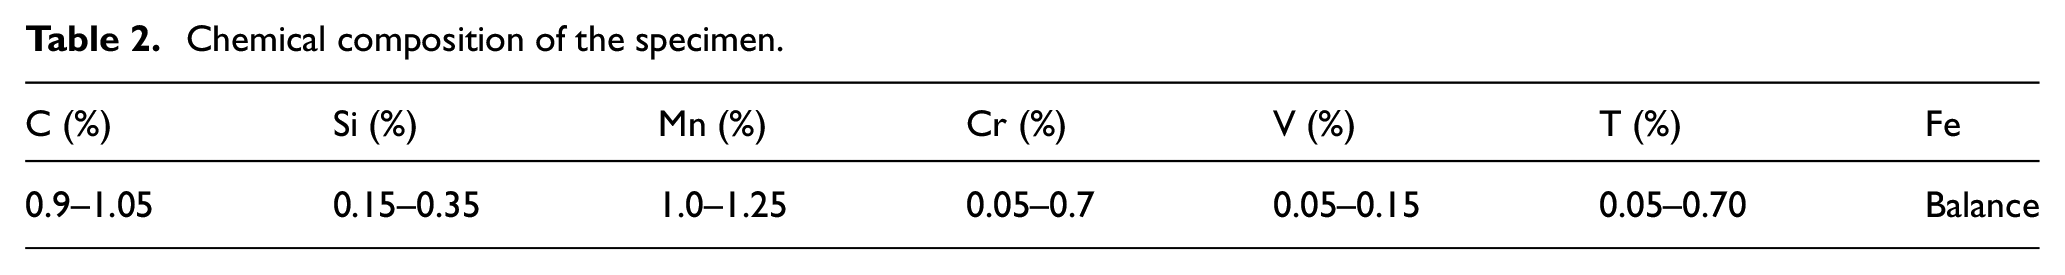
Steel grade EN24, with the chemical composition shown in Table 2, was used as the specimen due to its low carbon content that offers good machinability, thus permits reduction of the rolling load during the rolling operation. The low carbon steel specimen was cut into 5 mm thickness, 50 mm width and 250 mm length. The measured average surface roughness of the strip specimen was 0.9 µm. The strip surface hardness was determined as 270 HV.
Chemical composition of the specimen.
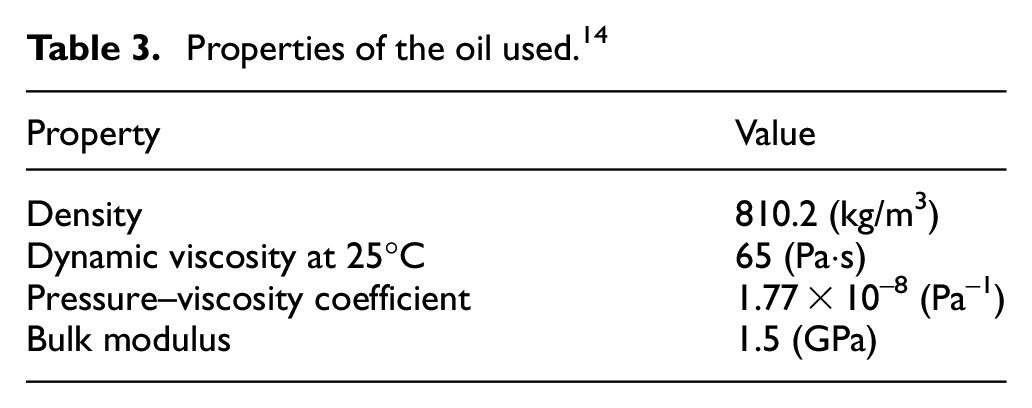
Gerolub 5525 lubricant was used for the rolling operation. This oil was chosen based on its high viscosity that allowed thick film formation at relatively high rolling loads and low rolling speeds. The properties of the oil are shown in Table 3.
Properties of the oil used. 14
Test procedure
A range of percentage metal deformations were made with the application of various loads applied through the roll to the strip when stationary. The lubricant was applied to both sides of the strip using a hand brush, and it was manually fed into the rolling gap of the mill (as shown in Figure 7). The strip was dragged into the roll gap due to the friction force that developed along the interface. The machine was stopped when the strip had been partially rolled. The roll was set in such a way that the signal sent was able to transmit onto the roll–strip front interface and reflected on the back interface of the strip. The initial and final thickness values of the strips were measured and recorded before and after the process, respectively.
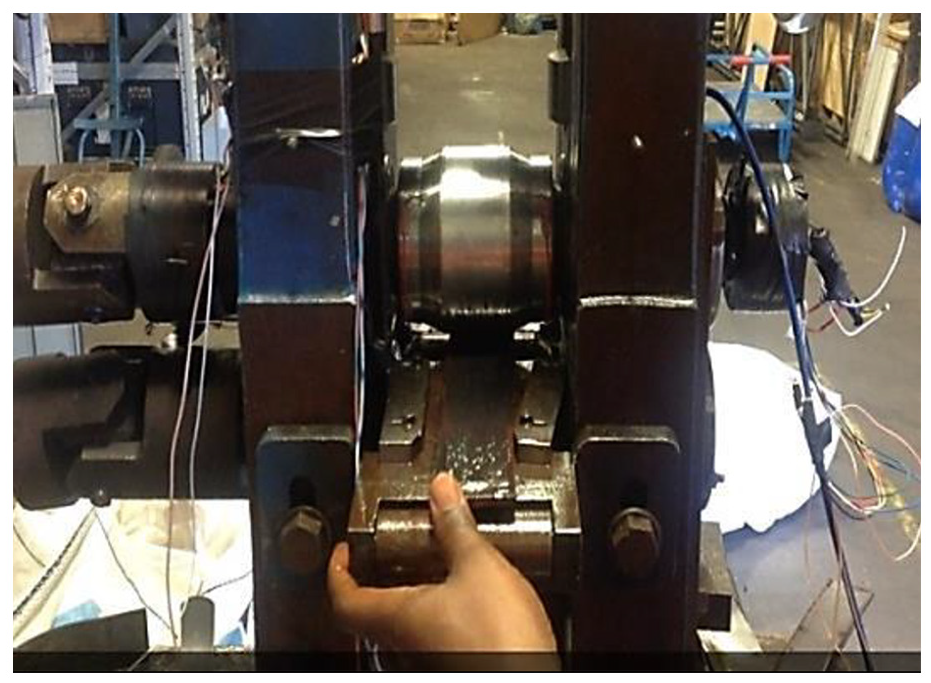
Feeding the strip into the pilot rolling mill.
To generate and receive the ultrasonic signals, the ultrasonic transducers were excited with a voltage of 25 V ‘top-hat’ signal for 100 ns duration at 1000 Hz pulsing rate. The generated signal was transmitted through the metal–roll continuously to the roll–strip interface during the rolling operation, and the wave was reflected at the strip front and back interfaces. These reflections were captured, digitized with 12-bit resolution at a rate of 100 million samples per second and stored for further analyses to calculate the strip thickness and the roll-bite contact length.
Results and discussion
The raw reflected data obtained during the deformation rolling operation contained both reference and reflected wave data at both roll–air and roll–strip contact interfaces. Therefore, to permit meaningful analysis of the results, the data set was filtered to obtain single extracted reflected data as shown in Figure 8(a)–(c) during a full metal rolling operation for a normal rolling load of 70 kN. These reflections were captured, processed and stored for further analysis.
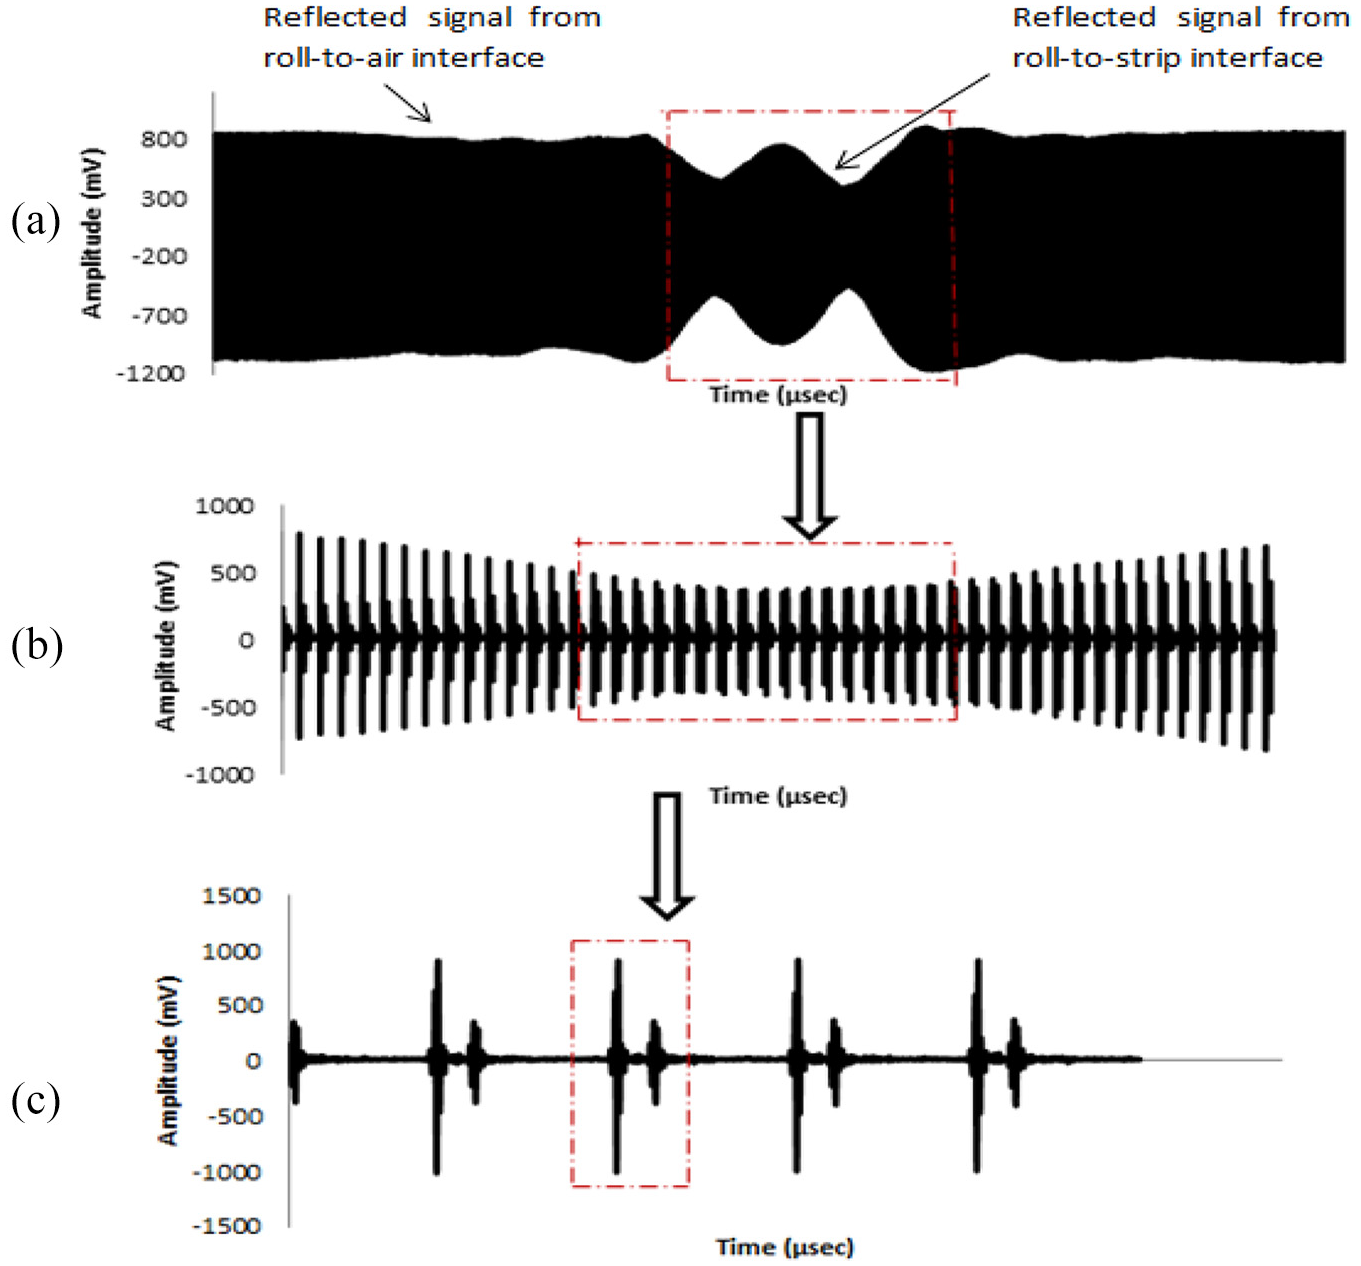
Sample of ultrasonic data extracted for the determination of strip thickness: (a) stream of processed reflected data for one complete strip rolling, (b) sub-section of data when a sensor’s focus approaches the strip position and (c) single extracted reflected data.
Figure 8(b) shows a sub-set of the reflected data obtained from a series of reflected signal (Figure 8(a)) from the strip to the roll the moment the sensors focus on the compression of the strip by roll contact during the deformation process. The effect of the strip deformation by the rolling passage is obvious on the amplitude of the reflected signals as shown in the Figure 8(b). The amplitude of the reflected ultrasound waves gradually varied as the focus of the sensors moved towards and away from the strip, as more and later less signals were transmitted into the strip until it returned back to the original value of metal–air interface during the rolling process. Furthermore, the change in ToF of the reflections between the strip front and back surfaces is shown in Figure 8(c), and this is utilized to calculate the strip thickness.
The waveforms of ultrasonic reflection when the ultrasonic sensor was out-focus and in-focus with the interface (i.e. complete roll–air interface and roll–strip interface, respectively) during the rolling operation are shown in Figure 9(a) and (b), respectively. The reduction in amplitude (first reflection in Figure 9(b)) was due to part of the waves transmitted to the strip as the roll–strip contacted. Also, the changes in ToF (ΔtR) between the first reflected wave in Figure 9(a) and (b) can be attributed to the deflection as well as stress acting on the roll. The first and second reflections represent the reflected signals from both front and back surfaces of the strip during the metal rolling process.
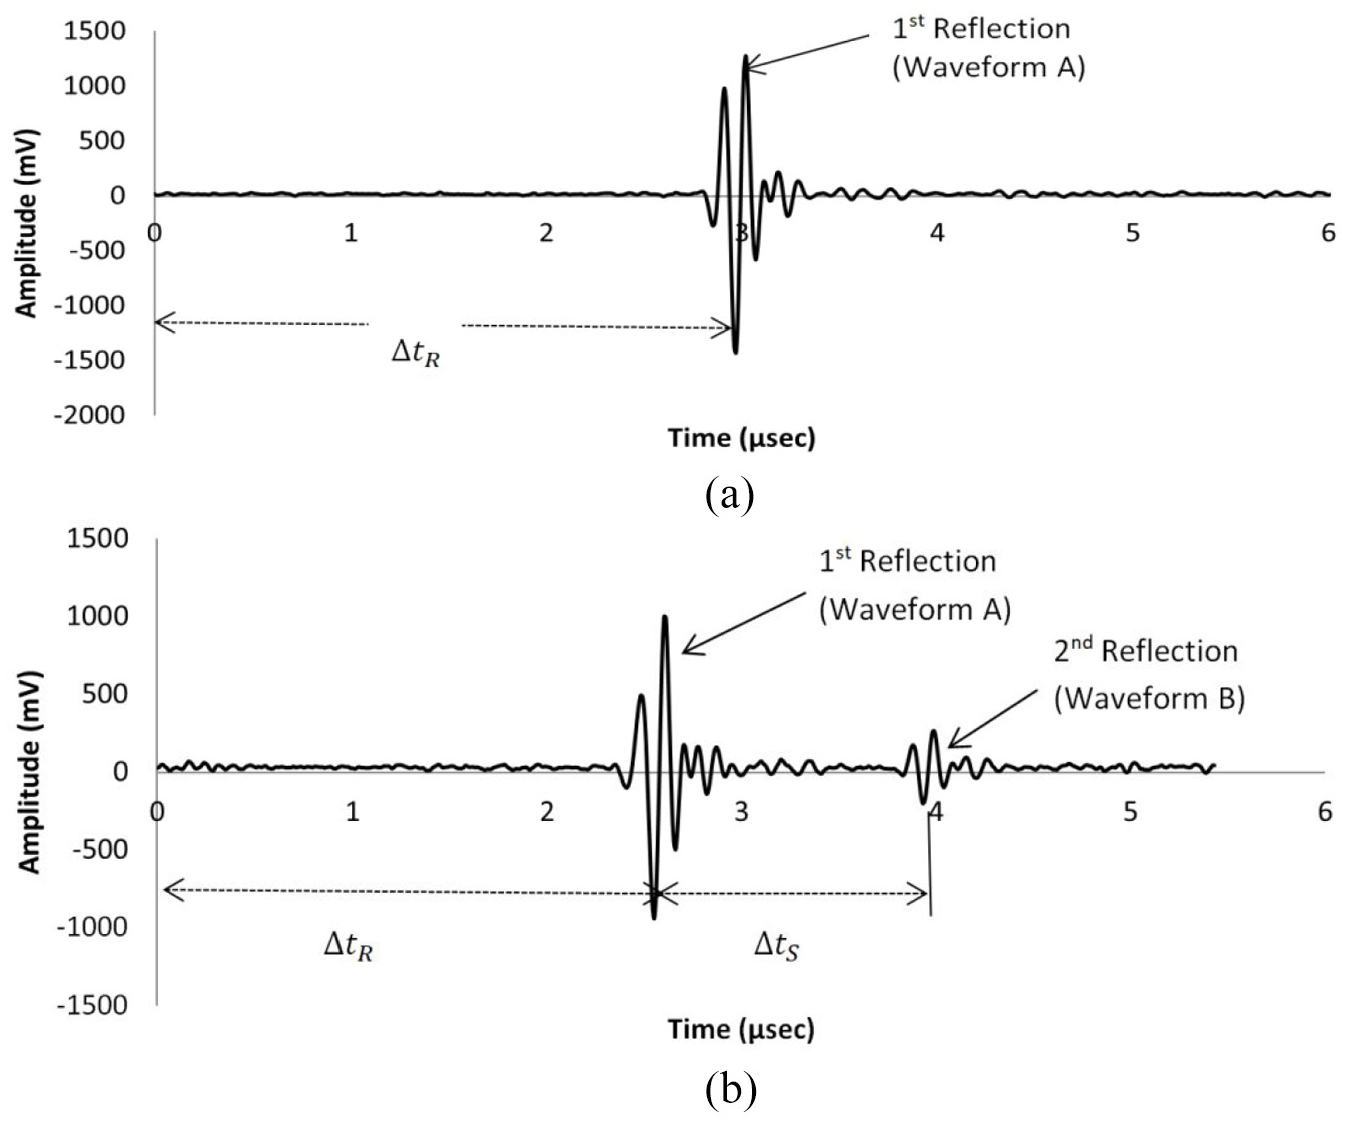
Reflected signal obtained when the sensor is (a) out of the strip and (b) in contact with the strip.
Figure 10 shows the peak-to-peak amplitudes of the reflected signals from both front and back surfaces of the strip plotted against the pulse number. From Figure 10, it can be seen that the amplitude of the reflected signals varied during the operation and also, the signal amplitudes of both reflections show that they are sufficiently large to calculate the strip thickness during the rolling process.
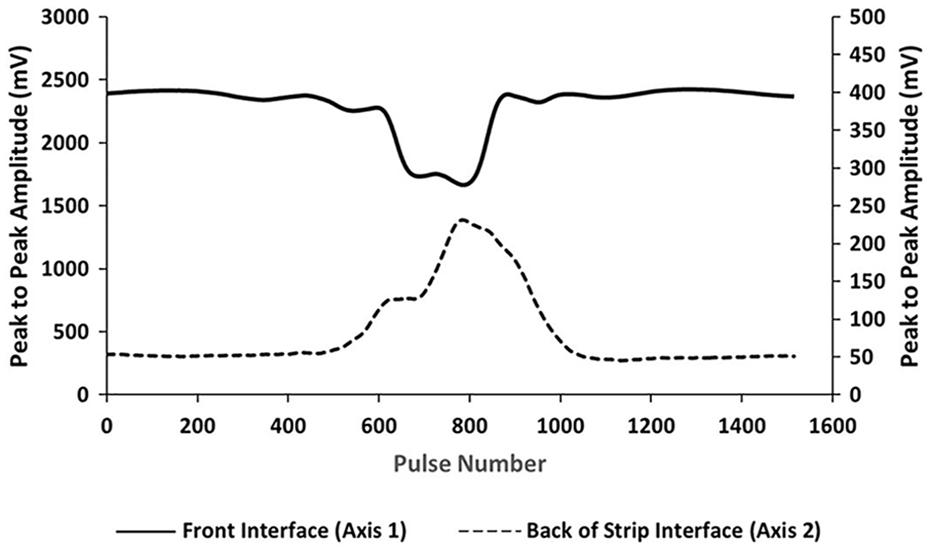
Amplitudes of the wave reflection received from the front and back surfaces of the rolled strip.
Determination of the strip thickness using ToF
The ToF between the two waveforms (Figure 11) depends on the rolling gap (vertical distance between the two adjacent rolls). The greater the applied load, the lesser the roll gap and the smaller the strip thickness. Thus, this accounts for the difference in ToF between the waveforms of the reflected signals at different loads.
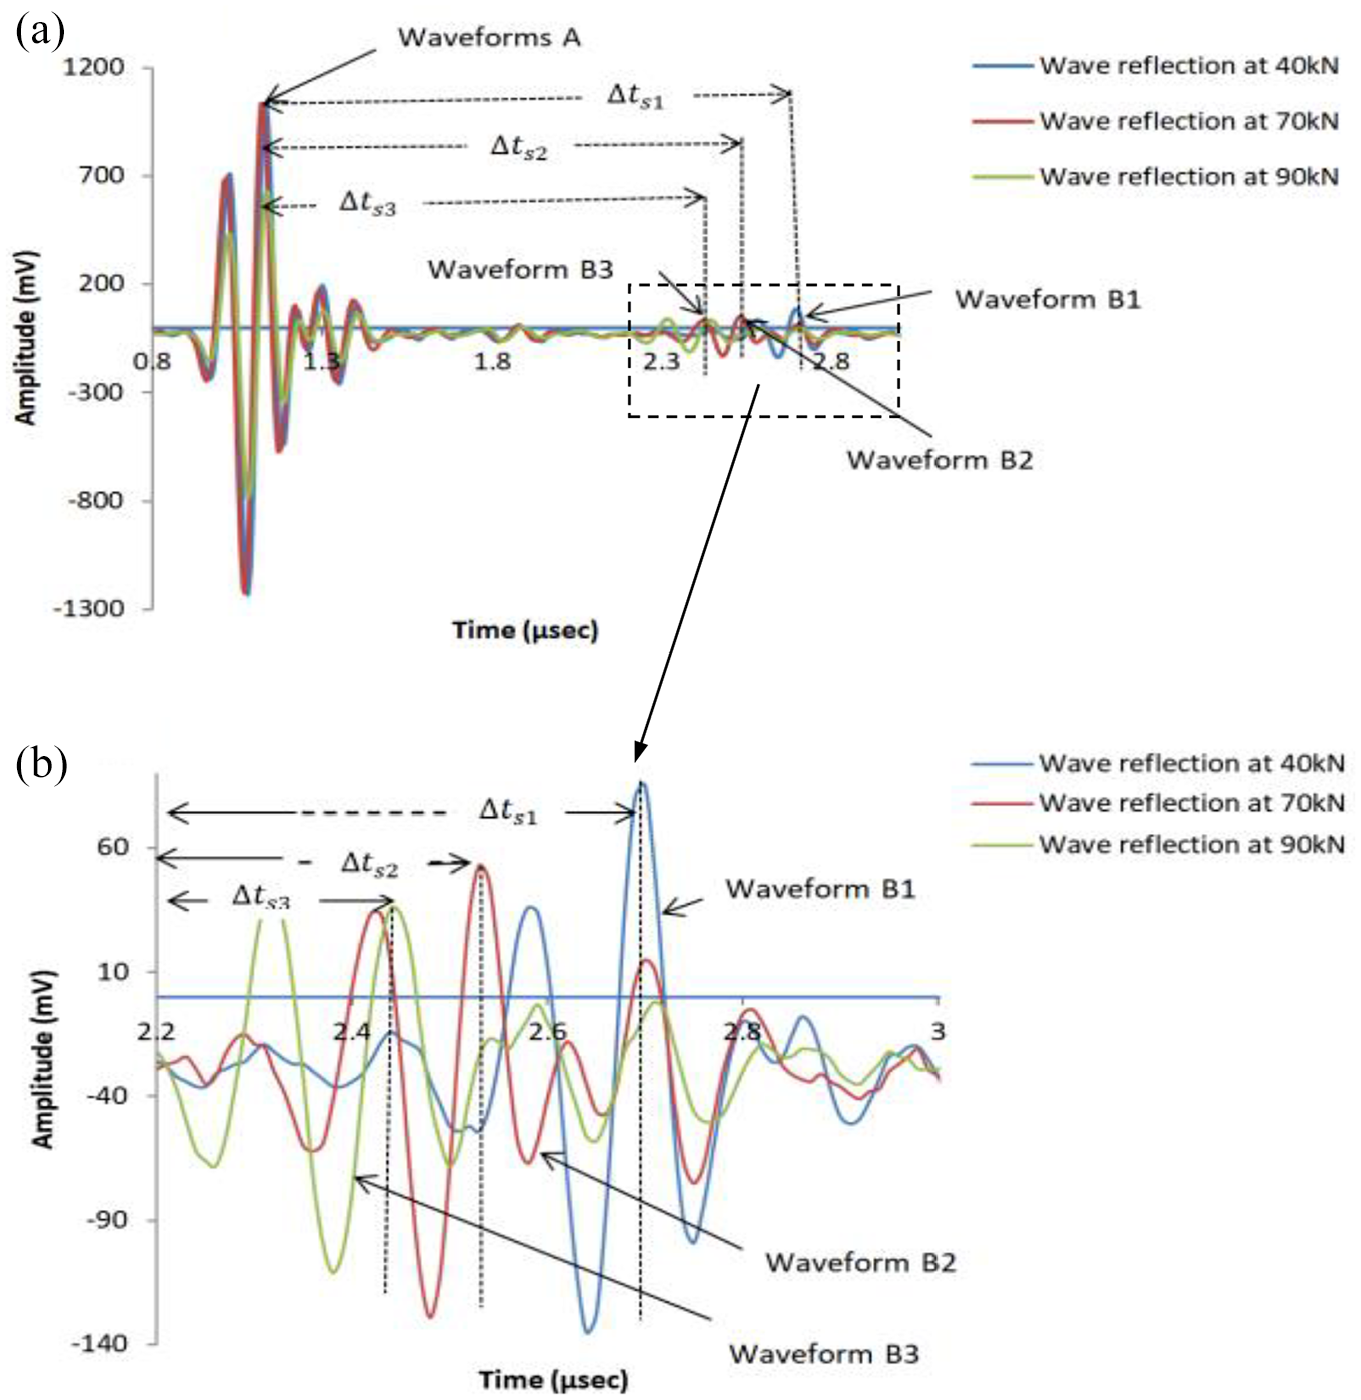
(a) Wave reflection of the transmitted signal through the roll. (b) Effects of the applied loads on the reflected signal from back surface of the strip.
As depicted in Figure 11, the amplitude of the reflected signal from the back interface of the strip decreases as the applied rolling load increases. When applied load increases, more asperities deformation occur causing increase in the true contact area, and thus, the energy of the reflected signal from the interface reduces.
The waveforms of the ultrasound reflections obtained from the back surface of the strip during the rolling process for various applied loads are shown in Figure 11(b). The positions of all these waveforms (ToF) correspond to the strip thickness in the roll gap during the operation. It is clearly shown that the higher the applied load, the shorter the ToF of the reflected signal transmitted through the strip. The ToF and the amplitude values of the reflections for the applied loads are depicted in Table 4.
Data from the reflected waves obtained from the back interface of the strip.
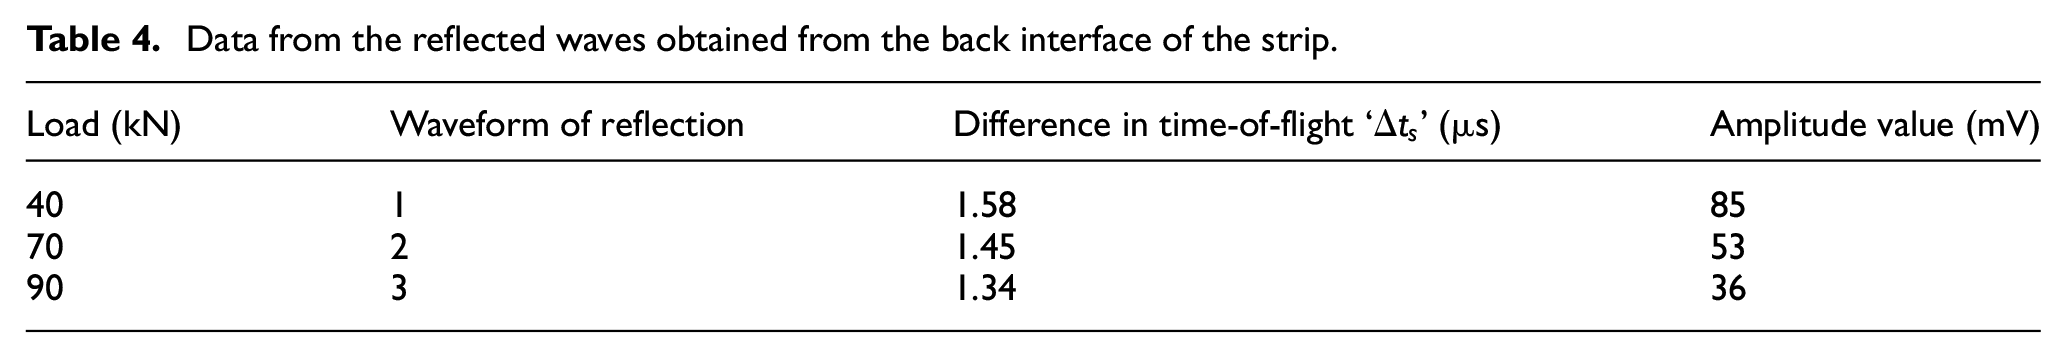
Figure 12 illustrates the reflections of ultrasound wave from the back and front interfaces of the strip with the rolls when the sensors were focused on these interfaces during the rolling process. The ToF of the reflected wave from the back interface of the roll–strip corresponds to the strip thickness during the rolling process.
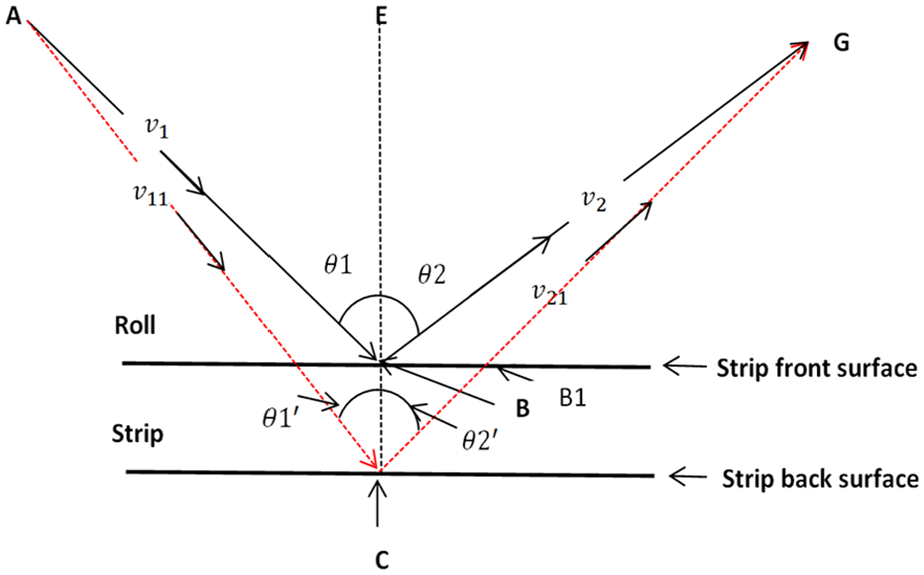
Sketch of signal transmission between roll–strip interfaces under various applied loads.
In the figure,
The values of ToF
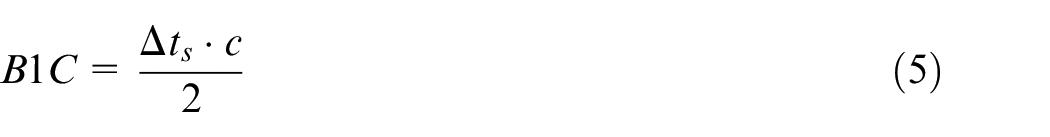
Then, the actual value of thickness was finally calculated mathematically from the obtained value of B with the trigonometric ratio principle expressed as follows
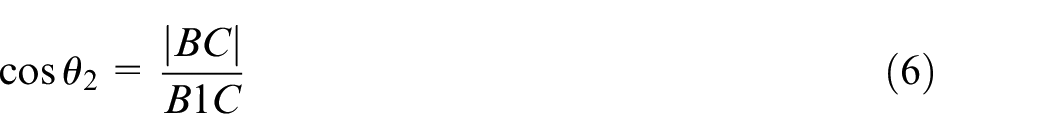
where
Figure 13 shows the measured values of strip thickness for various loads considered using the ultrasonic technique and manual mechanical contact method (Vernier caliper with a calibrated accuracy of ±4%). The difference in measured values of the strip thickness from the two methods may be attributed to the associated difficulties in using the manual method due to imperfect surface profile of material and also the elastic recovery of the rolled strip at the roll gap exit which has been reported by some authors.16,17
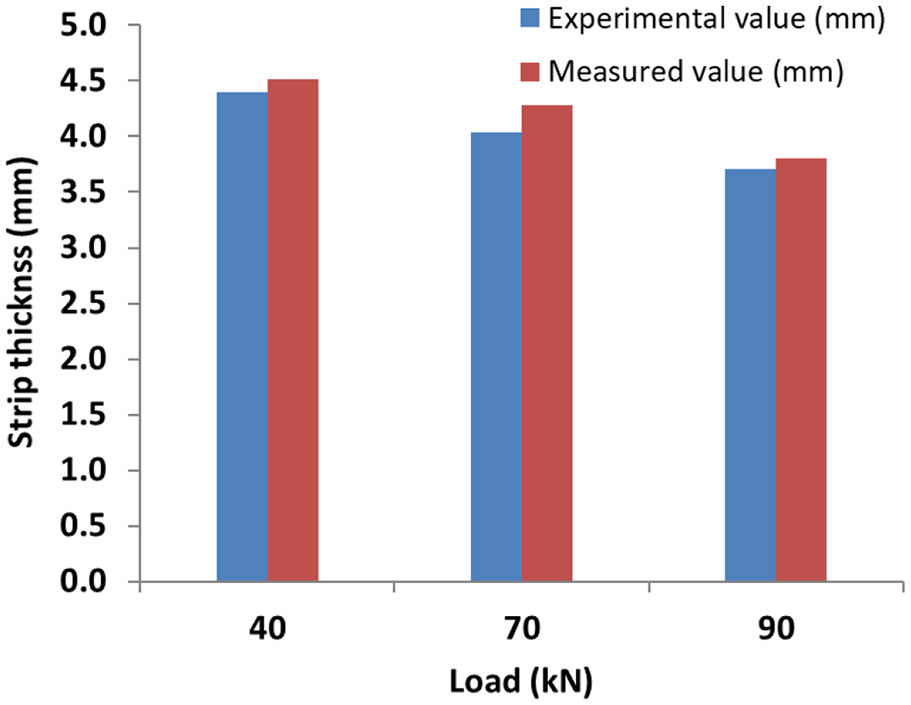
Strip thickness values obtained using ultrasonic and mechanical contact techniques.
Although the surface roughness of roll and strip has been reported to have effect on the oil film thickness formation at the roll–strip interface and the thickness of thin rolled foil,16,18,19 in this study, the average surface roughness of the roll was measured as Rq = 0.7 µm and the strip specimen was measured as Rq = 0.9 µm. The measured rolled strip thicknesses were within the range of 3.5–4.5 mm. Therefore, the effect of the surface roughness on the measured values would be very negligible (<1%) and thus disregarded. Therefore, this method is suitable to determine the strip thickness during the rolling process once the ultrasonic reflection ToF of the transmitted signal is known.
Determination of the strip thickness using the roll surface profile
Figure 13 shows the strip profile during the deformation rolling operation. The figure was plotted using the difference between the ToF from the front and back interfaces of the rolled strip against pulsing number obtained during the rolling process. The distance across the roll bite is obtained by dividing the pulse number by the pulse rate (1000/s) and multiplying by the roll speed (26 mm/s), and value obtained was then used to determine the rolled strip thickness during the rolling operation. The ToF data were converted into strip thickness using equations (5) and (6). The final value of the strip thickness is plotted against the distance in rolling direction as shown in Figure 14.
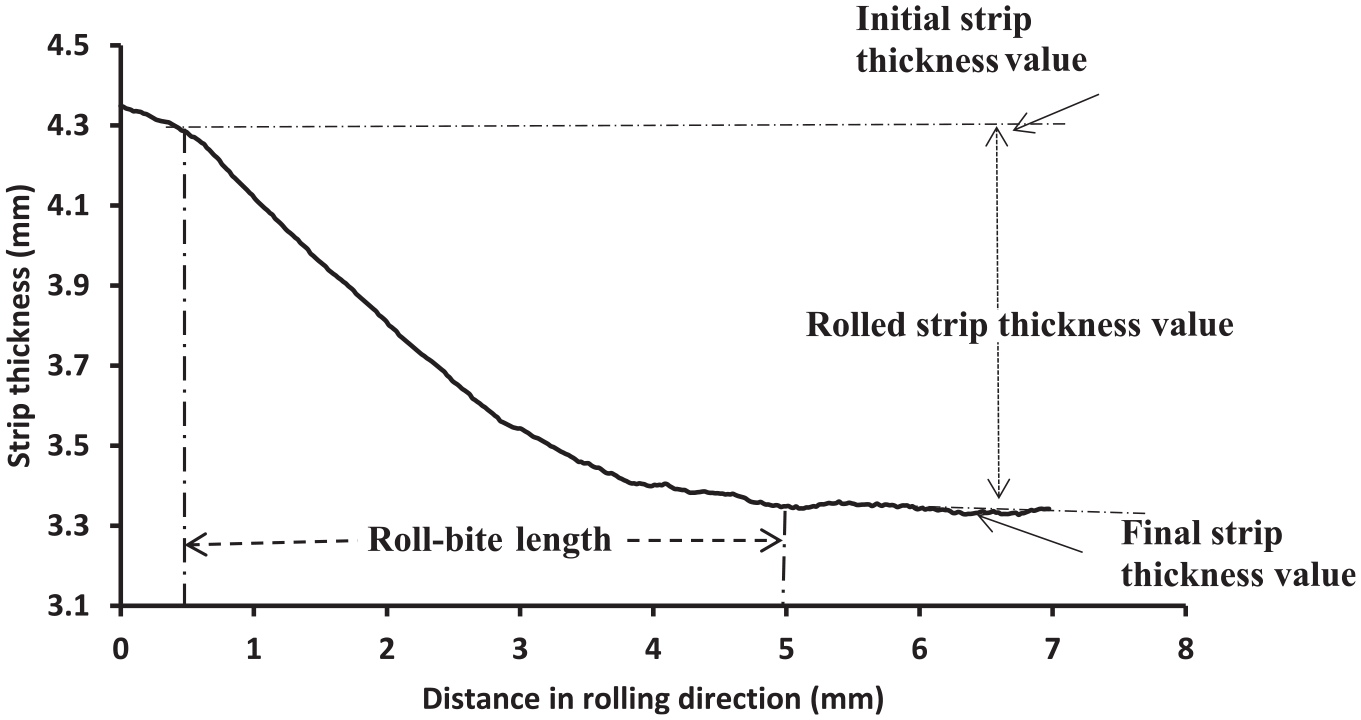
Experimental determination of strip thicknesses and roll-bite length during the rolling process.
The initial strip thickness was located on the graph at a point where the curve line started, while the final strip thickness was sited where the graph curve line remains constant. The strip thickness profile obtained shows the full picture of the gradual change in the strip thickness from the initial to final value.
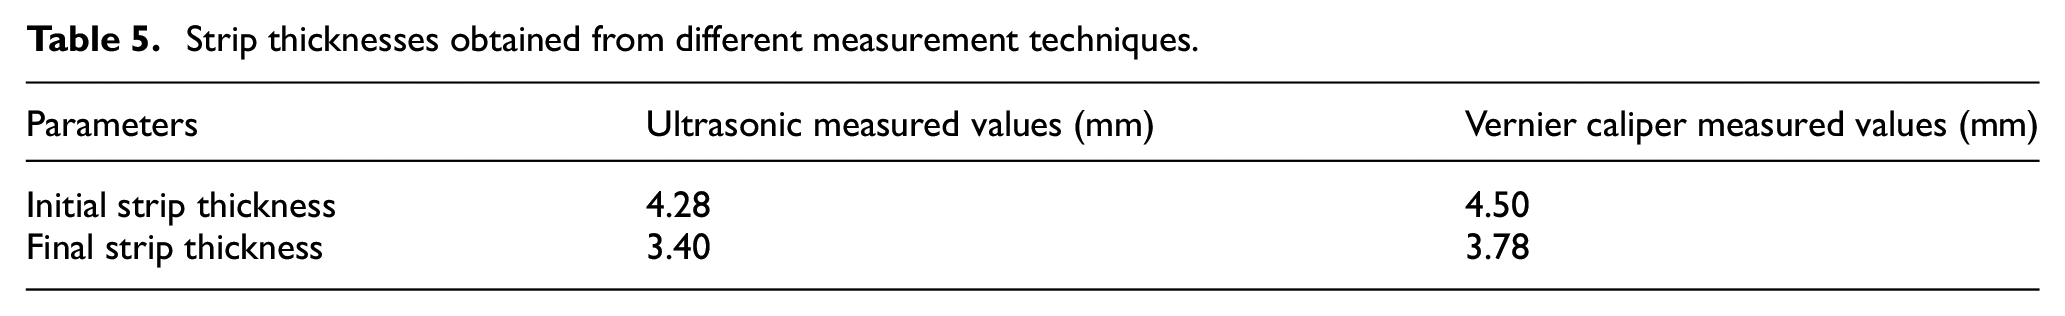
Table 5 shows the experimental measured values with manual measured values of the strip thicknesses before and after metal rolling. As previously stated, the difference between the methods can be attributed to accuracy of the measuring device and elastic recovery of the strip during the rolling process.
Strip thicknesses obtained from different measurement techniques.
Determination of the roll-bite length
As explained by some authors,18,20 roll bite is simply the distance between the entry and the exit zones of the metal–strip interface. Therefore, as shown in Figure 14, the roll-bite length is sited along the curve line of the graph. The value of 5.25 mm was experimentally obtained as the roll-bite length as against the value of 6.2 mm obtained with theoretical approach. 21 The reason for the difference between the theoretical and the experimental measured values could also be attributed to elastic recovery experienced by the strip during the rolling process.
Conclusion
In this study, non-intrusive methods have been used to measure rolled strip thickness and roll-bite length during metal rolling. An external ultrasonic technique was developed to achieve these measurements and implemented on pilot rolling mill. The following conclusions are drawn from the experiments carried out:
The results show that longitudinal waves using the oblique ultrasonic measuring method can be used for determination of strip thickness;
The rolled strip thicknesses were successfully determined during the metal rolling process using the reflected wave obtained from the metal–roll interface profile;
The length of the roll-bite value was experimentally determined and compared with the theoretically calculated value;
Strip thickness profile across roll bite was also observed.
Footnotes
Declaration of conflicting interests
The author(s) declared no potential conflicts of interest with respect to the research, authorship, and/or publication of this article.
Funding
The author(s) received no financial support for the research, authorship, and/or publication of this article.