
Abstract
The introduction of advanced technologies and new production paradigms has led an increasing number of manufacturing companies to adopt business models that include an integrated provision of products and services. This process is generally referred to as servitization. This article addresses two primary research questions: (a) How do the commodity sector, geographical location and company dimension affect the variety of services offered by manufacturing companies? (b) What is the impact of these structural factors on the type of services offered by manufacturing companies? To address these questions, this article provides new insights into the understanding of the servitization process. The main elements of originality of this study are (a) an unprecedented size of the analysed sample, composed of more than 190,000 manufacturing companies; (b) a quantitative analysis of the effects of the three aforementioned factors on the servitization process and (c) a definition of a pair of indicators for evaluating and benchmarking the strategic position of manufacturing companies with respect to their service provision.
Keywords
Introduction
Smart manufacturing, advanced manufacturing, Industry 4.0 and digital transformation are just a few of the concepts that in recent years have been defined to describe the current process that is profoundly changing our attitude towards manufacturing companies.1–3 This revolution brought new production paradigms, among which the integration of products and services is one of the most relevant.4–6 The scientific literature coined the term servitization to describe this process, intended as ‘the innovation of an organization’s capabilities and processes to better create mutual value through a shift from selling product to selling product–service systems (PSS)’, 7 that is, integrated offerings of products and services. 8
Previous investigations have qualitatively indicated several factors that served as enablers and barriers to the successful adoption of service strategies in manufacturing companies.9–12 It has also previously been observed that manufacturing companies have different strategies in the diversification of their service portfolio.9,13,14
However, the current understanding of enabling structural factors affecting the servitization process remains essentially qualitative. The purpose of this article is to address this gap by quantitatively and empirically analysing a selection of structural factors affecting servitization process. The following research questions (RQs) are specifically addressed:
RQ1. What is the impact of the structural factors (commodity sector, geographical location, company dimension) on the variety of services offered (i.e. the number of different types of services offered) in manufacturing companies?
RQ2. What is the impact of the structural factors (commodity sector, geographical location, company dimension) on the composition of the service portfolio (i.e. the types of services offered) in manufacturing companies?
The approach herein proposed is based on the processing of secondary data related to a sample of manufacturing companies in order to gather information about their services offerings. Being composed of 190,000 manufacturing companies distributed all over the world, this sample has no precedent in the literature for its size and geographical distribution.
This study presents a significant opportunity to advance the understanding of the servitization process. In detail, three are the main elements of novelty introduced. First, this investigation provides an updated and solid overview of the extent of servitization process, reporting data related to 21 countries, 22 manufacturing sectors and different company dimensions. Second, the statistical analysis reveals that three structural factors (commodity sector, company dimension, geographical location) impact on the extent of the servitization process, both in terms of variety of services offered and composition of the service portfolio. Third, this research identifies a pair of indicators to evaluate and benchmark the strategic position of manufacturing companies with respect to their service provision. The results of this study could be of interest to researchers and practitioners who need to: (a) compare the servitization position of different companies with respect to their relevant market; (b) compare servitization behaviour in different markets; (c) analyse the servitization of specific commodity sectors so as to support a company in the identification of its optimal strategic positioning.
This article is structured as follows. Section ‘Theoretical background and hypothesis formulation’ summarizes the major contributions related to the topic of the paper, also introducing the hypothesis that drove this research. Section ‘Methodology’ details the methodology of analysis. Results presented in section ‘Empirical results’ are then used in section ‘Company positioning’ to suggest the definition of two specific indicators to evaluate the strategic positioning of a company with respect to a reference set of competitors. The concluding section summarizes the original contributions of the paper, focusing on the benefits, limitations and possible future developments.
Theoretical background and hypothesis formulation
It is reasonable to imagine that there may be several factors that can affect servitization, including the industrial context (trend, technological innovation trend, degree of competition, regulation, etc.), the internal environment (degree of customer contact, available financial resources, etc.), market and customer (customer requirements, market readiness, customer culture, etc.).
To obtain a solid figure of the phenomenon, it is possible to observe and test the significance of the factors on a sufficiently large amount of data. Due to the complexity of the servitization phenomenon and the limited availability of secondary data, this research aims at verifying the significance of a subset of three structural factors: commodity sector, company dimension and geographical location.
The study of their significance may be interesting since the existing body of literature is scarce and limited to the analysis of surveys based on samples of a few companies. Previous studies qualitatively observed that: (a) a company’s commodity sector can affect the strategic choice of service provision, also in consideration of the competition and the specificity of the market;15–17 (b) the company dimension can be seen as a proxy for the availability of (economic and personnel) resources that can enable or facilitate the transition to the provision of services; 15 (c) the geographical location can influence the economic context in which a company operates, thus determining different strategic choices of service provision.15,18,19
The servitization process
Over the years, different perspectives have been adopted by researchers and scholars to investigate the servitization process. 20 Few authors directly addressed the definition of servitization.7,8,21 Several authors identified a variety of forms of servitization, 8 defining the ‘product–service continuum’,9,22,23 that is, a continuum from traditional manufacturing companies to product–service providers able to manage all the product life cycle and to offer complex solutions.
Opportunities and barriers for the implementation of the servitization process have been widely studied.9–11,24 Oliva and Kallenberg 25 emphasized the role of services as a market entry barrier for competitors because of their difficulty to be imitated. A number of different motivations that may drive a manufacturing company to undertake a servitization path have been found and widely analysed: differentiation from competitors 26 and improve product reliability, 27 customer loyalty 28 and product performance. 29 Moreover, services are usually more profitable than products for manufacturing companies. 30 In this regard, Fang et al. 17 examined data about 477 manufacturing firms and concluded that the service offering has a positive effect on the value generated by a company when their weight on revenues is over 20%–30%. Moreover, the effect of service sales on company revenues is related to firm and industry factors. Finally, the servitization process seems to produce better results when the service offering is related more to the firm core products.
However, a number of studies have shown that firms may also face barriers to implement the servitization process. 31 In this regard, Martinez et al. 32 identified five categories of challenges: (a) the need for a product-service culture for traditional manufacturing companies; (b) the ability to manage the delivery of integrated offering through a plurality of touch-points; (c) the acquisition of the internal processes and capabilities in order to compete in new service markets; (d) the alignment of mind-set and understanding towards service provision and (e) the ability to build new supplier relationships and to cooperate in innovative service ecosystems.
Previous studies analysed the extent of servitization across different countries. In a widely acknowledged study, Neely et al. 33 analysed the global trends of manufacturing servitization. Their article compared the servitization extent in 27 countries. In 2014, Dachs et al. 15 published a quantitative study based on the data contained in the European Manufacturing Survey and concluded that (a) national differences in servitization play a minor role; (b) firm size is relevant and (c) the degree of servitization is not linearly dependent on the firm size and, they found a U-shape distribution.
Product-related services and servitization
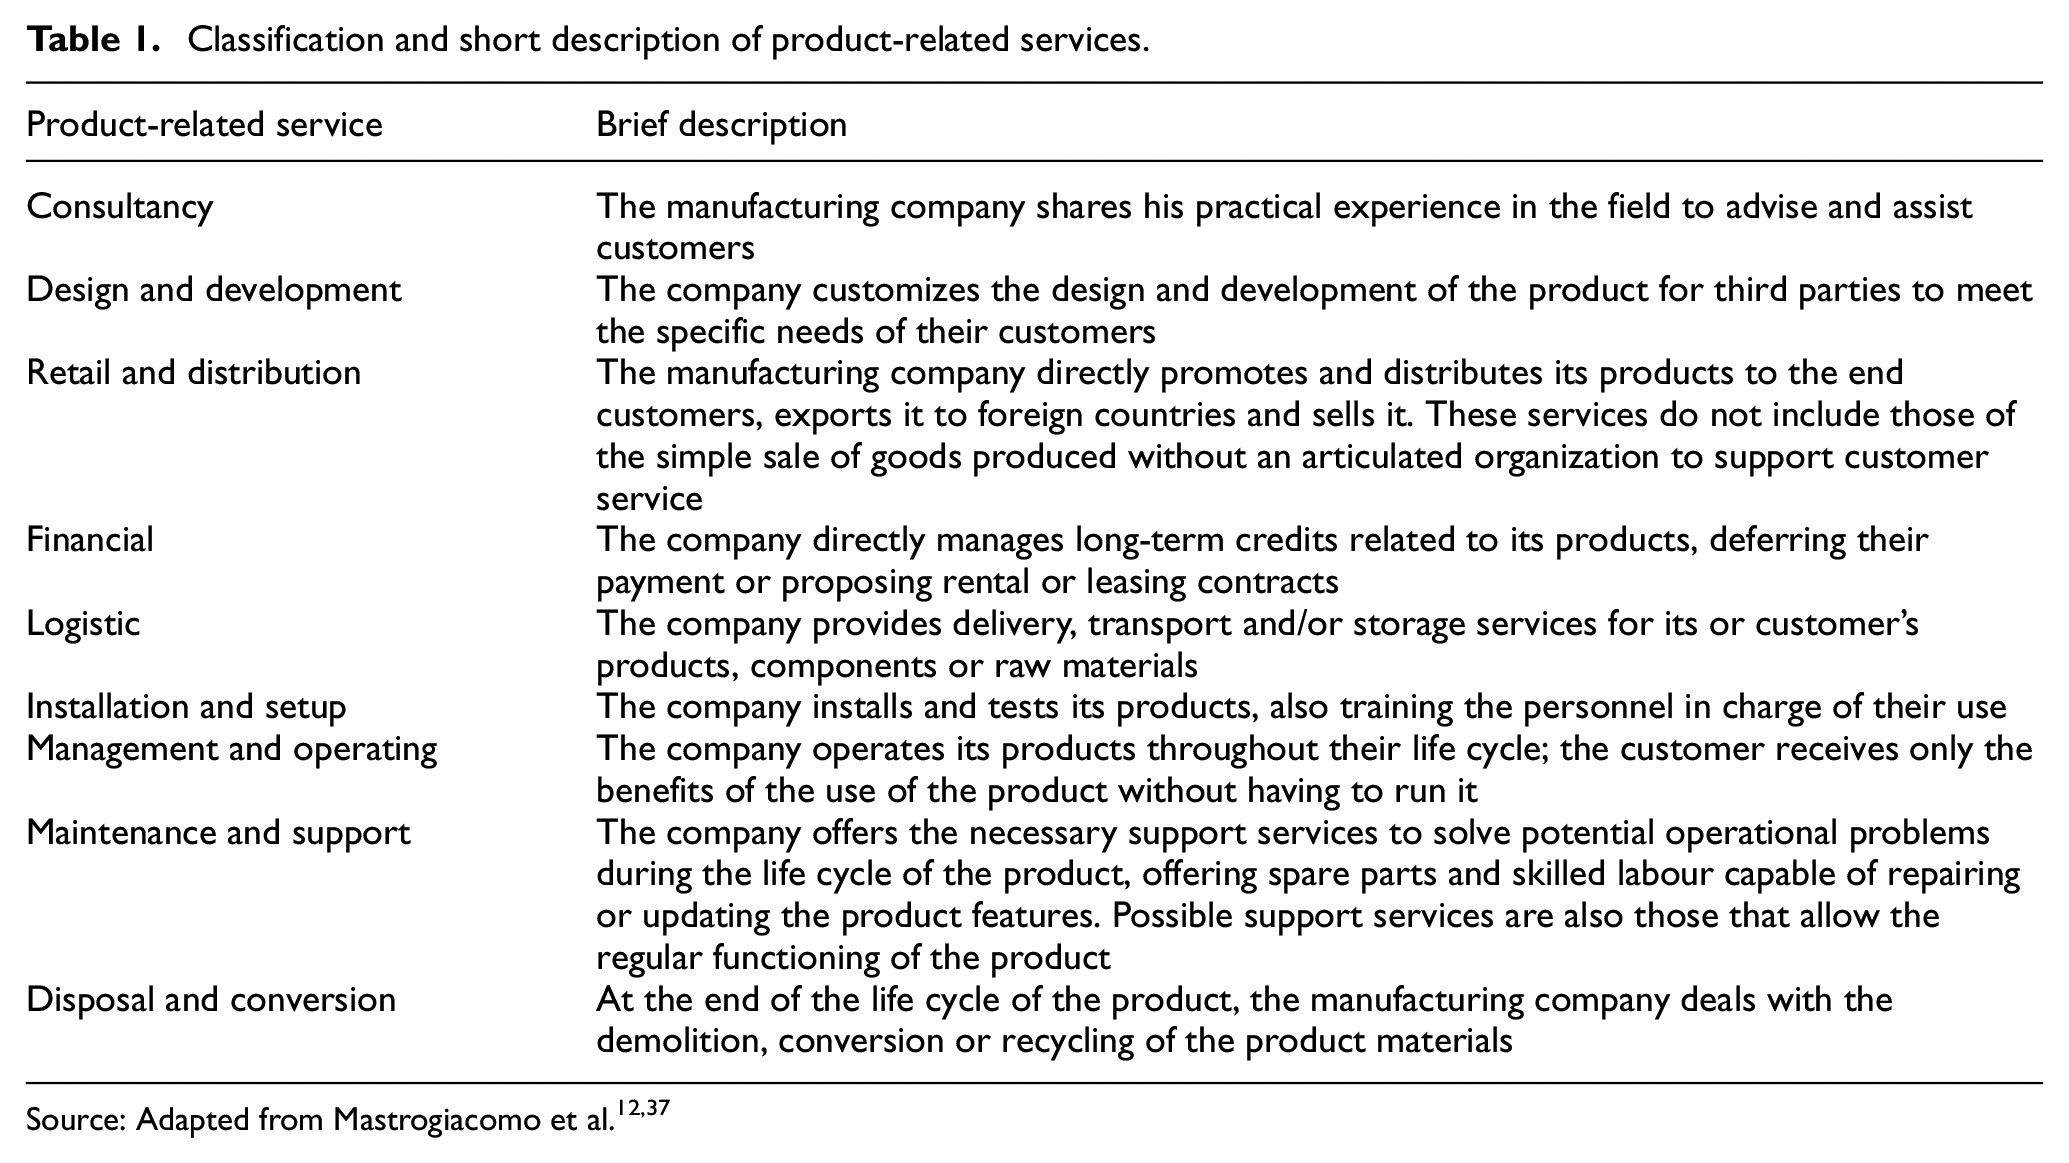
Servitized manufacturing companies provide complementary services to differentiate their products and promote their economic growth. 34 The scientific literature proposes a number of different classifications of such services.35,36 Summarizing the different proposals, product-related services can be clustered in the following macro typologies: 37 (a) consultancy, (b) design and development, (c) retail and distribution, (d) financial, (e) logistic, (f) installation and setup, (g) management and operating, (h) maintenance and support and (i) disposal and conversion (see Table 1 for a brief description of each category of service).
Classification and short description of product-related services.
Depending on whether companies provide product-related services, they can be classified into three categories:7,12
Pure manufacturing companies, that is, companies whose activities are limited to manufacturing;
Servitized manufacturing companies, that is, manufacturers that develop service offerings that support their products;
Pure service companies, that is, companies providing services only (previously being manufacturing companies).
Factors affecting the servitization process
The following sections will test the effect of commodity sector, company dimension and geographical location on servitization, observed from two different aspects:
The variety of services offered, that is, the number of different service typologies that a company provides;
The composition of service portfolio, intended as the specific service typologies offered by a manufacturing companies.
The two aforementioned aspects will be tested against the following hypotheses (see Figure 1):
H1: commodity sector ○ H1.a: Variety of services offered is associated with commodity sector; ○ H1.b: Composition of service portfolio is associated with commodity sector.
H2: company dimension ○ H2.a: Variety of services offered is associated with company dimension; ○ H2.b: Composition of service portfolio is associated with company dimension.
H3: company geographical location ○ H3.a: Variety of services offered is associated with geographical location; ○ H3.b: Composition of service portfolio is associated with geographical location.
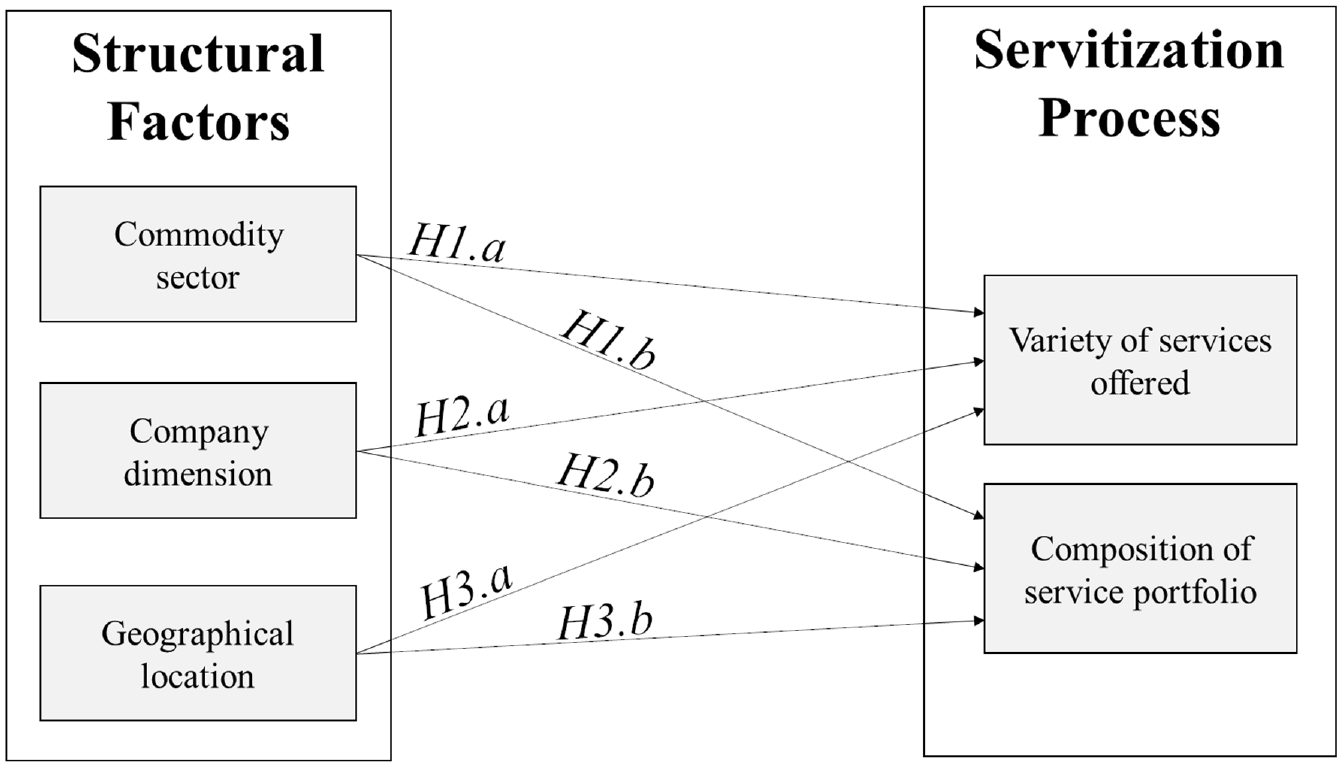
Factors influencing servitization in manufacturing companies.
Methodology
A quantitative analysis of secondary data was used to gain a detailed understanding of the factors that may affect servitization. This approach allowed to obtain and analyse information on a large number of companies of different sizes, geographical locations and commodity sectors.
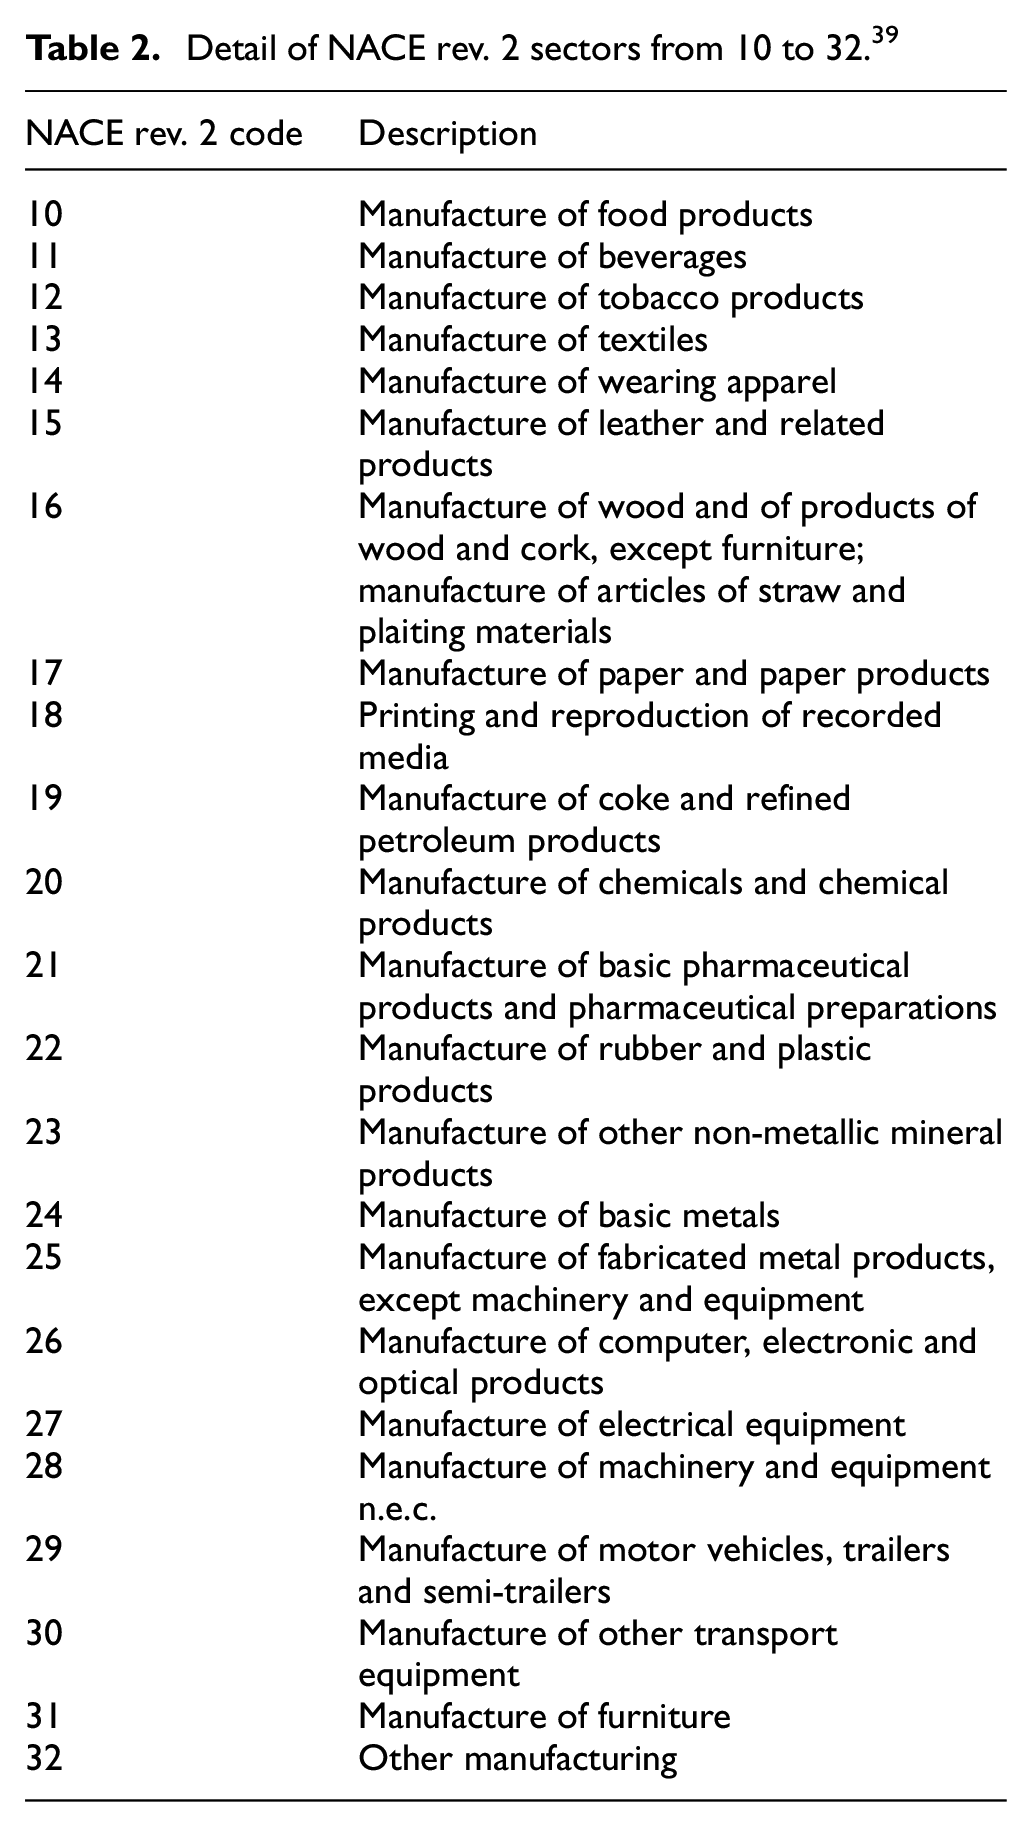
Data used for the proposed analysis were retrieved in September 2018 from the ORBIS database which contains personal, commercial and financial data of about 275 million companies across the globe. 38 Only medium and large size companies were analysed in the study (number of employees higher than 50). Small companies were not considered due to the limited availability of information regarding their business activities. In this analysis, only manufacturing companies were considered, that is, companies belonging to the Nomenclature statistique des Activités économiques dans la Communauté Européenne (NACE) sectors classified with codes 10–32. 39 For a comprehensive description of NACE sectors, see Table 2.
Detail of NACE rev. 2 sectors from 10 to 32. 39
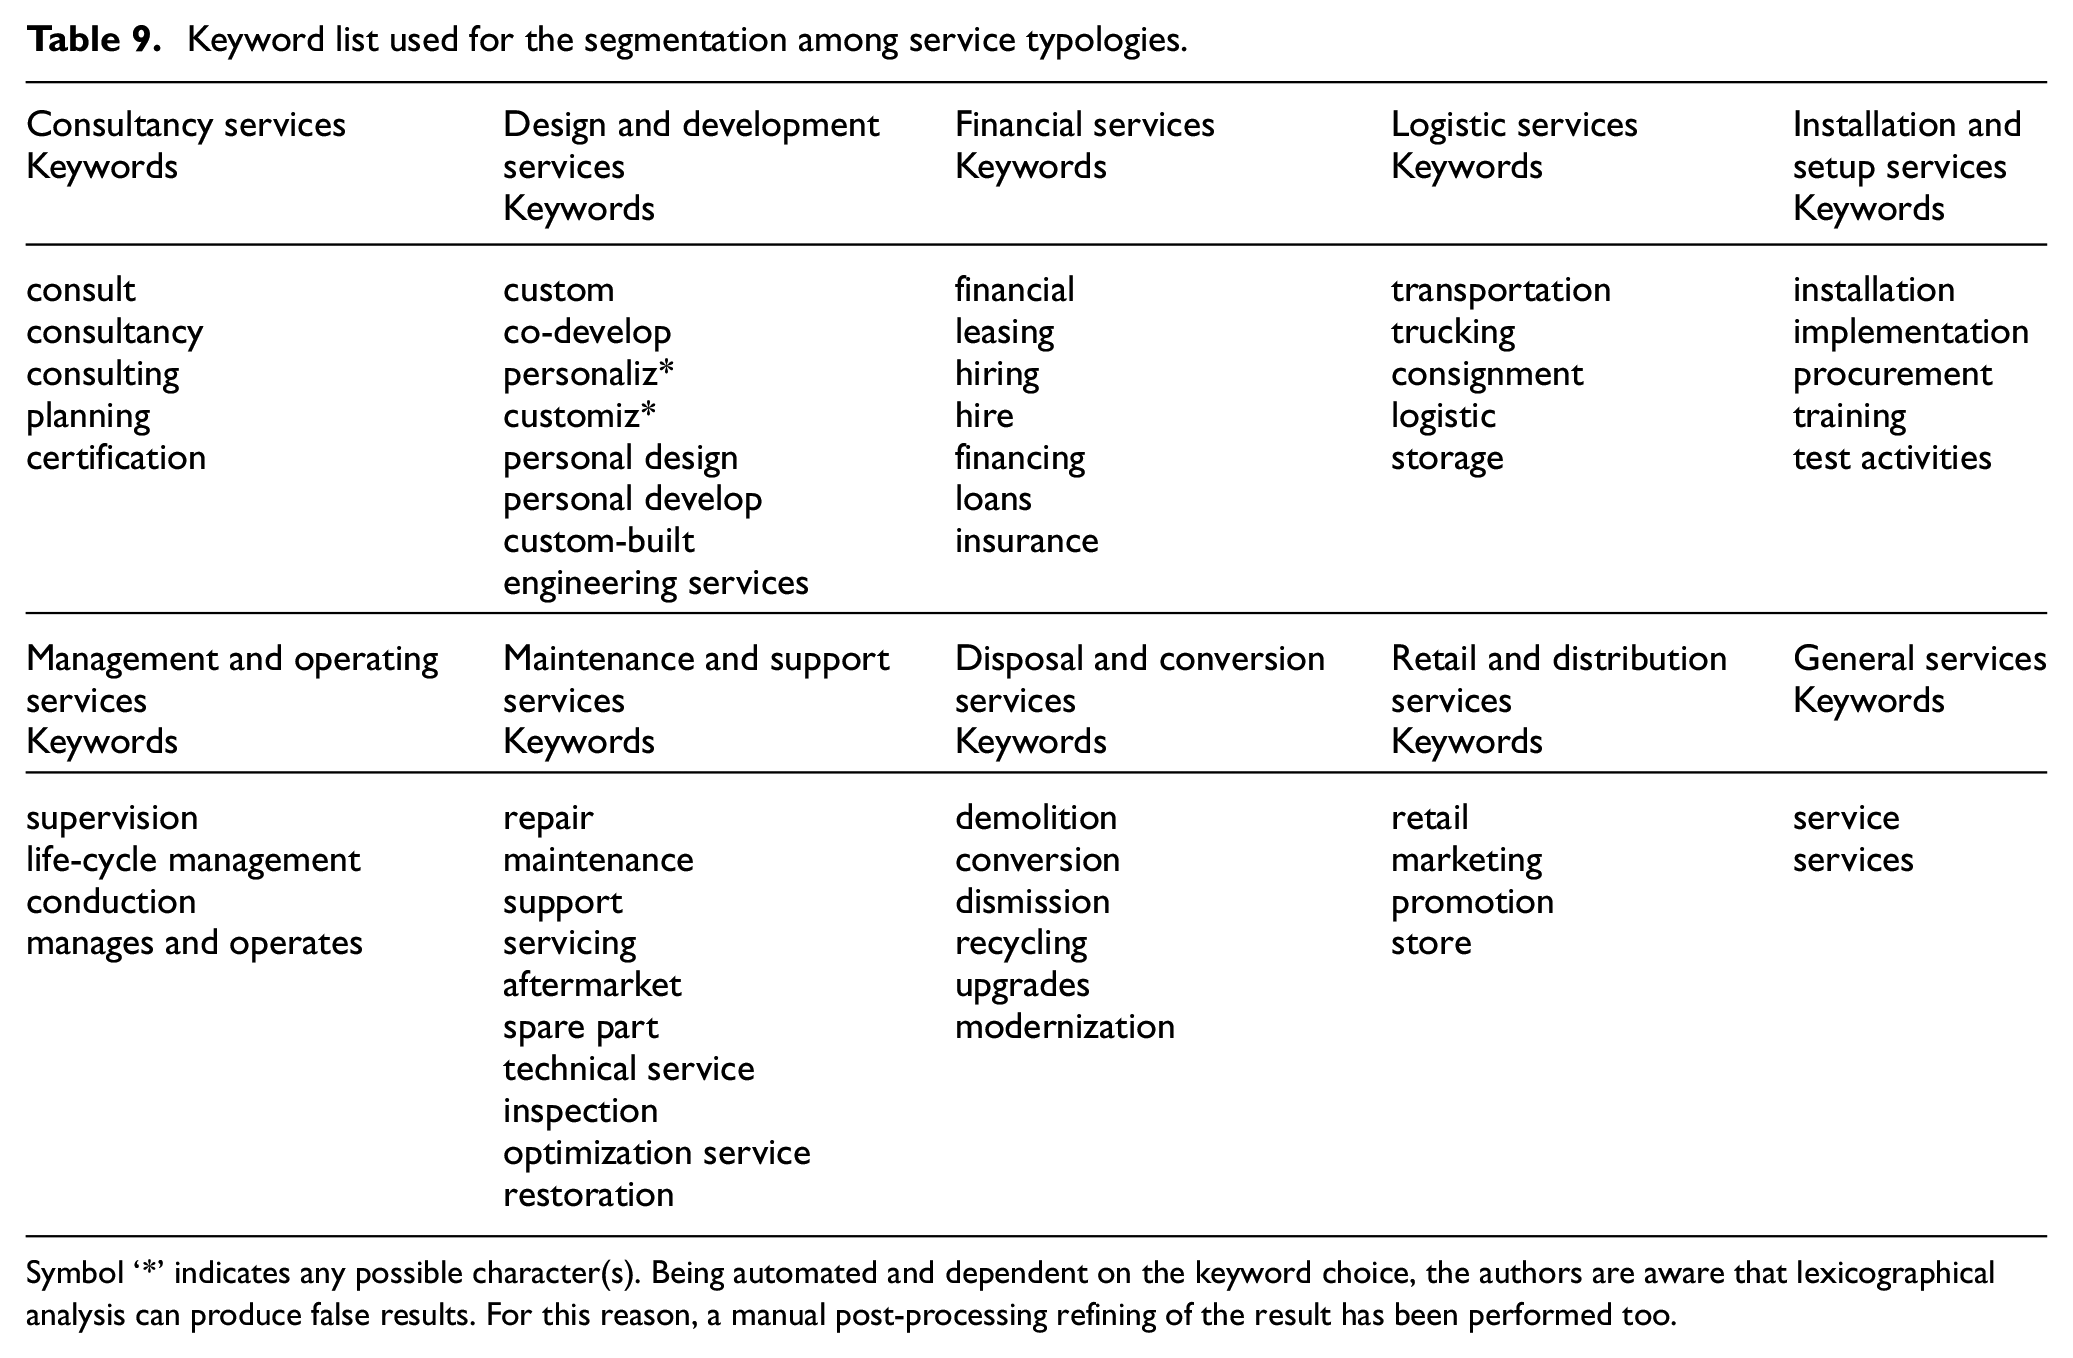
The initial sample consisted of 190,442 companies located in 124 countries around the world. Among other information, the ORBIS database provides a textual overview of the main activities that each company carries out and a textual description of their trades. Thanks to the definition of a series of 10 different sets of keywords (one for each product-related service typology plus one for a ‘general service’ category aimed at gathering any service activity which was not directly attributable to the other categories), this information has been processed according to the method proposed by Neely 7 for discriminating between servitized and pure manufacturing companies. To define these keyword sets, the authors followed an iterative procedure, analysing a series of company overviews (100 per each iteration) randomly extracted from the initial sample of companies, manually selecting the keywords considered representative of the nine different typologies of product-related services. The iterative procedure was stopped when the iteration resulted in no further additions within the keyword lists. After a preliminary selection, the list of keywords was then extended with variants and synonyms to get the final set. For further details, we refer the reader to Table 9 in Appendix 1 that contains the complete list of keywords used for the analysis hereafter presented.
The keyword lists were used to analyse all the companies in the sample: each company was classified as servitized if characterized by a textual overview containing at least a keyword of the list. In addition, the clustering of the service keywords allowed a distinction between the typologies of services provided according to the classification proposed in section ‘Product-related services and servitization’.
Empirical results
The application of the described methodology provided a global picture of the process of servitization. From the original sample (190,442 companies), only servitized companies were considered (72,797 companies, that is, 38% of the initial sample). This first exploration on the extent on servitization process leads us to a first finding:
Finding 1: 38% of the manufacturing companies are servitized. The remaining 62% are still focused on manufacturing activities only.
To test the hypotheses formulated in section ‘Factors affecting the servitization process’, data obtained from the ORBIS database were analysed by testing one-factor-at-a-time, that is, commodity sector, company dimension and geographical location.
Servitization versus commodity sector
For each NACE sector, Table 3 reports the number of analysed companies and their distribution per number of offered type of service.
Variety of services offered versus NACE sector (sample of 72,797 manufacturing companies).
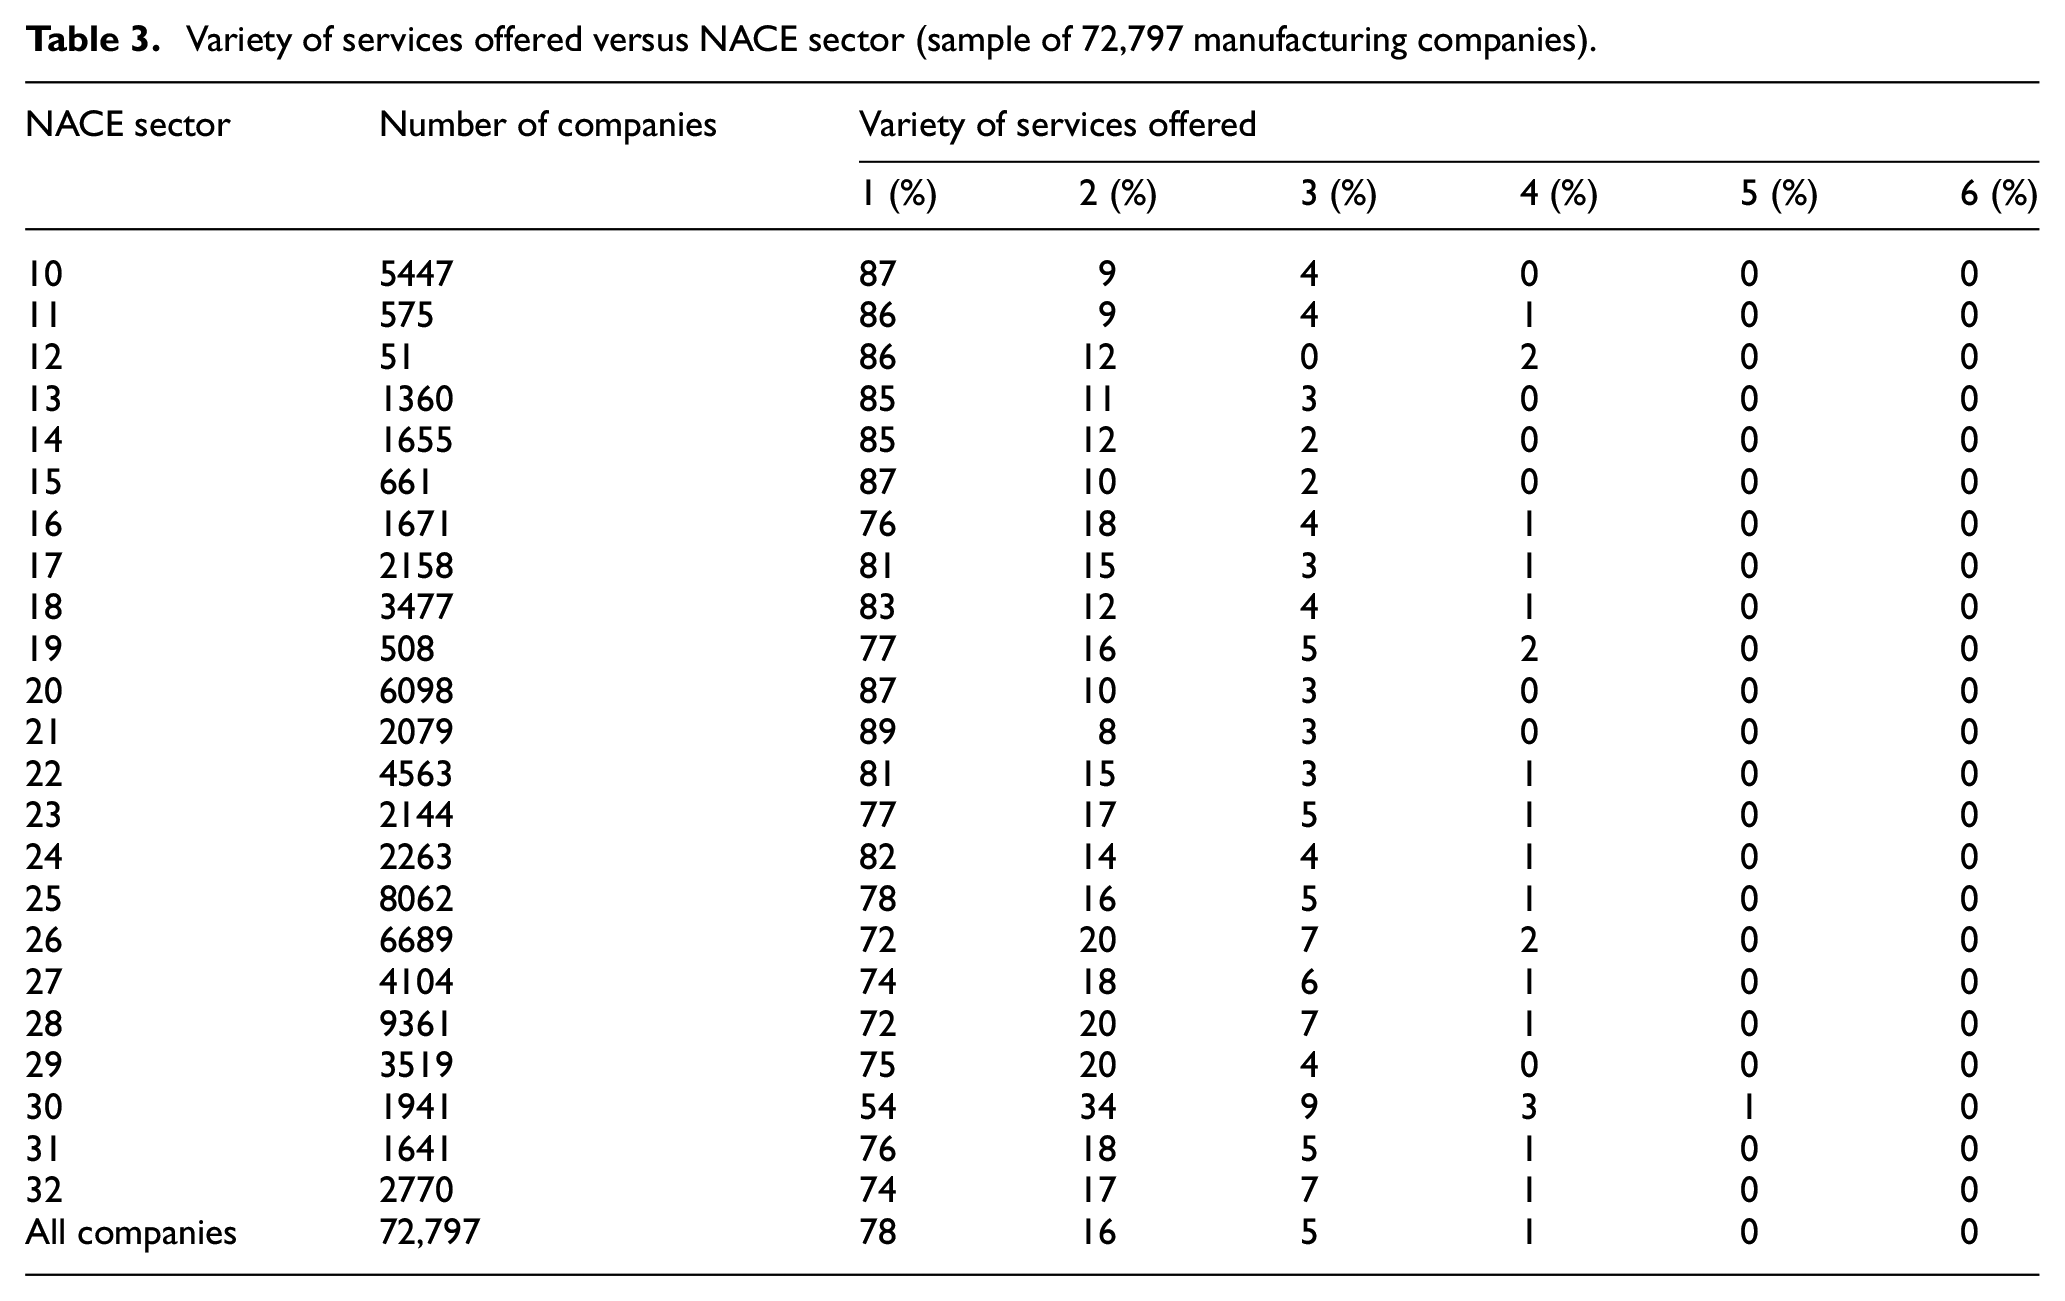
Considering all the commodity sectors, the great majority of servitized companies (78%) are still concentrated on the offering of a single service typology and only a minority offer more than three service typologies. Considering the variety of services offered, it is evident how different commodity sectors may have different tendencies to offer services. As an example, Figure 2 compares the distribution of the variety of services offered in servitized companies operating in three different commodity sectors: NACE 10 (manufacture of food products), NACE 26 (manufacture of computer, electronic and optical products) and NACE 30 (manufacture of other transport equipment). As we can see, differences in variety of services offered are significant.
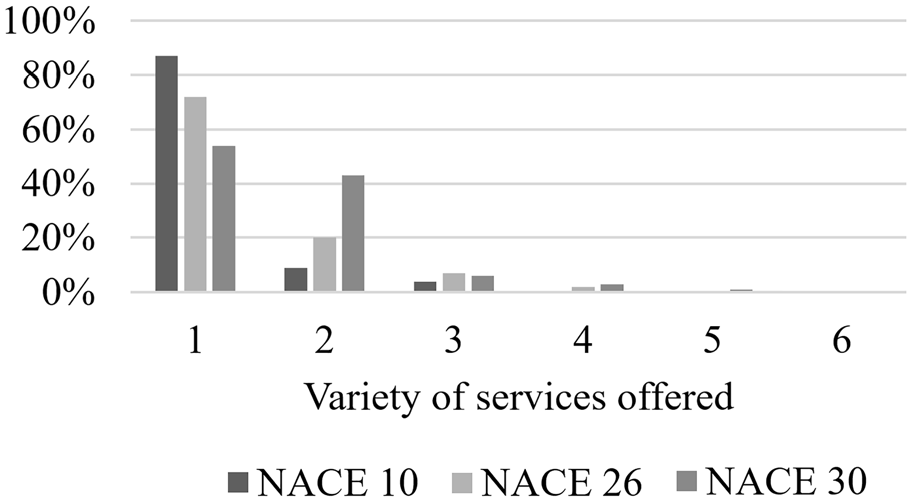
Variety of services offered in NACE 10 (manufacture of food products), NACE 26 (manufacture of computer, electronic and optical products) and NACE 30 (manufacture of other transport equipment).
The Pearson chi-square statistic was applied for testing the independence of the distribution the variety of services offered 40

According to data in Table 3, the observed chi-square test statistic (
Finding 2: commodity sector and variety of services offered are associated.
Moreover, different commodity sectors show dissimilar propensities towards the provision of different types of services. This tendency is evident in Table 4 that reports the percentage of servitized companies providing specific typologies of service.
Composition of service portfolio per NACE sector (sample of 72,797 manufacturing companies).
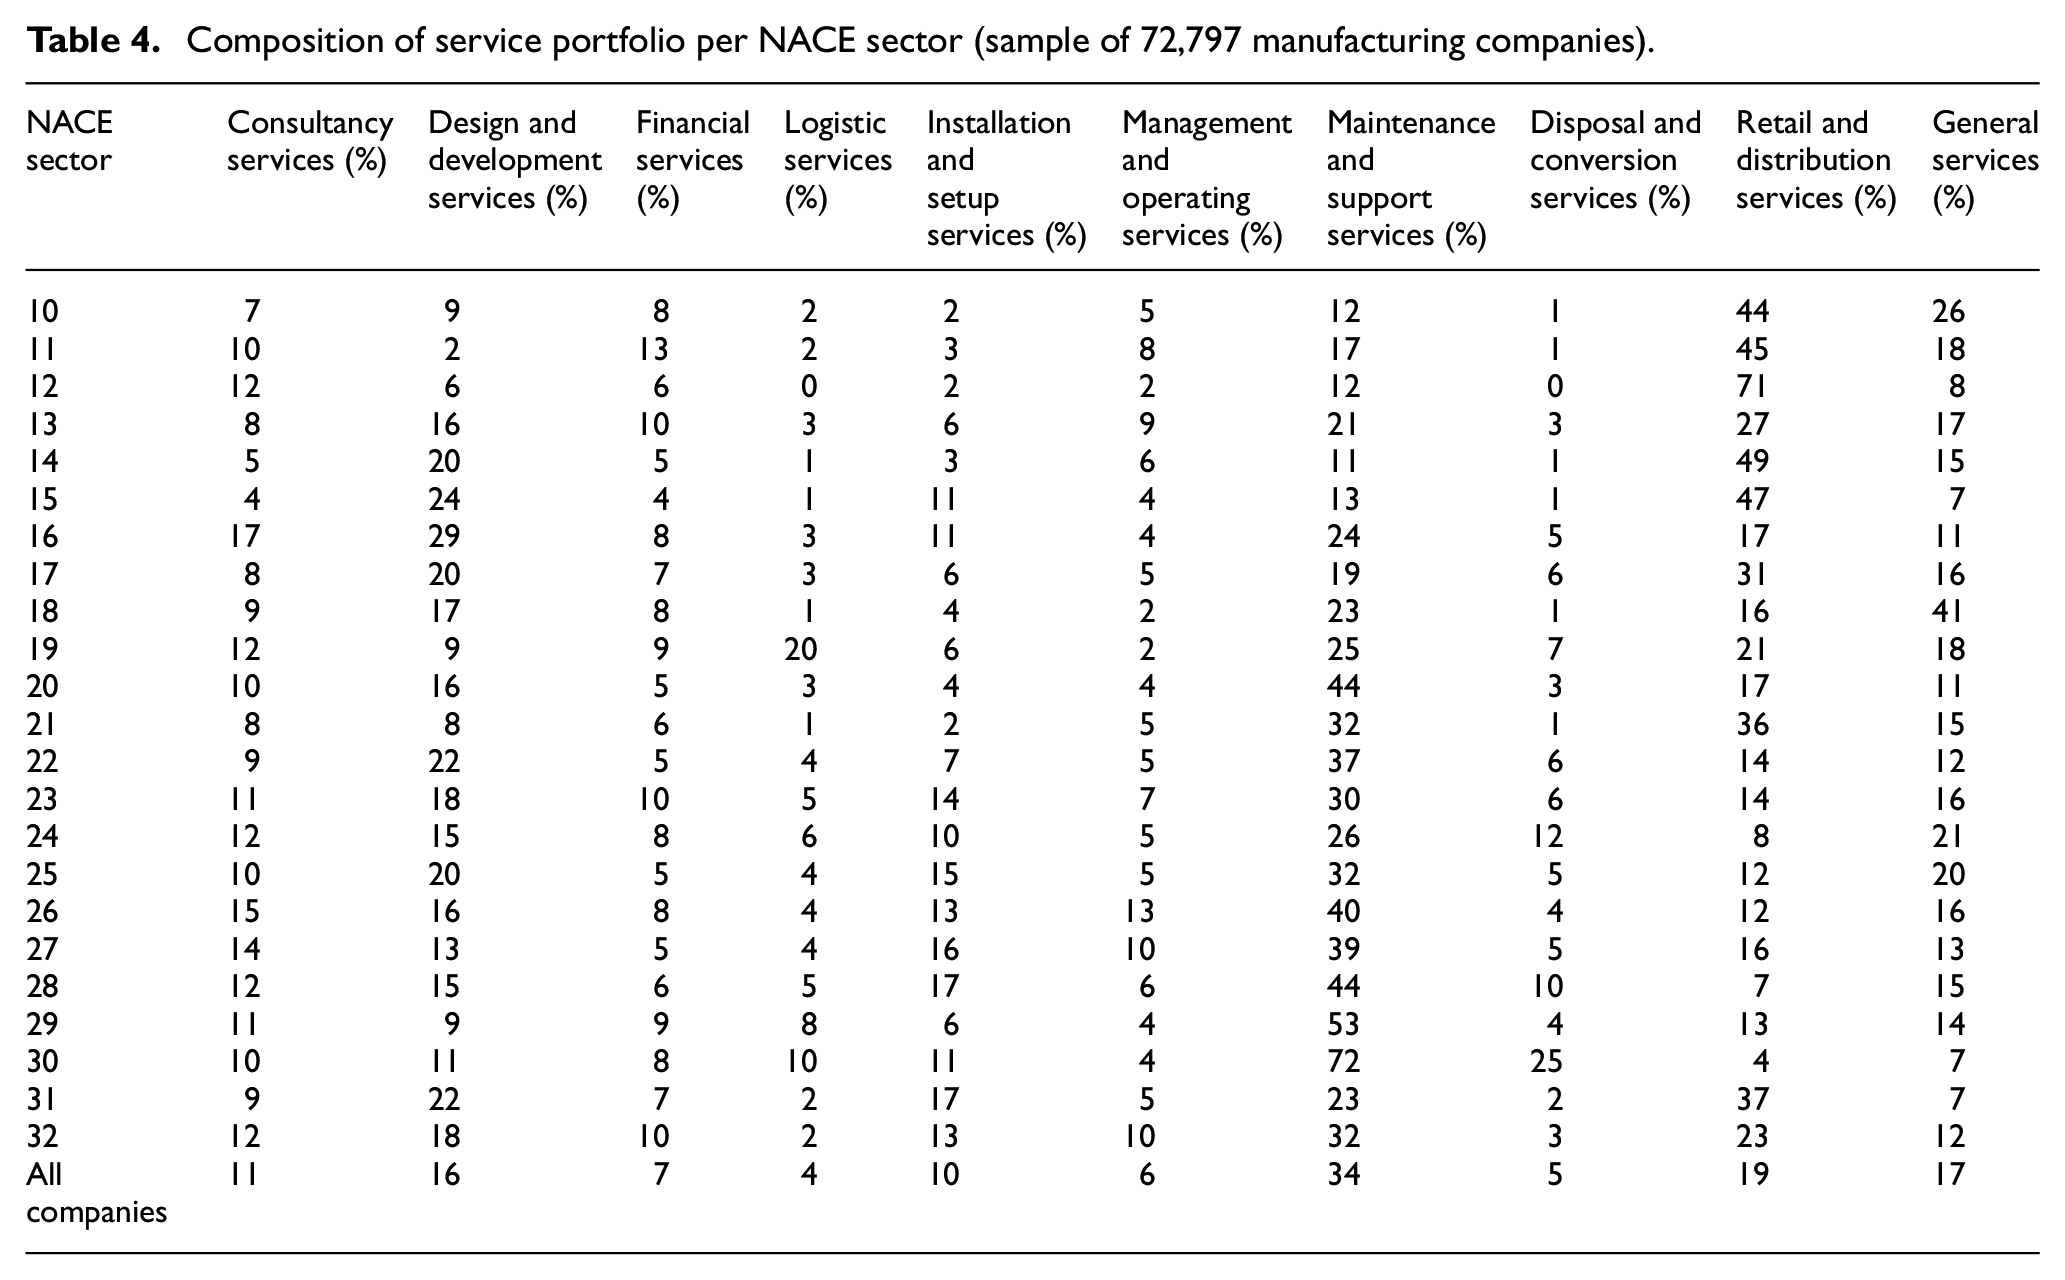
Aggregating all manufacturing sectors, service typologies majorly offered are ‘maintenance and support’ (34%) and ‘retail and distribution’ (19%). However, the composition of service portfolio per production sector can be rather different. For example, 49% of NACE 14 companies (manufacture of wearing apparel) offer retail and distribution services; this percentage drops to 4% if we consider NACE 30 (MANUFACTURE of other transport equipment). As an example, Figure 3 compares the service portfolio of three different industrial sectors (NACE 10, 20, 29).
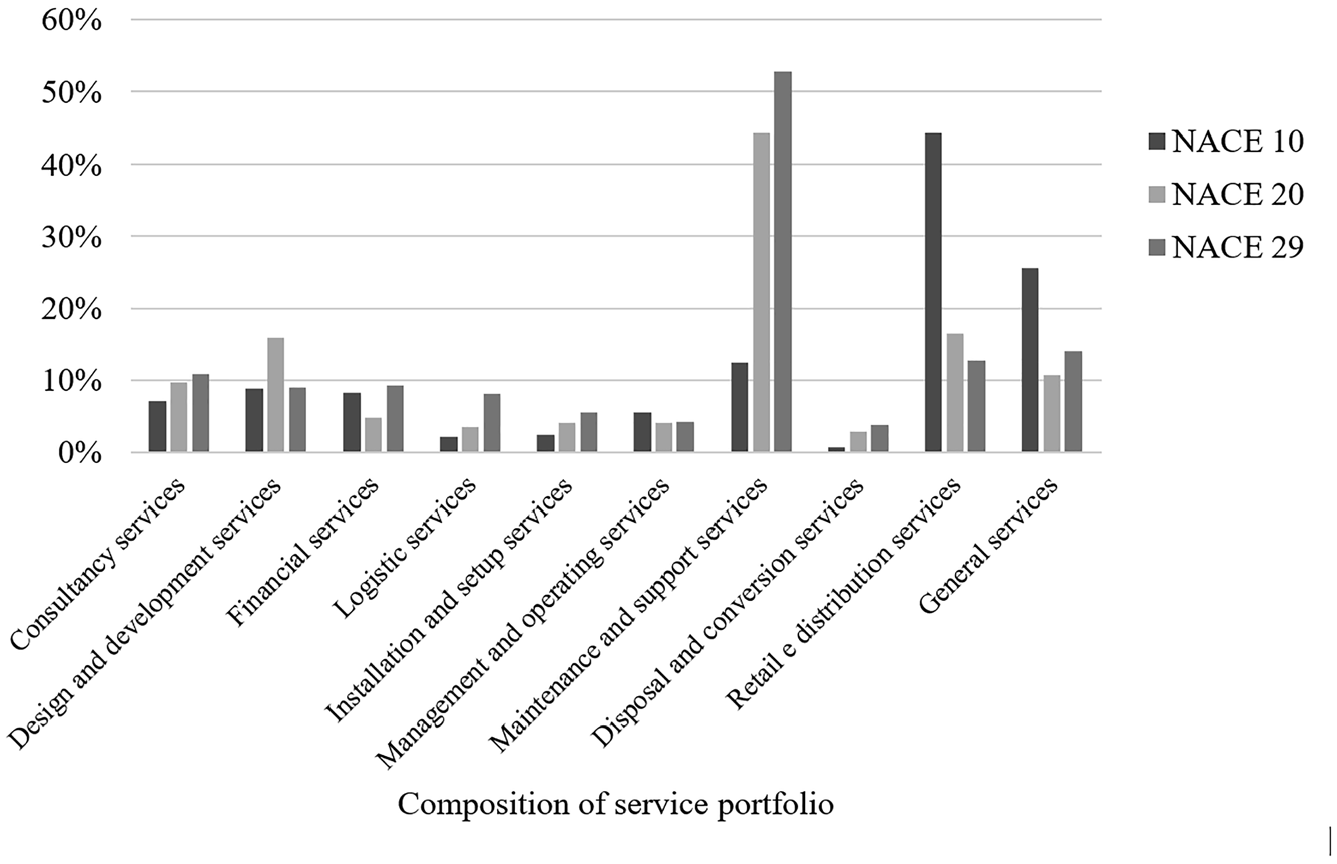
Composition of service portfolio in NACE 10 (manufacture of food products), NACE 20 (manufacture of chemicals and chemical products) and NACE 29 (manufacture of motor vehicles, trailers and semi-trailers).
The hypotheses herein tested are

The observed chi-square test statistic is equal to 19,909, with df = 198. The chi-square distribution has a mean of df = 198 and a standard deviation of
Finding 3: commodity sector and composition of service portfolio are associated.
Servitization versus company dimension
According to the dimension of a company in terms of employees, Table 5 shows the percentage of companies offering a specific number of service typologies (hereafter referred to as variety of services offered).
Variety of services offered versus company dimension (sample of 72,797 manufacturing companies).
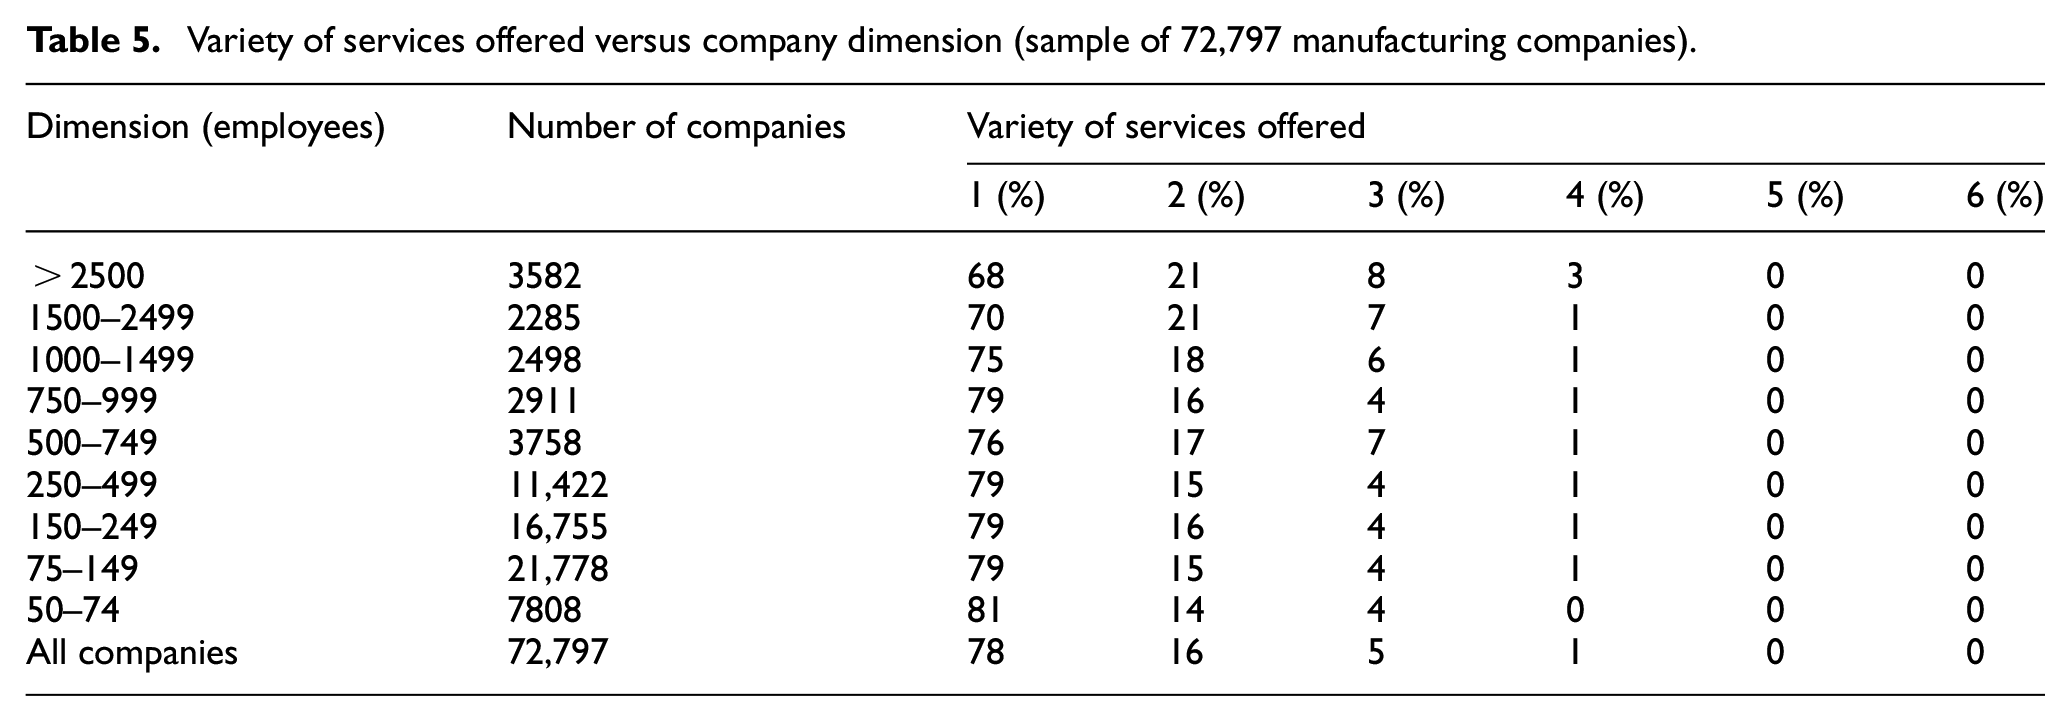
A preliminary examination of data contained in Table 5 suggests that the number of employees could be a significant factor that influences servitization in terms of variety of services offered. In particular, the variety of services offered seems to be positively related to the dimension of the company. As we can see in Table 5, the larger the dimension, the higher the percentage of companies that offer more than one service typology.
A confirmation of this heterogeneity comes from the application of the Pearson chi-square test to verify the following hypotheses

The observed value is equal to 559.67, with a P-value smaller than 10–5 (in this case the observed value is checked against a chi-square distribution with a mean of df = 40, and a standard deviation of
Finding 4: dimension of manufacturing companies, in terms of number of employees, and variety of services offered are associated.
Table 6 reports the distribution of companies with respect to the specific typology of service offered. Again, companies are classified by size.
Distribution of service typologies per company dimension (sample of 72,797 manufacturing companies).
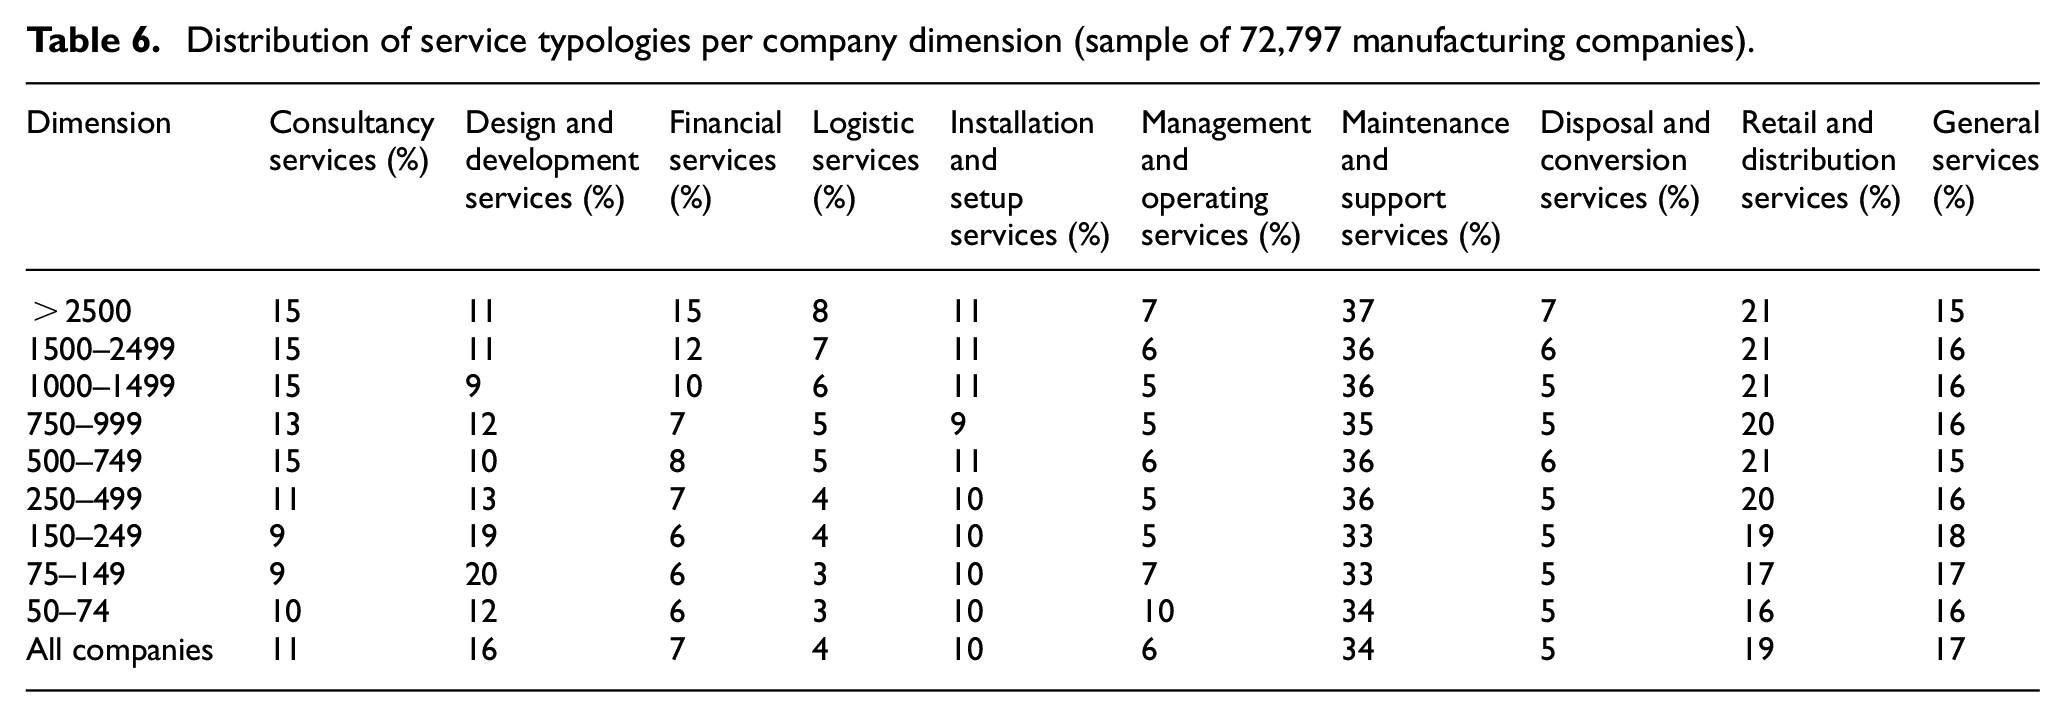
In this case, data in Table 6 do not show any obvious difference in behaviour between companies of different sizes. For example, some service typologies, such as ‘installation and setup’ or ‘disposal and conversion’, present similar percentages in all the nine classes of analysis. However, applying the Pearson chi-square test, a statistical relevance of the size factor of the company can be evidenced. In detail, data in Table 6 were used to test the following hypotheses

The observed value is equal to 2367.6, with a p-value smaller than 10–5 (in this case, the reference chi-square distribution has a mean of df = 72, and a standard deviation of
Finding 5: dimension of manufacturing companies, in terms of number of employees, and composition of service portfolio are associated.
Servitization versus company geographical location
The last factor herein considered is the geographical location of the servitized manufacturing companies. According to hypothesis H3, this factor could be related to the servitization process. To test this hypothesis data referred to variety of services offered, and service portfolio composition were analysed taking into account the location of company headquarters. Table 7 shows the distribution of the variety of services offered depending on the country. Only countries with more than 500 companies in the sample were analysed.
Variety of services offered versus geographical location (only countries with a sample of at least 500 companies are reported).
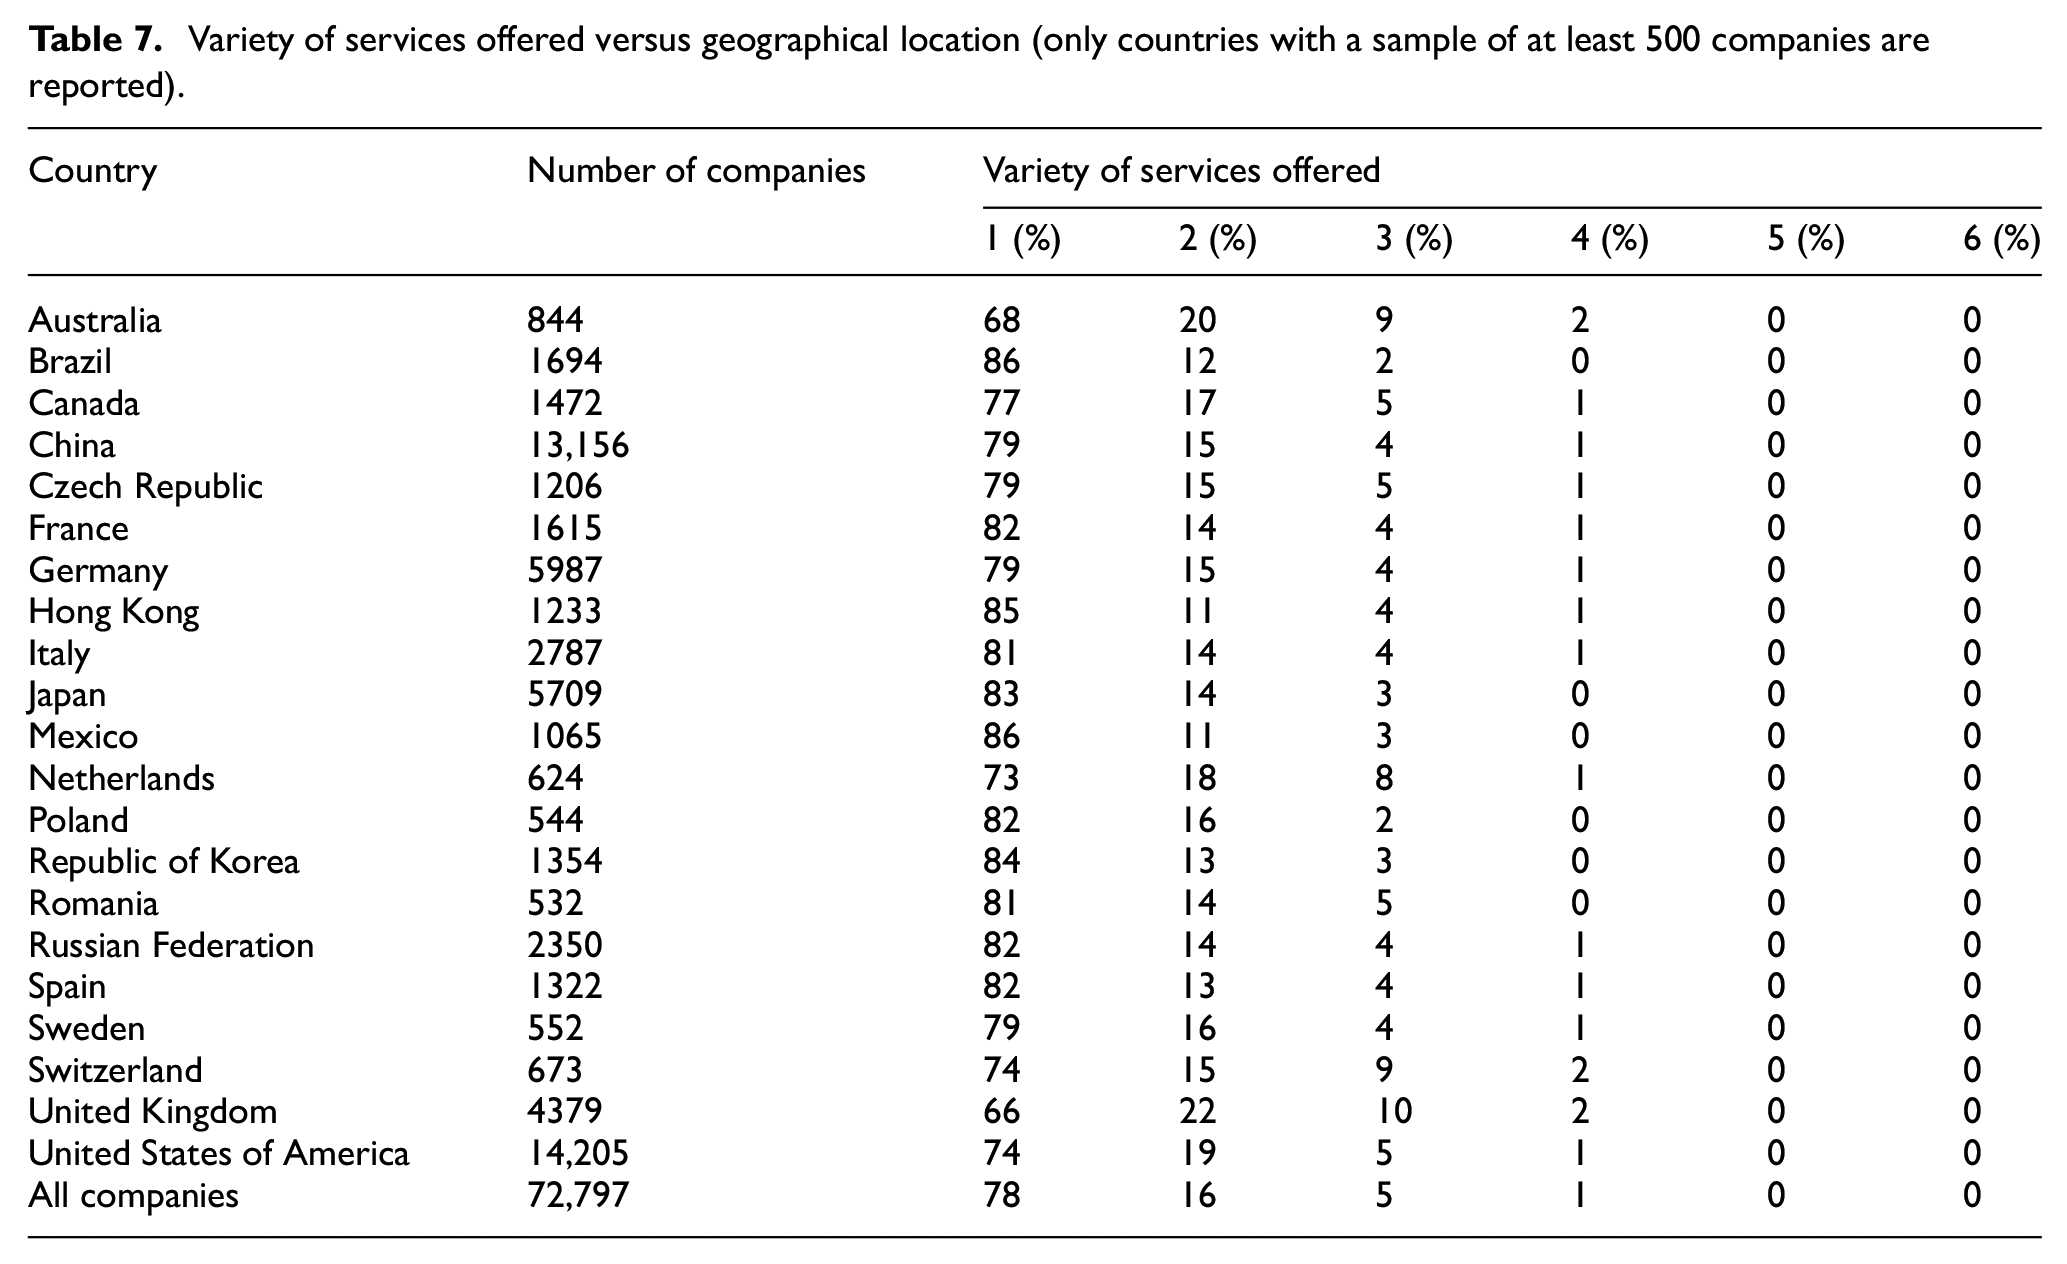
Also, in this case, the relation between variety of services offered and company location is evident from a qualitative analysis of the data. For example, the behaviour of manufacturing companies in the United Kingdom and Brazil seems to be radically different. This evidence is confirmed by the Pearson chi-square test. Data reported in Table 7 were used to test the two following hypotheses

The observed value is equal to 1215.9, with a p-value smaller than 10–5 (the observed value is checked against a chi-square distribution with a mean of
Finding 6: geographical location of manufacturing companies and variety of services offered are associated.
Table 8 shows composition of service portfolio depending on geographical location.
Composition of service portfolio versus geographical location (only countries with a sample of at least 500 companies are reported).
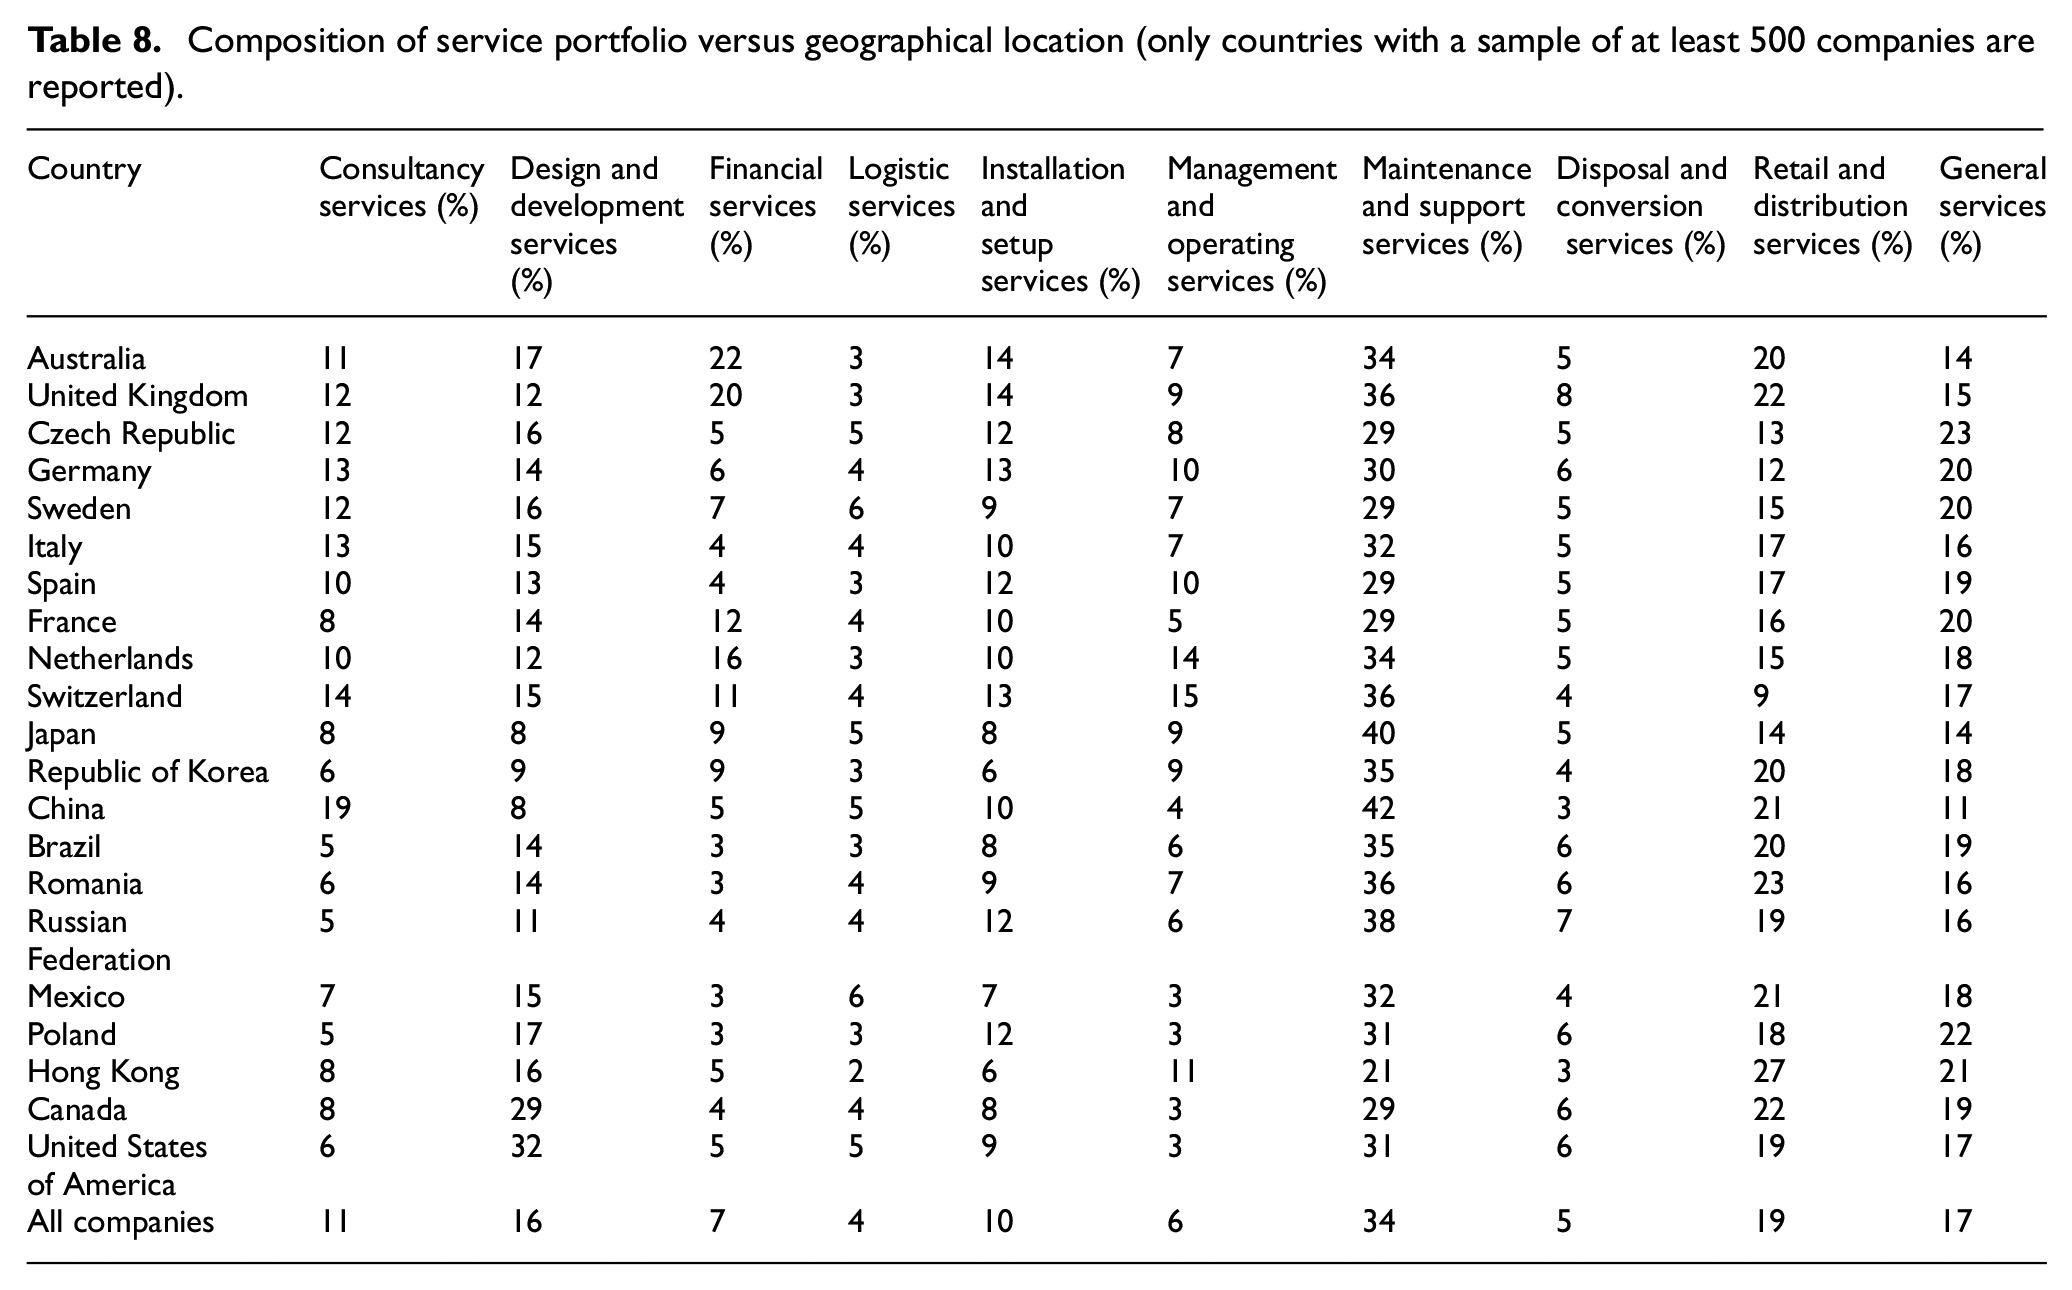
The geographical location of the company seems to be also related to composition of service portfolio. For instance, a significant difference can be noticed in the case of development services that are provided by 32% and 8% of US and Asian companies. Data reported in Table 8 were used to test the following hypotheses

The observed chi-square test statistic is equal to 9534.1, with df = 180. The chi-square distribution has a mean of df = 180, and a standard deviation of
Finding 7: geographical location and composition of service portfolio are associated
In order to deepen this last result, countries were also clustered on the basis of data in Table 8. If choosing a dissimilarity threshold equal to 0.66, five main clusters emerge from the analysis of the dendrogram representing the Euclidean distance between distribution related to the 21 countries considered (see Figure 4). Similarities can be identified between countries belonging to the identified clusters: (a) the first cluster contains Australia and United Kingdom only. A high percentage of manufacturing companies in these two countries tend to offer financial services (around 20%); (b) the second cluster includes European countries only; (c) the third cluster is composed of Japan and Republic of Korea, two of the major economic powers in Asia; (d) all countries composing the fourth cluster are categorized as emerging markets according to the International Monetary Fund; 41 (e) the fifth cluster is composed of North American countries (Canada and United States of America). China and Hong Kong have dissimilar behaviour with respect to the identified clusters.
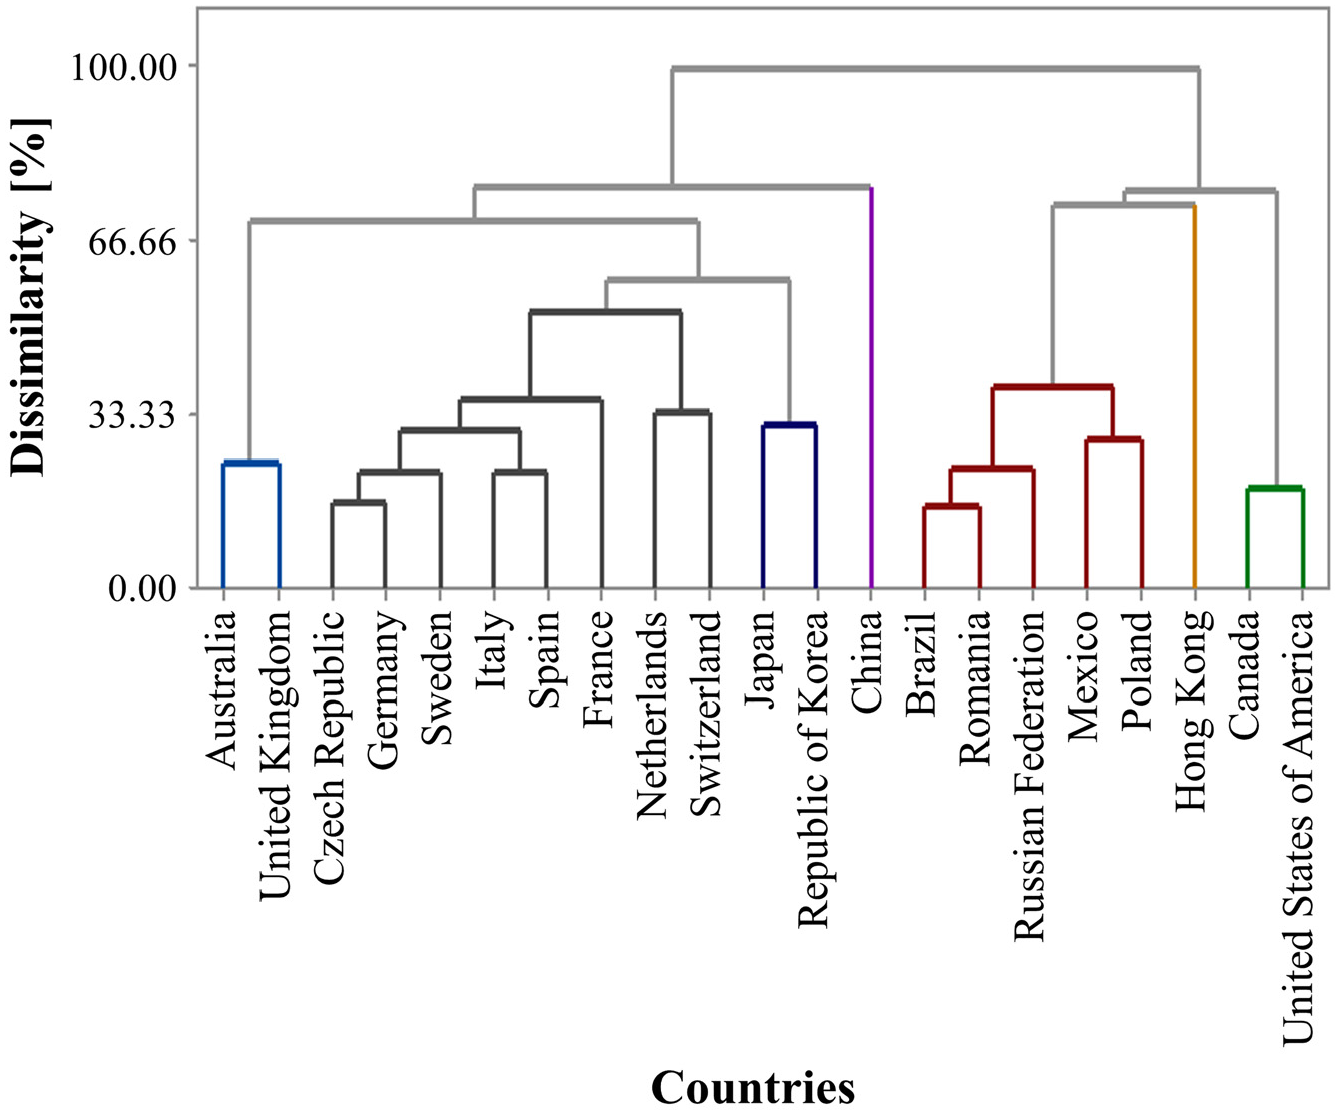
Dendrogram of the Euclidean distance between countries considering the composition of service portfolio.
The homogeneity of the results between countries with similarities in terms of culture, development or location may be seen as further evidence that the servitization process is also influenced by the geographical location of the company.
Company positioning
Data proposed in the previous sections show how structural factors affect servitization and specific tendencies in the assortment of provided services. Operatively, this analysis can be made more specific by focusing on a single company. Borrowing the concepts of cumulative distribution and its complementary function from descriptive statistics, this section proposes and exemplifies the use of two indicators to map the company in its competitive scenario.
A comparison is possible if considering a specific company and the set of reference companies. For this purpose, the following notation is introduced:
l is the number of service typologies delivered by the company in analysis;
Ai is the set of companies that exactly offer i typologies of service.
The first indicator is the higher servitization index (HSI), defined as the proportion of companies that provide a number of service typologies greater than l
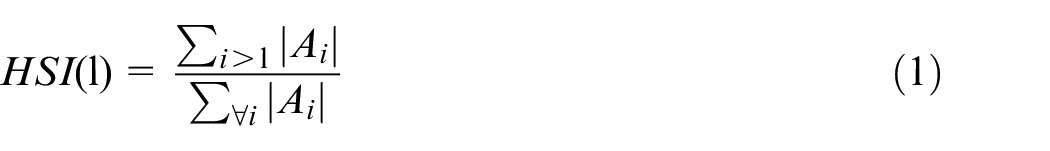
where the symbol ‘
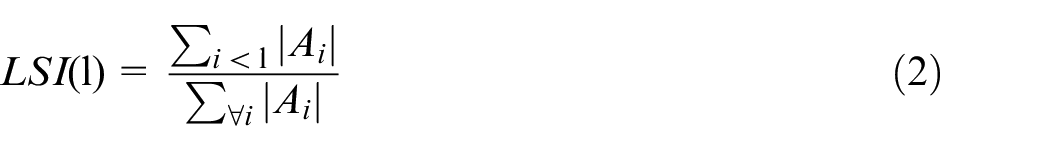
By definition, the two indicators are defined on the codomain
Different options are possible in the selection of the reference set to calculate these indicators: the commodity sector, companies in a specific country or geographic area, the specific subset of direct competitor companies and so on. If considering the first option, data provided in section ‘Empirical results’ could be useful.
The positioning of a company on the map depends on the service offering of the company and the relevant competitors. With reference to Figure 5, three different zones can be qualitatively identified on the map:
Zone A. Companies in this area belong to a sector in which many companies provide more service typologies and, conversely, few companies that offer a limited variety of service typologies. These companies can be said to be outside the general trend of the sector.
Zone B. Companies that plot in this area belong to a sector that is centralized on a single attitude of service supply. These companies are in the mainstream of the servitization process.
Zone C. Companies positioned in this zone can be distinguished by the higher offer of service typologies compared to the competitors.
To date, there is no general evidence of a direct relationship between the variety of provided service typologies and a company’s success, for example, in terms of revenues. Each company has its own specificity that should be adequately studied, for example (but not exclusively), by combining the aforementioned analysis of positioning with an indication regarding companies’ profitability, for example, in terms of return on investment (ROI). In this view, the proposed analysis constitutes a complementary element to be integrated into a comprehensive analysis.
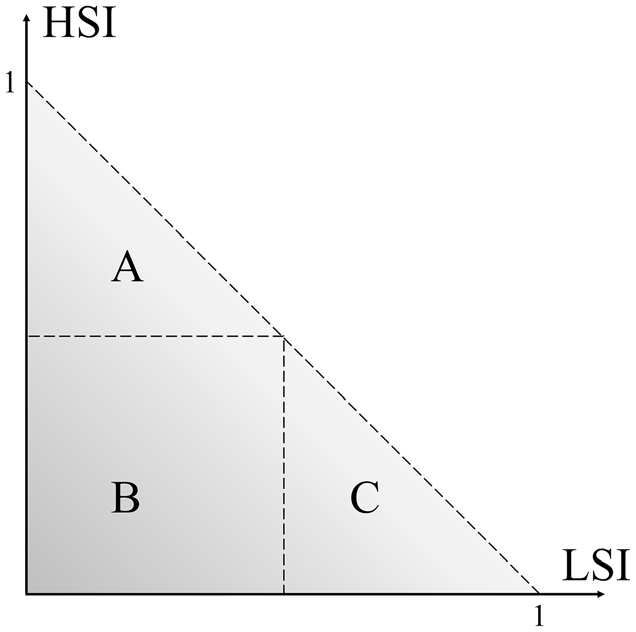
HSI versus LSI: a map for analysing the positioning of a company with respect to the relevant competitors.
Conclusion
The aim of this research was to quantitatively investigate the relationship between three structural factors and the servitization in manufacturing companies in terms of type and variety of offered services. The analysis of the service offering of a sample of 190,442 (of which 72,797 servitized) companies located in 124 countries showed that the servitization process is related to three structural factors: commodity sector, company dimension and geographical location. To the best of the authors’ knowledge, this study is one of the first empirical attempts to identify specific behaviours of different commodity sectors, company size and geographical location, in terms of variety and typologies of services offered. In this sense, a comprehensive and novel facet of the servitization phenomenon is provided.
The causes of the disparities between sectors are not herein considered neither investigated, and surely deserve further analysis for which the outcomes of this study can lay the foundations. Future developments of this study will deal with the identification of the main causes of the highlighted disparities.
Also, two indicators are introduced for the evaluation of the strategic positioning of a company within its competitive scenario. The authors believe these indicators would be useful to provide a quantitative view of a company’s positioning in the servitization journey so as to guide future strategies.
Footnotes
Appendix 1
Keyword list used for the segmentation among service typologies.
| Consultancy services |
Design and development services |
Financial services |
Logistic services |
Installation and setup services |
|---|---|---|---|---|
| consult | custom | financial | transportation | installation |
| consultancy | co-develop | leasing | trucking | implementation |
| consulting | personaliz* | hiring | consignment | procurement |
| planning | customiz* | hire | logistic | training |
| certification | personal design | financing | storage | test activities |
| personal develop | loans | |||
| custom-built | insurance | |||
| engineering services | ||||
| Management and operating services |
Maintenance and support services |
Disposal and conversion services |
Retail and distribution services |
General services |
| supervision | repair | demolition | retail | service |
| life-cycle management | maintenance | conversion | marketing | services |
| conduction | support | dismission | promotion | |
| manages and operates | servicing | recycling | store | |
| aftermarket | upgrades | |||
| spare part | modernization | |||
| technical service | ||||
| inspection | ||||
| optimization service | ||||
| restoration |
Symbol ‘*’ indicates any possible character(s). Being automated and dependent on the keyword choice, the authors are aware that lexicographical analysis can produce false results. For this reason, a manual post-processing refining of the result has been performed too.
Declaration of conflicting interests
The author(s) declared no potential conflicts of interest with respect to the research, authorship, and/or publication of this article.
Funding
The author(s) received no financial support for the research, authorship, and/or publication of this article.