Process quality is a crucial determinant of client satisfaction and affects a product’s value; therefore, maintaining quality control is a vital aspect of corporate sustainability and development. Many researchers have developed evaluation models for process quality. The majority of such research assumes that collected measurement data are precise, but fuzziness and stochastic uncertainty are unavoidable features of any collected data. When the measurements of a quality characteristic are insufficiently precise, a crisp-based approach is not suitable for the assessment of process quality. This study endeavored to use one-sided Six Sigma quality indices as measurement tools to accurately reflect process yield and quality levels. Taking Buckley’s approach into consideration, we extend the crisp estimators from the indices into fuzzy estimators. We then develop a fuzzy hypothesis testing method for one-sided Six Sigma quality indices, with the intent of increasing reliability of evaluation for process quality levels. Finally, we present a real-world case to illustrate implementation of the proposed approach, demonstrating its effectiveness and practical applicability.
As the global economy continues to develop, companies find themselves in an increasingly competitive environment, challenged by major shifts in their respective industries. Thus, quality control is an increasingly important component of competitiveness, especially for the manufacturing industry.1,2 Process quality not only affects a product’s value but is also a crucial determinant of client satisfaction. When Motorola was threatened by competition on the “process quality” front, it rolled out a Six Sigma campaign with the goal of improving its process quality, effectively lowering its product defect rate, and raising profitability.3,4 It is clear that as long as competition exists within an industry, quality control will remain a cornerstone of corporate sustainability and development.
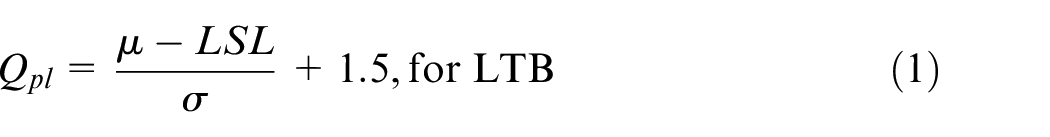
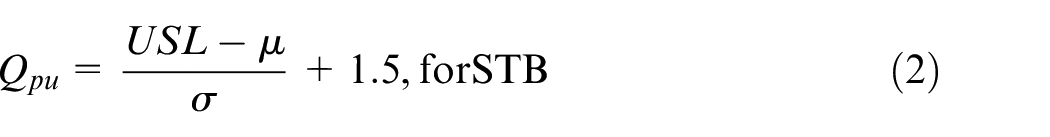
Motorola’s Six Sigma () reaches 3.4 defects per million opportunities (DPMO) when the process mean is allowed to shift by off process target .5–8 Wu et al.9 and Chen et al.10 indicate that a lower shift means lower expected loss. Given this, it is clear that reaching process quality level allows for a shift in the process mean. However, this is specifically for situations where the process quality characteristic is a nominal-the-best (NTB) type for two-sided specification tolerance and is not suitable for one-sided specification tolerance, that is, larger-the-better (LTB) or smaller-the-better (STB) characteristics. More specifically, when the quality characteristic is LTB, the target value T is theoretically infinitely large (); is thus virtually impossible. In the same vein, when the quality characteristic is STB, the target value T is theoretically zero. However, as process mean approaches zero, more advanced technologies and process expenses become necessary. Thus, is also virtually impossible. In light of this, with regard to STB or LTB quality characteristics for one-sided specification tolerance, the rules for process quality are defined as follows: if and if , where and are, respectively, the upper and lower specification limits.
Since the Six Sigma model is capable of effectively raising process quality, many statisticians and quality engineers have researched the correlation between process capability indices (PCIs) and Six Sigma quality levels and developed models for process quality evaluation.11–17 Based on the results of their investigations, Chen et al.10 came up with Six Sigma quality indices (SSQIs) and which are suitable for the evaluation of process quality with one-sided specification tolerance.
The recent rise in environmental awareness has led to proliferation of the concept of a circular economy, with increased corporate advocacy for waste reduction and the efficient leveraging of resources.18–20 A circular economy is not merely a system where resources are reused and recycled; rather, it is a system that can help companies realize environmental protection goals by fulfilling all four Rs of the 4R principle: reduce, reuse, recycle, and recover. Chen et al.21 stated that a rise in quality can reduce the proportion of process write-offs and reworking, and concurrently increase product life cycles, which in turn reduce the proportion of maintenance and resource inputs. This minimizes pollution and damage to the environment. The manufacturing industry aims to meet environmental demands by effectively raising process quality through sustainable production practices and circular economic strategies.
In summary, increasing process quality is not only a matter of corporate sustainability and competitiveness but also a gauge of whether a company is able to effectively reduce its waste and protect the environment. Thus, assessing process quality to improve product quality is a topic of immediate relevance for manufacturers. This study employs the one-sided SSQIs and as tools for evaluating process quality. In practice, population parameters and are usually unknown and need to be estimated based on randomly collected samples. Unfortunately, fuzziness and stochastic uncertainty are unavoidable features of collected data. Therefore, in order to lower measurement errors in the sample as well as errors in the estimated process parameters, this study adopts the approach proposed by Buckley22 and presents a set of confidence intervals producing a triangular-shaped fuzzy number for the estimation of one-sided SSQIs. This study further develops a method for fuzzy hypothesis testing for one-sided SSQIs.
Measuring process quality using confidence intervals for one-sided SSQIs reduces the risk of misjudgment caused by sampling error. In general, misjudgment risk in confidence intervals is influenced by sample size. The length of the confidence interval widens with decreases in sample size n, which increases the risk of misjudgment. Cost and time considerations mean that large sample sizes are rare. To overcome this limitation, the fuzzy hypothesis testing proposed in this study is based on statistical inference to judge process quality by expertise. In view of this, the proposed approach not only reduces the risk of misjudgment but also overcomes the issue of imprecise data.
The remainder of this article is organized as follows. Section “Fuzzy estimator for and ” presents the fuzzy estimator for one-sided SSQIs and its membership function. In section “Fuzzy hypothesis testing for and ,” the fuzzy hypothesis testing for one-sided SSQIs is developed based on Buckley’s estimation approach. In section “Application example,” we present a case to illustrate the applicability of the proposed approach. Conclusions are summarized in section “Conclusion.”
Literature review
PCIs and
A wide variety of methods exist for the evaluation of process quality. PCIs use numerical quantification to relate the mean and standard deviation to tolerance specifications. Thus, PCIs are widely applied to determine whether processes meet the required quality. For example, Chen et al.23 employed index and manufacturing time performance index to examine process performance and develop an outsourcing partner selection model, which helps companies select better contractors for long-term collaborations. Liao and Pearn24 modified the weighted standard deviation index to propose an adequate measure of lognormal process capability. Otsuka and Nagata25 proposed a novel approach to process capability which controls part dimensions based on product performance. Zhou et al.26 proposed a sensitivity analysis of process capability evaluation for small-batch production runs. Chang et al.27 developed a process quality analysis chart based on an accuracy index and a precision index, which analyzes process quality determined by multiple quality characteristics. Ouyang et al.28 used index to develop a process capability analysis chart, which effectively determines deficiencies in process capability.
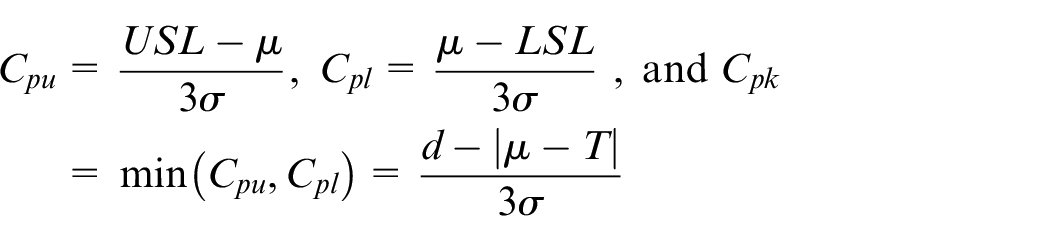
The most widely used PCIs for process performance and quality assessment are , , and , which were proposed by Kane.29 and are, respectively, used to assess process performance for STB and LTB quality characteristics, whereas is used to measure the process quality of NTB quality characteristics. As a result, and are also called unilateral specification indices, while is called the bilateral specification index. The three indices are defined as follows
where is the mean of a given process, is the process standard deviation, is half the width of the specification interval (i.e. ), and process target is the midpoint of the specification limits (i.e. ).
Inconvenience of PCI in determining the process quality level
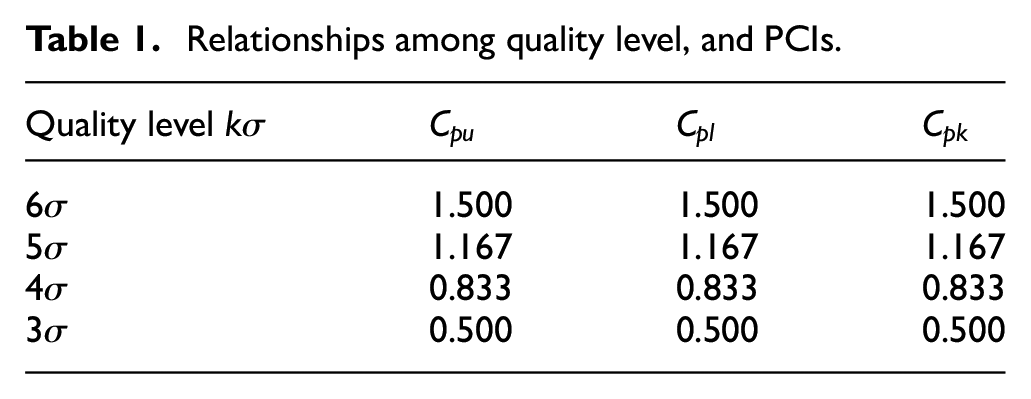
In the 1980s, the concept of Six Sigma quality control was pioneered by Motorola Inc. to serve as a tool for reducing production variance, eliminating defects, and improving quality.30 This process explicitly defines the quality goal of 3.4 DPMO, which is equivalent to a process yield of 99.99966%. Consequently, the Six Sigma model has been widely applied in various industries.8,31–35 For this model, the 3.4-DPMO objective can only be achieved when the maximum shift of from is . Chen et al.36 further indicated that process quality can only reach the Six Sigma level () when and . For this reason, Chen et al.11 discussed the relationships among various quality levels and the indices , , and when the process mean shifts (see Table 1).
Relationships among quality level, and PCIs.
Quality level
1.500
1.500
1.500
1.167
1.167
1.167
0.833
0.833
0.833
0.500
0.500
0.500
Many researchers have adopted the above relationships to determine whether process quality level meets requirements. However, since the value of (or , ) is not equal to the quality level reached, these researchers were only able to obtain a solution range and not the exact value of the quality level attained by the processes (see Table 1). This kind of result is inconvenient for decision-makers.
SSQIs and
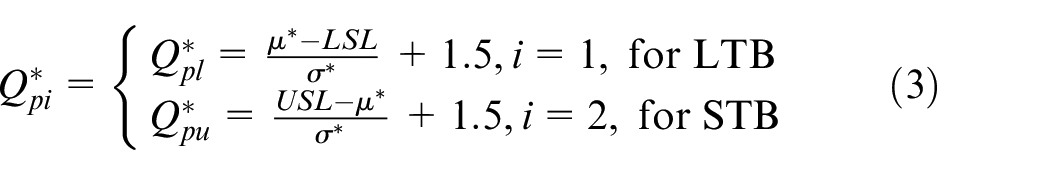
In order to eliminate the inconveniences posed by PCIs, Chen et al.10 proposed the SSQIs and to directly determine and analyze process quality level. Indices and are defined as follows
With regard to LTB characteristics, if and process quality requirements are , then and process yield is , where denotes the cumulative distribution function of the standard normal distribution. Similarly, for STB characteristics, if and process quality requirements are , then and process yield is . For this reason, Six Sigma indices and can precisely reflect process yield and quality level. In view of this, numerous researchers have used SSQIs to evaluate and analyze process quality.9,37–39
Fuzzy estimator for and
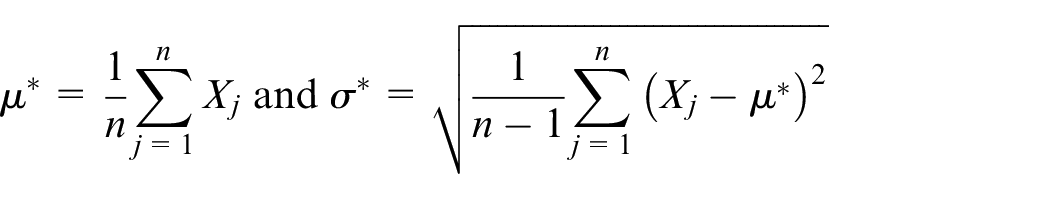
Collected data are often imprecise. Therefore, the values of related test statistics are also imprecise, which can lead to erroneous inferences. In order to assess process quality levels more accurately, this study adopts Buckley’s approach22 to present a set of confidence intervals, producing a triangular-shaped fuzzy number for the estimation of one-sided SSQIs. First, we assumed that the process of STB or LTB quality characteristic is distributed normally, that is, . Then, we let be a random sample, and denote the sample mean and the sample standard deviation, as follows
For one-sided Six Sigma quality index or , calculation of estimator can be based on random samples, as follows
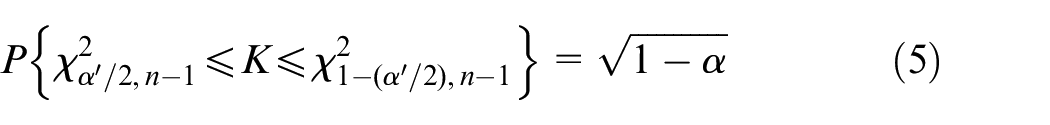
Furthermore, let and . Under the assumption of normality, follows a standard normal distribution (i.e. ) and follows a chi-square distribution with degrees of freedom (i.e. ). Therefore, we can derive the following
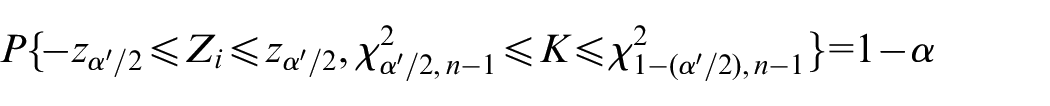
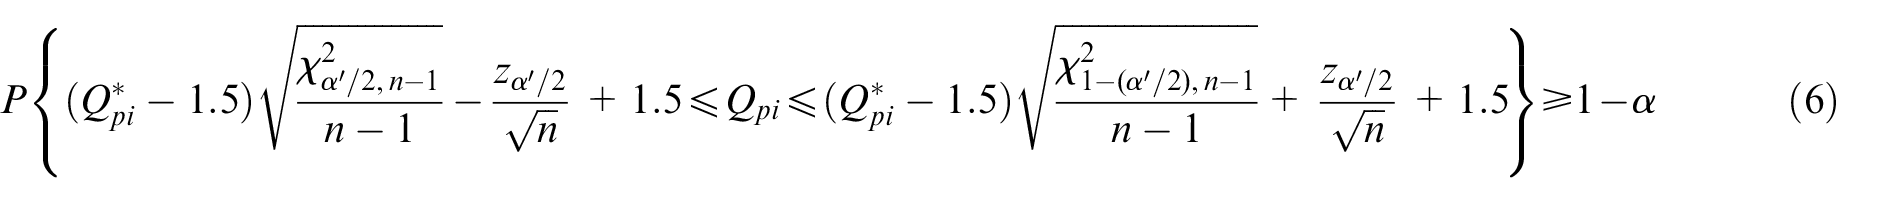
where is the upper quantile of , is the lower quantile of the chi-square distribution with degrees of freedom, , and represents the confidence level. Since and are mutually independent under the normality assumption, and are also mutually independent. From these relationships, we can further obtain the following
Equivalently,
Adopting Buckley’s approach,22 the of the triangular-shaped fuzzy number can be obtained as follows
where
When , then . Thus, the triangular-shaped fuzzy number of can further be expressed as follows
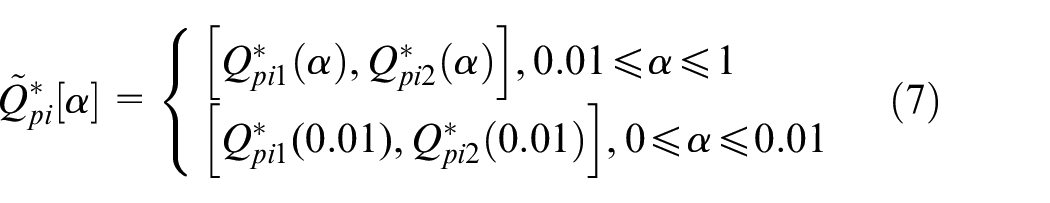
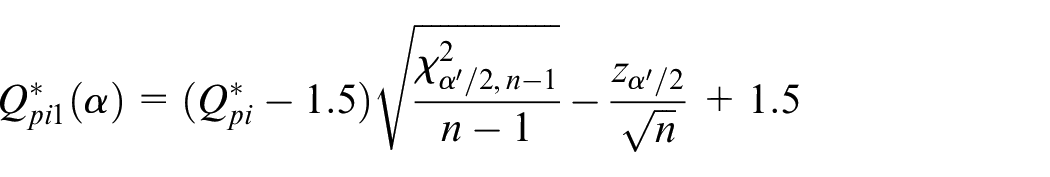
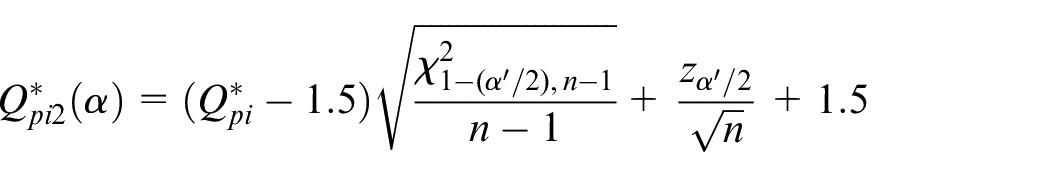
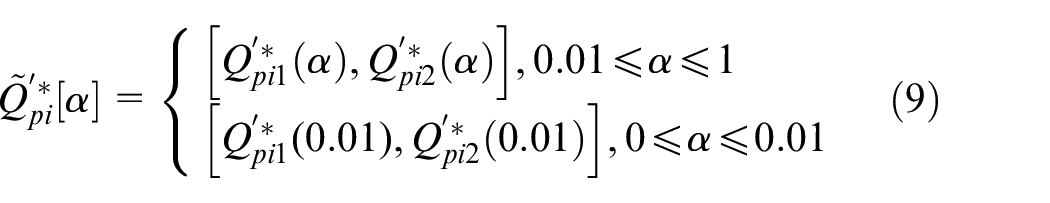
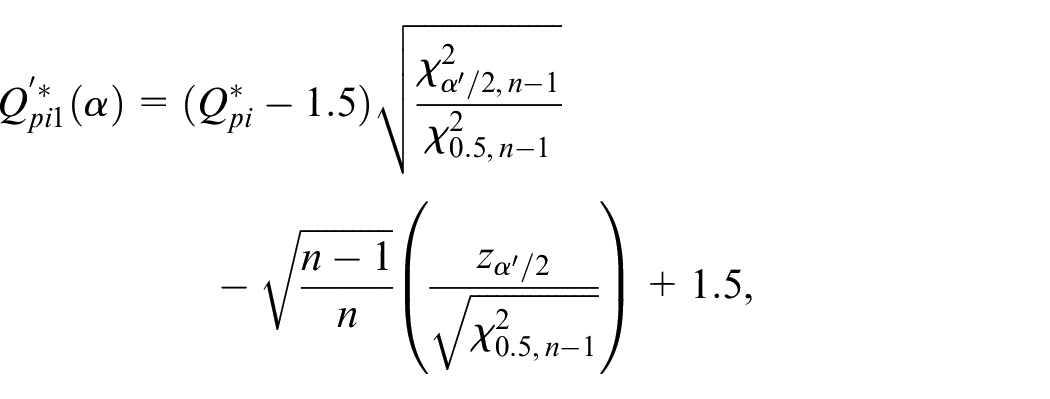
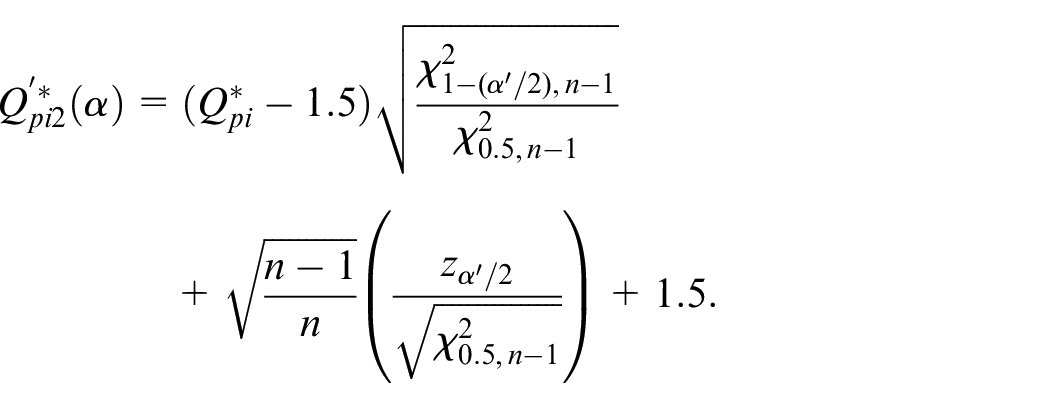
where , , and . It is worth noting that , so any evaluation of process quality will present considerable inconvenience for decision-makers. In view of this, to make the approach more practical, we convert the value of into based on transformation of a random variable, and let . Thus, the new transformation of the triangular-shaped fuzzy number can be expressed as follows
where
According to equation (9), it is easy to see when . Thus, the new transformation triangular-shaped fuzzy number of can further be expressed as follows
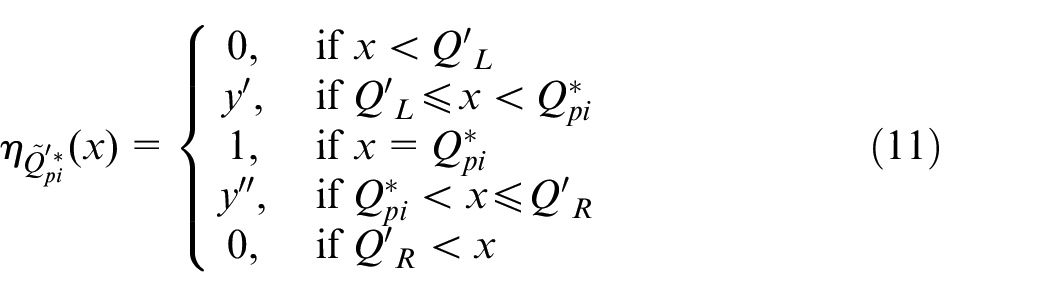
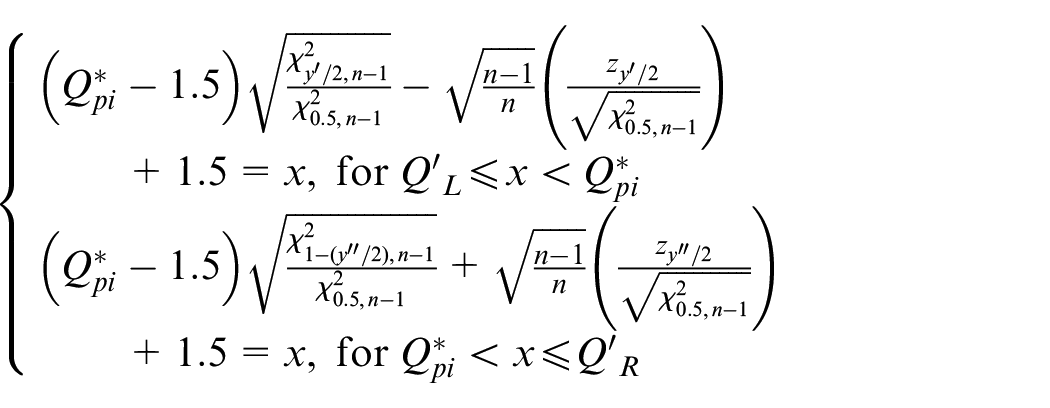
where , , and . Thus, the membership function of can be defined as follows
where and are determined by the following equation
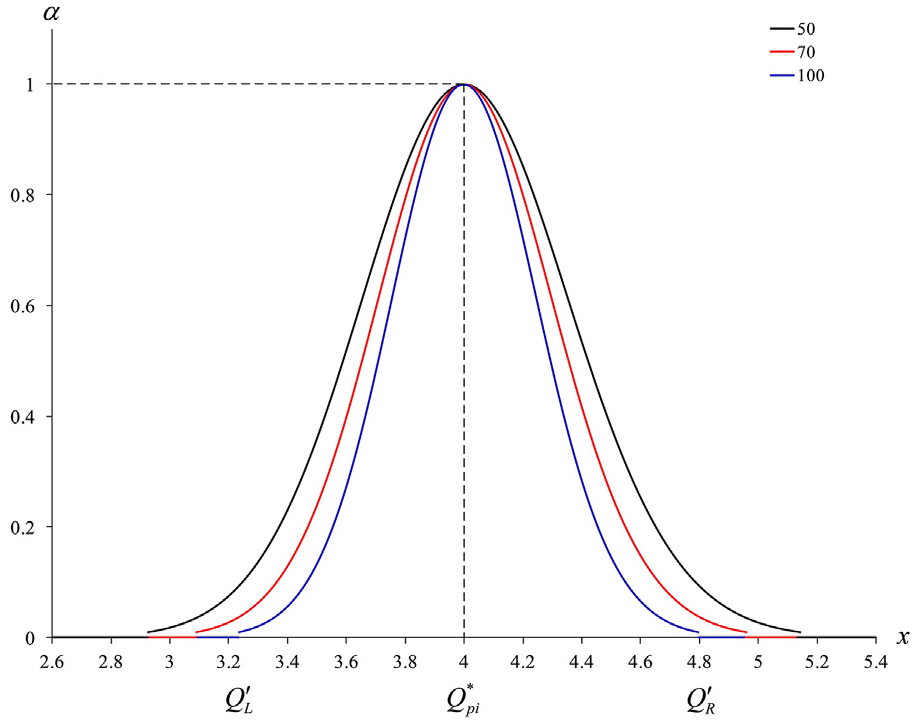
Figure 1 plots the membership function of fuzzy estimator with for , 70, and 100.
Membership function for fuzzy estimator with for , 70 and 100.
Fuzzy hypothesis testing for and
When customers specify the process quality level must meet the level, the index for quality characteristics must reach at least (i.e. ). In order to ensure a rigorous assessment of process quality, the statistical approach to hypothesis testing is an effective means of determining whether the quality level of a given process is acceptable. Thus, we develop the hypothesis testing model for , and statistical hypothesis testing can be expressed as follows
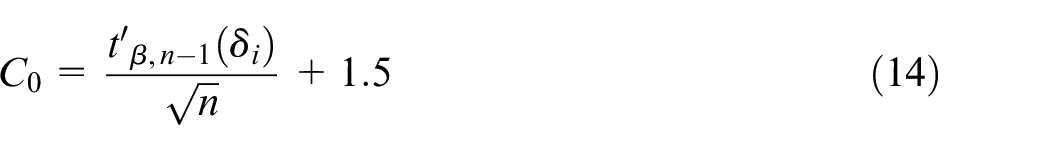
From the random sample, we could let be the test statistic and determine the critical region , where is the critical value. Thus, the decision rule for this one-tail test is to reject if and fail to reject otherwise. In view of this, when the significance level of the test is set to , which is typically set at 0.01, 0.05, or 0.1, then is determined by
Since follows a non-central t-distribution with a degree of freedom of , the non-centrality parameter of this distribution is , denoted as , . Thus, can be expressed as follows
where , and is the lower quantile of the non-central t-distribution with degrees of freedom. Thus, we can find the critical value to make a decision for hypothesis testing of . However, as mentioned in section “Fuzzy estimator for and ,” fuzziness and stochastic uncertainty are unavoidable features of collected data, and related test statistics will be imprecise, leading to erroneous inferences. Thus, we further developed fuzzy hypothesis testing for .
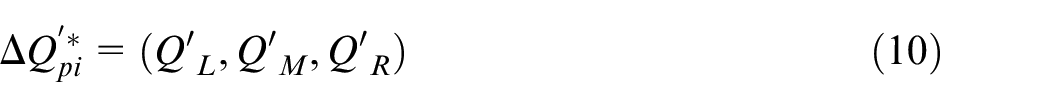
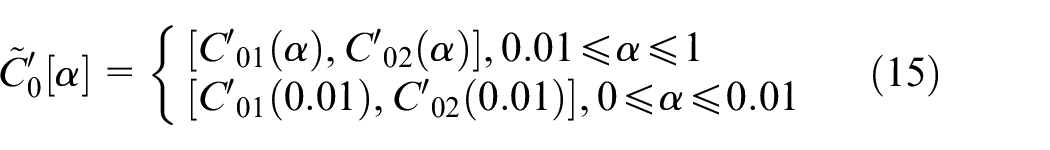
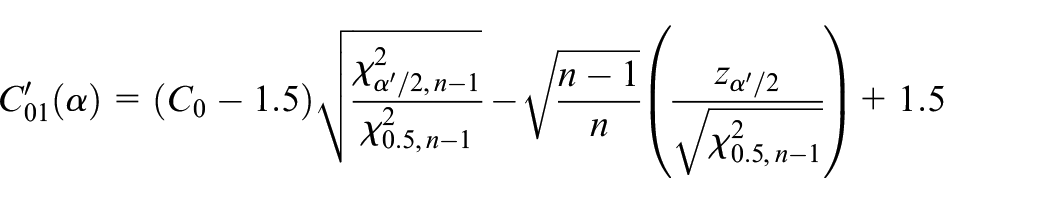
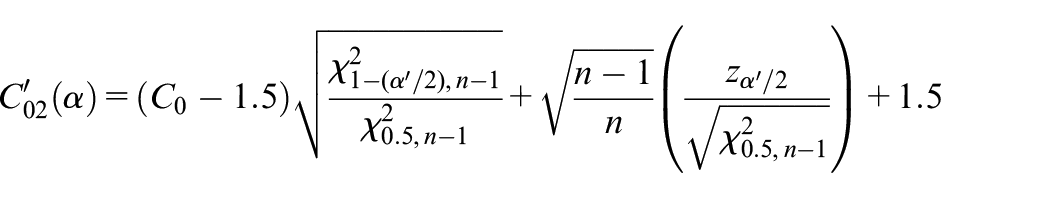
Similar to , the new transformation of the triangular-shaped fuzzy number for (i.e. ) can be re-expressed as follows
where
Clearly, . Thus, the new triangular-shaped fuzzy number of can be expressed as follows
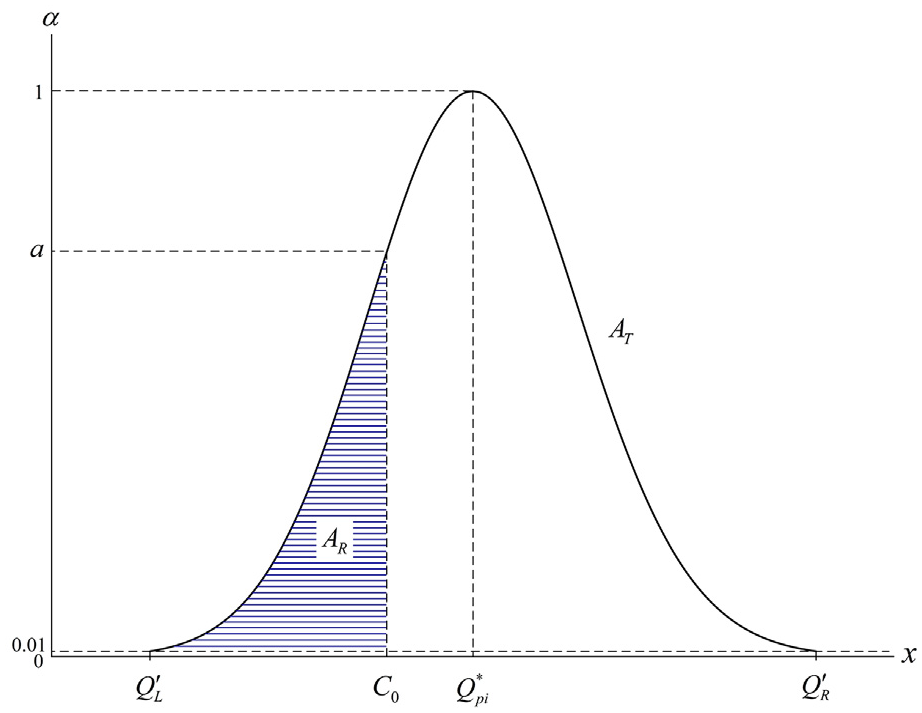
where and . Therefore, we have a fuzzy set for test statistic and a fuzzy set for the critical value . As mentioned above, the decision rule of hypothesis testing for is to reject if . However, the test statistic becomes a triangular-shaped fuzzy number based on the consideration of imprecise output data. Thus, the final decision rule of fuzzy hypothesis testing for will depend on the relationship between and . This is best understood through studying Figure 2. The vertex of is at .
Relationship of fuzzy estimator and in the final decision rule.
As seen in Figure 2, when , then . Let , thus can be expressed as follows
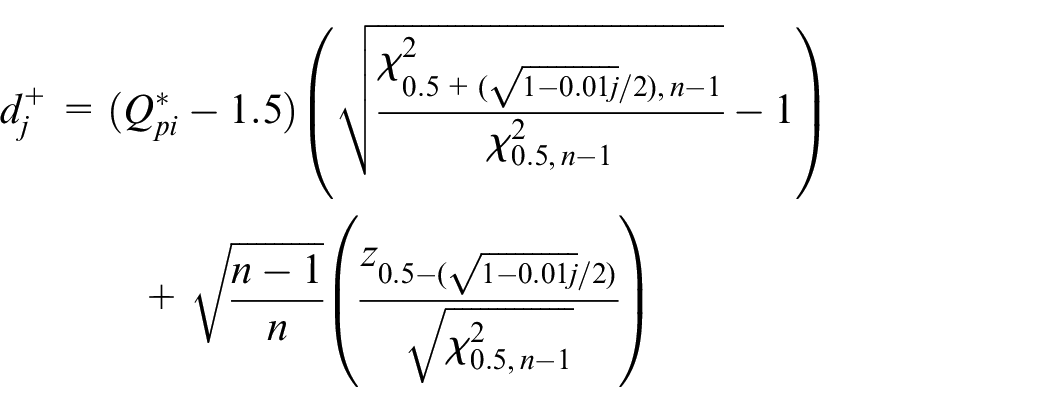
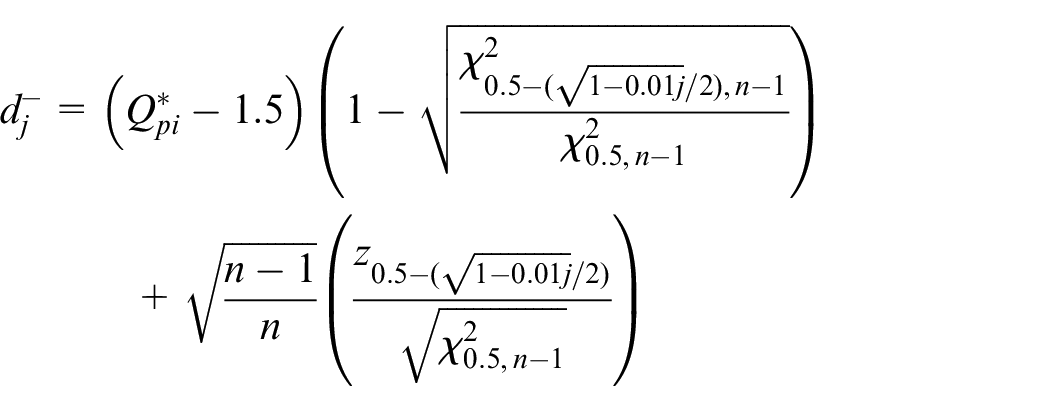
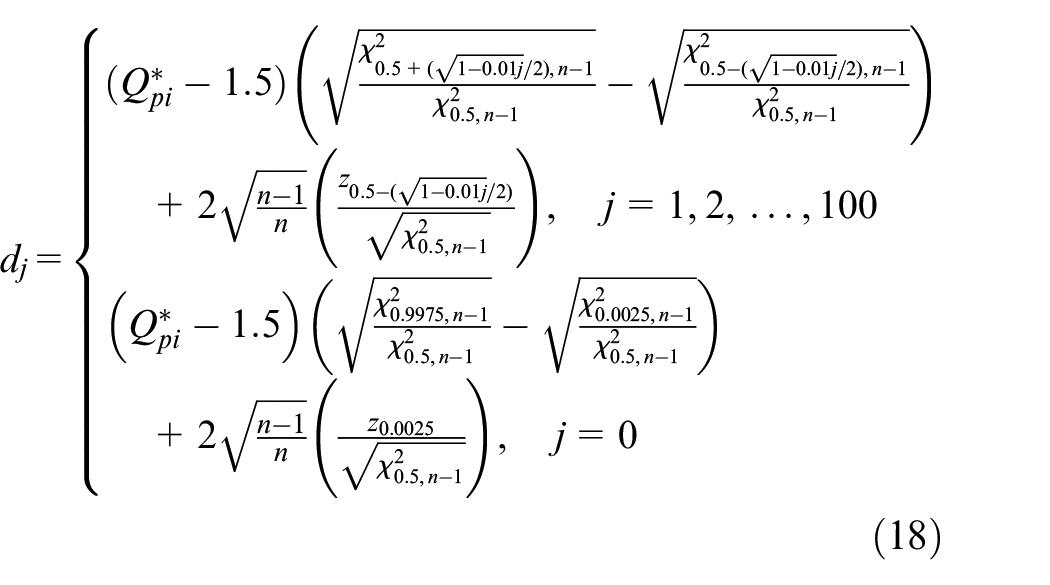
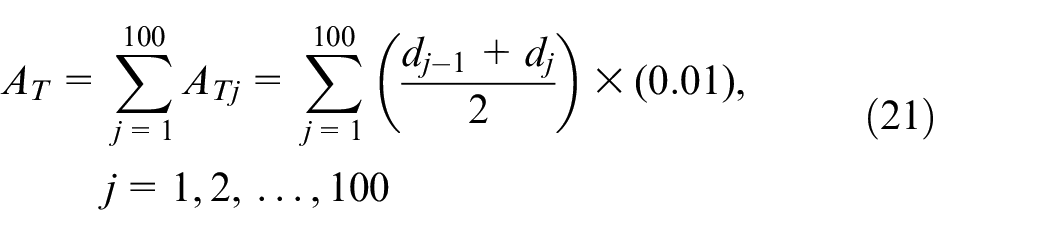
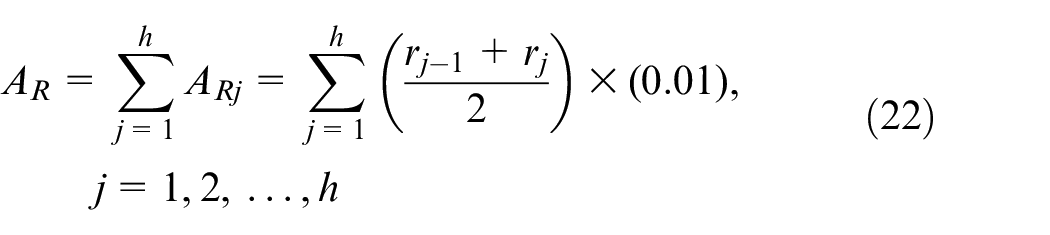
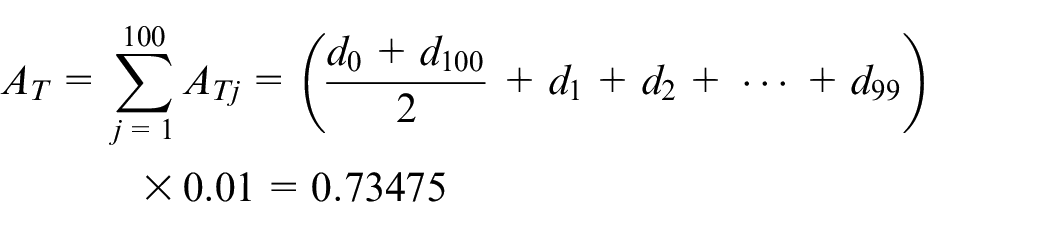
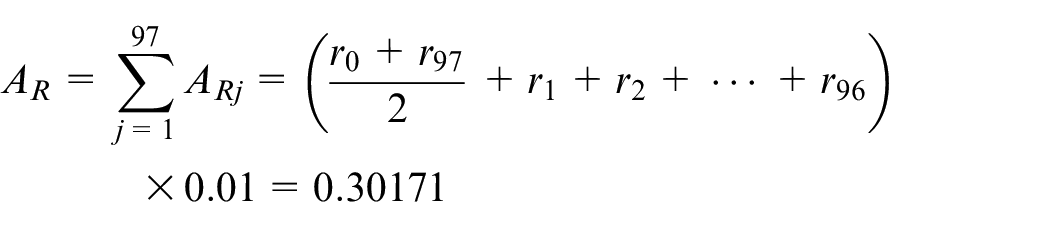
Buckley22 considered the ratio of two specific defined areas for testing with a triangular-shaped fuzzy number. In light of this, this study defines as the total area under the graph of and as the area under the graph of to the left of the vertical line through , where . Furthermore, Buckley22 chose two numbers , and the decision rules are as follows: (1) if , then reject ; (2) if , then there is no decision on whether to reject or not reject ; and (3) if , then do not reject . Since the complexity of sampling distributions for greatly hinders computation of and , we propose an approximate approach to computing and and making a final decision. First, let owing to , where is the greatest integer that is less than or equal to . Then, and . In the circumstances given above, and can be, respectively, expressed as follows
Thus, can be calculated as follows
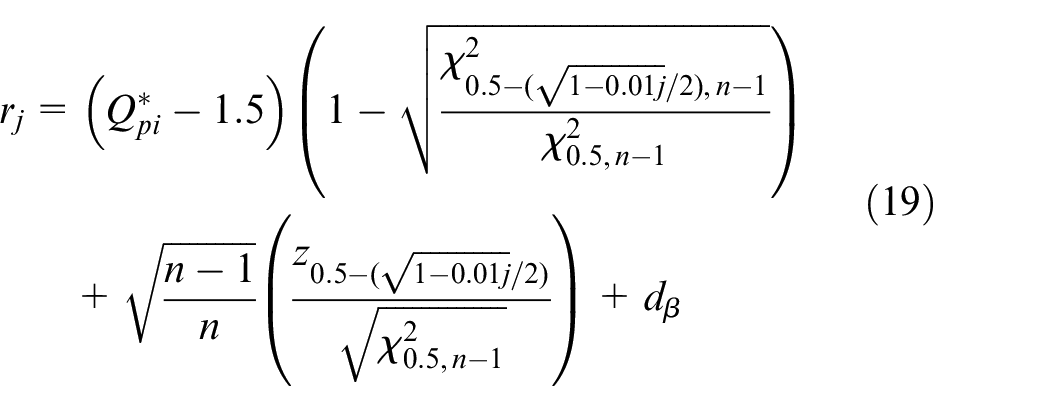
However, if we let , then . Obviously, can be expressed as follows
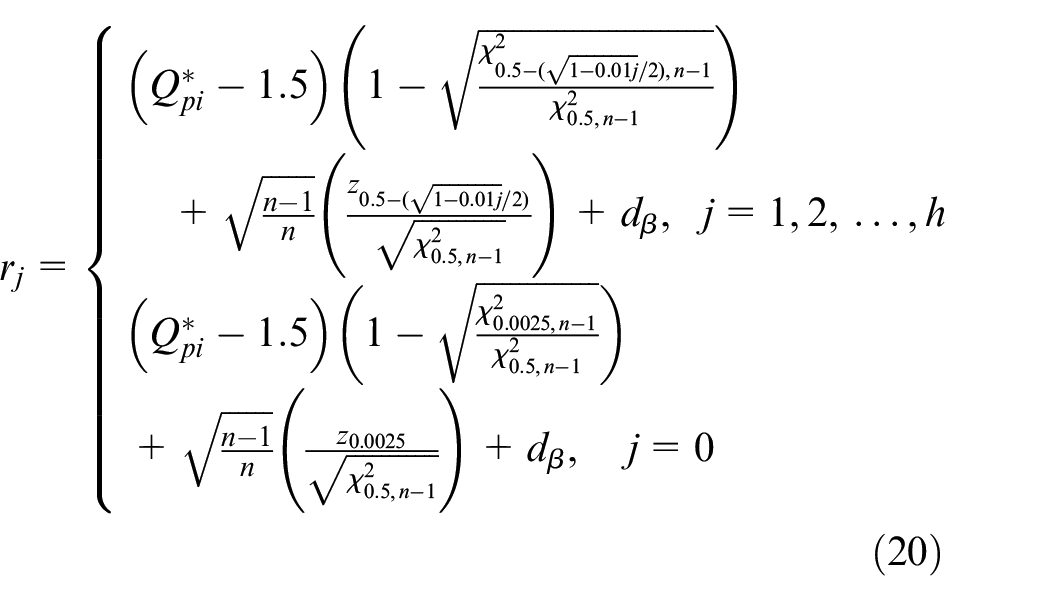
Thus, when , then . Similarly, let because of , that is, . Obviously, can be expressed as follows
As mentioned above, approximations of and can be obtained as follows
According to equations (21) and (22), we can calculate the ratio of to to make reliable decisions with our proposed fuzzy estimator . Thus, we choose two values and , such that , and the decision rules are as follows:
If , then do not reject . We can conclude that the process quality meets the level requirements.
If , then no decision on whether to reject or not reject . Obviously, it is not demonstrated that the process quality meets customer requirements.
If , then reject . Thus, we can conclude specifically that the process quality does not meet the specified level requirements.
Application example
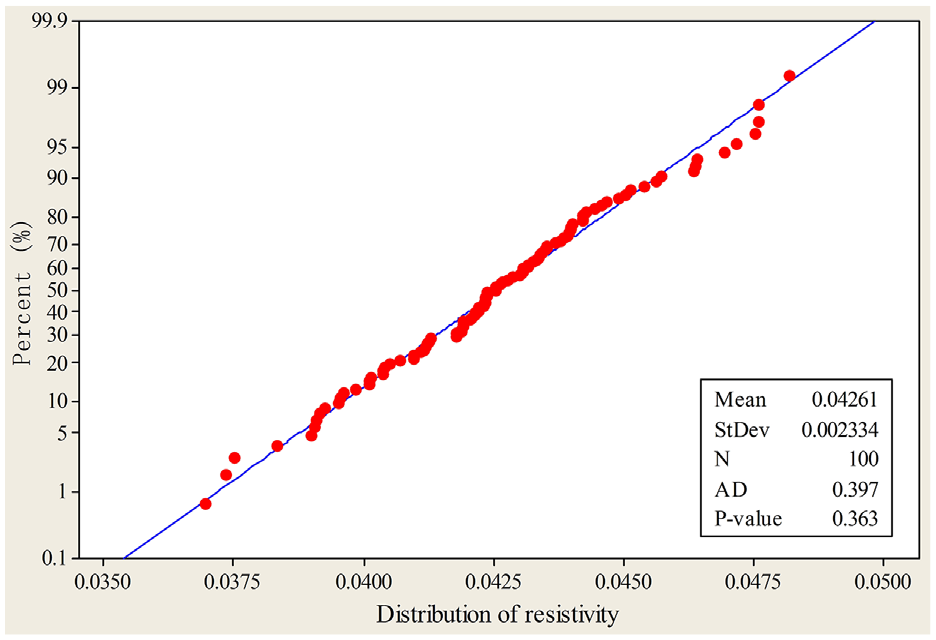
To demonstrate practical application of the proposed fuzzy hypothesis testing for one-sided SSQIs, we present a case study of indium tin oxide (ITO) film manufacturing. ITO film is one of the main components in touchscreen devices, useful because of its conductive electrode functions, high transmittance, and low resistivity. Thus, the quality of the product is vital, as defects will ultimately result in poorly functioning touchscreens. In the following demonstration, we focus on an STB quality characteristic: distribution of resistivity. The specification limit for distribution of resistivity is set as follows: . For a mass-produced ITO film product, a product engineer can collect data samples (100 measurements) at regular intervals from a stable process (i.e. in statistical control). Figure 3 presents the normal probability plot for the collected sample data. We further use the Anderson–Darling test to confirm the assumption of normality with . Therefore, it is reasonable to assume that the collected data are normally distributed.
Normal probability plot for the distribution of resistivity sample data.
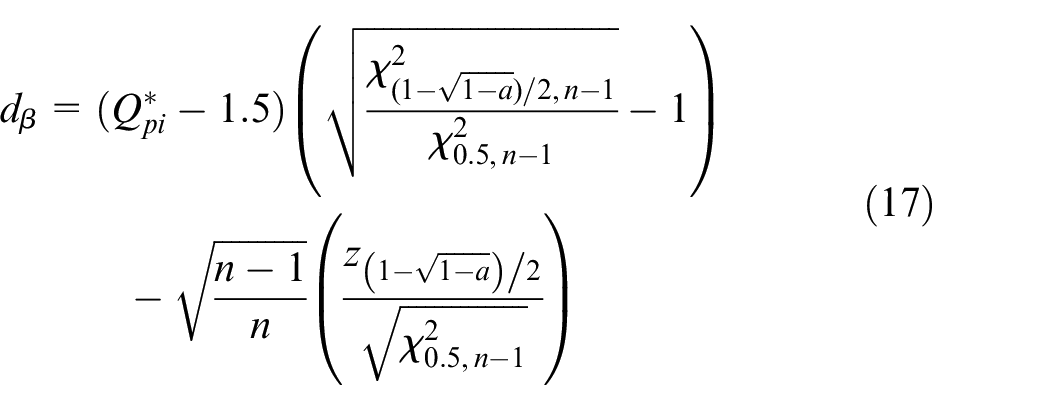
For these 100 measurements, we can calculate the sample mean and sample standard deviation . Thus, . The quality level of products must meet the level specified by the customer (i.e. ), and significance level was set to 0.05. Therefore, the critical value can be obtained according to equation (14). Due to , we do not reject based on the crisp estimate . However, fuzziness and stochastic uncertainty are unavoidable features of collected data. In view of this, we further undertake the fuzzy hypothesis testing for to make a more reliable decision.
First, we can obtain based on and . According to equation (17), we can further calculate , that is, . In view of this, and can be obtained from equations (18), (20), (21), and (22), as follows:
Thus, we can further calculate . When a decision-maker and engineer suggest the settings and , then can be found based on the judgment criterion. Clearly, this results in rejection of the null hypothesis; in this situation, there is sufficient evidence that quality characteristics do not meet customer requirements. Thus, the manager should adopt measures to improve process quality.
Conclusion
Past research on the evaluation of process quality primarily used precise measurement data to analyze and evaluate process quality. However, measurement errors can easily prevent clear quantization of characteristic values. Moreover, products could have unclear product characteristics or other unclear elements that cause uncertainties in evaluation. Thus, this study endeavored to develop a more reliable evaluation of process quality through fuzzy inference to assess process quality in situations involving imprecise sample data. This was accomplished using one-sided SSQIs . This study further presents a set of confidence intervals producing a triangular-shaped fuzzy number for based on Buckley’s estimation approach. Thus, one-sided SSQIs ’s crisp estimator was extended to fuzzy estimator , where and . Furthermore, when the test statistic is a fuzzy value, this study used the ratio of to (i.e. ) to perform fuzzy hypothesis testing for evaluation of process quality.
To illustrate the practical applicability of the proposed approach, we present an application example regarding distribution of resistivity for ITO film. In hypothesis testing with the crisp estimate , we do not reject null hypothesis because of . However, it is worth noting that is only 0.06118 higher than . To this end, we further investigated the triangular-shaped fuzzy number of under consideration of imprecise data and performed fuzzy hypothesis testing for . Our results show that the process quality did not meet the required level because (i.e. null hypothesis rejected ). For this reason, the proposed quality assessment method for imprecise process data in this study could effectively assist manufacturers in making more reliable decisions.
Footnotes
Acknowledgements
The authors would like to thank the Editor, P.G. Maropoulos, and anonymous referees for their helpful comments and careful reading, which significantly improved the presentation of this paper.
Authors’ note
The earlier version of this paper was presented at the 2018 Asia-Pacific International Symposium on Advanced Reliability and Maintenance Modeling (APARM) and 2018 International Conference on Quality, Reliability, Risk, Maintenance, and Safety Engineering (QR2MSE), 21–24 August, Qingdao, China. Kuen-Suan Chen is now affiliated to the Department of Business Administration, Chaoyang University of Technology, Taichung, Taiwan, R.O.C.
Declaration of conflicting interests
The author(s) declared no potential conflicts of interest with respect to the research, authorship, and/or publication of this article.
Funding
The author(s) received no financial support for the research, authorship, and/or publication of this article.
ORCID iD
Tsang-Chuan Chang
References
1.
SooSLAbdelhafeezAMLiM, et al. The drilling of carbon fibre composite–aluminium stacks and its effect on hole quality and integrity. Proc IMechE Part B: J Engineering Manufacture2019; 233(4): 1323–1331.
2.
ChenZHeYCuiJ, et al. Product reliability–oriented optimization design of time-between-events control chart system for high-quality manufacturing processes. Proc IMechE Part B: J Engineering Manufacture2019; 234: 549–558.
3.
HoskinJStuartBTaylorJ.A Motorola commitment: a Six Sigma mandate. In: The Motorola guide to statistical process control for continuous improvement towards Six Sigma quality. Phoenix, AZ: Motorola, 1988.
4.
NogueraJNielsenT.Implement six sigma for interconnect technology. ASQC Qual Congress Trans1992; 46: 538–544.
5.
BreyfogleFWCupelloJMMeadowsB.Managing Six Sigma: a practical guide to understanding, assessing, and implementing the strategy that yields bottom-line success. New York: Wiley, 2001.
6.
MontgomeryDC.Introduction to statistical quality control. 4th ed.New York: Wiley, 2001.
7.
LindermanKSchroederRGZaheerS, et al. Six Sigma: a goal-theoretic perspective. J Oper Manag2003; 21(2): 193–203.
8.
MahatoSRai DixitAAgrawalR.Application of Lean Six Sigma for cost-optimised solution of a field quality problem: a case study. Proc IMechE Part B: J Engineering Manufacture2017; 231(4): 713–729.
9.
WuMFChenHYChangTC, et al. Quality evaluation of internal cylindrical grinding process with multiple quality characteristics for gear products. Int J Prod Res2019; 57: 6687–6701.
10.
ChenKSChenHTChangTC.The construction and application of Six Sigma quality indices. Int J Prod Res2017; 55(8): 2365–2384.
11.
ChenKSOuyangLYHsuCH, et al. The communion bridge to Six Sigma and process capability indices. Qual Quant2009; 43(3): 463–469.
12.
HuangCFChenKSSheuSH, et al. Enhancement of axle bearing quality in sewing machines using Six Sigma. Proc IMechE Part B: J Engineering Manufacture2010; 224(10): 1581–1590.
13.
WangCCChenKSWangCH, et al. Application of 6-Sigma design system to developing an improvement model for multi-process multi-characteristic product quality. Proc IMechE Part B: J Engineering Manufacture2011; 225(7): 1205–1216.
14.
OuyangLYChenKSYangCM, et al. Using a QCAC-entropy-TOPSIS approach to measure quality characteristics and rank improvement priorities for all substandard quality characteristics. Int J Prod Res2014; 52(10): 3110–3124.
15.
ChangTCWangKJChenKS.Sputtering process assessment of ITO film for multiple quality characteristics with one-sided and two-sided specifications. J Test Eval2014; 42(1): 196–203.
16.
YuKTChenKS.Testing and analysing capability performance for products with multiple characteristics. Int J Prod Res2016; 54(21): 6633–6643.
17.
ChenKSHuangCFChangTC.A mathematical programming model for constructing the confidence interval of process capability index Cpm in evaluating process performance: an example of five-way pipe. J Chin Inst Eng2017; 40(2): 126–133.
18.
KorhonenJHonkasaloASeppäläJ.Circular economy: the concept and its limitations. Ecol Econ2018; 143: 37–46.
19.
BlomsmaFBrennanG.The emergence of circular economy: a new framing around prolonging resource productivity. J Ind Ecol2017; 21(3): 603–614.
20.
LewandowskiM.Designing the business models for circular economy-towards the conceptual framework. Sustainability2016; 8(1): 1–28.
21.
ChenKSWangCHTanKH.Developing a fuzzy green supplier selection model using Six Sigma quality indices. Int J Prod Econ2019; 212: 1–7.
ChenKSChangTCLinYT.Developing an outsourcing partner selection model for process with two-sided specification using capability index and manufacturing time performance index. Int J Reliab Qual Saf Eng2019; 26(3): 1950015.
24.
LiaoMYPearnWL.Modified weighted standard deviation index for adequately interpreting a supplier’s lognormal process capability. Proc IMechE Part B: J Engineering Manufacture2019; 233(3): 999–1008.
25.
OtsukaANagataF.Quality design method using process capability index based on Monte-Carlo method and real-coded genetic algorithm. Int J Prod Econ2018; 204: 358–364.
26.
ZhouXJiangPWangY.Sensitivity analysis-based dynamic process capability evaluation for small batch production runs. Proc IMechE Part B: J Engineering Manufacture2016; 230(10): 1855–1869.
27.
ChangTCWangKJChenKS.Capability performance analysis for processes with multiple characteristics using accuracy and precision. Proc IMechE Part B: J Engineering Manufacture2014; 228(5): 766–776.
28.
OuyangLYHsuCHYangCM.A new process capability analysis chart approach on the chip resistor quality management. Proc IMechE Part B: J Engineering Manufacture2013; 227(7): 1075–1082.
29.
KaneVE.Process capability indices. J Qual Technol1986; 18(1): 41–52.
30.
SchroederRGLindermanKLiedtkeC, et al. Six Sigma: definition and underlying theory. J Oper Manag2008; 26(4): 536–554.
31.
SunderMVKunnathNR.Six Sigma to reduce claims processing errors in a healthcare payer firm. Production Planning and Control. Epub ahead of print 11 August 2019. DOI: 10.1080/09537287.2019.1652857.
32.
YadavGSethDDesaiTN.Application of hybrid framework to facilitate lean Six Sigma implementation: a manufacturing company case experience. Prod Plan Control2018; 29(3): 185–201.
33.
Ben RomdhaneTBadreddineASansaM. A new model to implement Six Sigma in small- and medium-sized enterprises. Int J Prod Res2017; 55(15): 4319–4340.
34.
CherrafiAElfezaziSGovindanK, et al. A framework for the integration of Green and Lean Six Sigma for superior sustainability performance. Int J Prod Res2017; 55(15): 4481–4515.
35.
HuangCTChenKSChangTC.An application of DMADV methodology for increasing the yield rate of surveillance cameras. Microelectron Reliab2010; 50(2): 266–272.
ChangTCChenKS.Testing process quality of wire bonding with multiple gold wires from the viewpoint of producers. Int J Prod Res2019; 57(17): 5400–5413.
38.
YangCMChenKSHsuCH.Developing a multi-quality characteristic analysis model to measure the quality of quick-release bicycle hubs. J Chin Inst Eng2019; 42(4): 309–318.
39.
YangCMChenKS.Two-phase selection framework that considers production costs of suppliers and quality requirements of buyers. Int J Prod Res2019; 57(20): 6351–6368.