
Abstract
Previous work on vibratory finishing has led to a better understanding and establishment of the mass finishing processes. Despite the sustained efforts made to date, vibratory finishing remains a field where the findings made have been based largely on empirical evidence. Through force sensor analyses and scanning electron microscopy imaging, in this work a successful attempt has been made in uncovering the underlying science—through first principles of Newtonian physics—behind vibratory finishing, providing explanations for the observations made. Trials were carried out in a high-frequency vibratory bowl, the first of its kind in the vibratory finishing industry. Through these trials, mathematical formulations have been derived, essentially providing a reliable way for the industry to estimate the process cycle time.
Introduction
Vibratory finishing is widely used in surface engineering processes. Mediratta et al. 1 describe vibratory finishing as a process in which the workpiece and abrasive particles are in constant agitation. Consequently, process cycle times are considerably shorter than similar mass finishing alternatives while its open tub configuration allows for quick part inspection. It is a vital process for the aerospace industry where very fine surface finishing is necessary for excellent engine performance. Sambharia and Mali 2 reported the significance of abrasive flow finishing processes as they are widely used in the aerospace industry. Bai et al. 3 observed a drastic improvement in stage efficiency by 7%–14% as smooth blades were used in place of rough blades with sand grain roughness. Picard 4 describes that very fine surface finishing between 0.1 and 0.2 μm can be obtained in the presence of a fine medium.
Conventional vibratory finishing machines operate within the frequency range of 15–50 Hz, with a corresponding range of vibrational amplitude from 2 to 10 mm. For aerospace manufacturers, there is a strong incentive for shorter process cycle times which contribute to a shorter turnaround time. In response to demands for shorter process cycle times, an upcoming trend is the use of a higher operating frequency to achieve the desired surface profile. Rawlinson 5 attributed shorter process cycle times to the high frequency and high amplitude of vibration by the vibratory bowl. This is due to the increased speed of the medium and its enhanced rotational motion. Hammond Roto-Finish 6 established that low amplitude and high frequency contributes to a shortened process cycle time. Both researchers concluded that a higher operating frequency would result in a shorter process time. Pandiyan et al. 7 conducted experiments in a one-dimensional (1D) high-frequency shaker, with a maximum operating frequency of 100 Hz. It was concluded that high amplitude and high frequency were key factors in the shortening of process cycle time. However, the investigation was limited to a 1D approach with limited use of medium configurations.
Mechanical fixtures are increasingly being deployed to improve the performance of vibratory finishing. Workpieces are held in place, allowing for a greater relative velocity difference between the medium flow and the stationary workpiece. Sangid et al. 8 conducted their trials in the presence of a mechanical fixture to allow for greater contact forces on the workpiece. Uhlmann et al. 9 explored the possibility of using a robotic arm to hold the workpiece in place, similar to the use of a mechanical fixture. Wang et al. 10 describe that a well-designed mechanical fixture increases the contact forces between the medium and the workpiece. This contributes to a more effective medium–workpiece interaction and higher material removal rates.
Hashimoto and DeBra 11 developed mathematical models to predict the rate of material removal and eventual surface roughness for their trials on carburized steel cylinders at 21 Hz. Three fundamental rules were established from the experimental data. First, the material will eventually approach a roughness limitation. Second, as the surface roughness of the workpiece approaches the roughness limitation, its roughness will decrease more gradually. Finally, there will be a constant rate of material removal as the workpiece approaches the roughness limitation. Similarly, Wan et al. 12 suggested that the experiment will eventually approach a state of saturation due to the simultaneous removal of asperities and deepening of valleys.
Greater efforts are necessary to establish the significance of high-frequency vibratory finishing on process cycle time. Since Hashimoto’s trials were only conducted at an operating frequency of 21 Hz, there remains a need to explore the effects of high-frequency vibratory finishing on the workpiece. Literature study of the experiments sheds little light on the type of vibratory finishing equipment which were used for the study. Previous works studied the phenomena in a vibratory trough system. Ahluwalia et al. 13 conducted fixtured and non-fixtured trials in a vibratory trough. However, the effects of imparting finishing effects with the aid of high-frequency vibrations in a bowl system remain arcane.
The aim of this study is to investigate the effect of high-frequency vibrations on the material removal rate as the surface roughness of the workpiece approaches the roughness limitation. Misra et al. 14 devised a model of finishing force and torque in an abrasive finishing process. In the same light, the authors would propose a minimum surface roughness concept using the rule-based modeling approach.
Experimental methodology
Aluminum alloy is widely employed for the construction of aircraft wings and fuselage due to its high tensile and yield strength. Experimental investigations have been orchestrated on flat Al-6061 test coupons with edge lengths of 50 mm and thicknesses of 10 mm. Each test coupon was subjected to glass bead peening such that the initial surface roughness was within the range of 1.5–1.7 µm, similar to the surface roughness of typical aerospace components. Furthermore, the hardness of workpieces was measured to be 60 on Rockwell B scale.
A custom-made circular vibratory bowl having a diameter of 1000 mm and a dumping height of 250 mm with an operating range of 25–75 Hz and a usable capacity of 111 L was used. Figure 1(a) depicts the setup where 225 kg of plastic conical medium was used. Media of varying dimensions—12, 16, and 19 mm in diameter and height—were used throughout the trials as shown in Figure 1(b). An alkaline liquid compound—commonly used in surface finishing processes—provided lubrication at a flow rate of 60 mL/min. Direction of flow of the medium was kept constant in the anti-clockwise direction, as shown in Figure 1(c). The test pieces were secured to the vibratory finishing machine using a mechanical fixture and inserted to a depth of 10 cm (measured from the surface of the medium). The direction of the medium feed was parallel to the test piece, as depicted in Figure 1(c). The mechanical fixture and aluminum test piece are presented in Figure 1(d).
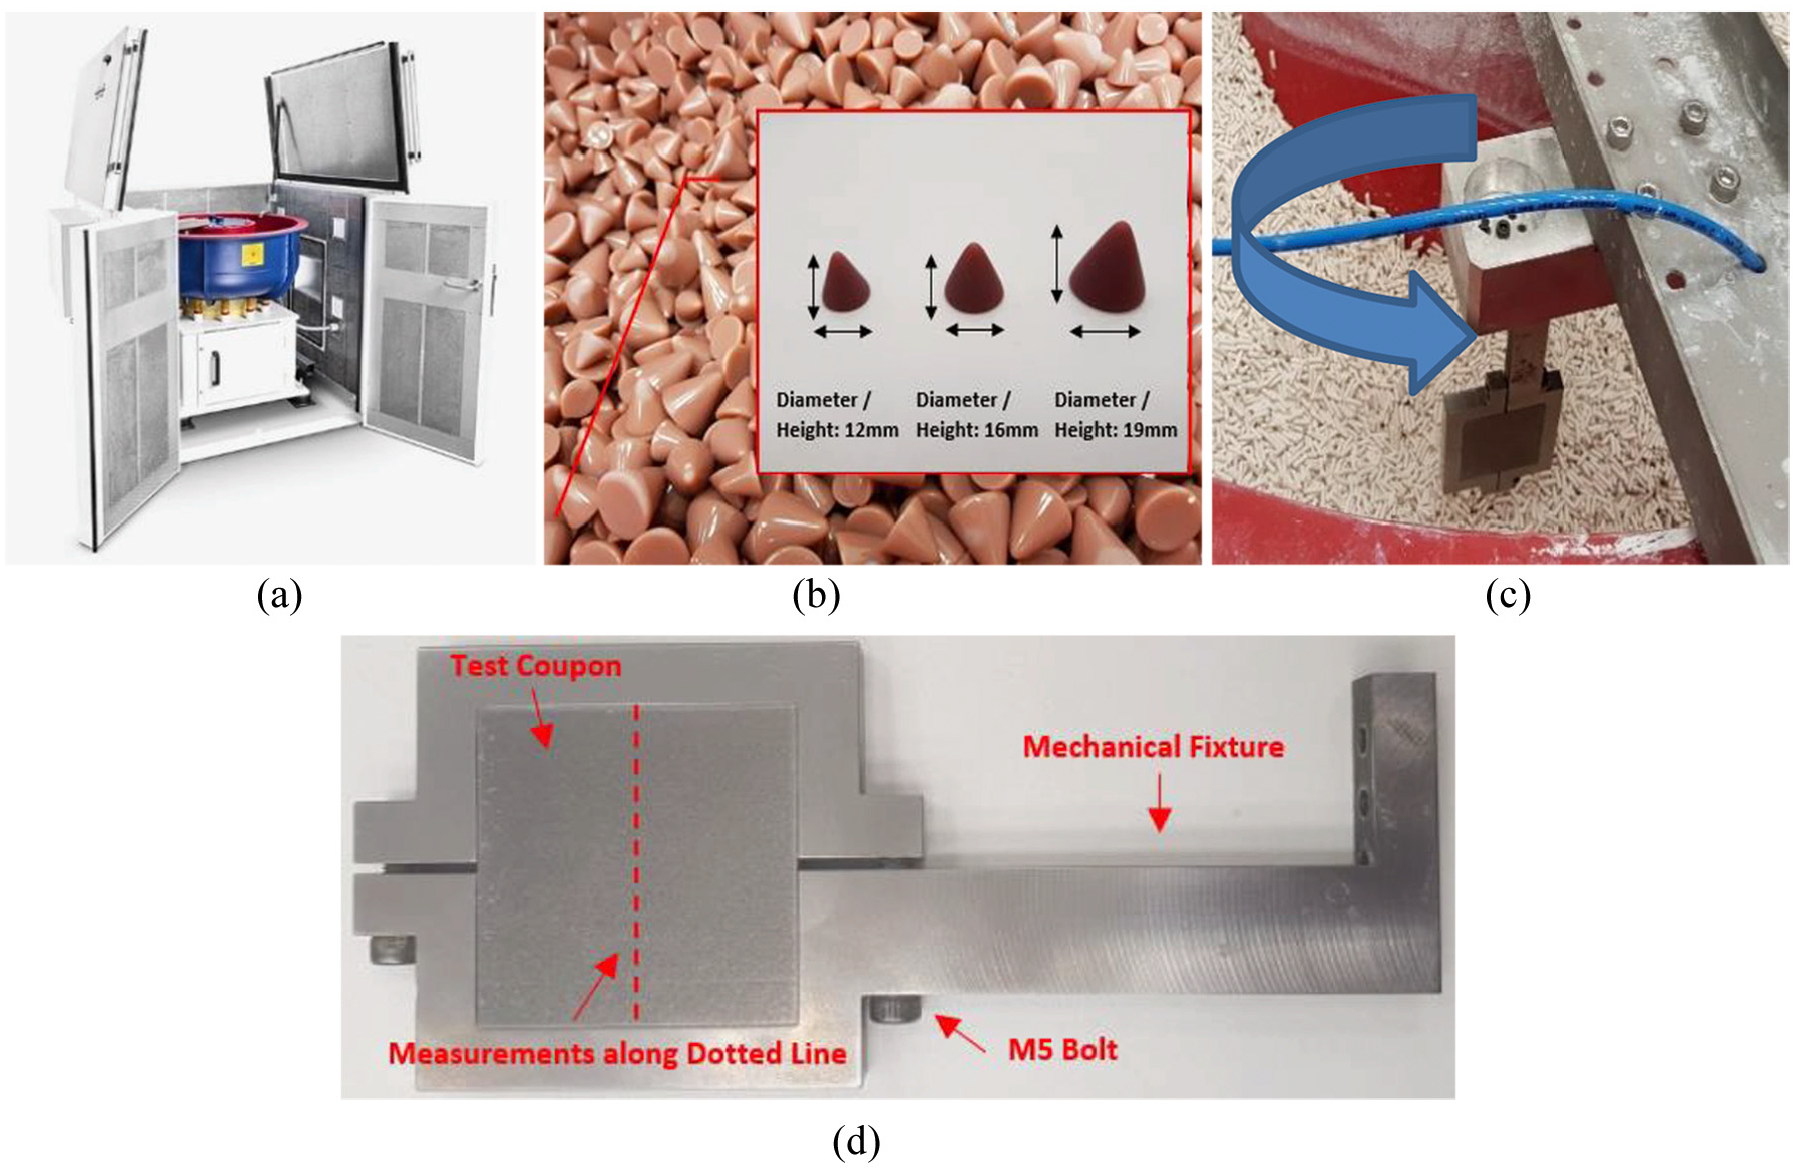
(a) Vibratory bowl with an operating range of 25–75 Hz, (b) specimens of plastic media used, (c) medium flow direction and setup of mechanical fixture with the workpiece, and (d) Al-6061 workpiece secured to a mechanical fixture.
In this study, two frequencies were selected to conduct experiments:
The first set of experiments involved carrying out the trials at the operating frequency of 50 Hz. This was established as the baseline as the most conventional bowls in the aerospace industry operate at this frequency.
The second set involved experiments at a higher frequency of vibration. The frequency value was increased by 50% as compared to the conventional bowl frequency, and thus the other study was conducted at 75 Hz.
To ensure consistency of results, the trials were repeated thrice at each operating frequency. Triaxial accelerometers were used to determine the acceleration in various axes as shown in Figure 2(a). Through fast Fourier transform (FFT) plots, it was established that the vibrations occurred predominantly in the z-axis. Using a high-speed camera, the absolute amplitudes of the bowl were 0.8 and 0.65 mm at 50 and 75 Hz, respectively. From the trials, salient trends were observed, and further analyses were performed.
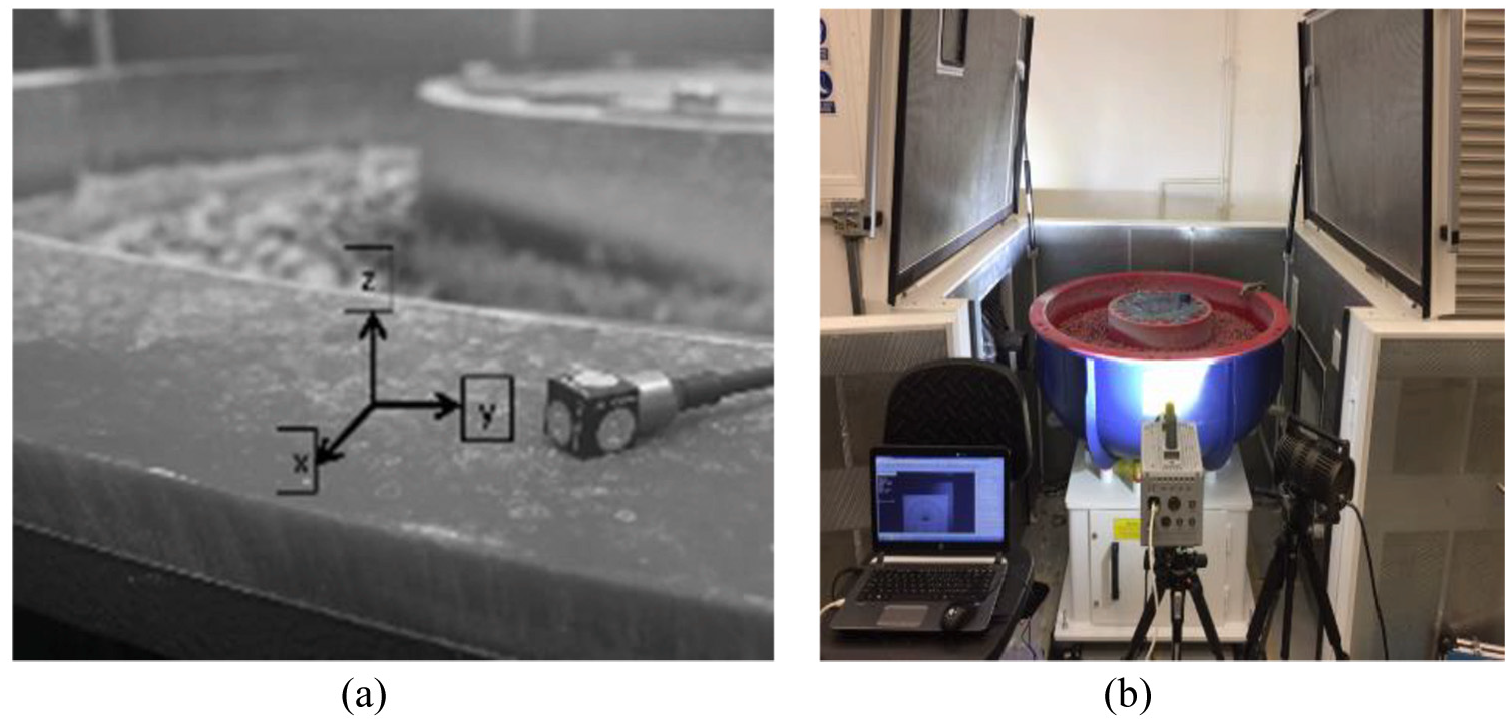
(a) Triaxial accelerometer setup and (b) high-speed camera setup.
Surface roughness measurements were carried out at five equidistant, predetermined locations with the aid of a hand-held profilometer, Taylor Hobson Surtronic DUO Surface Roughness Tester. The cut-off wavelength and the stylus speed of the instrument were 0.8 mm and 0.5 mm/s, respectively. Five sampling lengths were measured for every trial conducted until the roughness limitation was achieved.
A mass removal study was facilitated with the aid of an electronic mass scale from Fisher Scientific. The scale had a precision of 0.01 g and a working range of 500 g. The periodic mass loss was calculated and used to derive the graph of material removal rate against process cycle time.
Tekscan FlexiForce B201 sensors with a data acquisition (DAQ) system were used, which provided a hysteresis of 4.5% of the operating range—up to 100 N—and a response time of 5 µs. Using double-sided tape, the sensors were secured to one of the faces of the test piece such that the sensing area of the force sensor was in direct contact with the medium. The flexible force sensors had a circular sensing area of 9.53 mm2. Due to the difference in size of the medium, the sensors were used to determine the relative impact forces to provide an understanding of the forces leading to the observed trends. Force sensor measurements were taken over a period of time—100 s—before calculating the average reading.
Thereafter, scanning electron microscope (SEM) images were obtained to investigate the nature of the interaction between the medium and the workpiece. In this study, a JSM-5600LV SEM was utilized to obtain the images.
Results and discussion
Graphs of normalized surface roughness and material removal rate against time
The experimental results are presented in the following figures. Figure 3 depicts the graphs of normalized surface roughness against process cycle time for experiments conducted at 50 and 75 Hz, highlighted in pink and blue, respectively. The plot obtained from Hashimoto and DeBra 11 has also been incorporated into Figure 3, highlighted in red (obtained after scaling with a dimensionless constant)—to compare the effects of operating frequency on the rate of reduction of normalized surface roughness.
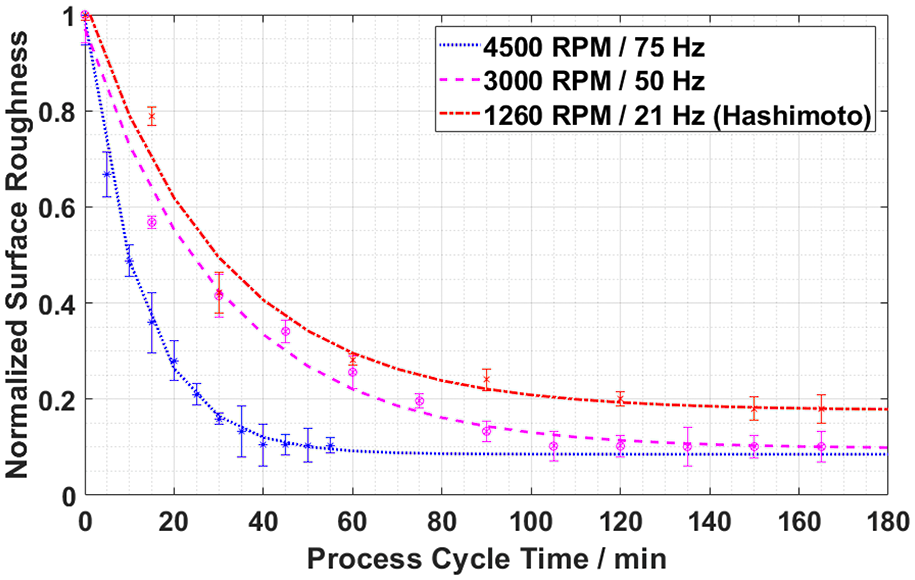
Normalized surface roughness against time.
Figure 4 shows the graph of material removal rate against process cycle time for the experiments conducted at 50 and 75 Hz, highlighted in pink and blue, respectively. Similarly, Hashimoto’s graph has been incorporated into Figure 4, highlighted in red—after scaling with a dimensionless constant—to analyze the effect of operating frequency on the rate of material removal.
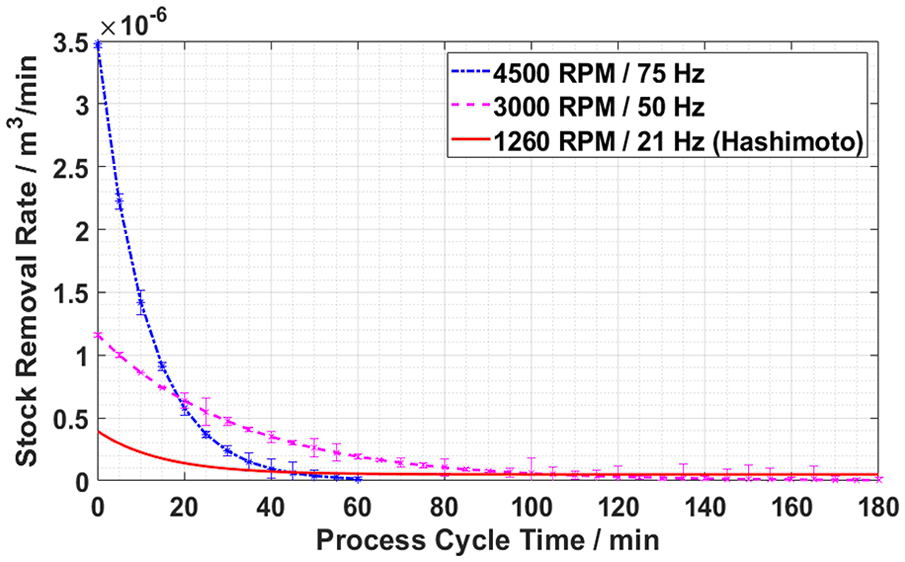
Stock removal rate against time.
Validation of Hashimoto’s rules
From the conducted trials, the experimental results follow the rules established in Hashimoto’s study. First, a workpiece undergoing the vibratory finishing process will approach a roughness limitation, Dr. From Figure 3, a decreasing trend was observed from the normalized surface roughness of Al-6061 flat test coupons. As the trials were halted after 180 min, the average surface roughness of the workpieces was 0.17 μm. This suggests that the workpieces have reached the surface roughness limitation.
Second, a greater rate of material removal was observed at the transient stage than at the steady state, at both 50 and 75 Hz. This observation is in line with Hashimoto’s second rule. Hashimoto’s second rule stipulates that a greater rate of roughness change will be achieved when there is a greater difference between the roughness of finished surface and its roughness limitation.
Third, steady state was achieved after some time and a constant rate of material removal was observed. At 50 and 75 Hz, steady state was achieved after 120 and 60 min, respectively, with the corresponding material removal rate being 0 m3/min. Conversely, at 21 Hz, the stock removal rate obtained by Hashimoto was 0.053 cm3/min.
Thus, the experimental results were consistent with the three rules established by Hashimoto. However, Hashimoto’s study has failed to incorporate the effect of operating frequency since his trials were conducted exclusively at 21 Hz.
Mathematical expressions for vibratory finishing
At a higher operating frequency, it was observed that an increased average stock removal rate was attained. At the beginning, the stock removal rate at 75 Hz was thrice that at 50 Hz, with the stock removal rates being 3.5 and 1.18 cm3/min, respectively. At roughness limitation, the total stock removal is given by 0.1 g at each frequency. Given that the area under a curve represents the total stock removal and a greater average stock removal rate was experienced at 75 Hz, a longer process cycle time would be expected at 50 Hz. This explains the point of intersection between the two curves at t = 19 min, as the workpiece undergoing vibratory finishing at 75 Hz approaches the roughness limitation.
Similarly, there was an increased rate of reduction in normalized surface roughness at a higher operating frequency.
These suggest that (a) stock removal rates of the workpieces and (b) rate of reduction in normalized surface roughness were governed by the operating frequency of the vibratory bowl. Equation (1) shows the governing exponential equation, while the empirical constants and coefficients of determination are presented in Table 1

Empirical constants and the corresponding R2 values.
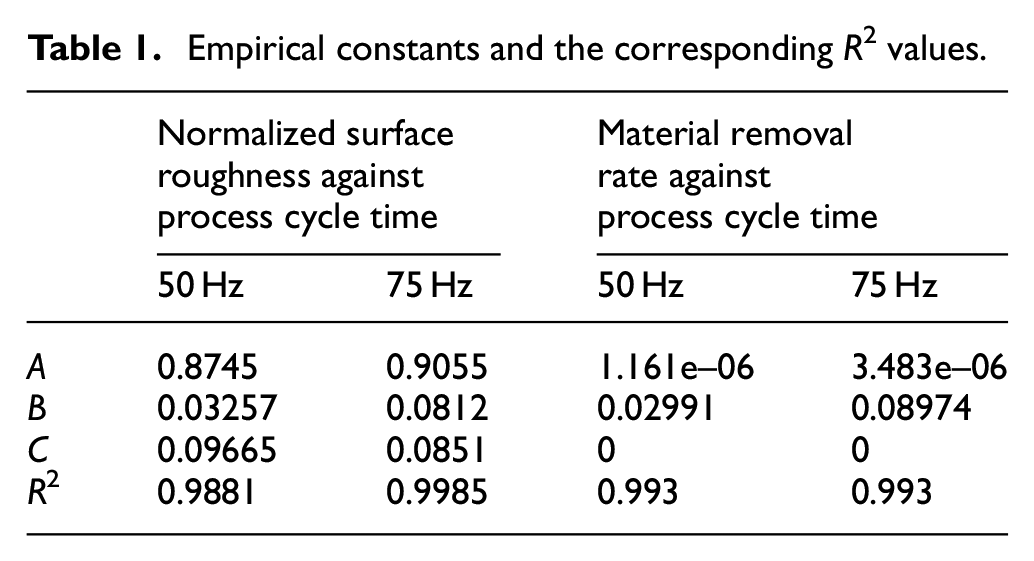
where the constants are defined as follows: y is the normalized surface roughness/material removal rate; x is the process cycle time; A and B are the empirical constants; and C is the normalized surface roughness/material removal rate at steady state.
Considering the coefficients of determination, R2, the fitted regression lines are in good agreement with the experimental data. Thus, two families of curves may be present, with the sole variable being the operating frequency of the vibratory bowl. The exponential term in the governing equation, Ae–Bx, corresponds to the exponential decrease in material removal rate/normalized surface roughness caused by roll and feed motion during vibratory finishing. The roll motion in vibratory finishing terminology is characterized by the motion where the medium rises at the outer diameter of the vibratory bowl and falls downward and inward toward the center hub. Conversely, the feed motion is observed as the medium moves collectively in the clockwise or anti-clockwise direction.
C represents the material removal rate/normalized surface roughness at steady state. Considering equation (1) for normalized surface roughness, the value of C at 50 Hz differs from that at 75 Hz. Due to the difference in initial average surface roughness, there is a difference in the eventual normalized surface roughness values. Hence, after accounting for the initial average surface roughness values, the theoretical roughness limitation for Al-6061 flat test coupons is given by 0.165 μm. This theoretical value of roughness limitation is in agreement with the experimental value of 0.17 μm. Theoretically, the average surface roughness value of an Al-6061 flat test coupon should approach 0.165 μm at steady state. The theoretical roughness limitation was obtained through curve fitting, as it was observed that the average surface roughness of the Al-6061 workpieces tends toward 0.165 μm. This suggests that the aforementioned value could be the theoretical roughness limitation.
Considering equation (1) for material removal rate at 50 and 75 Hz, C has a value of 0. This suggests that zero material removal rate should be obtained at steady state, which is consistent with the earlier hypothesis.
By conducting intensive trials on Al-6061 flat test coupons, new mathematical expressions and graphs have been obtained, in addition to validating Hashimoto’s existing rules. Henceforth, for industrial applications, the process cycle time required to achieve the desired surface roughness can be ascertained instead of reliance on the present guess-and-check method.
Force sensor readings and SEM images
Force sensor readings have been taken to substantiate the results obtained in section “Mathematical expressions for vibratory finishing.” Yabuki et al. 15 postulated that, regardless of the geometrical complexities of the workpieces, material removal mechanics can be attributed to the contact forces through experimental studies. Table 2 shows the force sensor readings obtained at 50 and 75 Hz. The experiments using force sensors were repeated three times and the average values are shown in Table 2.
Force sensor readings obtained at 50 and 75 Hz.
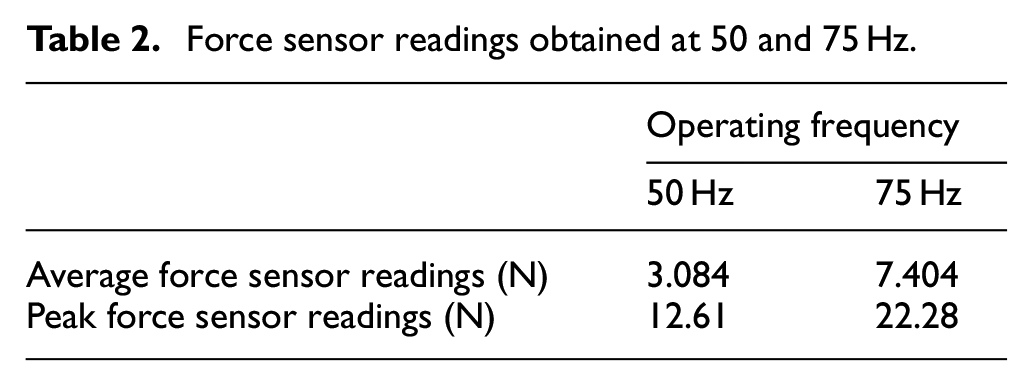
At 75 Hz, the average and peak force sensor readings were higher than those at 50 Hz. At 75 Hz, there is a 140% increment in average force sensor readings in comparison to operating at 50 Hz. Hence, as the operating frequency of the vibratory bowl increases, the plastic medium exerts a greater impact on the force sensor. Hence, the process cycle time was shortened at a higher operating frequency due to a greater impact force by the medium.
A graph of force sensor readings to demonstrate how the analyzed force values were calculated (Table 2) is shown at 75 Hz for the plastic conical medium in Figure 5.
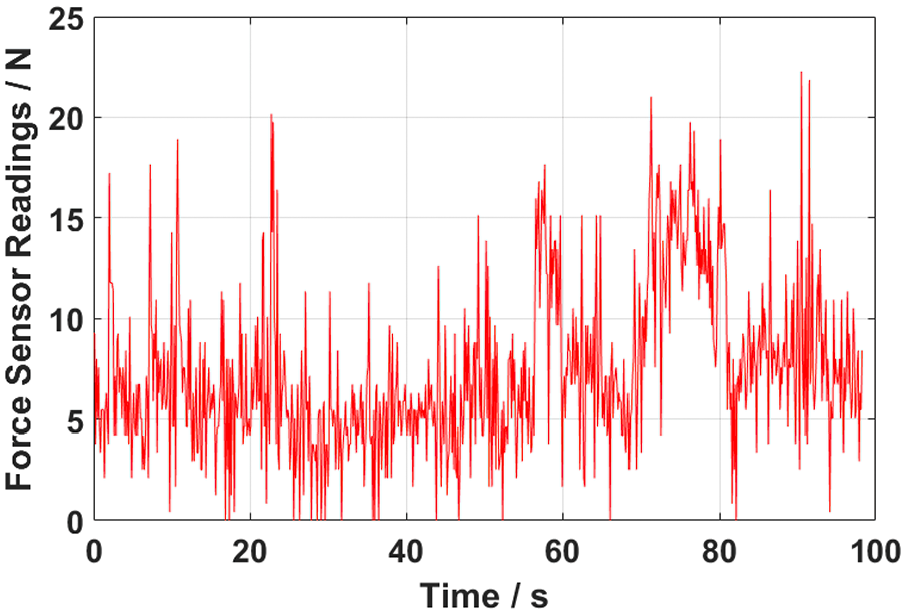
Force sensor readings against time at 75 Hz.
In a bid to uncover the science behind the vibratory finishing process, the SEM was utilized to study the surface topography of the Al-6061 flat test coupons. The surface images of the test coupons were taken at a magnification factor of 2000×. Figure 6 shows the SEM images of Al-6061 test coupons corresponding to (a) original glass bead–peened surface, (b) at roughness limitation after vibratory finishing at 50 Hz, and (c) at roughness limitation after vibratory finishing at 75 Hz.
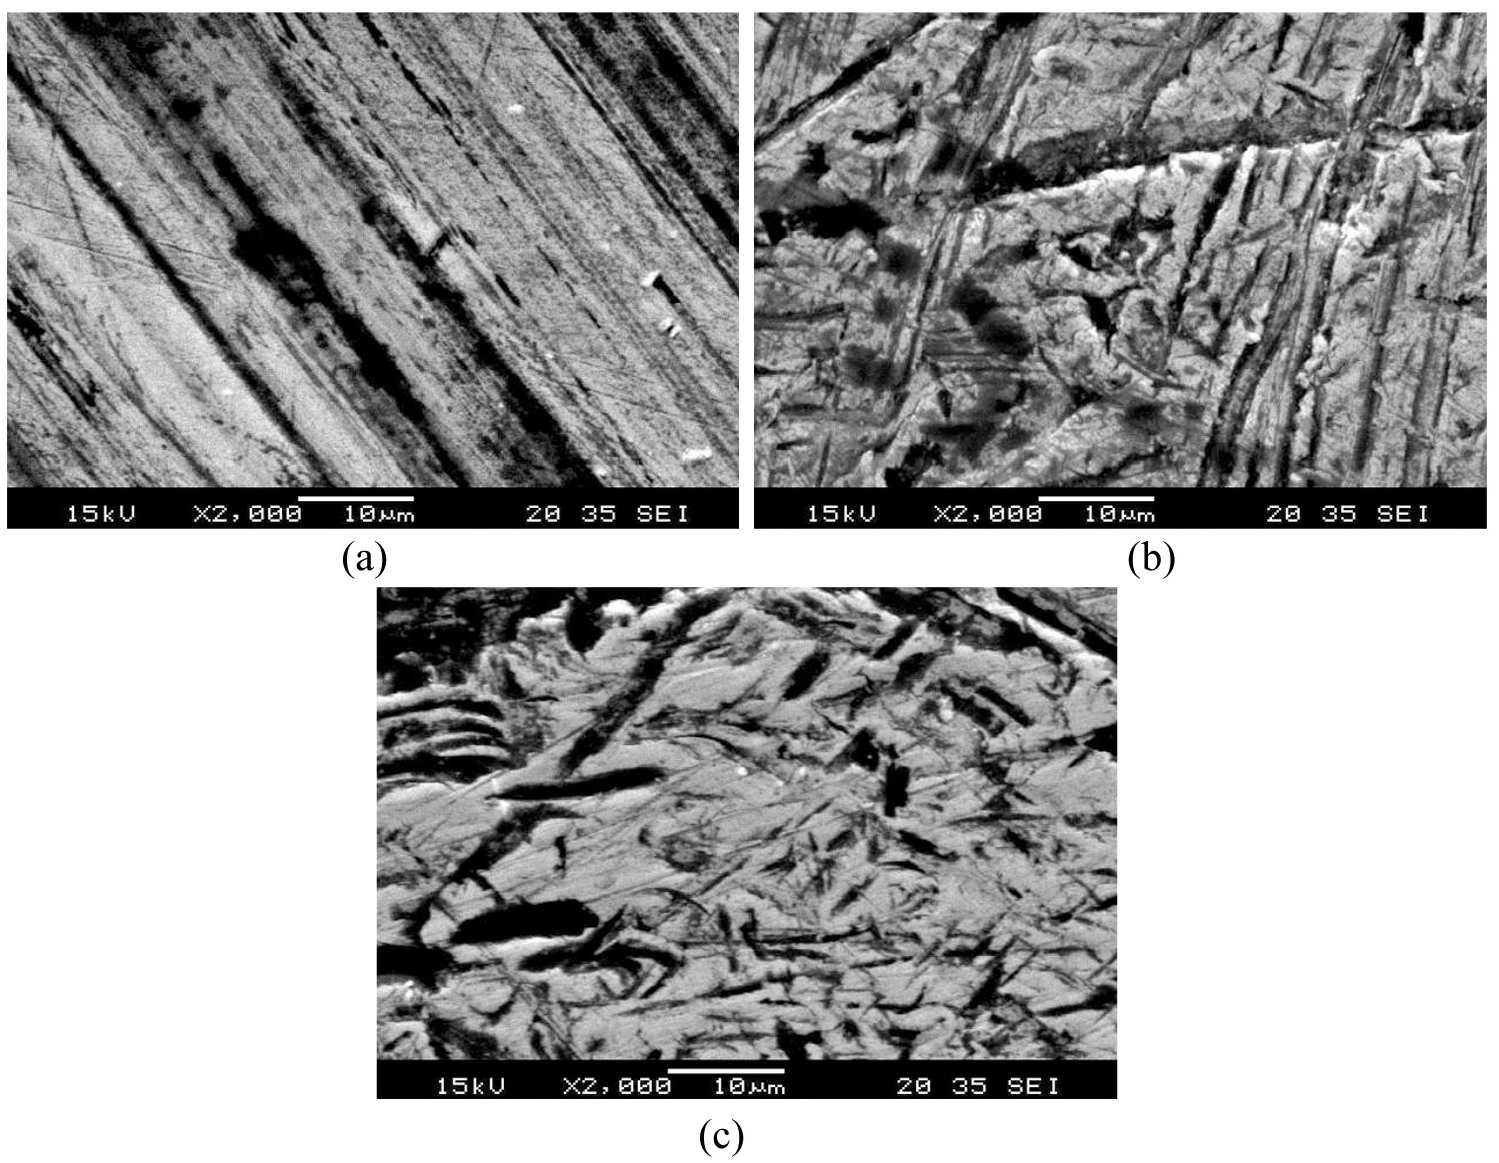
SEM images of Al-6061 flat test coupons: (a) original glass bead–peened surface, (b) at roughness limitation after vibratory finishing at 50 Hz, and (c) at roughness limitation after vibratory finishing at 75 Hz.
Upon closer inspection of the SEM images, a better understanding of the interaction between the plastic medium and Al-6061 flat test coupons at different operating frequencies was achieved. For the plastic medium used in the experiments, a combination of the normal and sliding impacts contributes to the plastic deformation due to the geometry of the conical medium particles. It was observed that at 75 Hz there was a high concentration of shallow sliding marks. Conversely, at 50 Hz, there were deeper sliding marks. This suggests that as the operating frequency of the vibratory bowl increases, the medium is less likely to be fully impinged onto the surface of the workpiece. In line with the following mathematical equation for force
at a higher operating frequency, the period of interaction between the medium and the surface of the workpiece is reduced, for example, dt decreases. Conversely, at a higher operating frequency, the medium mass, m, imparts a higher kinetic energy to the workpiece in the form of a higher speed, for example, d(v), increases. As such, the medium exerts a higher (impulsive) force on a test coupon at 75 Hz.
Consequently, due to the longer period of interaction between the medium and the workpiece at 50 Hz, the medium exerts a periodic force on the test coupon and hence the deeper sliding marks could be observed at 50 Hz. With reference to Table 2, this suggestion is in line with the magnitude of the force sensor readings at varied operating frequencies.
Furthermore, the SEM images also suggest the reasons for a gradual reduction in material removal rate. At a high initial value of surface roughness—a glass bead–peened workpiece has an average surface roughness of 1.6 μm—there is a high concentration of asperities and valleys, as shown in Figure 6(a). With significant protrusions of asperities in the initial stages, there is a greater likelihood for the plastic medium to chip off a sizable amount of material from the peaks, leaving behind shorter peaks. Conversely, as the material fills the deep valleys throughout the trial, they become shallower. As the experiment approaches a point of saturation, the valleys and peaks are now shallower and shorter, respectively. At this juncture, it is less likely for the medium to remove material from the peaks since the peaks are now shorter.
The second approach would be to consider the probability of medium strikes on a workpiece. From Figure 6(a), there is a high concentration of surface imperfections initially, leading to a higher probability of medium striking uneven spots. As the average surface roughness of the workpiece decreases eventually, there is a corresponding decrease in the concentration of surface imperfections. Thus, there is a reduced probability of medium striking an uneven spot, which could explain the decrease in material removal rate as the surface roughness approaches the desired value.
Conclusion
The findings presented in this work ascertain that the rules proposed by Hashimoto in 1996 still hold valid and on a variant of his original process setup, that is, with high-frequency finishing. Furthermore, a new set of mathematical equations have been obtained, which relate (a) normalized surface roughness to process cycle time and (b) stock removal rate to process cycle time. A family of curves has been obtained for (a) and (b), with the sole variable being the operating frequency of the vibratory bowl.
In general, at a higher operating frequency, a shorter process cycle time is required to achieve the minimum surface roughness. At 75 Hz, there is a 66.7% reduction in process cycle time and a 140% increment in average force sensor readings in comparison to when operating at 50 Hz. This statement is valid when all other parameters are held constant with the sole variable being the operating frequency of the vibratory bowl.
A deeper analysis of the experimental results was made possible with force sensor readings and SEM images. The SEM images have provided plausible reasons—consistent with the explanation proposed by Wan et al. 12 —for the reduction in material removal rate as the surface roughness of a workpiece approaches the roughness limitation.
Despite achieving a significant reduction in process cycle time of flat workpieces through high-frequency vibratory finishing, an urgent need remains for research efforts to be directed toward investigating the interaction between the plastic conical medium and curved workpieces for process cycle time optimization. Moving forward, vibratory finishing is no longer a black box; its internal workings should be fully comprehendible.
Footnotes
Acknowledgements
The authors would like to thank Rijul Mediratta from Rolls-Royce@NTU Corporate Lab and Thomas Haubold and Arthur Wee from Rolls-Royce for their contributions.
Declaration of conflicting interests
The author(s) declared no potential conflicts of interest with respect to the research, authorship, and/or publication of this article.
Funding
The author(s) disclosed receipt of the following financial support for the research, authorship, and/or publication of this article: This work was conducted within the Rolls-Royce@NTU Corporate Lab with support from the National Research Foundation (NRF) Singapore under the Corp Lab@University Scheme.