
Abstract
In high-quality manufacturing processes, the yield is no more the only issue, and the quality control approach that also considers the product’s actual performance gradually becomes the focus. Reliability is a critical dimension of quality, and its degradation in usage is always determined by the manufacturing quality. To mitigate the degradation of reliability, this article presents a product reliability–oriented optimization design of the time-between-events control chart system, where the quantitative impact of process quality on the product reliability is analyzed. First, critical-to-reliability process parameters are identified, and a product reliability degradation model is proposed considering the effect of process variations and defects. Second, the observed event and the used statistics are determined to prearrange the time-between-events chart system. Third, all individual time-between-events charts are systematically optimized to minimize the expected batch product reliability degradation caused by potential process shifts, where the cost and statistical performance are considered as constraints. The result of the case study shows that the proposed design can reduce 27.02% of batch product reliability degradation due to manufacturing process quality, and this model can also save the operating cost on the basis of attaining minimum reliability degradation in certain situations.
Keywords
Introduction
To maintain competitive edge, manufacturers must strive for high product quality and reliability regarding increasing customer requirements.1,2 Nowadays, a high-quality manufacturing process with low defective percentage and process shift rate can be achieved more easily than decades ago.3,4 In this background, the focus of quality control cannot be restricted only to the yield anymore. The actual reliability is severely dependent on the manufacturing quality and the effectiveness of process control.5,6 Thus, enhancing the product reliability is a worthy improvement direction in process control. In addition, the newest ISO 9001:2015 standard emphatically advocates the integration of the quality management system with the management of other important product characteristics, 7 which implies that reliability assurance should be coordinated with traditional quality control activities.6,8
Many studies have shed light on the correlativity between the manufacturing quality and the product reliability. Jiang and Murthy 9 discussed the impacts of component non-conformance and assembly error on the product reliability based on Weibull distribution. Bebbington et al. 10 used polynomial functions to establish various product hazard rate models. Jin et al. 11 applied the Six Sigma methodology and presented a closed-loop control framework for estimating infant failures of products. In the field of semiconductor manufacturing, Roesch 12 discussed the connotations of yield, quality, and reliability and then proposed a new bathtub curve that measures fallout to predict batch reliability. Kim 13 focused on the effect of manufacturing defect accumulation on the product infant failure and presented a defect-based reliability model. He et al. 14 integrated the rough set and the fuzzy TOPSIS (Technique for Order Preference by Similarities to Ideal Solution) to mine the correlation between quality data and reliability data from product lifecycle. Halabi et al. 15 introduced typical reliability and risk assessments into product development and proposed a comprehensive methodology to improve product reliability. He et al. 16 used the weighted association rule mining to search for the root causes of product infant failure in the manufacturing process. Although these studies contribute to the batch reliability analysis based on process data, quantitative reliability–oriented quality monitoring approaches remain underdeveloped.
In the field of statistical process control (SPC), various control charts are widely used to keep manufacturing in control by detecting process shifts. Therefore, designing a control chart plan considering product reliability is a practical way to strengthen reliability assurance in manufacturing. However, studies on reliability-oriented control chart are rare. Panagiotidou and Nenes 17 noticed the influence of process shift on product failure and used an optimal adaptive variable-parameter Shewhart chart to mitigate this effect. He et al. 18 proposed a convergent conditional expected value (CEV)-based chart to control the censored process variables for reliability improvement. In addition, another alternative methodology is to apply proper control charts after determining the process parameters that influence reliability. Thus, many advanced charts can be used for various manufacturing processes, including single-station process, 19 integrated process with correlative parameters, 20 and multi-station parallel process. 21 Furthermore, the quality cost incurred by non-conformance can be used to qualitatively reflect the batch reliability; therefore, reliability is usually involved in the economical design of control chart and other process control plan, and such considerations are usually computed by the processing cost22,23 or Taguchi loss.24,25 However, the introduction of the quantitative quality–reliability model is still ignored, which limits the pertinence of reliability-oriented control.
Notably, reliability degradation under the in-control state cannot be improved only by adjusting the monitoring method, so the detection of the out-of-control state must be emphasized. In addition, the control chart using the time-between-events (TBE) data is more applicable than traditional Shewhart charts in the high-quality processes. 26 Thus, this article proposes a practical reliability–oriented design of the TBE control chart system to enhance the effectiveness of using process quality monitoring to achieve the reliability improvement, and the main contributions are as follows:
The critical-to-reliability (CTR) characteristics are defined and a quantitative model between process quality and reliability of the produced product is developed, which makes it possible to carry out reliability-oriented quality control for high-quality manufacturing processes.
The TBE chart system is prearranged to monitor the CTR process parameters, and all the individual TBE charts are optimized systematically to minimize the negative effect of process shift on batch reliability, which provides a feasible technical means to realize reliability-oriented quality control for high-quality manufacturing processes.
The remainder of this article is organized as follows. In section “TBE control chart system predesign for enhancing product reliability,” a batch product reliability estimation model is presented based on the process data and the preliminary design of the TBE chart system and necessary assumptions are clarified. In section “Joint optimization model of the TBE chart system,” the involved mathematical optimization model is explained and the proposed approach is described. In section “Case study,” a case study is conducted to evaluate the performance of the chart system. Finally, section “Conclusion” presents the conclusions with a summary and directions for future research.
TBE control chart system predesign for enhancing product reliability
Product reliability degradation modeling based on process quality data
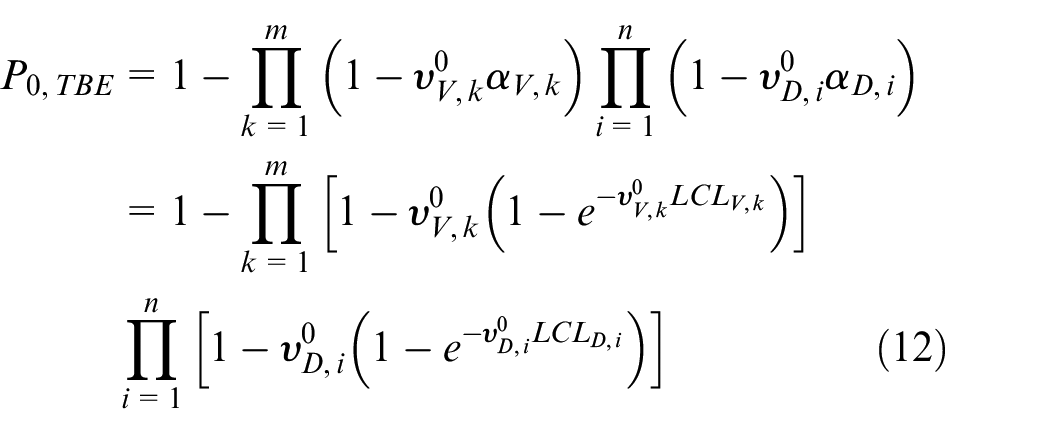
Because of the inevitable process variations, the reliability of a product is consistently lower than its design value, and an appropriate measurement is needed to describe the degree of such degradation. In most modern manufacturing enterprises, if a product failure occurring in the warranty period is caused by its own quality problems (instead of other external reasons), then after-sales activities will lead to a significant increase in the total cost. Considering this phenomenon, the product reliability degradation due to manufacturing, denoted by

where
Then, the manufacturing variables related to reliability must be identified. The general quality can be expressed by the conformance of key quality characteristics (KQCs). As an indispensable indicator of quality, reliability is also determined by a group of CTR characteristics. Thus, identifying controllable CTR parameters in manufacturing is crucial.
The axiomatic design theory presented by Suh 27 can be applied to seek the CTR process parameters, as shown in Figure 1. By analyzing customer requirements, product-level CTR characteristics are determined. Then, CTR function modules are determined and decomposed into the function requirement tree. Furthermore, the proposed tree is successively mapped to identify structural components and final CTR process parameters. On this basis, the quality data of the identified CTR parameters can be used to evaluate the reliability degradation.
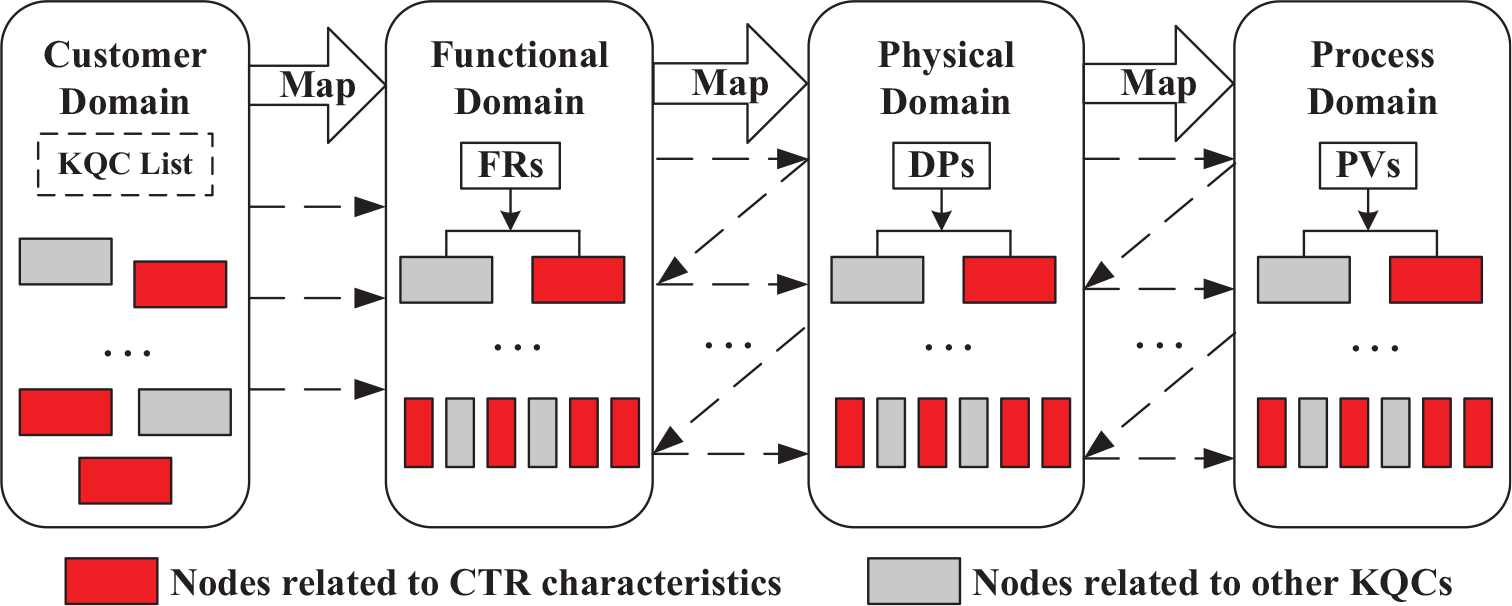
Identification of CTR process parameters using domain mapping and decomposition.
Dimensional variation and internal defect are the two main indicators of process quality. 3 The accumulation of dimensional variations results in an accelerated product crash by the original mechanism that has been considered in design stage, whereas internal defect reduces product reliability by introducing a new failure mode. Both process variations and defects may accumulate and remain in delivered products, so their effects should be considered in the process of establishing the reliability degradation model. Specific steps are as follows:
Step 1. Only CTR dimensional variations are considered. As dimensional variations cannot change the failure mechanism, the degraded reliability can be expressed by a new function

where
The deviation of product KQCs often results in economic losses for handling customer complaints. A reasonable assumption can be posed that the loss caused by deviations of CTR characteristics mainly reflects in the increased cost for handling unwanted product failures in warranty. Therefore, the relationship between the CTR characteristic deviations and reliability degradation can be obtained
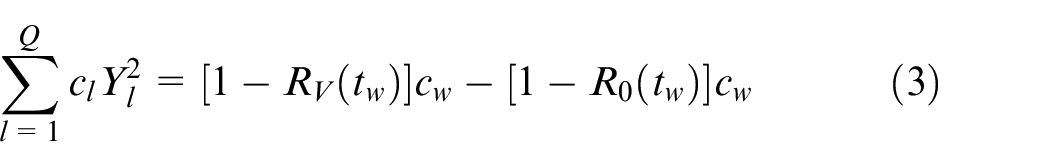
where
Thus, the degraded reliability can be obtained
Step 2. The effects of CTR internal defects are analyzed. Let
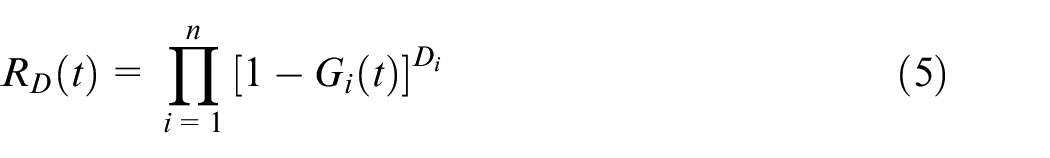
where n is the number of types of internal defects.
Based on the competing risk principle, the final degraded reliability can be computed by
Batch reliability degradation is the expected value of reliability degradation of a single product, as denoted by
Predesigned reliability-oriented TBE chart system
The following assumptions are involved:
Assumption 1. The analyzed system only consists of all identified CTR stations (processes). Without loss of generality, only one machine is considered in a single station.
Assumption 2. Only one process is out of control at any moment.
Assumption 3. Only one assignable cause exists in a particular CTR process, and its occurrence rate is independent and known.
Assumption 4. Only one CTR process parameter is analyzed and monitored in a single CTR process.
Assumption 5. The value of CTR dimensional variations and the number of internal defects follow independent Gaussian and Poisson distributions with known parameters, respectively.
Assumption 6. The system continues operating during the search for possible assignable causes, and the time needed is a known constant.
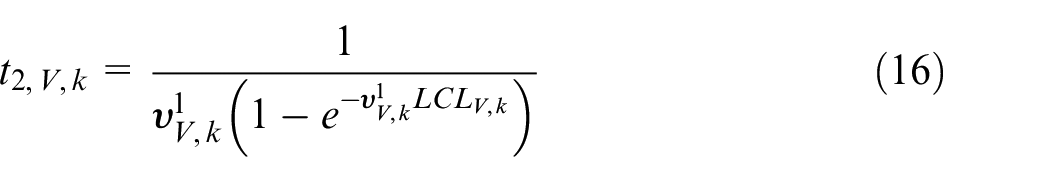
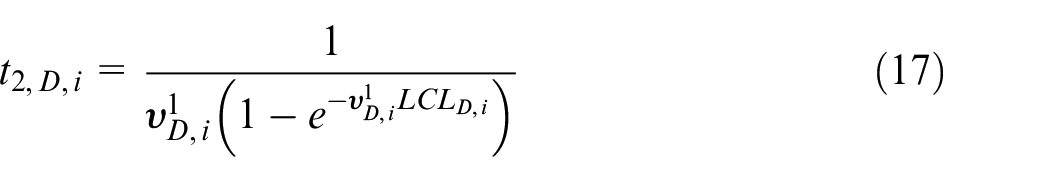
The TBE chart is presented to monitor the occurrence of random events in high-quality processes. Comparing with traditional charts, the sampling policy in a TBE chart can be set at any value. The definition of “event” also has different interpretations even for a fixed sampling policy. The occurrence of the event can be modeled by a homogeneous Poisson process. If the occurrence rate of a defined event is
On this basis, the TBE chart system is prearranged to control each CTR process by independent TBE chart. The time interval between two successive events is monitored. For a CTR process where the dimensional variation
Joint optimization model of the TBE chart system
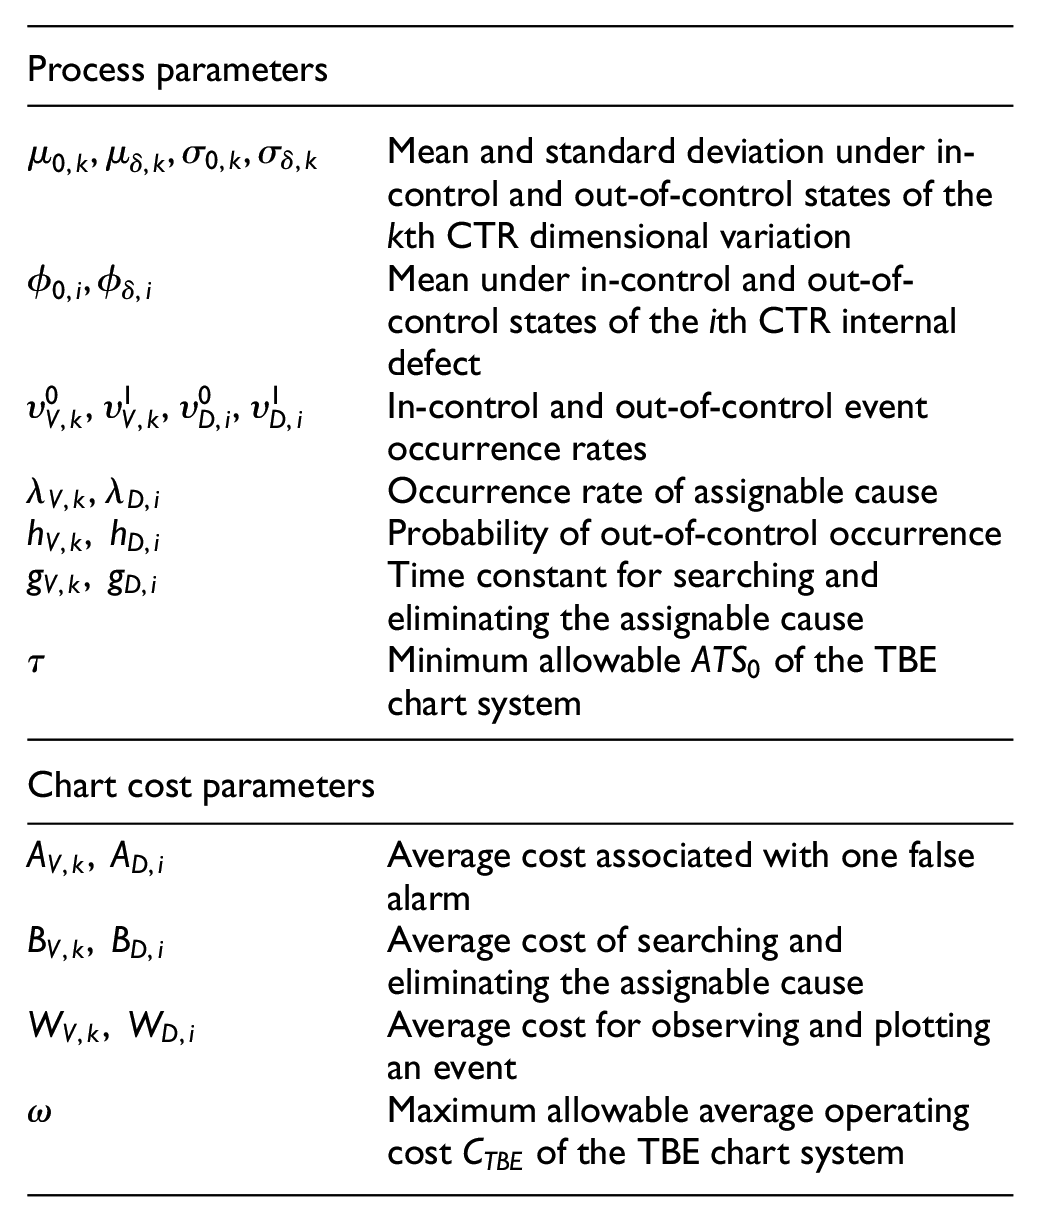
Input parameters
In addition to the necessary parameters for establishing the quality–reliability model, the following parameters must be specified.
Optimization model
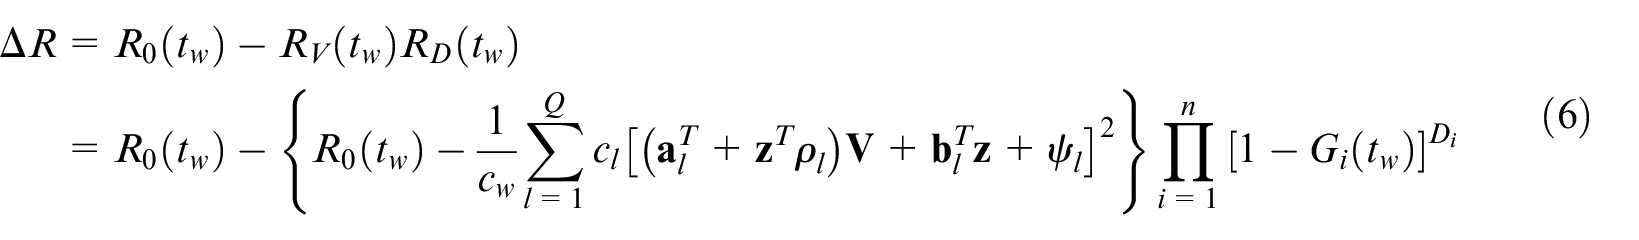
Because assignable causes always increase the occurrence rate of the event, TBE data,
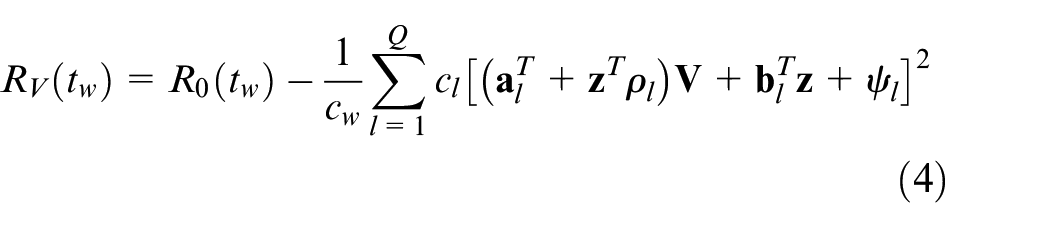
A vital truth is that the reliability degradation in the in-control state cannot be improved except by enhancing machine capability. Thus, detection optimization of the out-of-control state must be the emphasized to attain the reliability-oriented monitoring. Here, this article chooses to optimize the TBE chart system, characterized as the combination of


The design variables are
The calculation of the involved parameters will be described in the following subsection.
System in-control
The
The false alarm rate of a single process can be approximately calculated by the product of the type I error probability and the event occurrence rate. The type I error probabilities
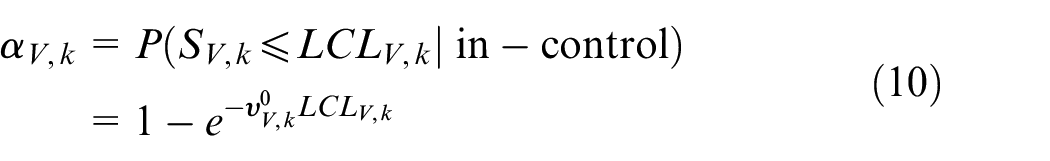
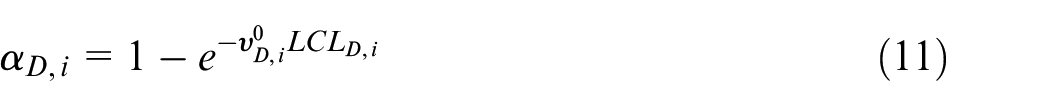
Therefore, the probability that a chart in a process produces a false alarm per time unit can be approximately evaluated by
Finally

Expected length of an operational cycle of a single process T
A single process consists of successive operational cycles, and each cycle comprises the in-control period
Because it obeys exponential distribution, and the process continues operating during the search for the possible assignable cause, therefore


The expected length of the out-of-control period can be calculated by the inverse of probability that the chart monitoring the out-of-control process gives a signal per unit time
The expected time for searching and eliminating the assignable cause is a known constant. Thus


The expected length of an operational cycle of the considered CTR process is


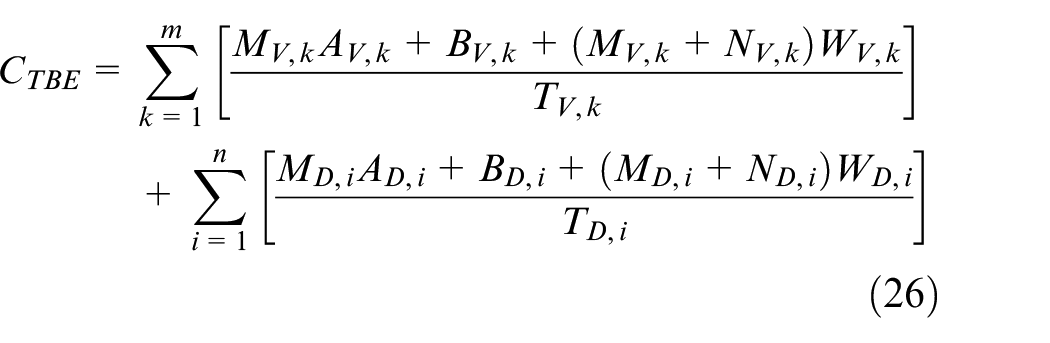
Expected average cost for operating TBE system per unit time
The average cost for operating TBE system can be obtained by summing the cost of individual charts. Taking the process that introduces the kth CTR dimensional variation as the example, the expected number of false alarms
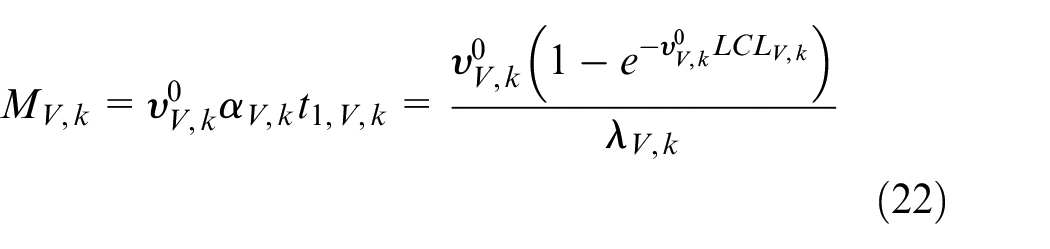
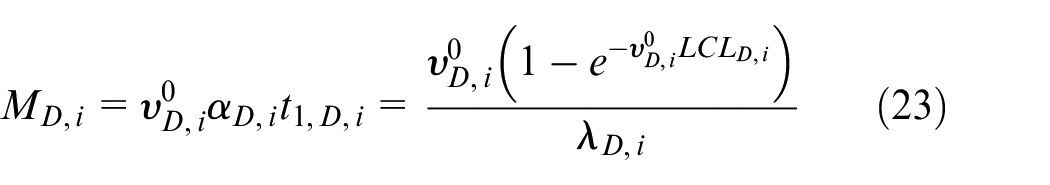
The expected event number
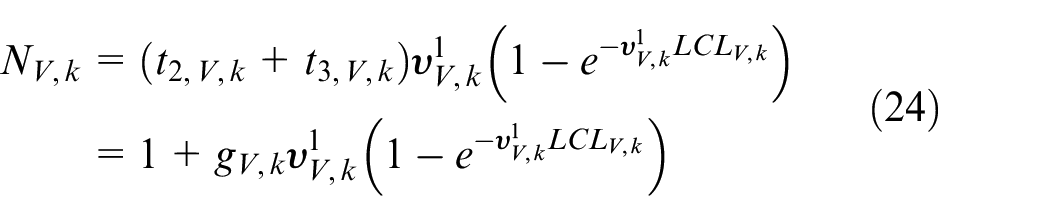
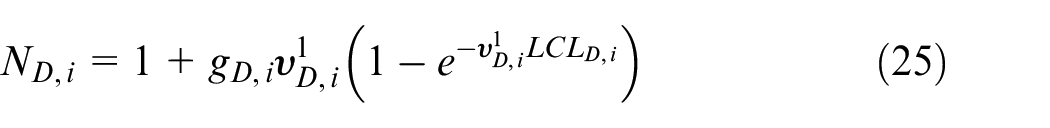
Thus, the expected average cost for operating TBE system per unit time
Batch reliability degradation increment index
The increment index of batch reliability degradation caused by a single assignable cause, denoted by
Denote by


Based on Assumption 2,
Optimization algorithm
This article uses a dynamic search algorithm to determine the optimal combination of design variables
Thus, this nonlinear programming problem aims to identify the optimal values for
Step 1. Specify all the involved parameters.
Step 2. Initialize
Step 3. Set an appropriate maximum iteration number (e.g. 10,000).
Step 4. Input the object function and constraint functions and output the optimal value
Step 5. Calculate the lower control limit of each individual control chart by equations (30) and (31).
Case study
Background
The cylinder head is one of the most important parts of a modern engine, and the machining precision is a crucial factor which significantly decides the useful life and reliability of the engine. A poor-quality cylinder head will cause unwanted failures of the engine. In a Chinese enterprise, the manager hopes to enhance the stability of engine reliability by optimizing the quality control in cylinder head manufacturing. Therefore, the proposed approach is applied.
First, four CTR stations are identified by the axiomatic method. The schematic is shown in Figure 2, and the process requirements are listed in Table 1. Thereinto, two types of CTR dimensional variations,
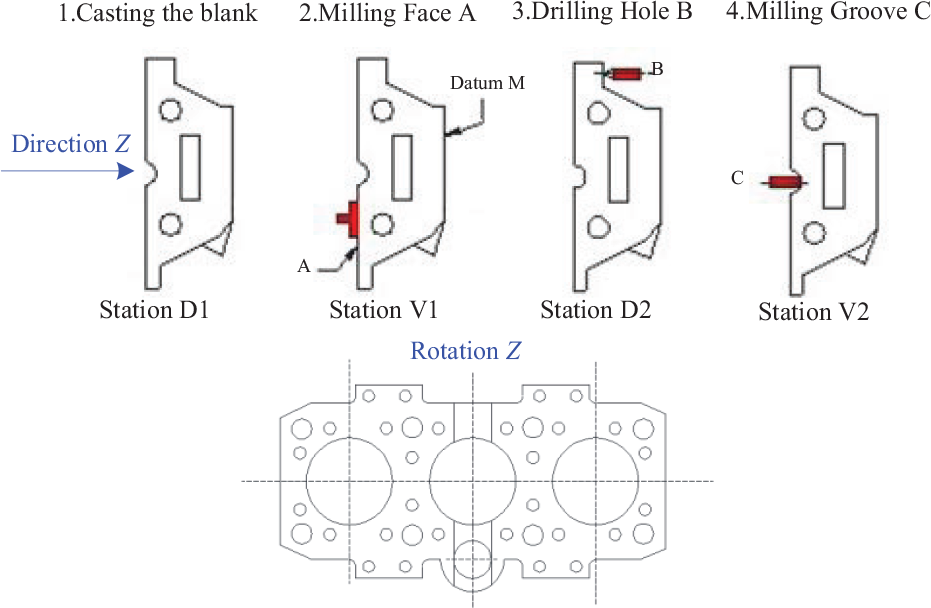
Schematic of the involved CTR stations.
KQCs of cylinder head and design specifications.
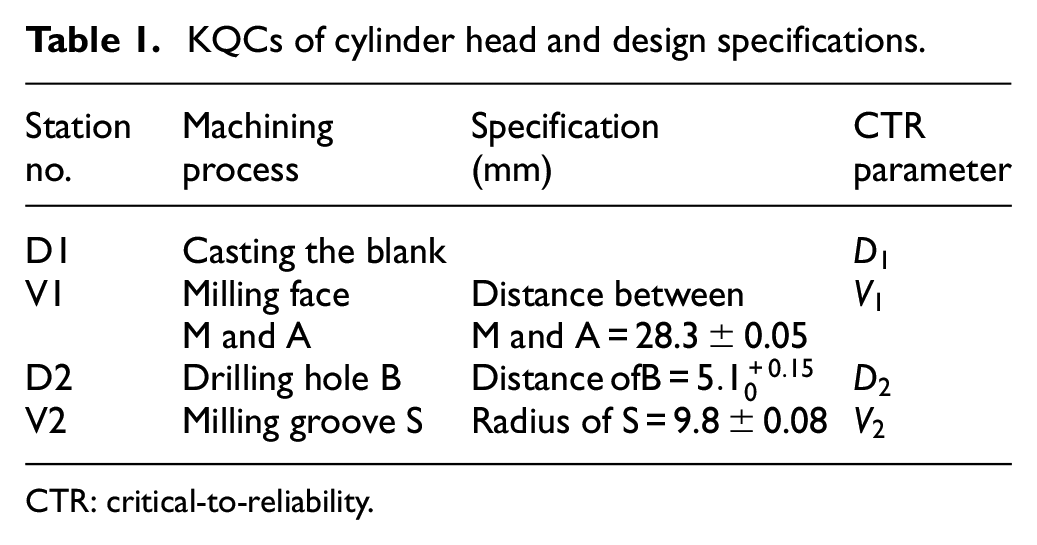
CTR: critical-to-reliability.
Numerical example
First, the involved parameters are obtained from historical data and requirements of manufacturing, as follows:
1. Reliability modeling parameter
2. Process parameter
3. Chart cost parameter (unit: US$100)
Reliability degradation estimation
The degradation model of a single product is
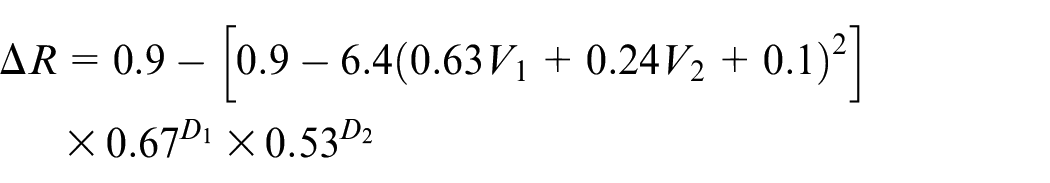
When the simulation number is set at 100,000, the in-control and out-of-control batch reliability degradation values are
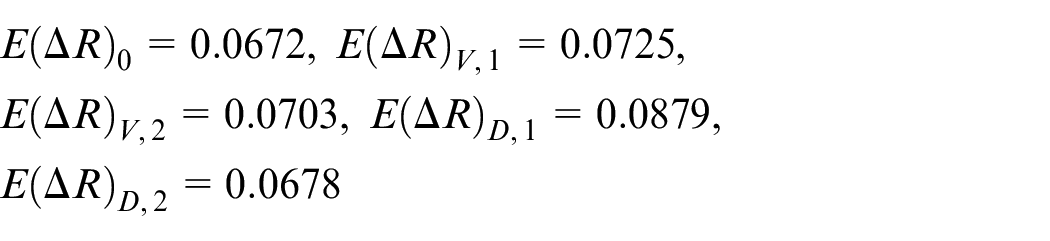
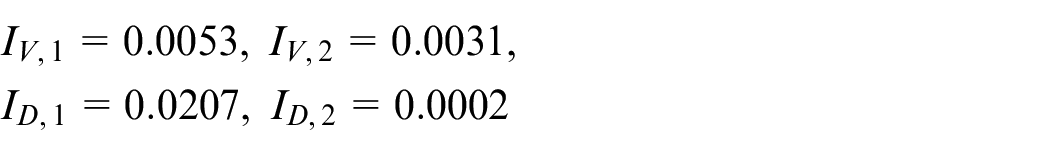
Thus, reliability degradation increments are
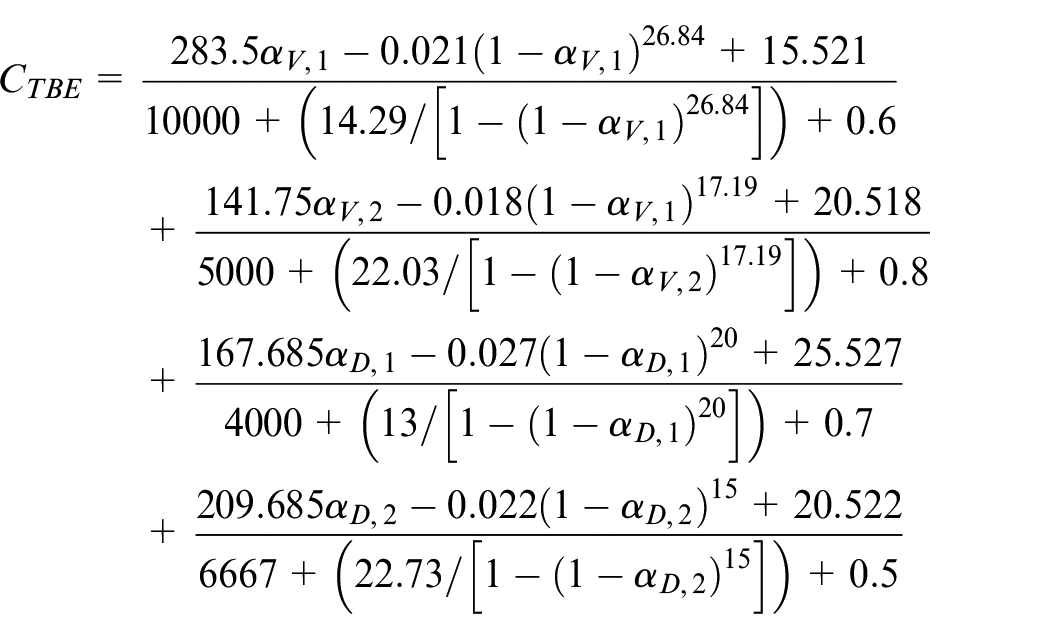
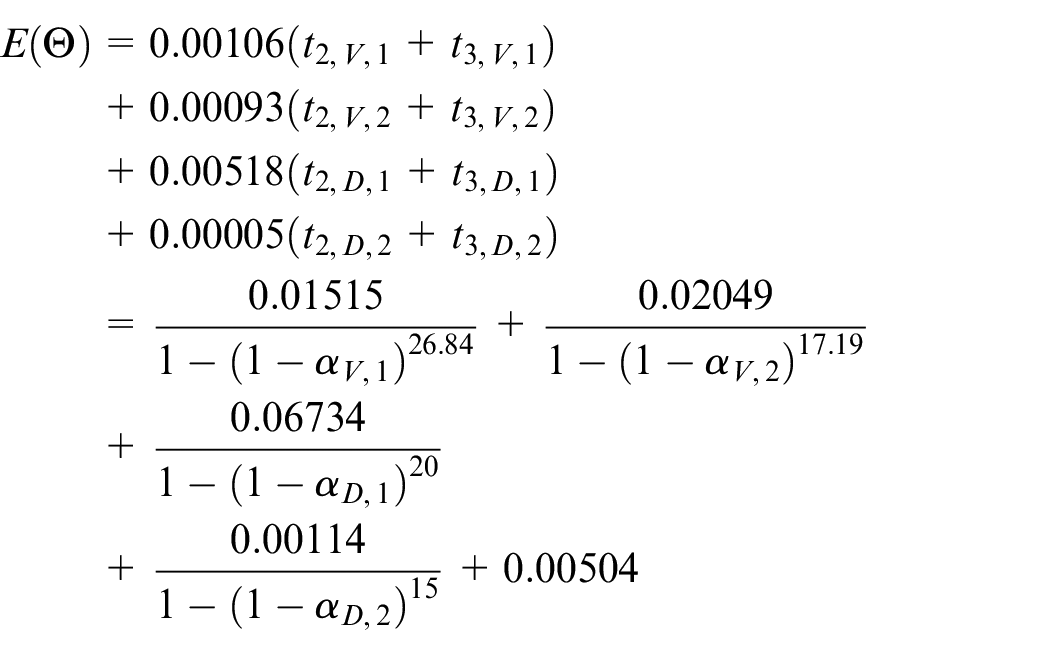
Parameter calculation of the TBE chart system
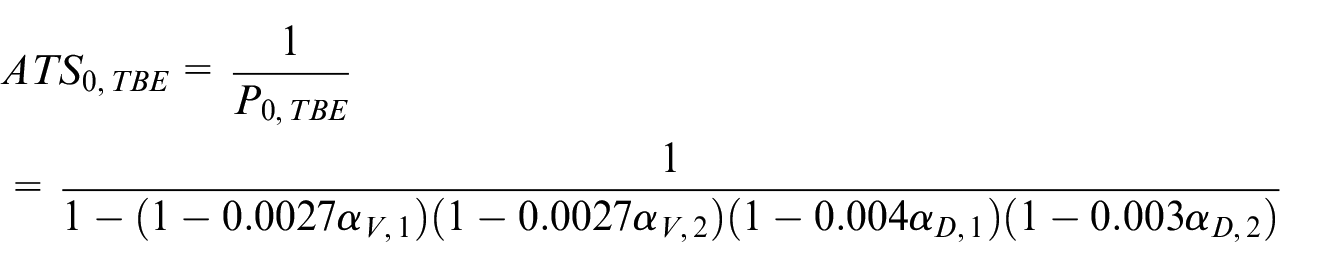
The chart parameters are expressed by the type I error probability.
The
The expected cycle length T is
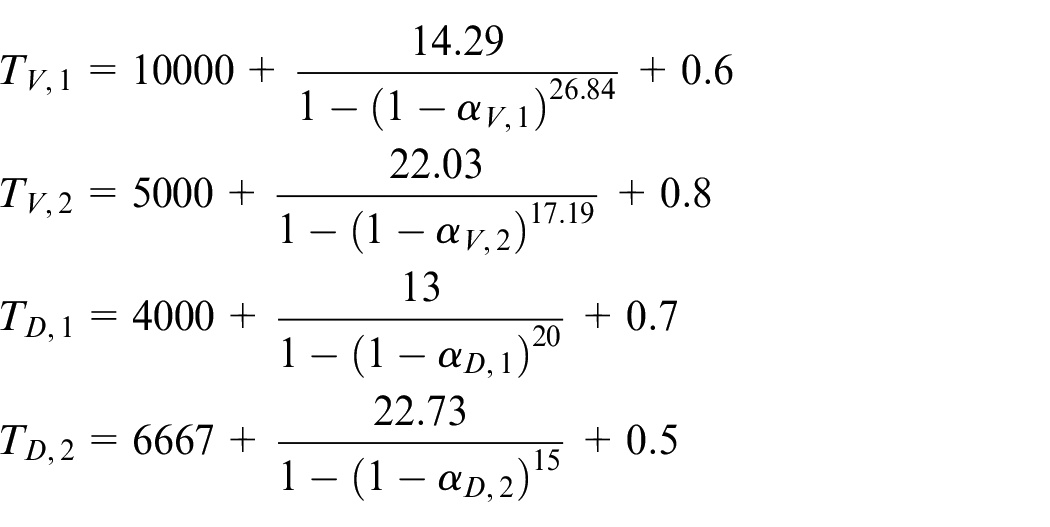
The expected average system cost
Optimization results
In order to highlight the advantages of the proposed approach, this article compares the most important performance indexes, namely, the expected batch reliability degradation increment indexes
The expected batch reliability degradation increment index
A traditional TBE chart system adopts the same type I error probability of 0.0027 for all individual charts, and the corresponding
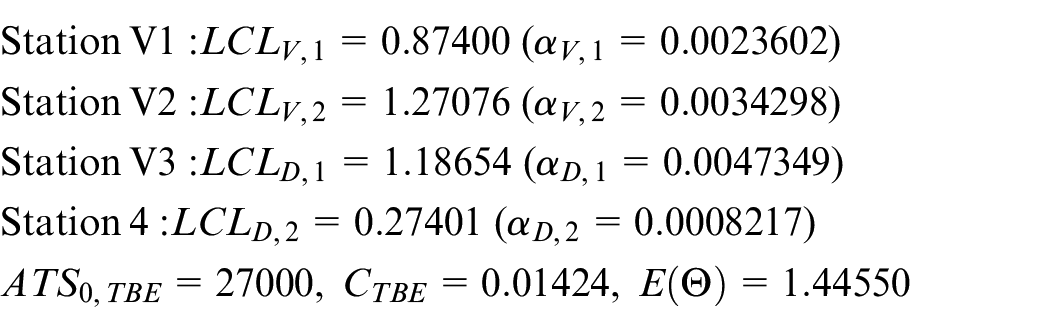
Furthermore, the index
Sensitivity analysis
First, the effects of reliability parameter
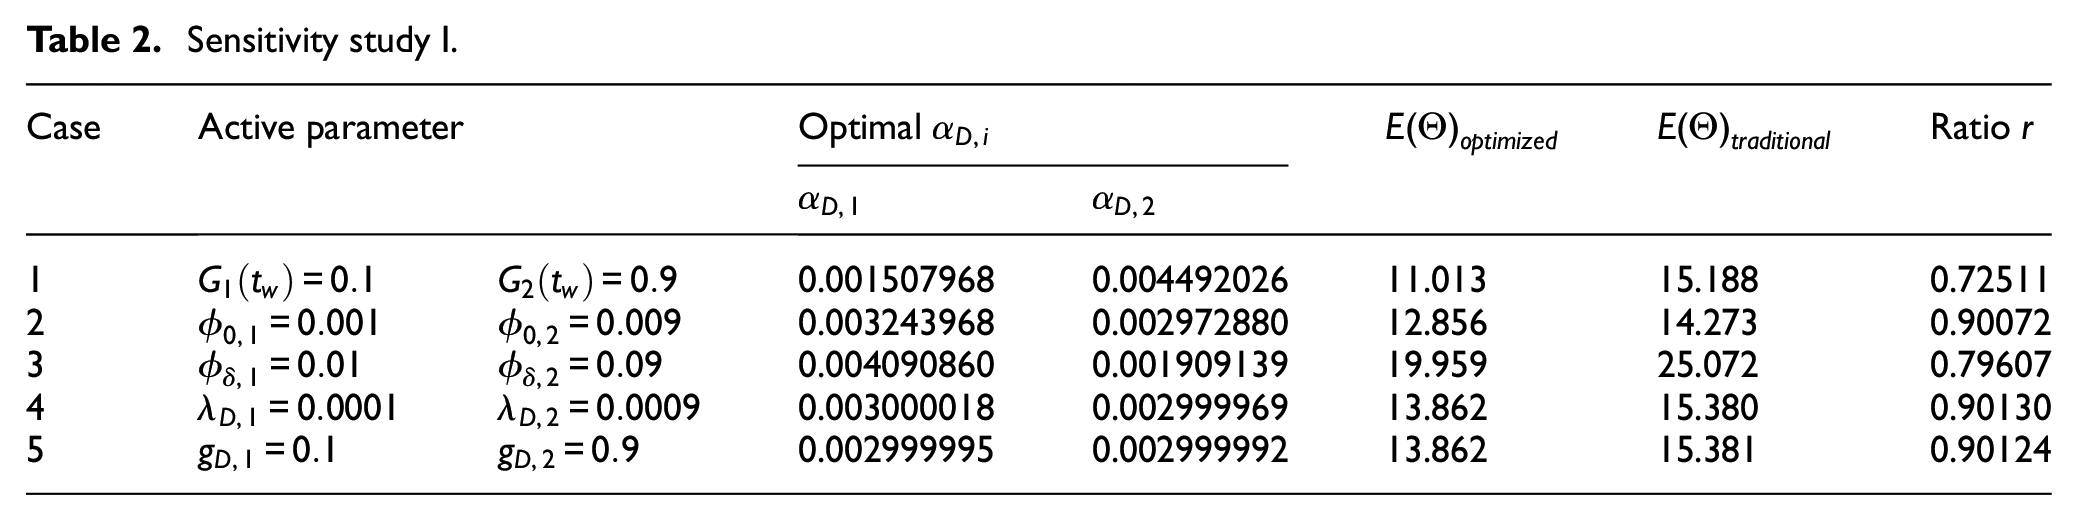
Study I
This section analyzes the effects of parameter
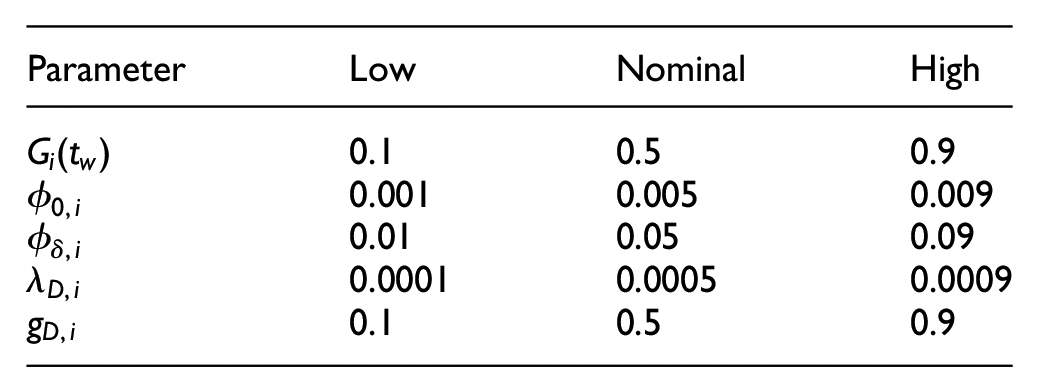
In each subcase, one selected parameter (active parameter) is set at its low value in Station D1 and high value in Station D2, and other parameters are set at nominal values in both stations. The cost parameters remain constant at
To describe the effectiveness of the optimized system, the ratio r is calculated as follows
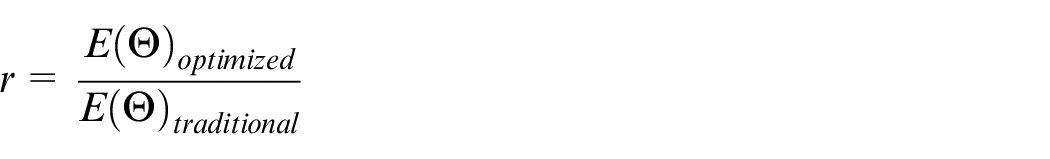
If the value of r is smaller than 1, then the optimized system will outperform the traditional system in terms of reliability degradation, and vice versa.
The results in Table 2 indicate that in all cases the proposed system shows an evident improvement in reliability-oriented control under different parameter combinations compared with the traditional system. In addition, based on Cases 1 and 3, the system performance is more sensitive to
Sensitivity study I.
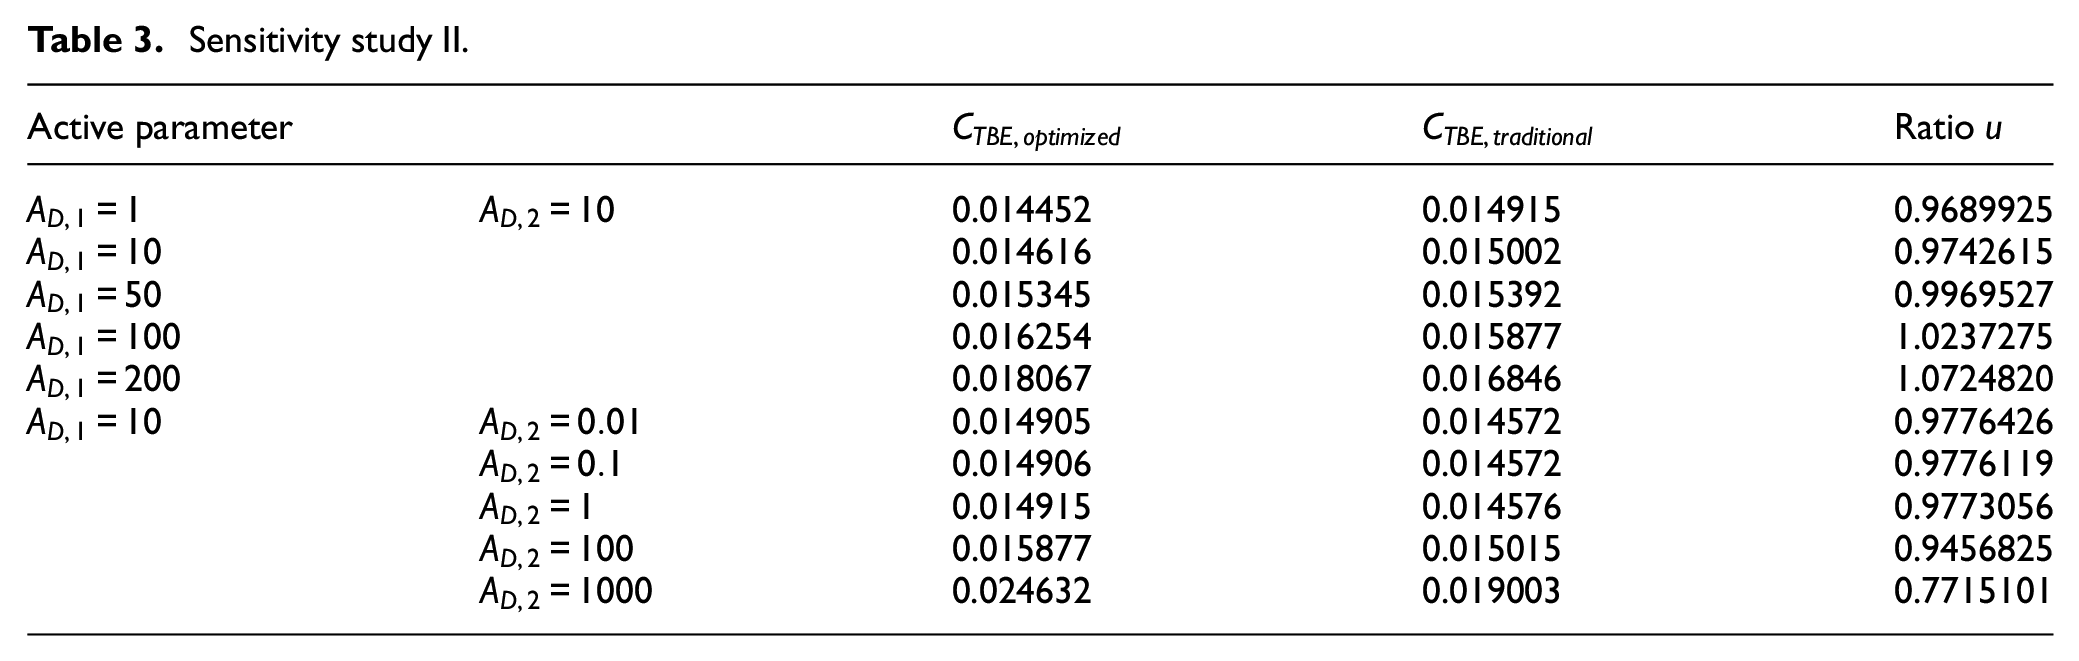
Study II
In section “Numerical example,” the results indicate that the proposed method may save operating costs while minimizing reliability degradation. Thus, this study is conducted to analyze this phenomenon.
Similar to Study I, only Stations D1 and D2 are involved. The used parameters are assumed as follows
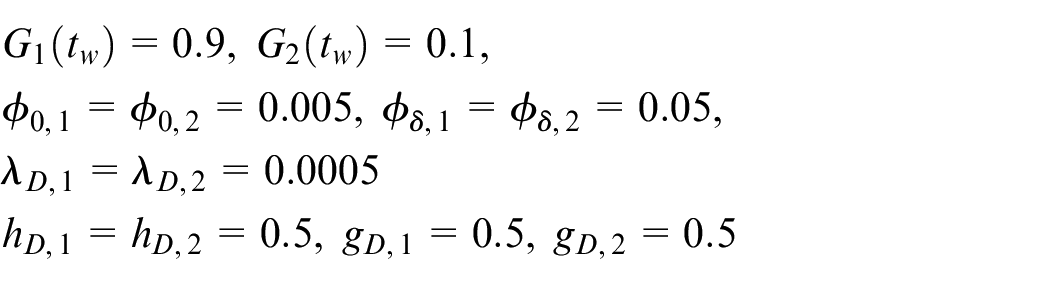
In actual conditions, most of the operating cost of a chart system derives from excluding false alarms, and this conclusion can be obtained based on equations (30) and (31). Thus, parameter
The ratio
Based on the results in Table 3, when
Sensitivity study II.
Conclusion
This article proposes an optimization design of the TBE chart system to reduce the product reliability degradation caused by manufacturing. By establishing the quantitative model between CTR process quality parameters (including dimensional variations and internal defects) and product reliability degradation, the control limits of each individual chart are jointly optimized to minimize batch reliability degradation in high-quality processes, and the proposed design is proved to observably improve batch reliability under different parameter combinations compared with the traditional design, which is derived from the complex but practical quality–reliability model proposed in this article. In addition, the proposed model can also save the system operating cost on the basis of achieving minimum reliability degradation in some cases, and this phenomenon is not rare.
On the contrary, this proposed optimization model also has two main limitations. The first one is that the application of this model may lead to slight increases in the system false rate and average operational cost, which are acceptable considering the model effect in reliability degradation mitigation. The second one is that the actual model of a specific system may be different from the model proposed in this study; however, the proposed optimizing procedure and ideology are generally applicable, which can adapt to different models.
Future works may focus on obtaining the optimal trade-off among chart operation cost, system false alarm rate, and batch reliability degradation. In our expected procedure, these three objects can be converted to the comprehensive control cost, which covers the manufacturing and usage stages of product lifecycle, and the related model is optimized to achieve the maximum possible manufacturing profit, where the product reliability is still a critical factor.
Footnotes
Declaration of conflicting interests
The author(s) declared no potential conflicts of interest with respect to the research, authorship, and/or publication of this article.
Funding
The author(s) disclosed receipt of the following financial support for the research, authorship, and/or publication of this article: This study was supported by the National Natural Science Foundation of China (Grant No. 61473017) and the general projects (Nos 6140002050116HK01001 and JZX7Y20190242012401) funded by the National Defense Pre-Research Foundation of China.