
Abstract
Production system modeling aims to investigate the principles of production procedures and to reveal the relationship between components and systems. Tremendous efforts have been devoted to production system modeling for the serial production system. However, most of the research focuses on the analysis of the systems at the steady state. Due to the emphasis of the quality management, production systems with rework loops are widely used in today’s manufacturing industrials, which the traditional approaches are not applicable to. Since the recent analysis of transients shows significant value and great potential in manufacturing systems, in this article, a new mechanism for rework is introduced based on the principles of quality management and lean production. A novel “Instant-Checking” method is developed to model Bernoulli serial production system considering rework loops. This method overcomes conventional restrictions and limited assumptions, and it extends the problem to systems with complex structures. Meanwhile, the analysis for transients is conducted to demonstrate relationships between component- and system-level characteristics. Finally, numerical experiments are performed to verify the effectiveness of the model.
Introduction
Over the past several decades, tremendous attention has been attracted to the performance evaluation of production systems. Production system modeling (PSM) has been conducted for the purpose of disclosing the relationships between component-level characteristics (such as machine reliability and buffer capacity) and system-level performance measures (such as production rate (PR) and work-in-process inventory (WIP)).1–11 PSM is essential for analyzing, disclosing and understanding the principles of production systems, which provides guidelines for plant managers to optimize and reallocate the configuration of production systems.11–16 Many production enterprises have benefited from PSM and related research. For instance, since 1990s, General Motors (GM) Corporation, one of the most famous automotive manufactures in the world, has applied PSM to the production activities in over 30 vehicle plants, such as estimating system performance, identifying throughput bottlenecks, optimizing buffer allocations and utilizing maintenance opportunities. Due to PSM, GM has gained revenue and saved over US$ 2.1 billion. 17
There are a lot of studies in the literature focusing on the performance analysis of manufacturing systems with PSM. Existing methods of PSM can be mainly grouped into two categories, simulation-based methods and analytical methods. In simulation-based methods, simulation models are widely adopted due to their accuracy in analyzing and demonstrating the performance of complex production systems. Yegul et al. 18 analyzed and improved the flow-type manufacturing system configuration in case of “reverse transfer of manufacturing system” (RTMS) with simulation-based optimization. Mustafa et al. 19 developed a simulation model for a food plant using Arena software to improve system performance by considering changes in facility layout and manufacturing complexity. Bako et al. 20 established a simulation model to validate the production processes and support production planning. Kuttolamadom et al. 21 conducted a study to determine process parameters for the multi-level multi-variable design space in titanium machining with high-performance computing (HPC). Otherwise, it is too difficult to be explored by physical experiments alone. Gilabert et al. 22 have presented how simulation tools can help identify a new predictive maintenance approach to the cost–benefit analysis of the product life cycle or plant productivity. Li et al. 23 presented a simulation-based statistical approach to predict a new job’s flow time through the system. However, specific knowledge is needed in the establishment of simulation models, and the formulated models have low flexibility to the layout changes. In addition, it tends to be more time consuming and costly for the simulation models to obtain the simulation results. Last but not least, based on the simulation results, it is difficult to capture the fundamental mathematical principles of systems, and the misinterpretation of the simulation results leads to the incorrect methodology. The extra cost is incurred when the methodology is applied to the practical production systems.24–26
Compared with simulation-based methods, analytical methods can analyze the systems with less computational time and reveal the fundamental mathematical relationships between system parameters and performance measures, which makes it a faster and more promising alternative to be widely used in PSM.27,28 Li et al. 29 present an analytical continuous-time Markov chain approach to model a repair system with rotable components for resource allocation. The analytical results in the literature30–33 work for the two-machine-one-buffer (2M1B) production systems. The method proposed in Wang et al. 34 is applicable in the production systems with multiple machines in parallel or the production systems with just a single machine. Sader and Sorensen 35 implemented a PSM for two-machine lines with multiple failure modes. Nevertheless, it is harder to establish mathematical models for complex production systems by analytical methods. Exact analytical results are only available for the 2M1B production systems, the systems with infinite buffers and the systems without buffers.2,3 Therefore, analytical methods are adopted to perform PSM for a serial production system in this article.
In the literature mentioned above, there is a common assumption that the production quality remains perfect during the production horizon. However, in practice, it is not always the case. 36 Production systems with rework loops are commonly seen in today’s manufacturing industries, such as steel, pharmaceutical, semiconductor, garment, glass and food. 37 Hadjinicola 38 proposed a modeling framework integrating the Markov chain and systems with rework loops to estimate the manufacturing cost. The buffer capacity is assumed to be infinite in their study. Helber and Jusic 39 presented a decomposition technique for a production system with multistage rework loops. The throughput performance is attainable with this method. Based on the assumptions, the defective products were sent back to the same workstation for rework. Li 40 put forward an overlapping decomposition method jointly with an aggregation procedure to assess the production performance of systems with rework loops. And the evaluation is implemented at the steady state. Cao et al. 41 developed a new three-machine-one-buffer model to decompose a production system with multistage rework loops. In this model, defective products were transferred back to upstream workstations associated with the defect for reprocessing. The performance evaluation was performed at the steady state as well.
Conventionally, the analysis of PSM for production systems is conducted at the steady state to obtain the performance measures. Recently, there are a few researchers analyzing the effect of transients on the serial production lines. Transients indicate the behaviors of the systems before reaching a steady state or the transfer from one steady state to another, during which the mean values of the performance parameters are changeable, and can be quite different from those under the steady operating conditions. 42 The study of transients connects different parameters within the production systems together. It is helpful to depict both the relationships and the performances for the systems during transients. According to existing research, immense valuable information is hidden in transients. All this information can be provided for the design of new production systems and the continuous improvement of the current system. For instance, sufficient production capacity margins are guaranteed to ensure customer satisfaction. Meerkov et al. pointed out in Li and Wu 30 that the transients account for an approximately 12% production loss for a manufacturing system with an 8-h shift. To summarize, research on transients is essential both academically and practically. Nevertheless, unlike the fact that substantial studies have been devoted to the analysis of the systems at the steady state, PSM for transient performance is less studied and further development is needed. Meerkov and Zhang 30 conducted a transient analysis for a 2M1B Bernoulli production system. Gökçe et al. 43 proposed an analytical model for transients, in which machines were assumed to be reliable during the production. Wang and Li 5 put forward a model focusing on an M-machine-N-buffer serial Bernoulli production system with finite buffer capacity, and the performance of the system is evaluated both at the steady states and during the transients. Ge et al. 11 proposed a novel “Self-View” method to estimate the performance measures of Bernoulli serial production lines with the single rework loop both during transients and at steady states.
Admittedly, there is growing attention on either modeling systems with complex structure or analysis on the transients. Nevertheless, there still exists a need to develop analysis models to integrate these two problems together. To begin with, many decomposition methods aim to analyze the principles of the complex systems. But most of them focus only on the systems in the steady-state conditions, ignoring the influence of the transients. Besides, the current analytical methods for production systems with a rework loop are limited in assumptions. For instance, in practical production systems, machines are not 100% reliable and the buffer capacity is not infinite, while in most of the research, these two elements are assumed to be 100% reliable and finite. Furthermore, the multistage rework loops are widely used in real production systems rather than a single directional rework loop. In a word, motivated by the status quo mentioned above, based on the principles of quality management, a novel inspection mechanism is introduced in this article, which differs from the traditional ones. That is, once a defective product is detected, it will be sent back to the last workstation for reprocessing. And then it can flow into the downstream buffer zone for further processing when it is checked as qualified. This mechanism is feasible due to the rapid development of many high-level and new technologies, such as the machine vision technology. In addition to that, a new “Instant-Checking” method for PSM is proposed to investigate the performance of the complex production systems during transients. Some of the system’s characteristics are taken into account, such as machines’ operating states, buffer capacity and rework rate.
The proposed method for PSM in this article contributes to research in this field mainly from two aspects. On the one hand, the mathematic model established in this article overcomes the conventional limited assumptions by removing the restrictions and extending the problem to the production systems with multiple unreliable machines and finite buffers. On the other hand, a novel method based on probability theory and Markov chain is proposed to formulate the actual dynamic transition process of the transients, revealing relationships between component- and system-level characteristics.
The remainder of the article is organized as follows. Section “Problem formulation” details the framework and the assumptions of the production systems with multiple rework loops. A model consisting of multiple unreliable machines and finite buffers is established. The core “Instant-Checking” method will be introduced in section “Modeling of the production system with multiple rework loops.” In section “Case studies for transient analysis,” numerical experiments are presented to evaluate the performance measures and further discussions on the optimization will be provided. Section “Conclusion” summarizes the conclusions, application and future research.
Problem formulation
A novel serial production system with multiple rework loops is shown in Figure 1. Machines are denoted by rectangles and buffers by circles. The system consists of N machines and N – 1 buffers. It is made up of a main serial production line and multiple rework loops.
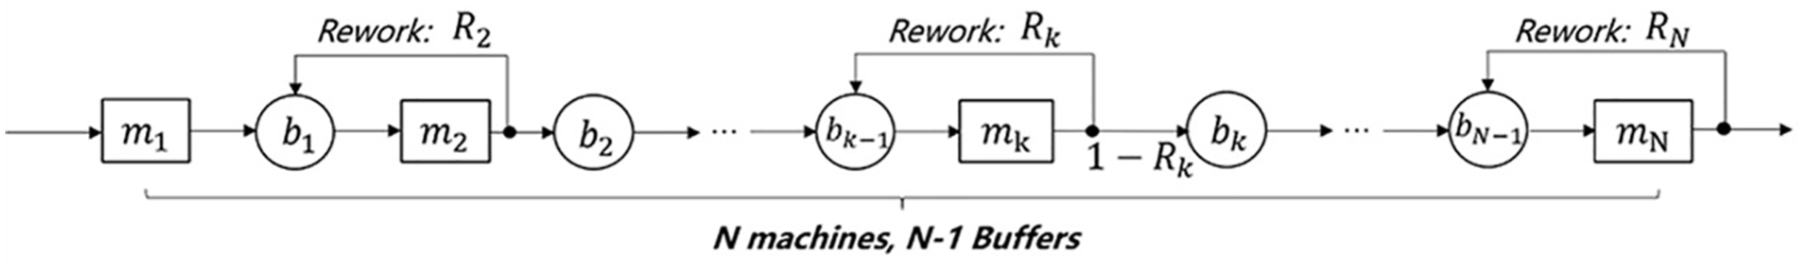
A production system with multiple rework loops.
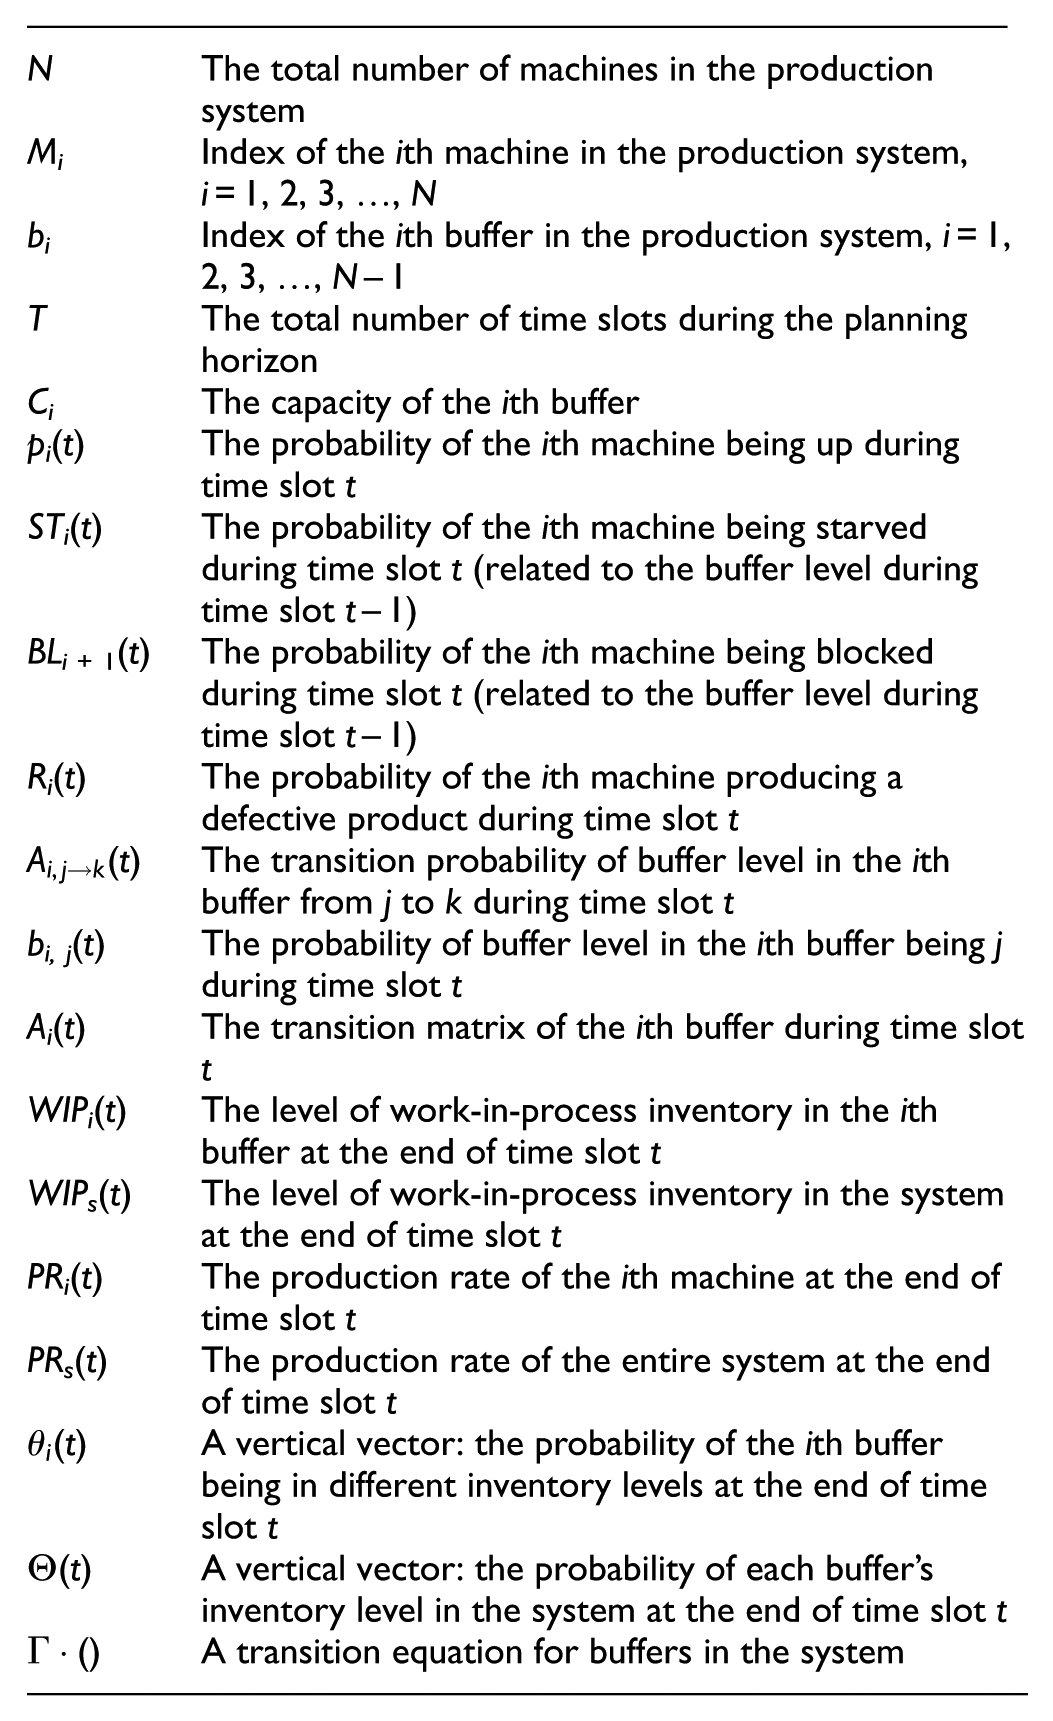
For convenience, the following notations are adopted in this article:
To model a production system with multiple rework loops clearly, the basic assumptions are listed as follows:
The production time is divided into T time slots following a uniform distribution. Each time slot is equal to the cycle time of the machine. The time slot is denoted as term t in this article. Each machine runs at its rated speed when it is operational, neither starved nor blocked.
The time-independent failure convention is adopted in this article. Machines in this production system are assumed to be Bernoulli machines, which means that each machine operates at a reliability of pi and breaks down at a rate of 1 – pi.
Inspection errors in machines are neglected and products are perfectly reprocessed during the rework process, which means that products flowing into the downstream are all without defects.
Each buffer is finite with a maximum capacity denoted as Ci (i = 1, 2, 3, …, N – 1) and its state can change at most by one product during each time slot t.
The blocked-before-service (BBS) convention is adopted in this article. 44 BBS means machine mi is assumed to be blocked if machine mi is up at the beginning of time slot t, but its downstream buffer bi is full and its downstream machine mi + 1 fails to extract one product from buffer bi.
Whether a machine is blocked or starved depends on the states of its upstream or downstream machines and buffers. Assuming that one machine is operational, if its downstream buffer is full and its downstream machine is down, it is blocked; if its upstream buffer is empty and its upstream machine is down, it is starved.
The first machine in the production line is assumed to be never starved and the last machine is assumed to be never blocked in this article.
Conflicts may occur in the rework loops. 32 In this article, to avoid this problem, it is assumed that products from rework lines have a higher priority than those from the main production line. It indicates that the buffer would not take a product from the main production line until no products exist in the rework loops.
Modeling of the production system with multiple rework loops
The “Instant-Checking” method
Inspection machines or inspection stations usually exist in production systems with rework loops. Conventionally, once a defective product is detected, it will be transferred to some specific workstation for reprocessing. Based on the principles of quality management and lean production, a new mechanism for inspection and rework is introduced in this article. That is, when a product is processed, before flowing to the downstream buffer for further processing, an inspection work is triggered instantly. If the product is proved to be qualified (the inspection error is not considered), it will be transferred to the next downstream buffer for further processing; otherwise, it will enter the rework loop and be sent back to the last upstream buffer to be reprocessed. As a result, the rework process can happen in every machine during the production. The problem is to formulate the mathematical relationships between buffers and machines. Thus, a novel “Instant-Checking” method is proposed to formulate the mathematical model for such systems. Elements like the buffer’s capacity, the machine’s reliability, machines’ states and rework rate are all integrated into such systems. In order to analyze the performance measures (WIP and PR) of such a system, the method puts an emphasis on the transition of the buffer’s occupancy and establishes a transition matrix for the whole system.
Notations of machines and buffers’ states
To illustrate the transition of buffers’ states during production in a clearer way, notations of machines and buffers’ states are adopted in this section as follows:
For a machine Mi (i = 1, 2, 3, …, N), during time slot t,
{Mi
{Mi
{Mi
{Mi
{Mi
{Mi
{Mi
{Mi
{Mi
{Mi
{Mi
{Mi
{Mi
{Mi
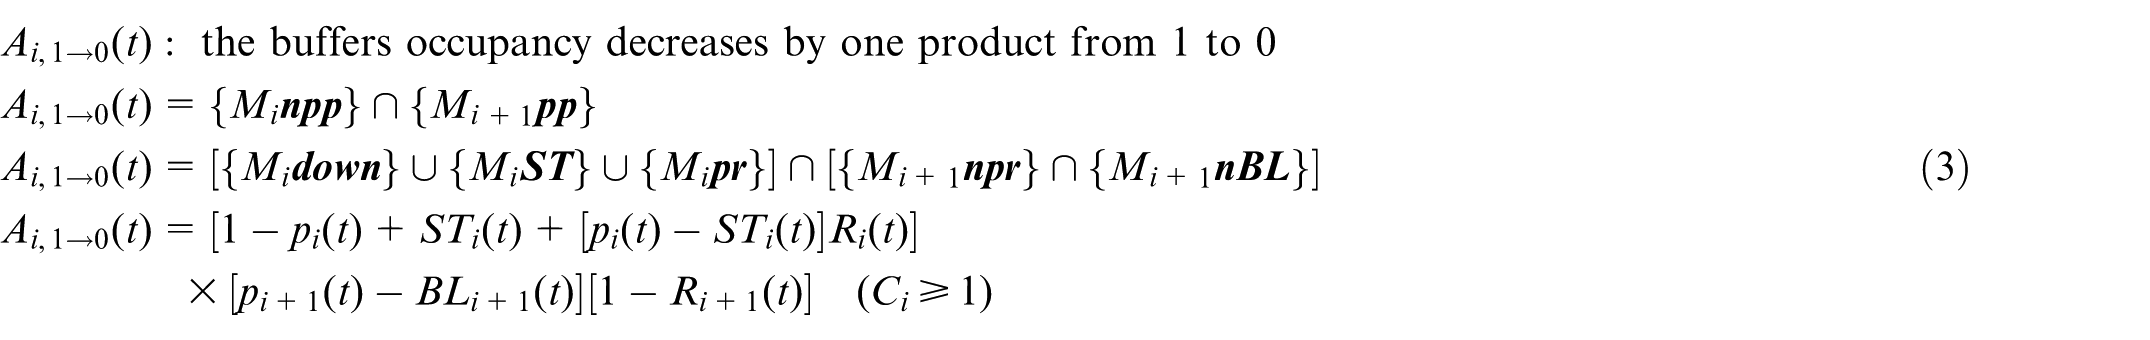
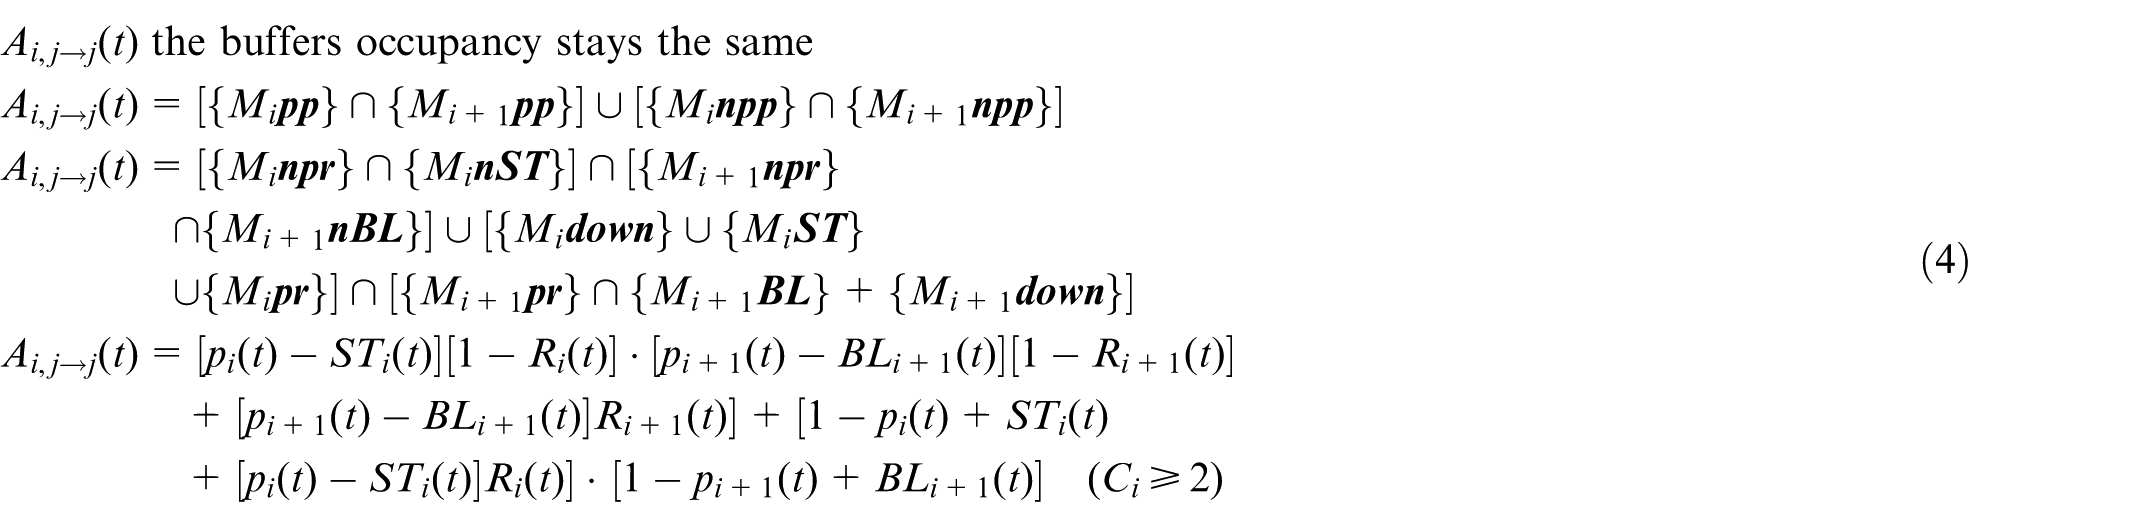
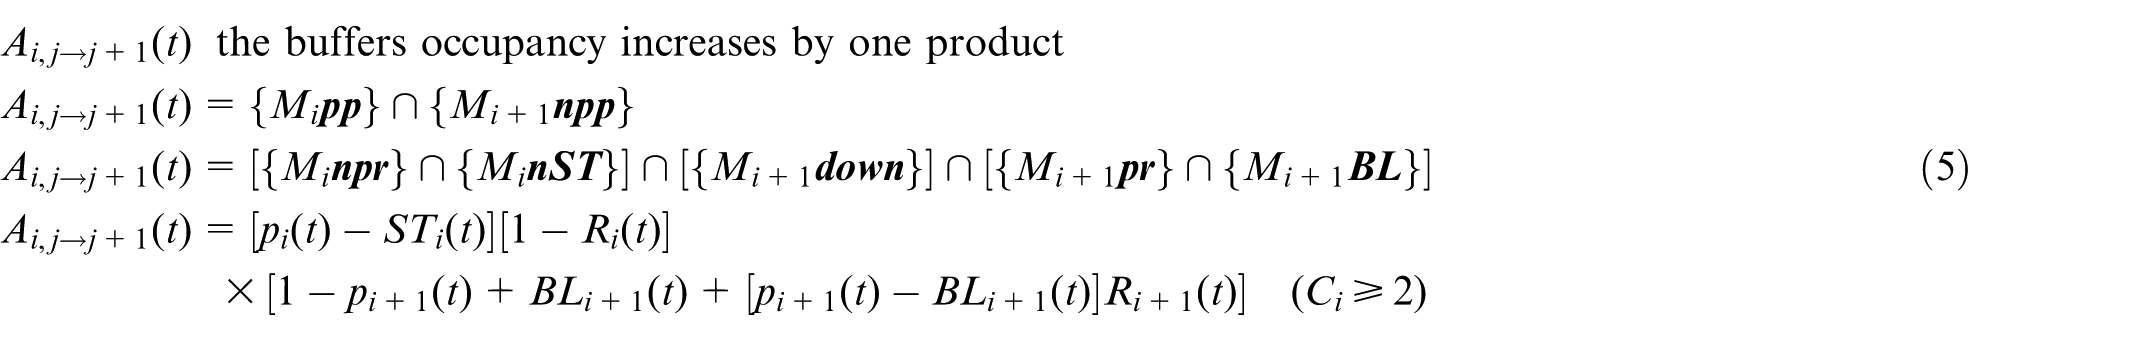
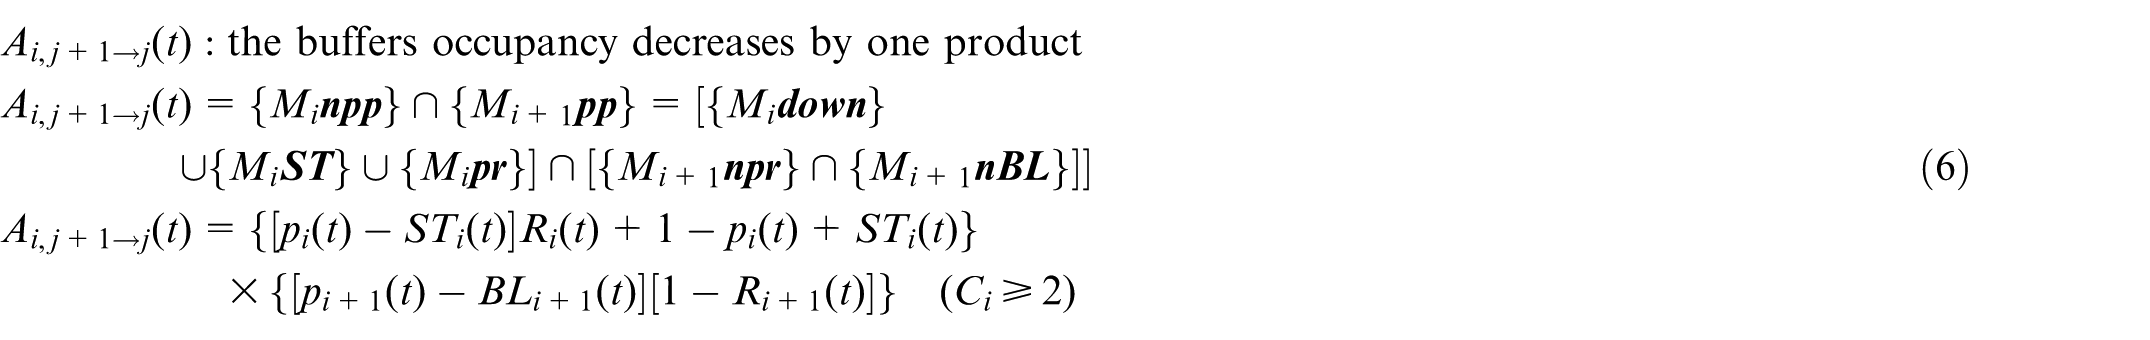
The transition equation of each buffer during each time slot
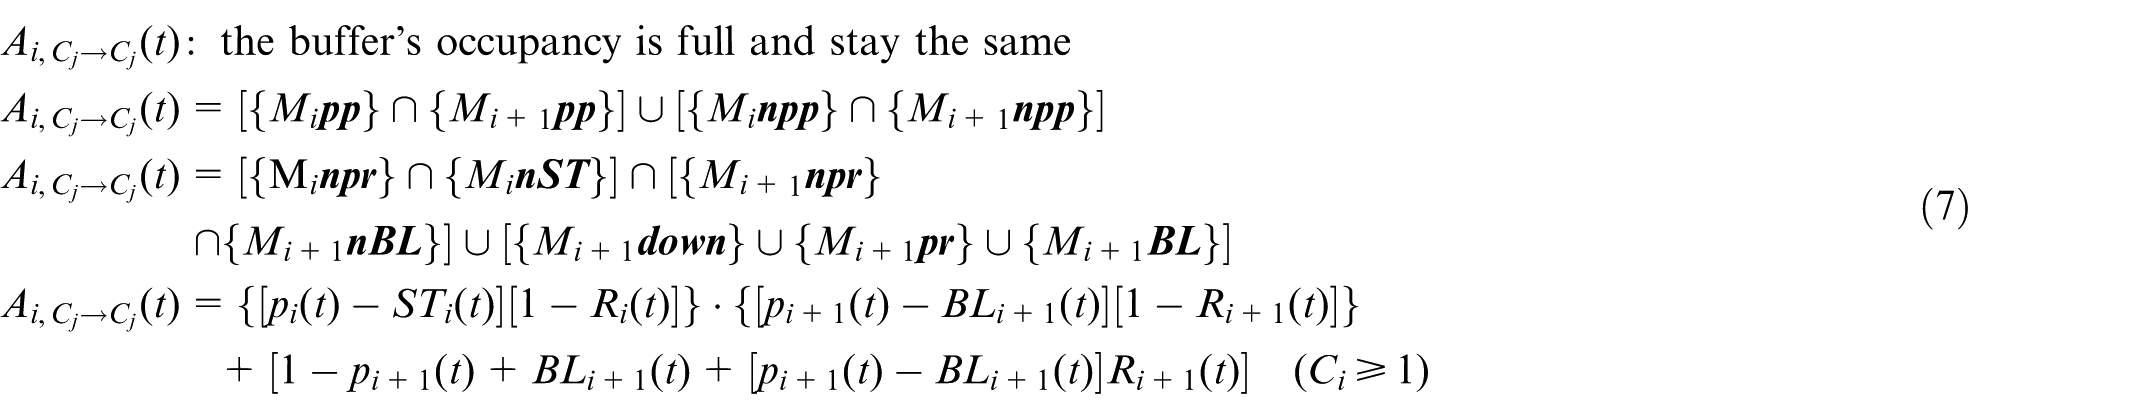
According to the assumptions, the buffer’s occupancy changes at most one product during each time slot t, so each buffer’s occupancy is feasible to be quantified considering the states of its adjacent machines and buffers. And different from the most studies in this field, the rework rate has been taken into consideration in our research. Therefore, the transition equation of each buffer’s occupancy from time slot t – 1 to time slot t can be written as follows
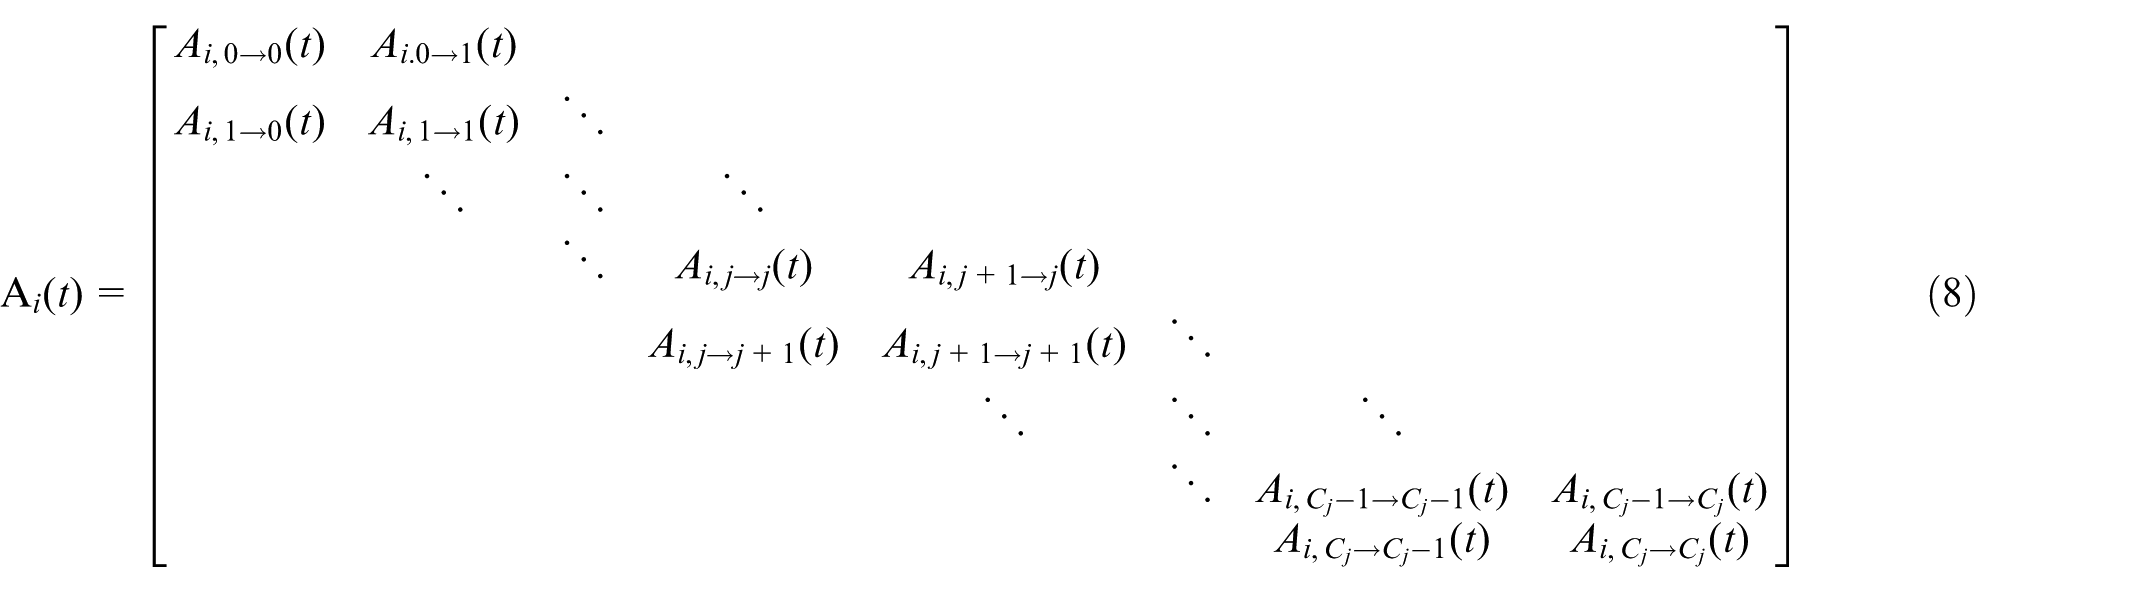
To summarize, the transition matrix for buffers’ occupancy during time slot t can be represented as equation (8)
The mathematical analysis of the transition matrix
When the time slot is from t – 1 to t, the buffer level of buffer i will change from k to j by at most one product (e.g. k = j or k = j – 1 or k = j + 1). According to the total probability theory, the probability for buffer i to be in state j can be derived as
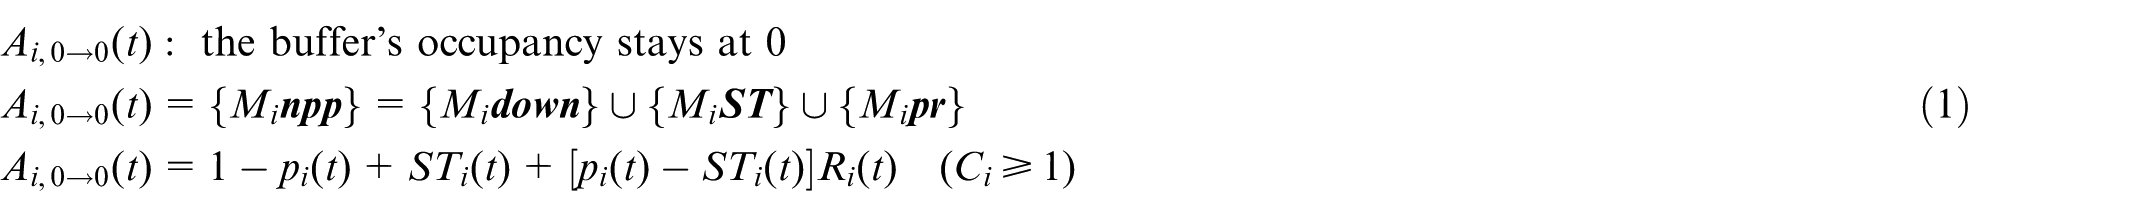
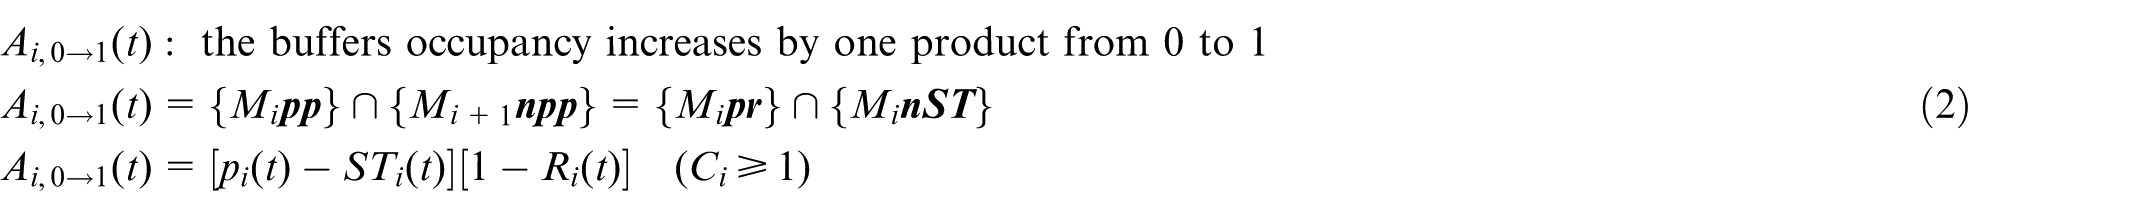
For buffer i, the probability in state 0, 1, j, Ci can be derived as shown in equations (9)–(13)
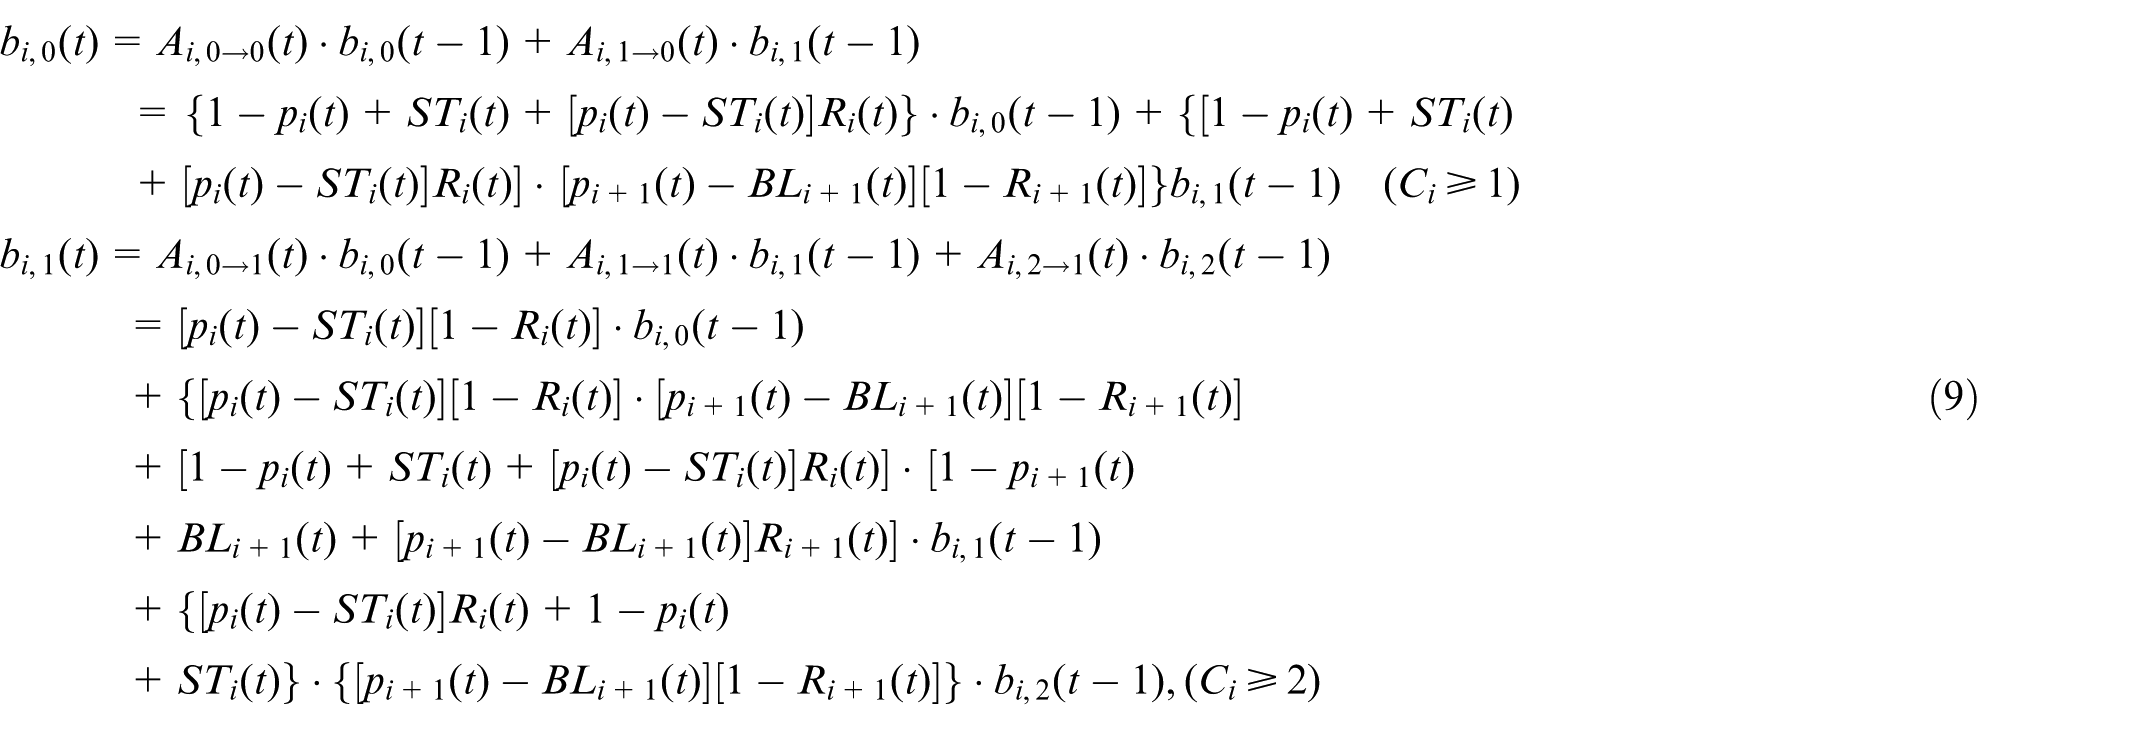
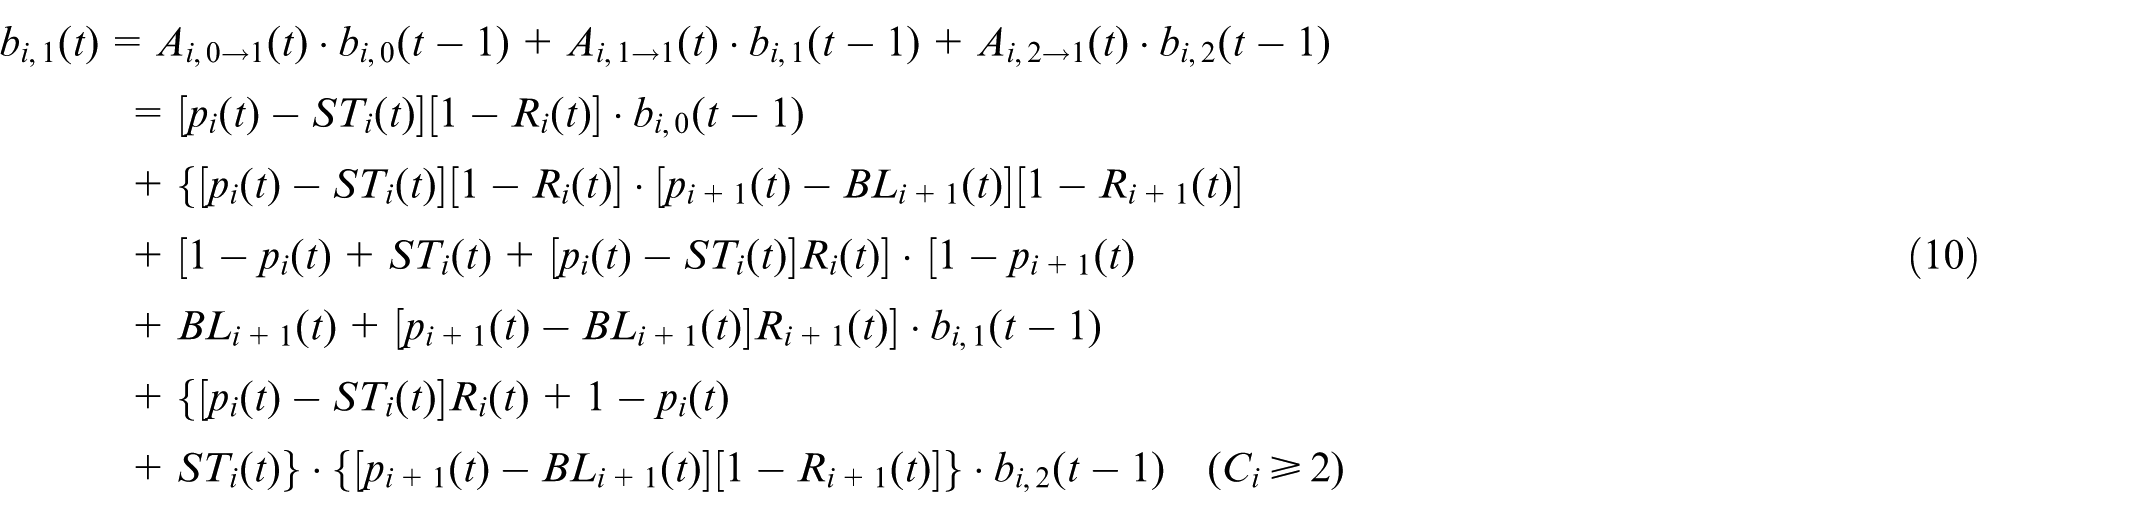
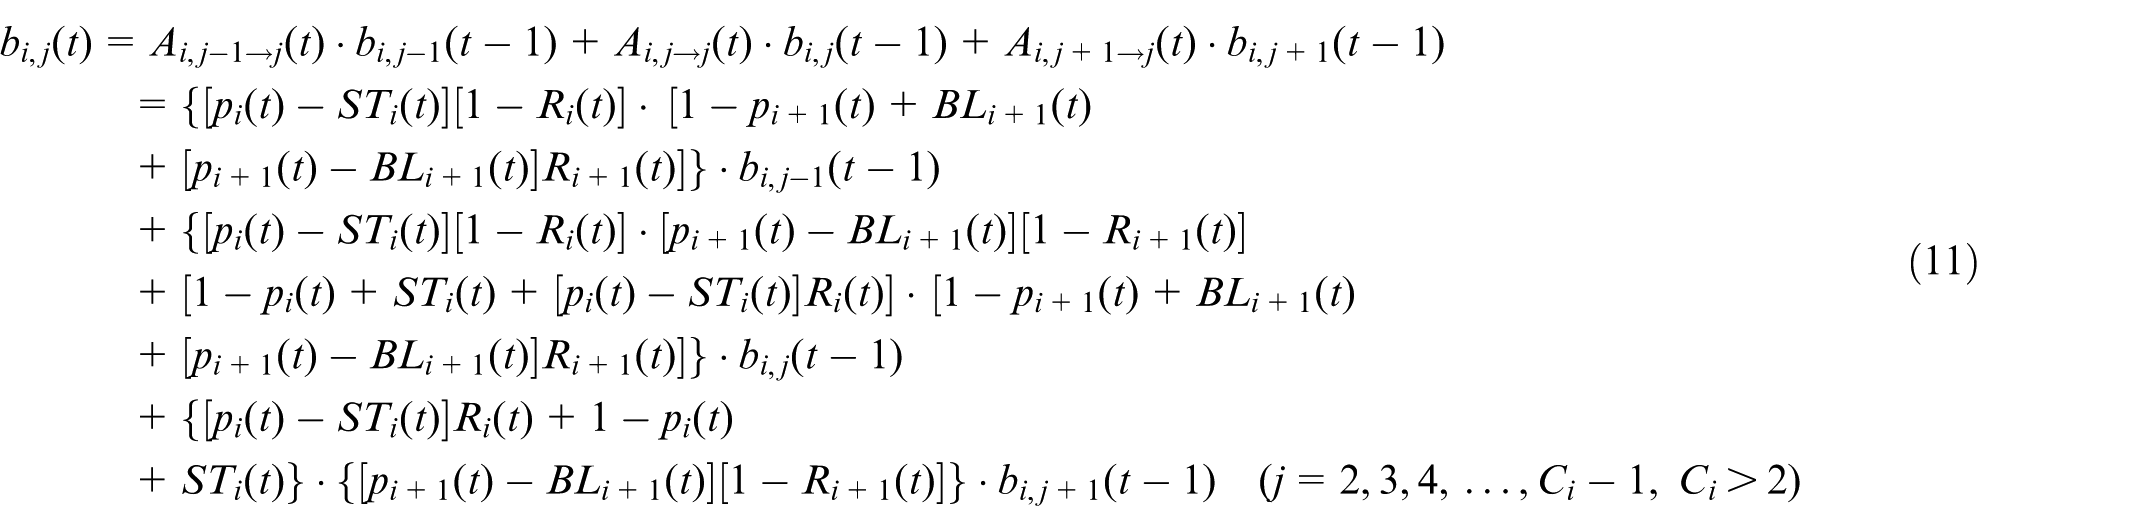
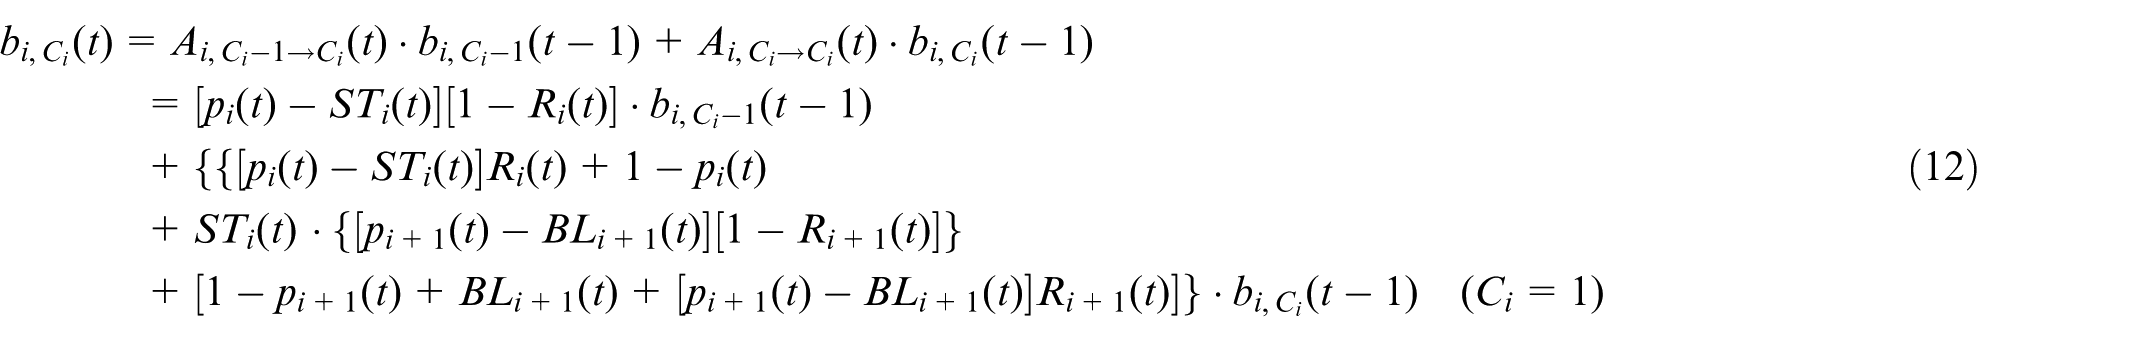
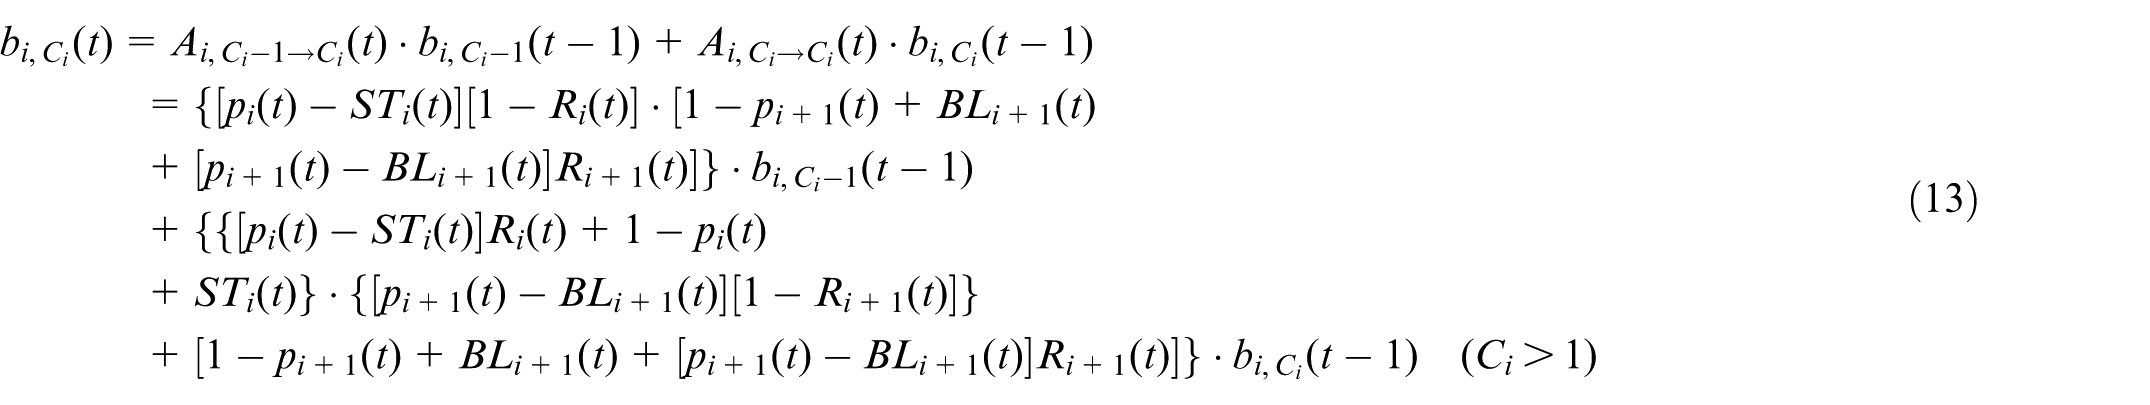
For the buffers to be in state Ci, there are two possible transition ways for the buffers to meet its capacity: one is from Ci – 1 to Ci and the other is from Ci to Ci. If the buffer’s capacity Ci is set to 1, the special situation, where the buffer level changes from 0 to 1, should be considered. When the buffer level is 0, the buffer is assumed to be empty. The downstream machine is regarded to be starved and the downstream machine’s state has no influence on the transition (equation (12)). On the contrary, when the buffer’s capacity Ci is set to be larger than 1, the downstream machine’s states need to be taken into consideration because it is not always starved (equation (13)).
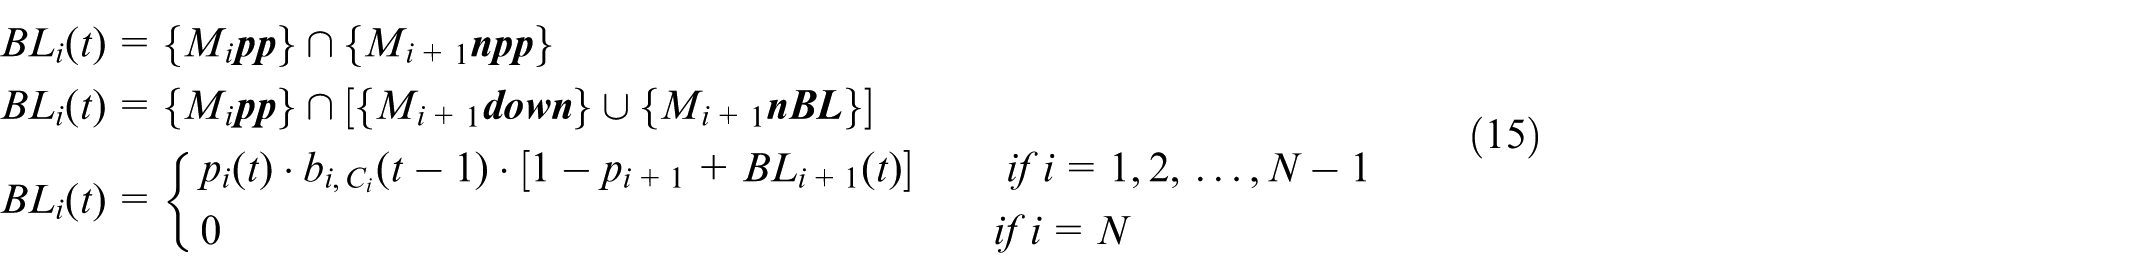
According to the definitions of starvation and blockage, the probabilities for starvation and blockage during time slot t can be derived as follows

Define a column vector for time slot t
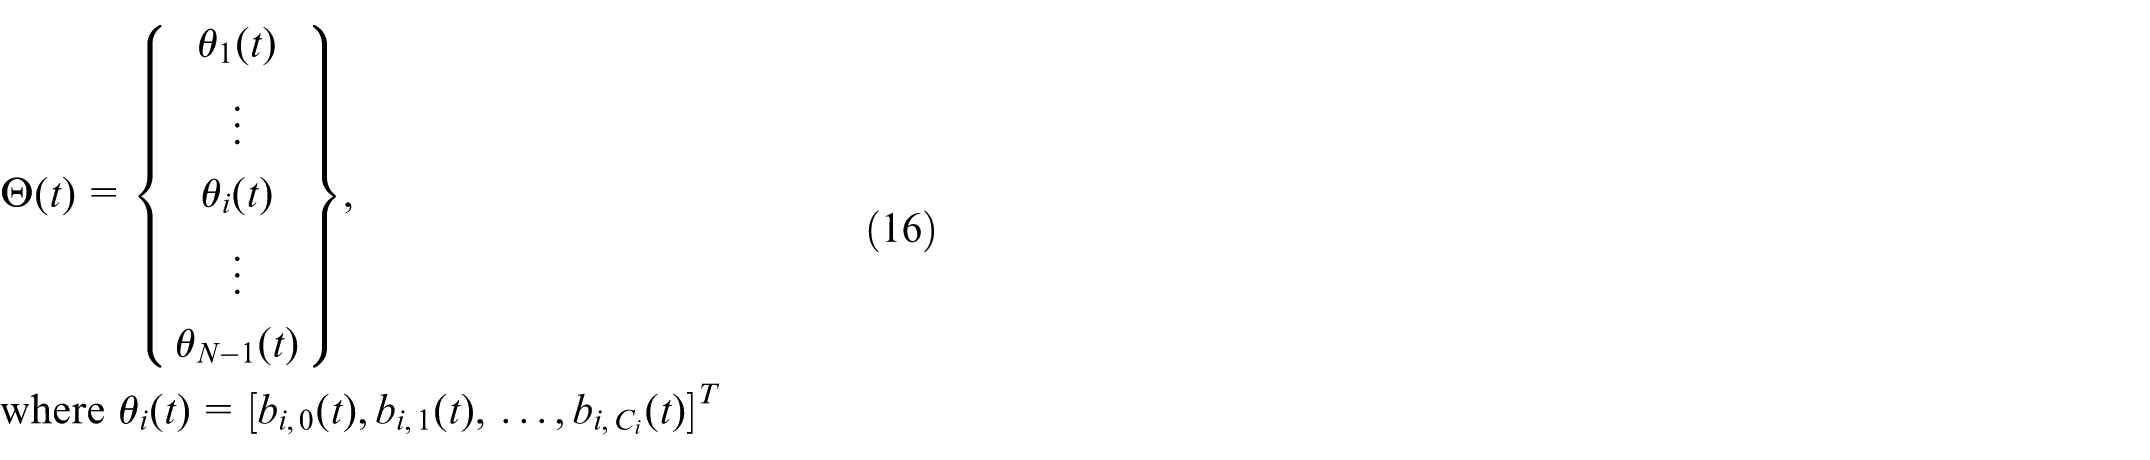
The initial value for

The buffer state probability during time slot t can be used to calculate the buffer state probability distribution during time slot t + 1. And equation (17) can be solved by the fixed-point method. 12
Performance measures
Two important performance measures are considered in this article, WIP and PR, both of which are relevant to the buffers’ states. According to equation (17), the probability for each buffer in each state can be obtained, and the expressions of the two performance measures can be derived as shown in equations (18)–(21).
At the end of time slot t, the WIP of buffer i is

the total WIP of the system is formulated as

the PR of machine i is

and the PR of the system is equal to the PR of the last machine in the serial line production system

Case studies for transient analysis
In this section, numerical studies have been conducted to verify the effectiveness of the novel “Instant-Checking” method for PSM. In the following numerical investigations, the control variate method is adopted to investigate the relationship between system’s characteristics and the performance measures through the transient analysis of the production system with multiple rework loops. The target is to find out how the performance measures vary with the different values of the different variables and how changes of the system’s characteristics affect the systems’ WIP and PR.
The computer configuration used in this article is Windows 64-bit system, Intel® Core™ i5-7200U CPU of 2.50–2.70 GHz and 4 GB memory.
Numerical investigation #1
In this part, in order to find out the basic rules between the system’s characteristics and the performance measures, a set of experiments have been implemented to measure WIP and PR of the system.
Seven scenarios have been proposed as shown in Table 1. The rework rate and the reliability are assumed to be 0.1 and 0.9, respectively. The values of WIP and PR at the end of the time slot are listed in columns 5 and 6, respectively. Based on Case 1, the evolution of WIP and PR for these cases is presented in Figures 2–7.
Numerical results of the production rate and WIP.
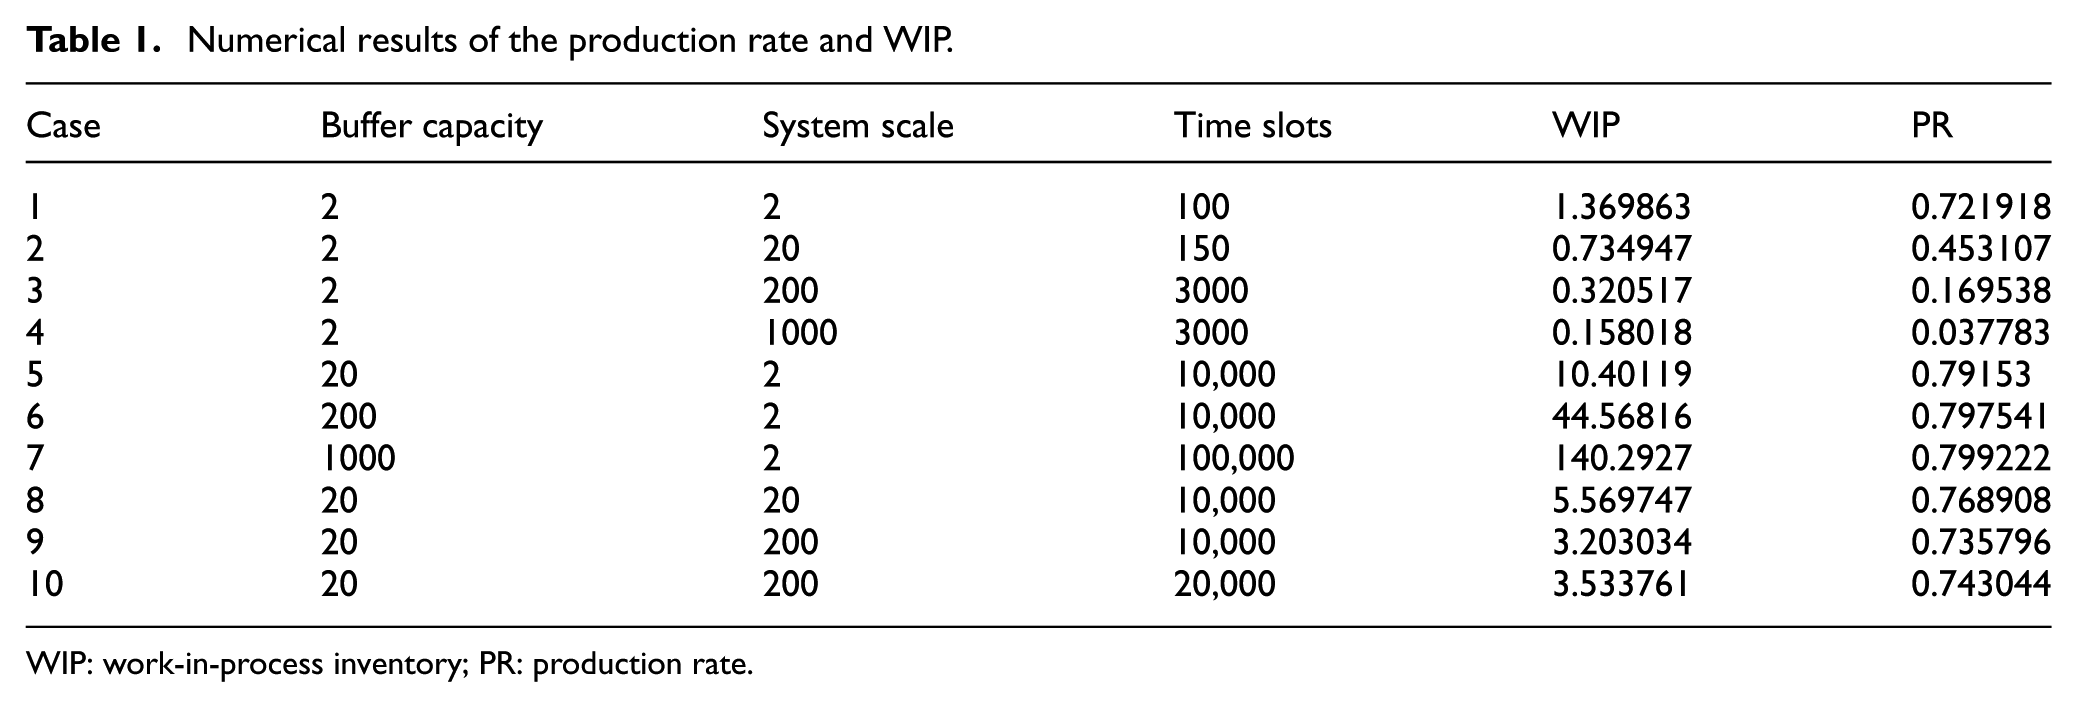
WIP: work-in-process inventory; PR: production rate.
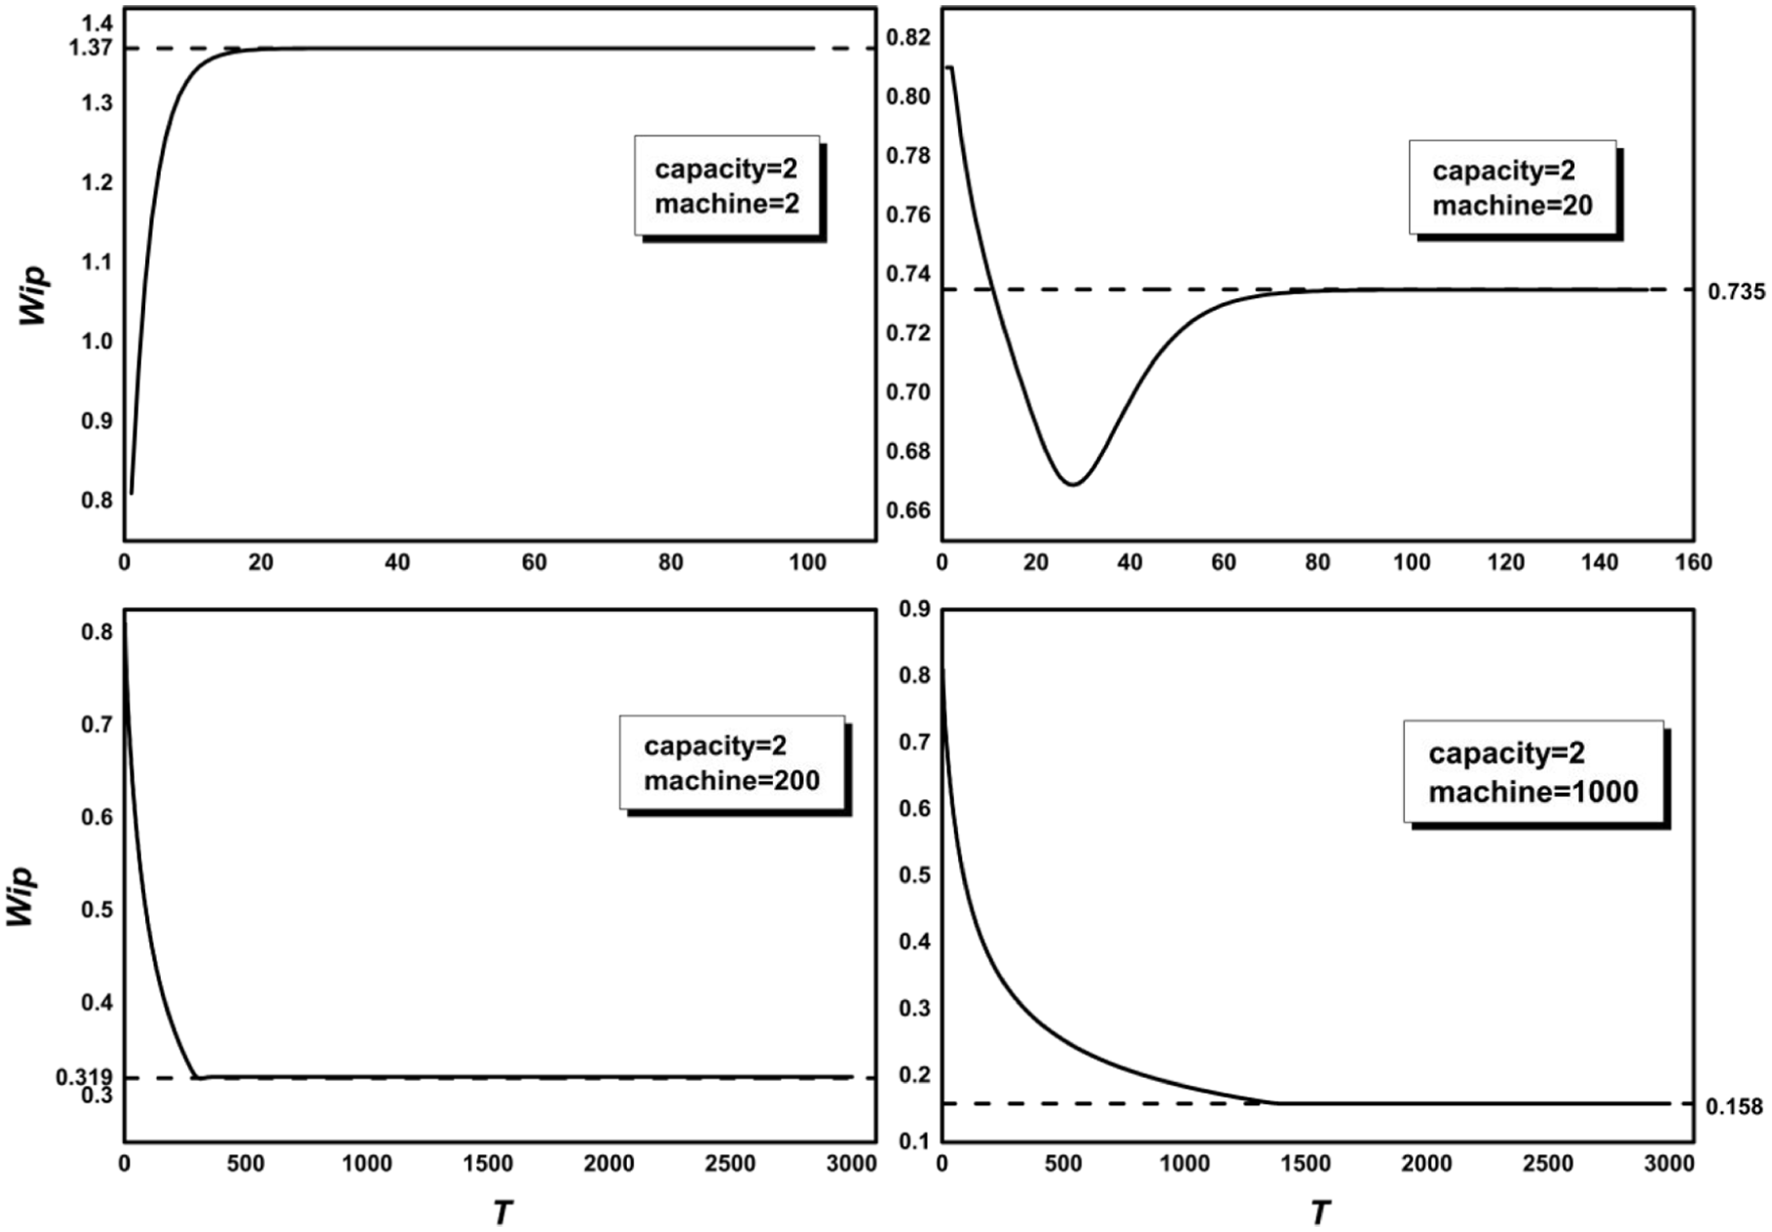
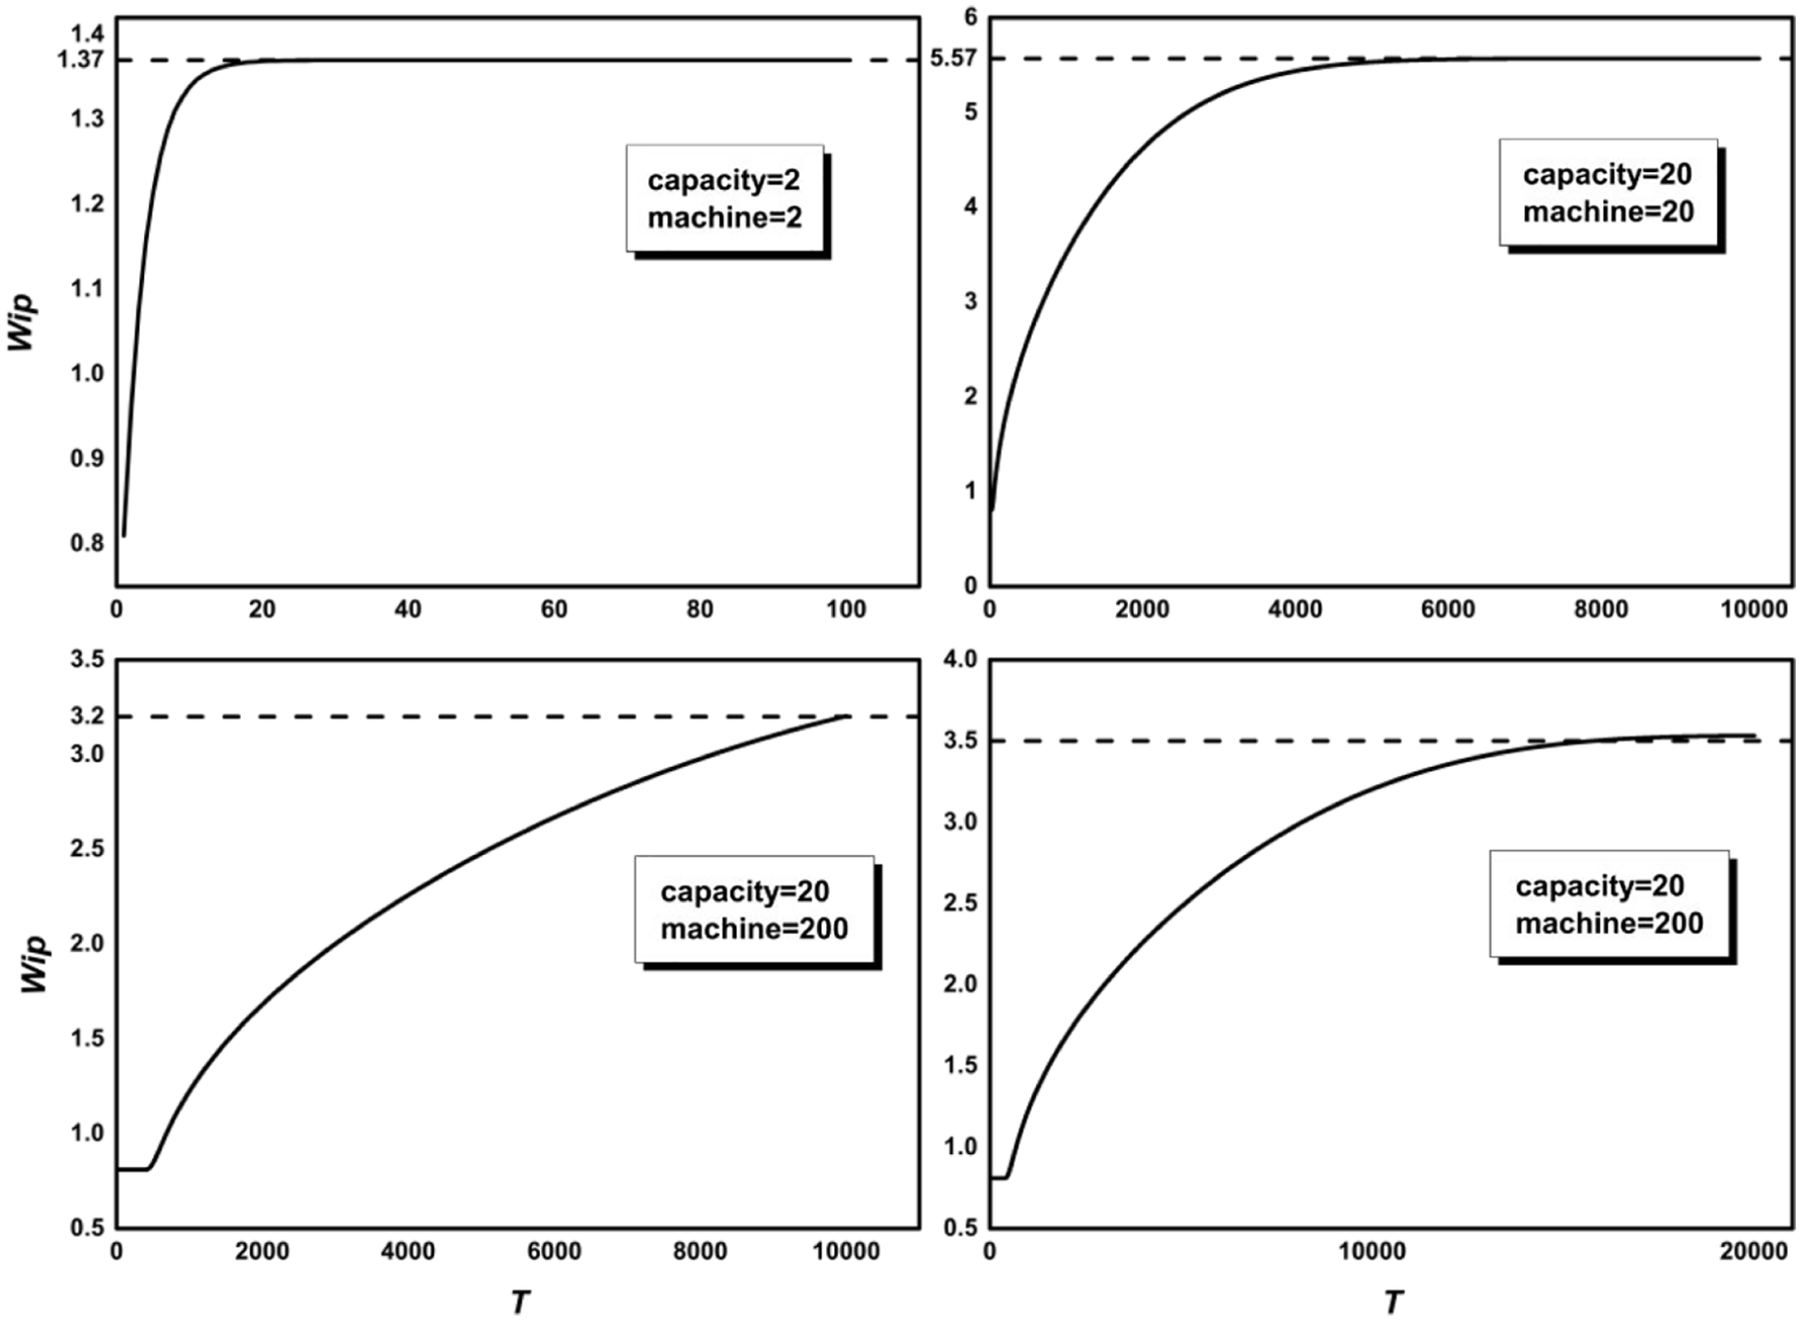
The evolution of WIP for Cases 1–4.
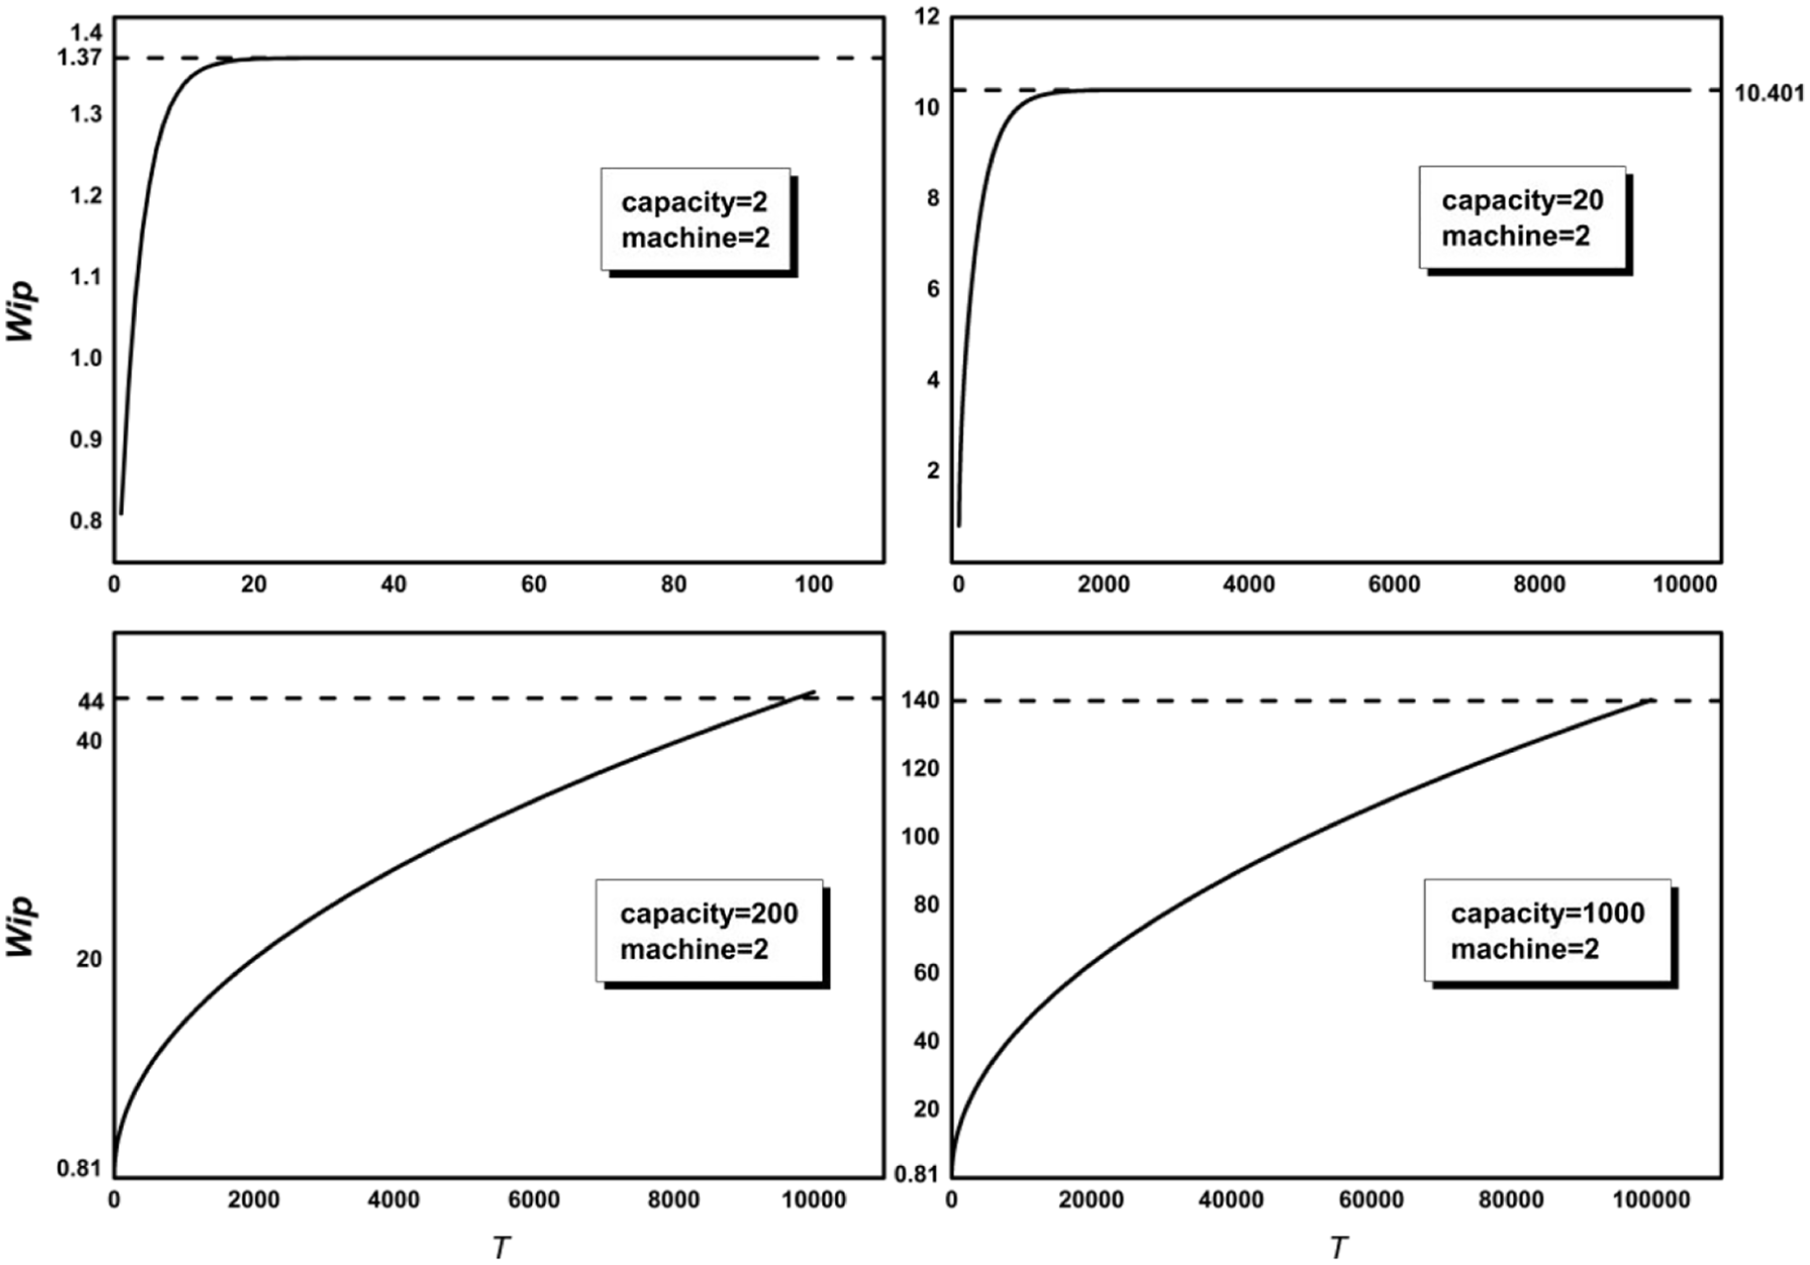
The evolution of WIP for Cases 1 and 5–7.
The evolution of WIP for Cases 1 and 8–10.
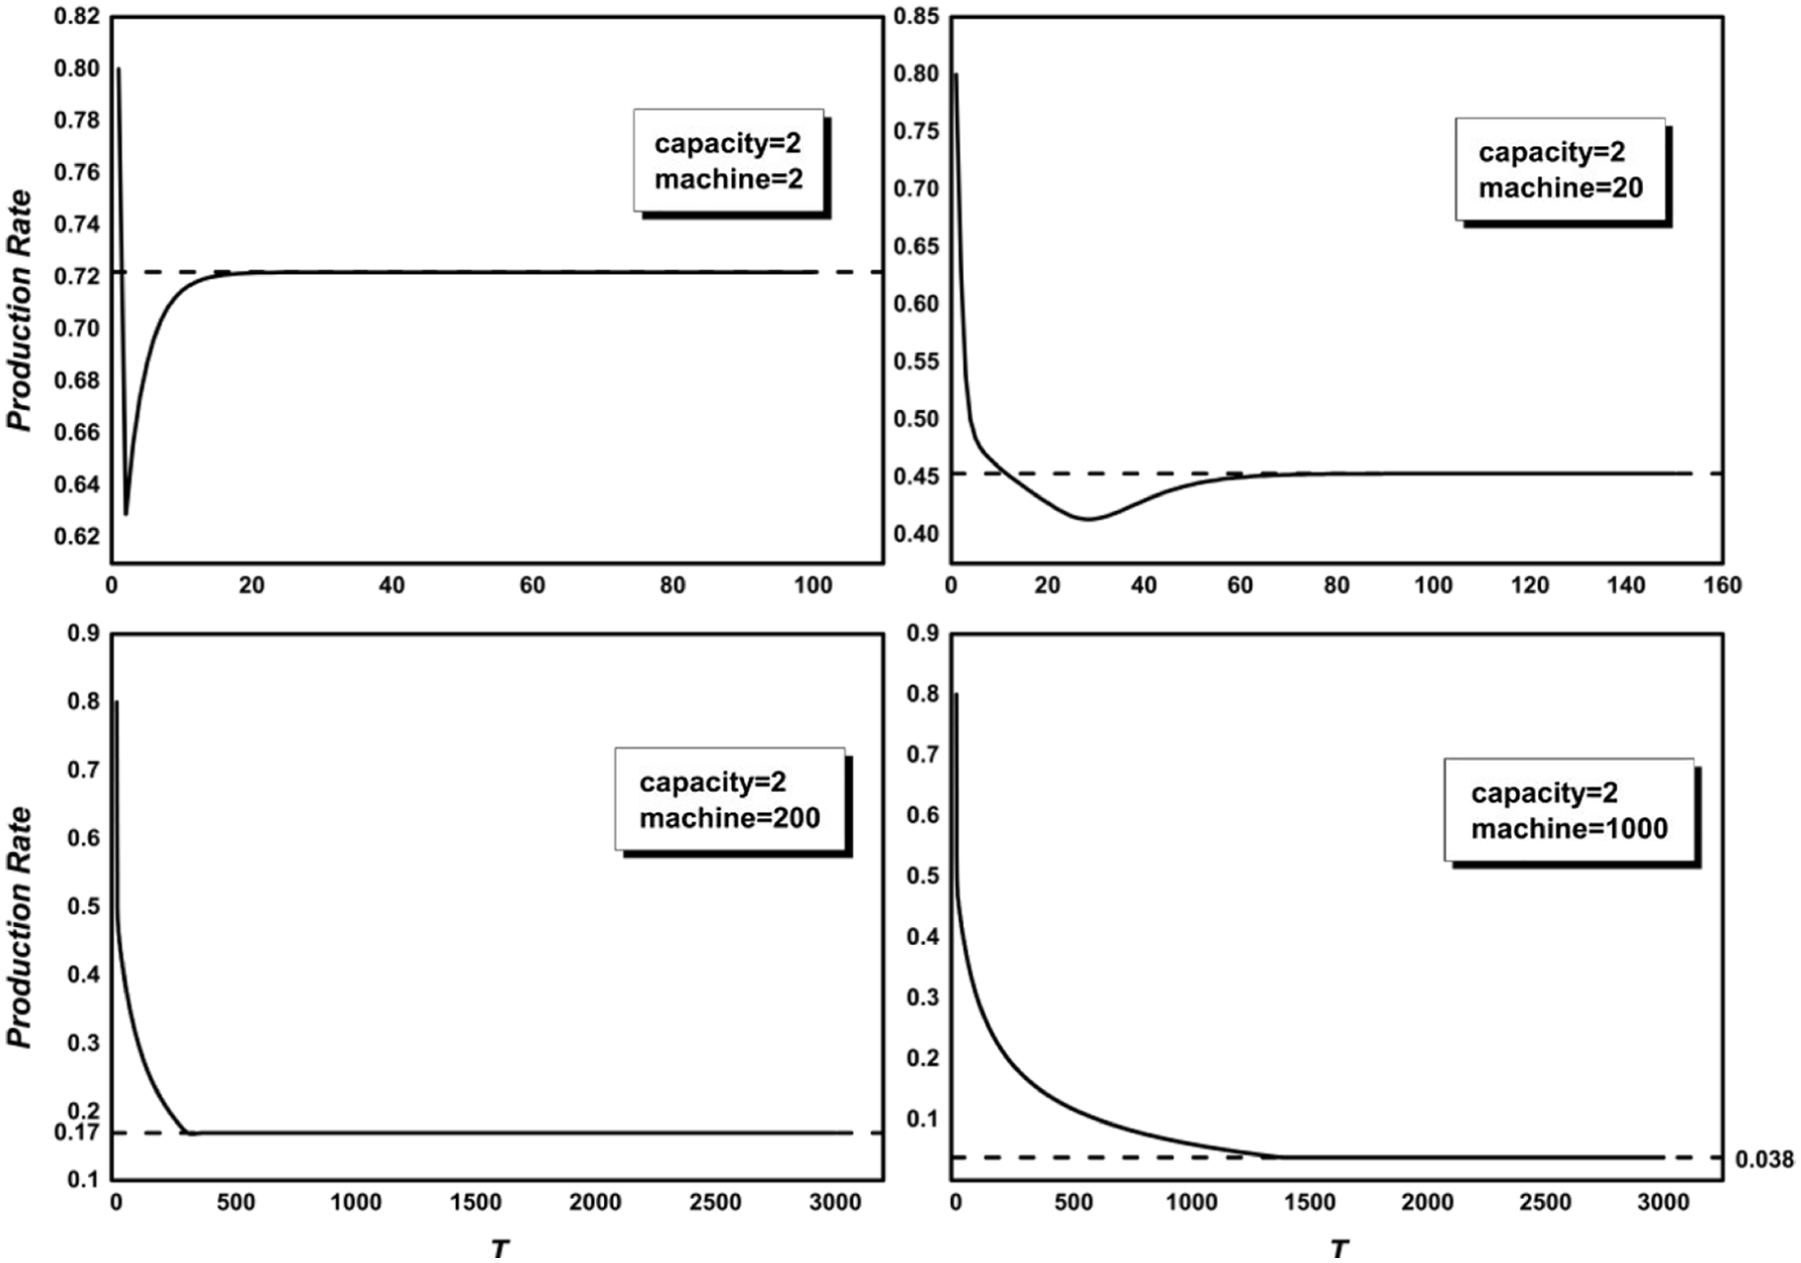
The evolution of the production rate for Cases 1–4.
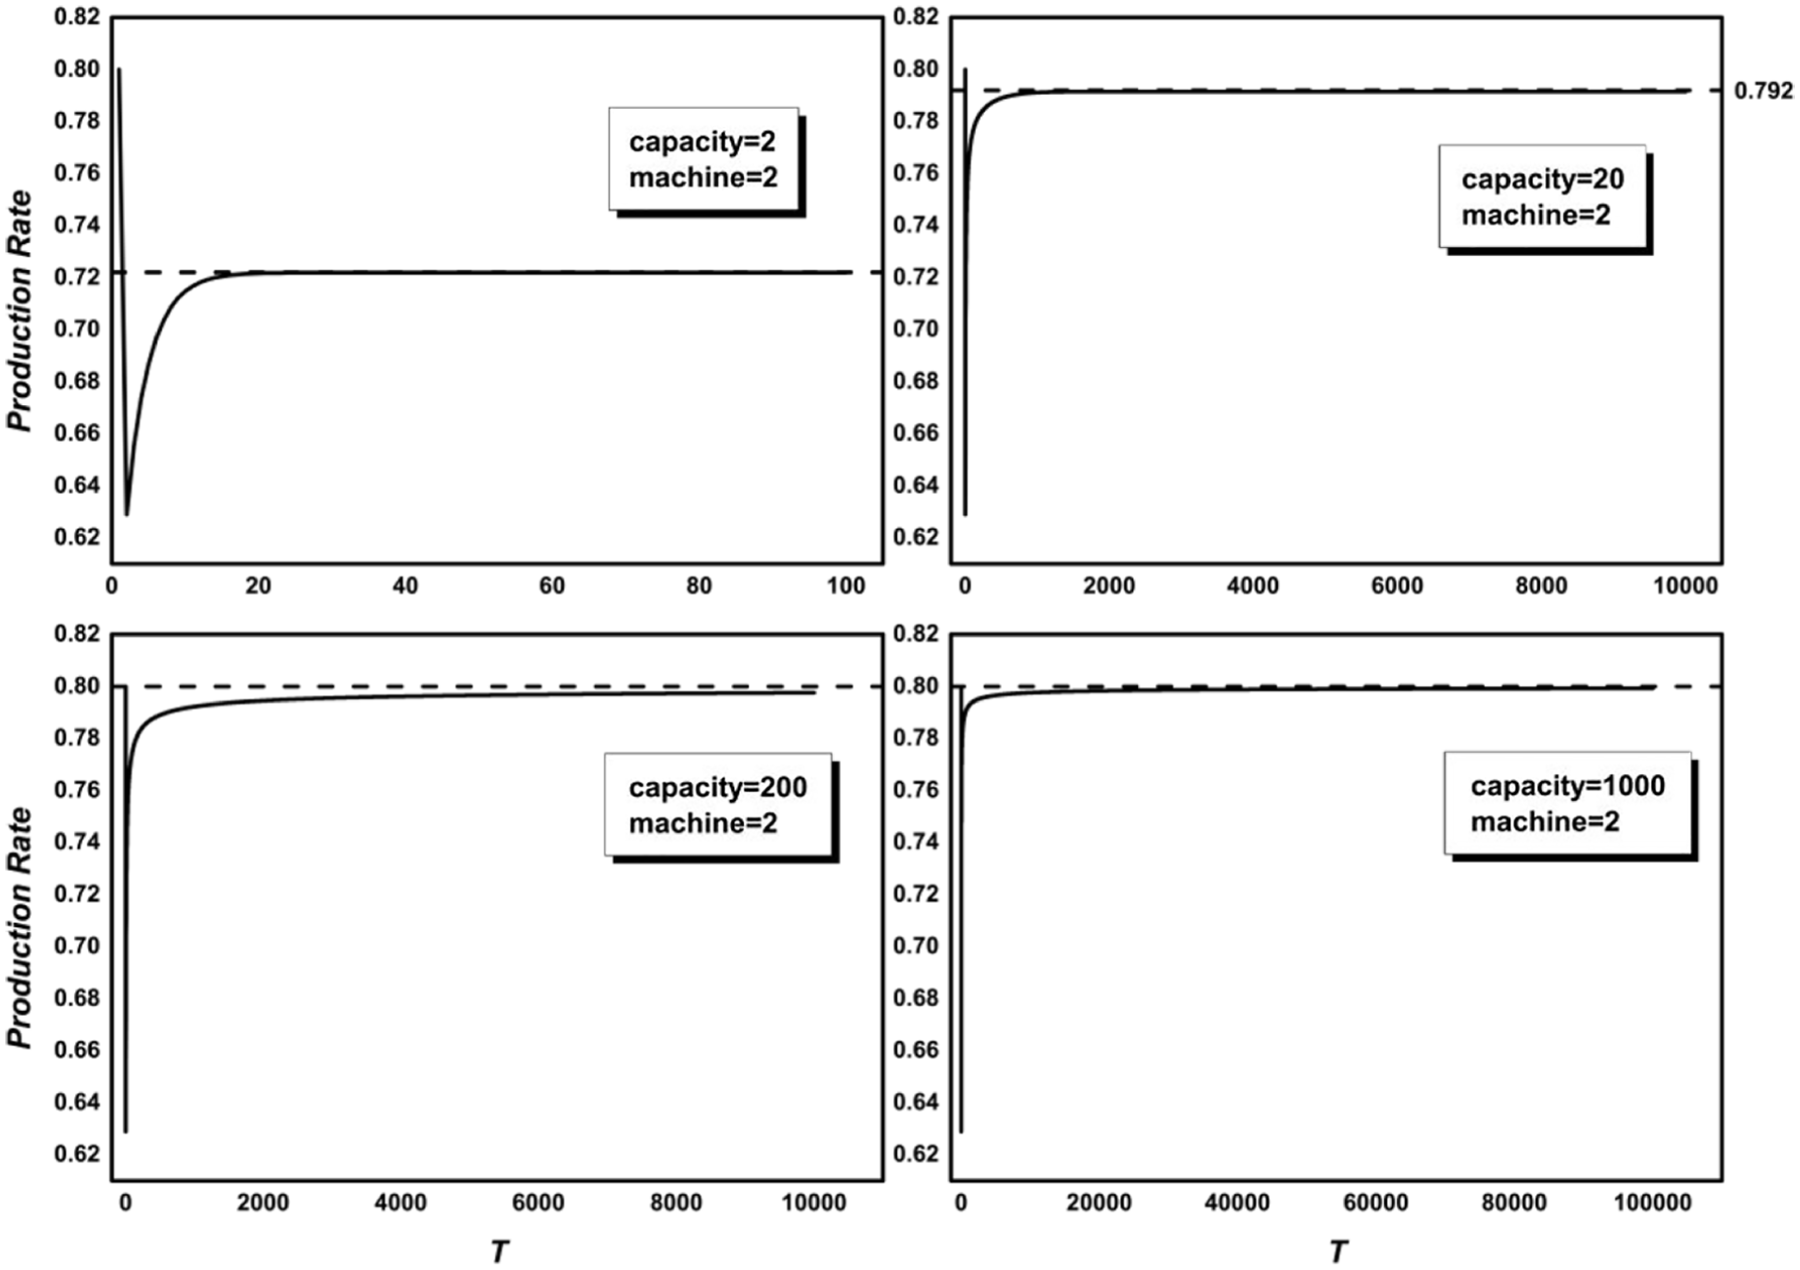
The evolution of the production rate for Cases 1 and 5–7.

The evolution of the production rate for Cases 1 and 8–10.
Based on Figures 2, 3, 5 and 6, either of the parameters, the buffer capacity or the number of machines, is kept constant at 2 and the other parameter is set to 2, 20, 200 and 1000. The definition of the settled value is introduced here. It represents a constant value at which the curve will converge. As shown in the figures, as the buffer capacity or the number of machines increases, it takes a longer time for the system to reach its steady state. From Figures 2 and 3, the settled values of WIP become smaller with the increase of either the buffer capacity or the number of machines, so as the settled values of the PR in Figures 5 and 6. That is, both the performance measures, the settled values of WIP and the PR, are affected by the buffer capacity and the number of machines. It means that both the buffer capacity and the number of machines can be a constraint to the system’s performance.
Remark 1
Both the buffer capacity and the number of machines in the systems have a non-negligible influence on the performance of the system.
Remark 2
With a higher buffer capacity and a larger number of machines in the production systems, the settling time for WIP and PR tends to be longer.
According to Figures 4 and 7, the performance of the system has changed greatly as the buffer capacity and the number of machines increase. As shown in Figure 4, when the buffer capacity and the number of machines are both set to 2, the performance of WIP is better. As the two parameters increase, the system’s WIP is higher. Nevertheless, a better performance is represented for the PR when the buffer capacity and the number of machines are set to 20. To summarize, it is inferred that when one of the parameters is set to constant, there is an alternative to the production system to achieve better performance.
Remark 3
The buffer capacity is relevant to the number of machines in the system. With the determined buffer capacity value, there exists a paired value for the number of machines, so that the system could achieve better performance, and vice versa.
Numerical investigation #2
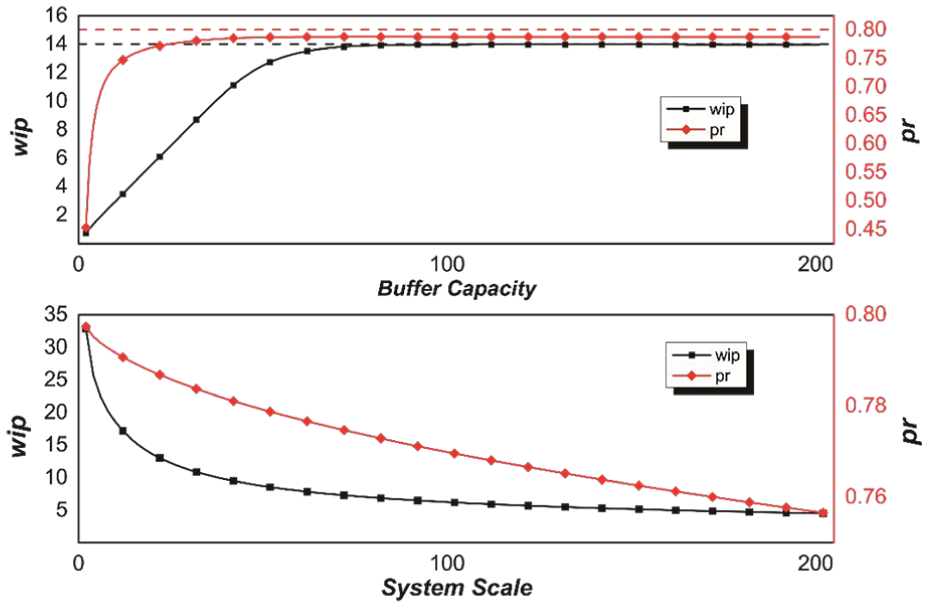
Here, numerical investigation #2 is performed to support Remark 3. Two numerical results are represented: one is to keep the number of machines in the system constant at 20 and the buffer capacity from 0 to 200; the other is to keep the buffer capacity of each machine constant at 65 (according to numerical investigation #1) and the number of machines in the system from 0 to 200.
As shown in Figure 8, in each numerical study, the trend for the evolution of the PR is similar to that of WIP. In addition, the evolution of WIP has a shorter settling time than that of the PR. According to Figure 8, on one hand, as the buffer capacity increases, it is easy to observe that the PR and WIP of the system become larger at the beginning and gradually reach a stable value. On the other hand, as the number of machines increases, the PR and WIP of the system become smaller at the beginning and gradually reach a stable value. This indicates that it is difficult to find a paired value of the buffer capacity and the number of machines for the production system to achieve a higher PR while meeting the lower WIP. There are three alternatives for plant managers when there is a need to optimize or redistribute products: Alternative 1—maintain the maximum PR of the system and select the paired parameters to meet the lower WIP; Alternative 2—maintain the minimum WIP and set the paired parameters to achieve a higher PR of the system and Alternative 3—depending on the production targets, a pair of weights (e.g.
The evolution of production rate and WIP with one constant parameter.
Numerical investigation #3
Based on numerical investigations #1 and #2, it is demonstrated that there exists an optimal combination of the two variables, the buffer capacity and the system scale (in this section, “the number of machines” is replaced by “the system scale”). However, in previous investigations, either of these two variables was generally considered to be a constant. In this section, a larger range of these two variables is proposed to investigate the relationships between the performance measures and the system’s characteristics.
In Figures 9 and 10, it can be observed that if the production system consists of a large number of machines with a sufficiently high buffer capacity, WIP of the system can be as large as possible. On the contrary, the PR of the system tends to converge to a settled value. Thus, in complex systems with the fixed number of machines, it is feasible to determine the value of the buffer capacity to achieve better performance.
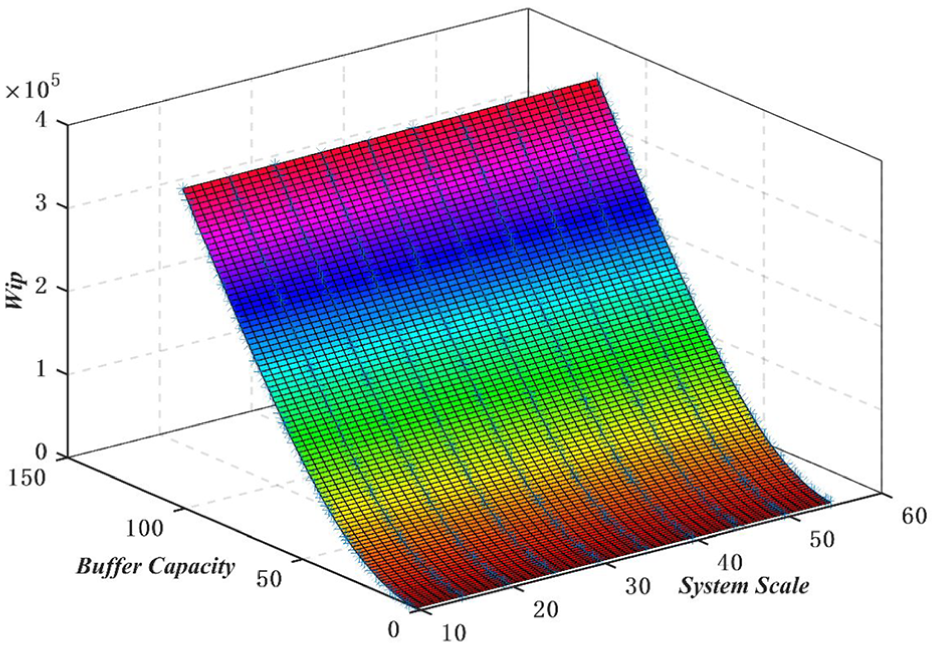
The evolution of WIP as a function of buffer capacity and system scale.
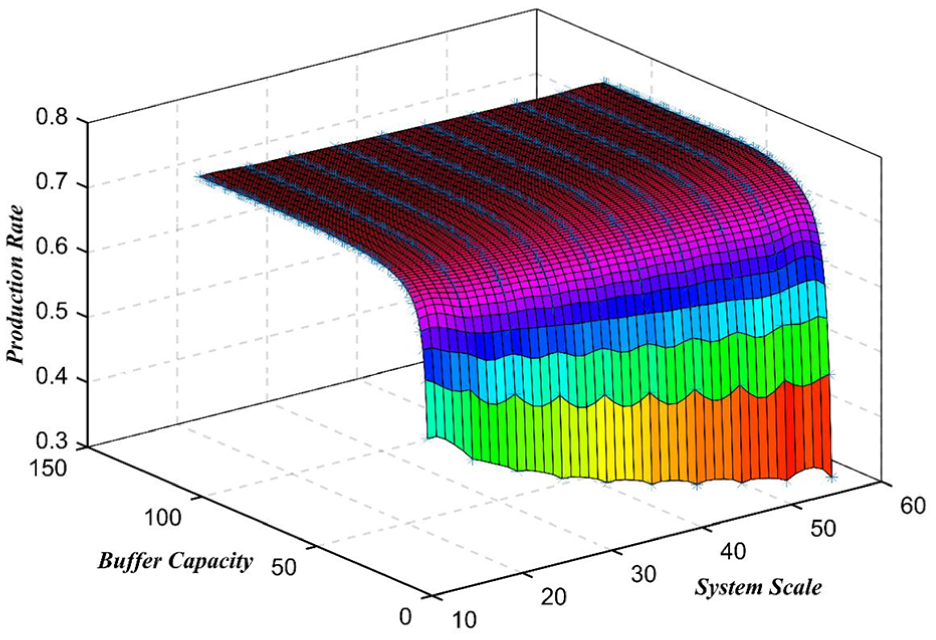
The evolution of production rate as a function of buffer capacity and system.
Remark 4
The WIP level of the production systems is constrained by both the buffer capacity and the number of machines. According to numerical investigation #1, it is observed that the reduction of WIP for the system is due to the small buffer capacity. Therefore, for a system with a large scale, which indicates that the number of machines will be large, it is difficult to maintain a low WIP level.
Remark 5
According to Figure 10, when the production system reaches a steady state, the PR of the system will converge to a fixed value, defined as PR-Cap. In this study, the PR-Cap is equal to 0.8. Based on the numerical experiments, it is feasible to achieve a higher PR by changing the number of machines and the buffer capacity. However, the PR will be equal to or less than the PR-Cap due to the potential failure events, such as machine failure, blockage and starvation. Thus, it is necessary to take external actions to increase the PR-Cap, for instance, preventive maintenance can be performed to keep the machines healthy.
Numerical investigation #4
In the numerical investigations above, the rework rate is assumed to be constant. This is not the case in the practical production systems. In this section, the aim is to find out how the rework rate affects the production systems in WIP and PR.
A system of 50 machines is considered in this section. Based on the different rework rates, the numerical results of PR are listed in Table 2.
Production rate of 50 machines for R = 0.1 and R < 0.1.
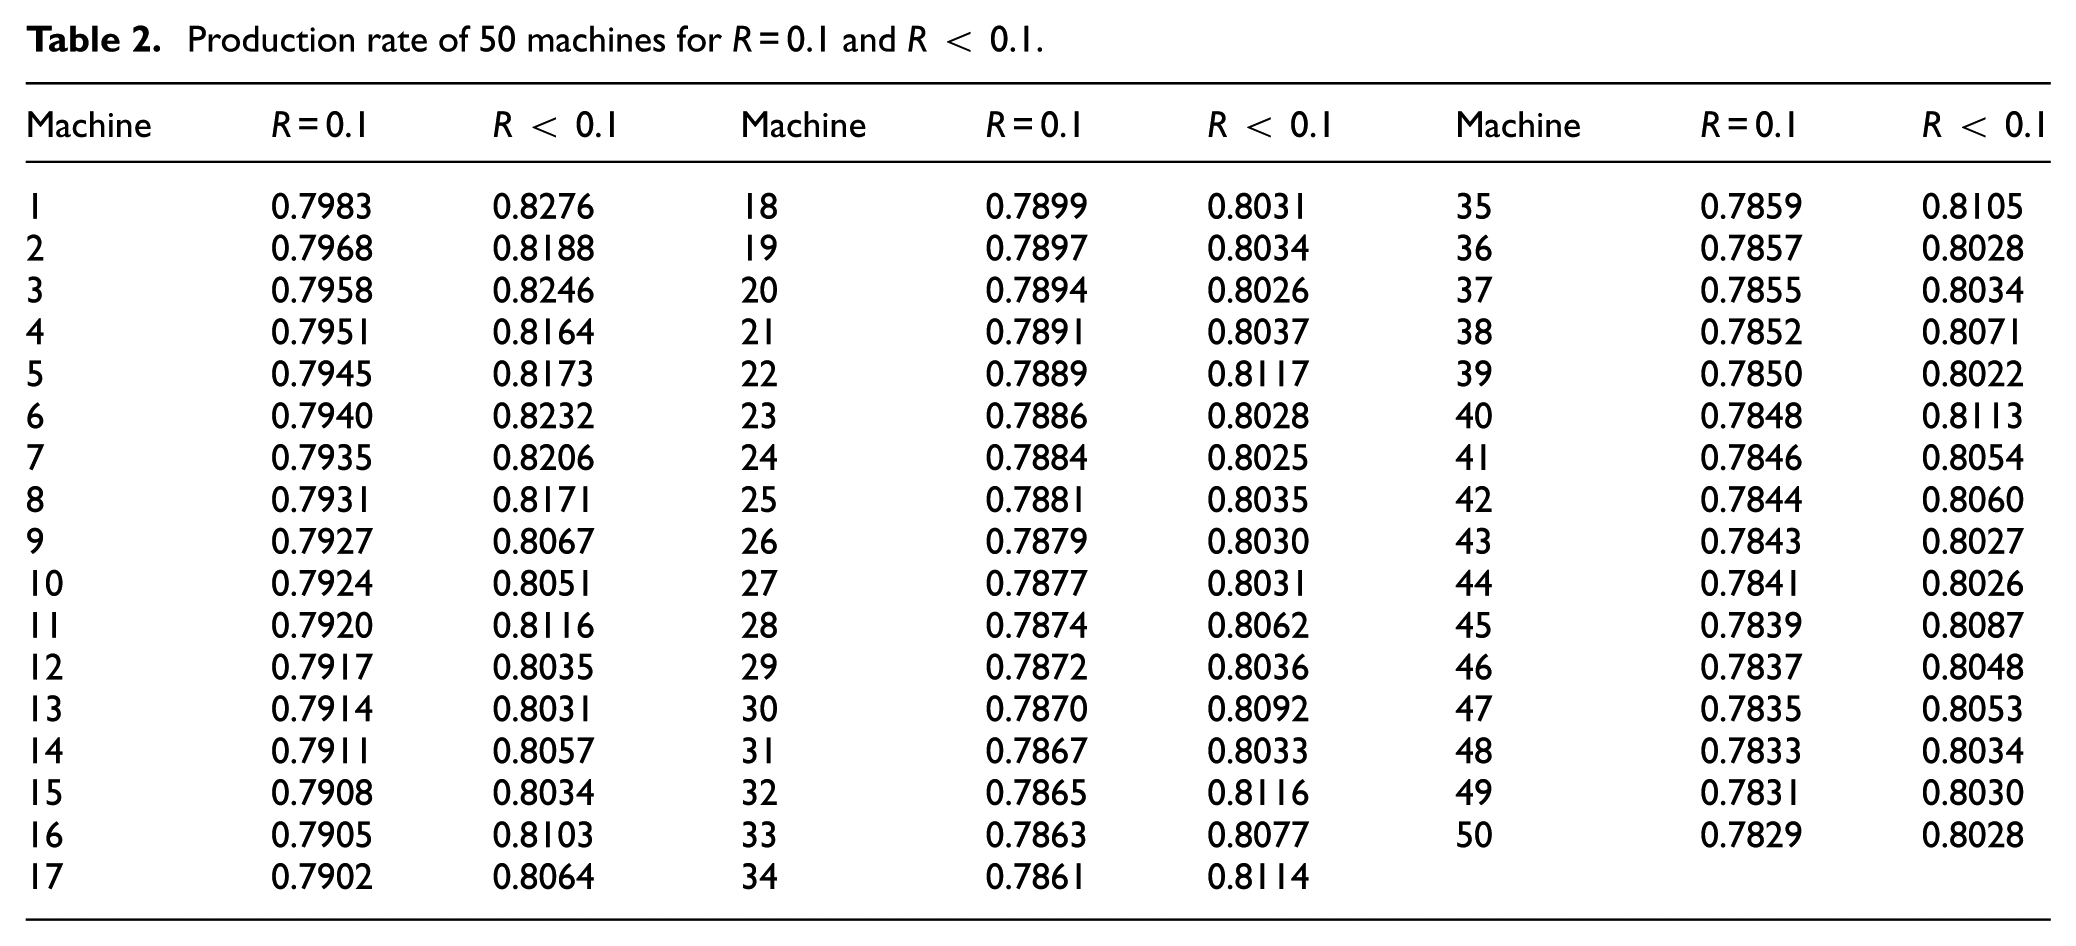
As illustrated in Figure 11, the curve of the PR is smooth when all machines in the system share the same rework rate (R = 0.1). The PR decreases with the position of the machines in the production line. It can be observed that the last machine (the 50th machine) in the production line has the lowest performance in terms of PR. In other words, the last machine is the bottleneck in the production process. When the rework rate differs between the machines, but all are assumed to be less than 0.1, the value of PR fluctuates irregularly from the point of Figure 11. The bottleneck has shifted from the 50th machine to the 39th machine, which means that the rework rate can lead to the migration of the bottleneck in the production process. It is implied that the rework rate can affect the performance measures and it is worth studying.
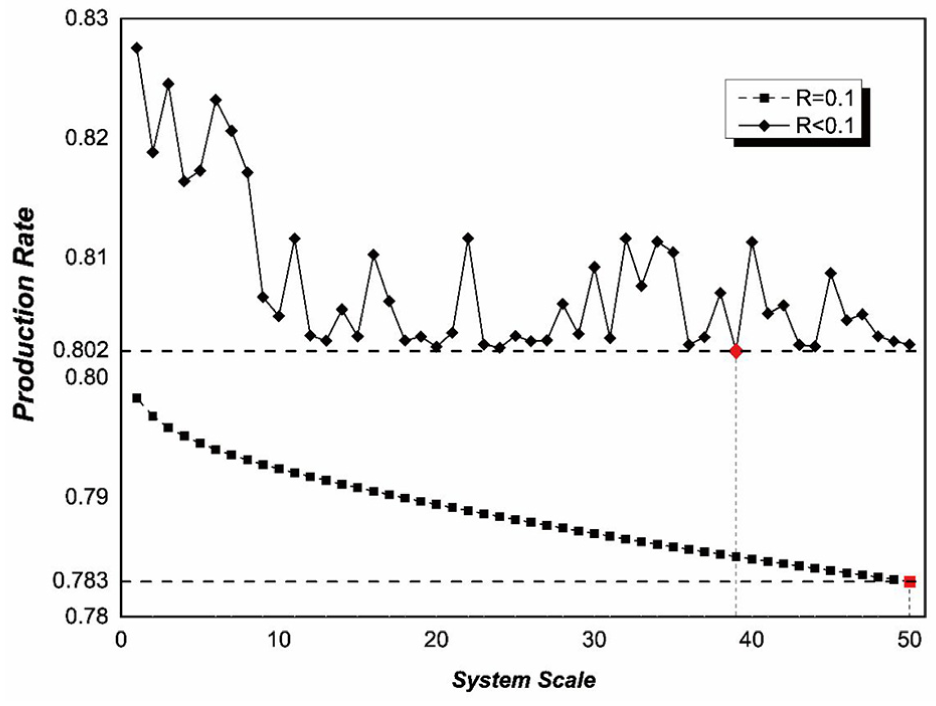
The bottleneck identification with R = 0.1 and R < 0.1.
Numerical investigation #5
In this part, numerical investigation is performed to verify the effectiveness and potential of the proposed “Instant-Checking” method in revealing the relationships between component-level characteristics and system-level performance measures, compared with the systems with the traditional assumptions. As shown in Figures 12 and 13 (“C” for the buffer capacity and “P” for the probability of the machine to produce a qualified product successfully, P = 1 – rework rate), four different kinds of systems have been considered in this part: (1) system with infinite buffer capacity and rework is considered; (2) system with infinite buffer capacity and no rework; (3) system with finite buffer capacity and rework is considered and (4) system with finite buffer capacity and no rework.
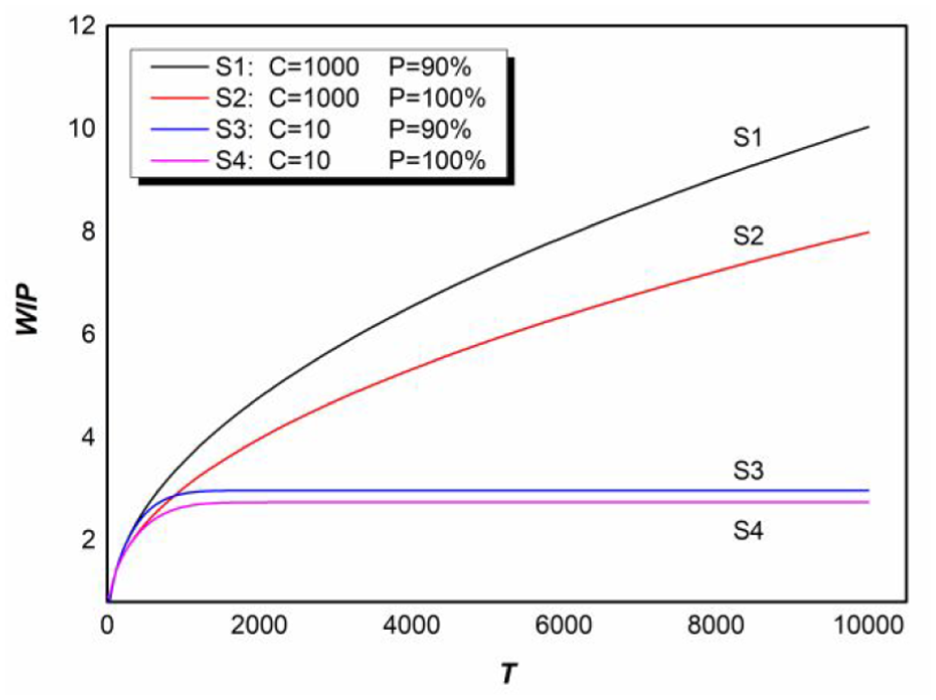
The evolution of WIP in different production systems.
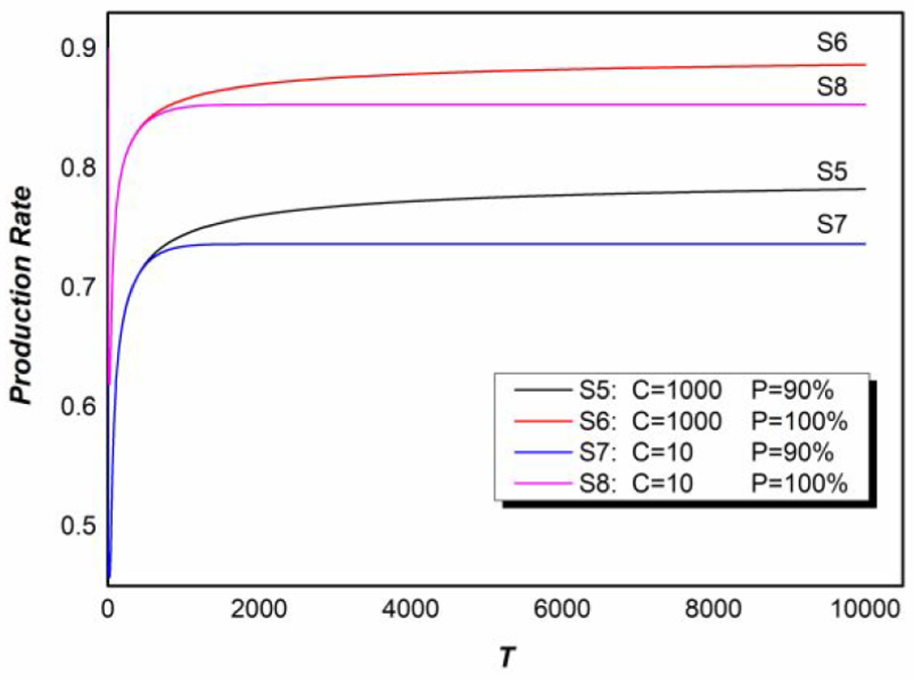
The evolution of production rate in different production systems.
According to Figure 12, it is obvious that system #1 has the highest WIP value and system #4 holds the lowest WIP. It indicates that systems with higher buffer capacity tend to maintain a higher WIP and systems with no rework tend to hold a lower WIP.
According to Figure 13, rework plays a more important role in the system’s PR. Systems with rework tends to show a lower PR value, like systems #1 and #3. Systems with no rework tend to display a higher PR value, like systems #2 and #4.
In conclusion, both the buffer capacity and the rework action have a large impact on the performance of the system. In the practical production systems, the buffer capacity is finite and the rework is not negligible. Based on these conditions, the “Instant-Checking” method is proposed to investigate the production systems in a more practical manner. The numerical results show that this method could provide more feasible information for the plant managers to plan the production activities.
Conclusion
In this article, a novel modeling method for PSM is proposed to investigate the performance measures of the Bernoulli serial production system with multiple rework loops. Since much emphasis has been put on research on quality management and lean production recently, a new mechanism for rework has been introduced in the model. Based on the principles of the new mechanism, the proposed “Instant-Checking” method is used to formulate a mathematical model for the complex systems. In addition, the transient analysis is performed to investigate the relationship between component- and system-level characteristics.
This method has two main contributions to research in this field. On one hand, the conventional restrictions and the limited assumptions are removed with this method. PSM for the production systems can not only focus on systems with 100% reliable machines and infinite buffers, but can also be extended to account for the systems with unreliable machines, finite buffers and imperfect production. This makes PSM a promising tool to be widely used in the modeling of complex manufacturing systems. On the other hand, the transient analysis is conducted in this study. Based on the probability theory and the Markov chain, the transition matrix is developed to formulate the dynamics of the system’s performance measures. And the numerical results provide guidance for the improvement and reallocation of the systems.
The analysis carried out in this study can be effectively extended to several directions. The first is the balance between investment and profit. In traditional production systems, in order to apply the proposed model in real plants, more shop floor spaces are needed, which leads to external cost, while in modern production systems more investment is necessary with the use of the high-level and new technologies. Nevertheless, the model proposed in this article can improve product quality, standardize the processes and enable the enterprises to obtain more profit than ever before. Therefore, how to balance the investment and profit or how to allocate resources could be a subject of our future research. The second is the disposal solution to unqualified products. In the proposed model, the only solution for the defective products is to process them again. However, in practical production systems, due to the high cost of rework, defective products can be discarded unless necessary or economic, which complicates the model. Third, all the inspection works are assumed to be perfect in our research. But in practical systems the imperfect inspections are always the case. How we deal with the inspection errors and take them into consideration in our model is a problem worth researching. Thus, there still remain a lot of problems to be considered, and our future research work will extend the method to solve these issues.
Footnotes
Declaration of conflicting interests
The author(s) declared no potential conflicts of interest with respect to the research, authorship and/or publication of this article.
Funding
The author(s) disclosed receipt of the following financial support for the research, authorship, and/or publication of this article: This research was supported partially by the National Natural Science Foundation of China under Grant No. 71471135.