
Abstract
The article provides a novel method to control the amount of unbalance propagation in precise cylindrical components assembly, which takes the machining error, the measurement error, and the assembly error into account. The coefficient and the correction factor matrices of mass eccentric deviations are defined to analyze the amount of unbalance propagation by building the connective assembly model. The influence of the machining error, the measurement error, and the assembly error on the mass center is analyzed in the assembly. The cumulative mass eccentric deviation can be reduced stage by stage in the assembly, and the amount of unbalance of final assembly can be minimized by controlling the assembly angle of each component. The effectiveness of the proposed method is verified by the assembly of the real aero-engine using the optimal assembly strategy. Compared to the worst assembly strategy, the values of the amount of unbalance using the optimal assembly strategy are reduced by 20%, 76%, and 79% for two, three, and four components assembly, respectively. Besides, the reasonable tolerance design area for each component is obtained with the proposed method for the real aero-engine assembly with four components. The proposed method can improve the assembly accuracy of cylindrical components and can be used for assembly guidance and tolerance design, especially for the assembly of multistage precise cylindrical components.
Keywords
Introduction
In the field of advanced mechanical manufacturing, the quality of precise cylindrical components assembly has a significant impact on the rotation performance.1,2 The amount of unbalance is an important parameter to evaluate the quality of final assembly and directly affects the vibration characteristics, especially for high-speed rotation.3,4 For aero-engine and gas turbines, the response levels caused by the amount of unbalance of final assembly out of specification limits, under dynamic loading, can be 100 or 1000 times greater than the levels resulting from static loading of the same magnitude.5,6
In the multistage components assembly, much work has been done on the geometric error propagation in the assembly.7–9 In the research of geometric tolerance representation, Desrochers and Rivière 10 proposed a matrix approach coupled to the notion of constrains for the representation of tolerance zones and the mathematical representation can be used easily for the computation of clearances and angular deviations. The method is suitable for any three-dimensional part and any type of surface. Whitney et al. 11 established a homogeneous matrix transform for tolerance representation, which represents both the nominal relations of components and variations caused by geometric deviations. Zhang et al. 12 proposed a method for the representation of geometric errors based on Non-Uniform Rational B-Splines (NURBS) surface, which considers form errors and characterizes the altitude distribution of geometric errors on the machined surface. Marziale and Polini 13 briefly introduced two models for tolerance analysis, the vector loop and the matrix, and compared their analogies and differences. The tolerance of component can be limited by the tolerance analysis and allocation based on the geometric error model.14–16 Ngoi et al. 17 presented a graphical approach known as the Catena method to perform assembly tolerance stack analysis for form control. Besides, Ngoi and Min introduced another approach for optimum tolerance allocation. The method allows all blueprint tolerances to be determined while ensuring that all the assembly requirements are satisfied. 18 Zheng et al. 19 developed a reasonable tolerance allocation strategy of using coalitional game theory for every assembly component finding a trade-off between the assembly cost and the assembly quality. Although the components are in the high precision processing, the process error of each component is propagated and accumulated in the assembly process and might eventually get the quality of the mechanical assembly out of specification limits.20–22 In order to control the variation propagation in the assembly, Yang et al. 23 developed the straight-build assembly model for variation propagation control in an aero-engine assembly and used a transform matrix model to analyze variation propagation process. Wang et al. 24 proposed a stack-build assembly technique and analyzed the location and orientation tolerances propagation process in the assembly, and the cumulative eccentric deviation can be minimized by controlling the assembly angle of component.
The amount of unbalance of component is caused by the mass eccentricity and the cumulative mass eccentric deviation will be propagated and amplified in the assembly. However, the above methods only focused on the geometric error propagation, and the mass eccentric deviation propagation process has not been studied in the assembly. Therefore, it is necessary to solve the problem that the amount of unbalance cannot be controlled accurately in the assembly.
The amount of unbalance of final assembly is caused not only by the amount of unbalance of each component but also by the machining error, the measurement error, and the assembly error, respectively. The article proposes a method to control the amount of unbalance propagation in the assembly. The distribution model of mass eccentric deviation is obtained by building the coefficient and the correction factor matrices, which takes the machining error, the measurement error, and the assembly error into account. Based on the mass eccentric deviation propagation process in precise cylindrical components assembly, the experiments of the real aero-engine using different assembly strategies are built. The experimental results show that the amount of unbalance of final assembly is minimized by controlling the assembly angle of each component and the reasonable design area for tolerance of each component is also obtained.
The model of amount of unbalance propagation in the assembly
If the machining error is not considered and the mass distribution is uniform for the cylindrical component, the position of the center of mass is the same as the geometric center in X- and Y-directions and at the 1/2 height of the component. However, the machining error exists and the mass distribution is not uniform in the real machining. Due to the amount of unbalance caused by the center of mass with an eccentricity relative to the rotation center, the process of mass eccentric deviation propagation is described herein. Amount of unbalance is defined as the distance of its center of mass from the rotation axis. Unbalance vector is defined as the vector whose magnitude is the amount of unbalance and whose direction is the angle of unbalance. 25 The relationship of amount of unbalance and unbalance vector is shown in Figure 1. C is the mass center of component.
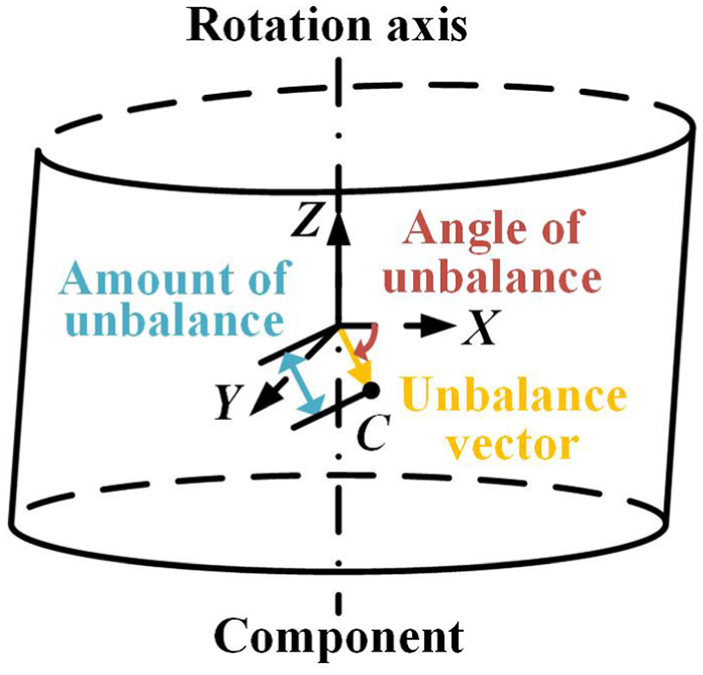
The relationship of amount of unbalance and unbalance vector.
As shown in Figure 2, the rotation axis is a line which passes through the center of component 1 base surface and is perpendicular to component 1 base surface. C1, C2, and C3 are the centers of mass of components 1, 2, and 3, respectively. The mass eccentricity of a single component propagates to the next component through the connective surface in the assembly. The mass eccentric deviation in the assembly can be reduced by controlling the assembly angle of each component.
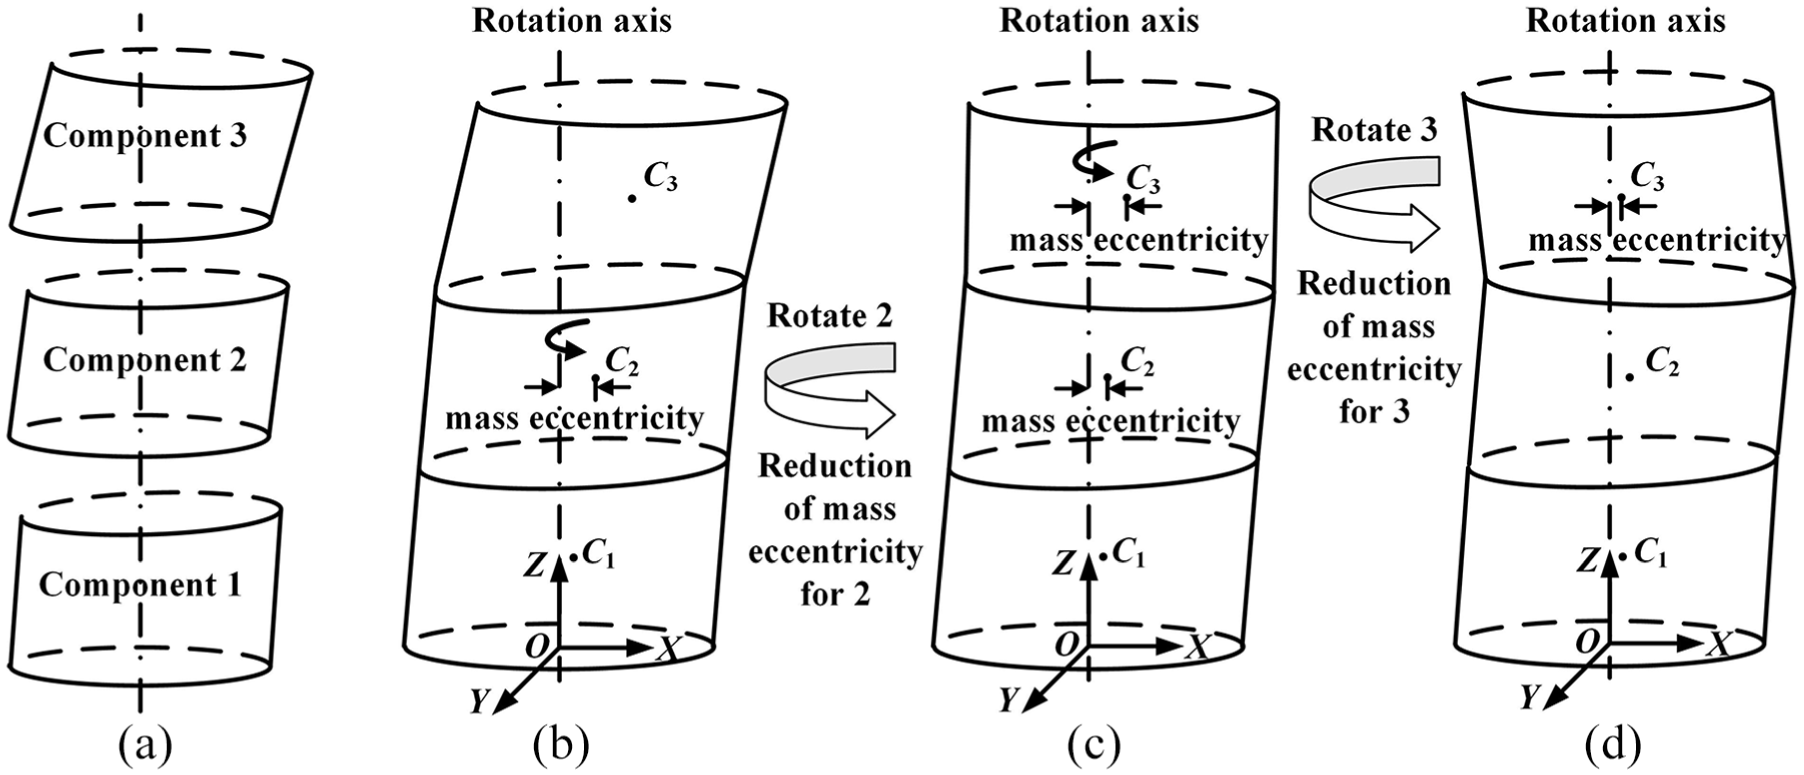
Cylindrical components assembly model: (a) three components, (b) without rotating components, (c) with orientations favorable for reducing mass eccentricity of component 2, and (d) with orientations favorable for reducing mass eccentricity of component 3.
Propagation of amount of unbalance in two components assembly
The amount of unbalance of single component is caused not only by the machining error but also by the non-uniform mass distribution. As shown in Figure 3, O and O1 are the centers in the base and top surfaces of single component; Q is the center of mass of single component;

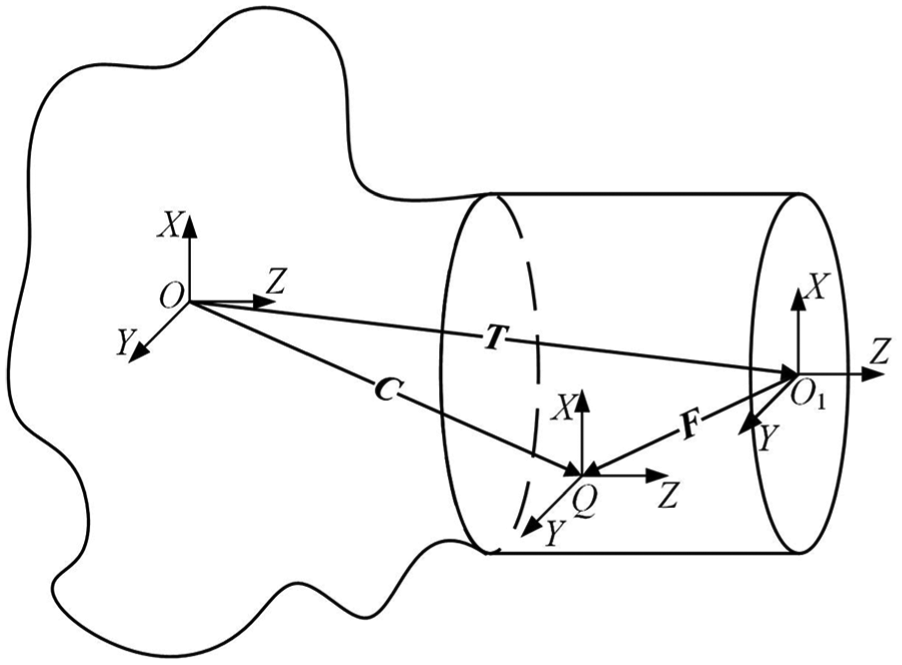
The mass eccentric deviation of single component.
Due to the mass distribution is non-uniform for the real component, the correction factor matrix of mass eccentric deviation

where
The amount of unbalance is propagated and amplified stage by stage in two components assembly. As shown in Figure 4, O is the center of the base surface of component 1, O1 and O2 are the centers of two components at their top ends, and Q2 is the center of mass of component 2.
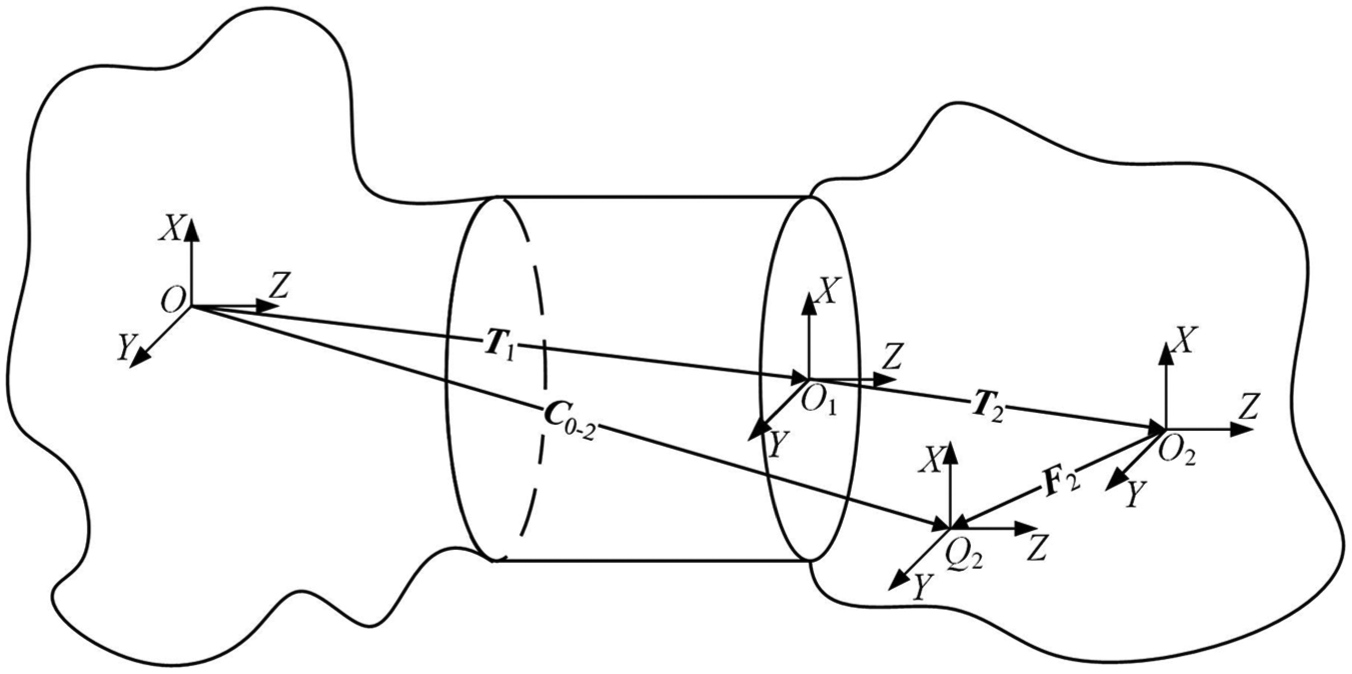
The model of amount of unbalance propagation in two components assembly.
In two components assembly, the mass eccentric deviation matrix of component 2

where
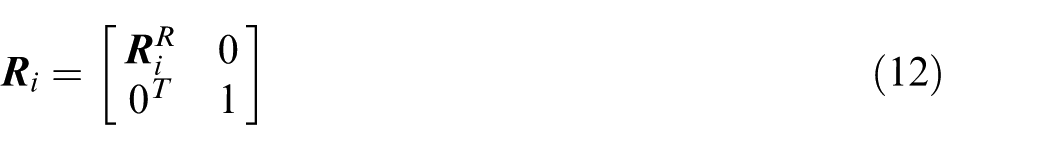
The geometry eccentric deviation matrix of the ith component
where
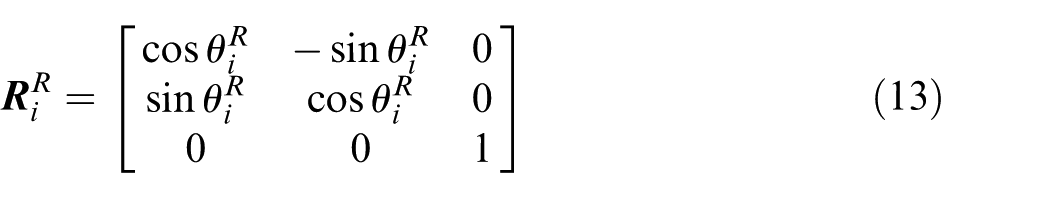
The rotation error of geometry eccentric deviation is small enough for the precise cylindrical component, and the matrix
where
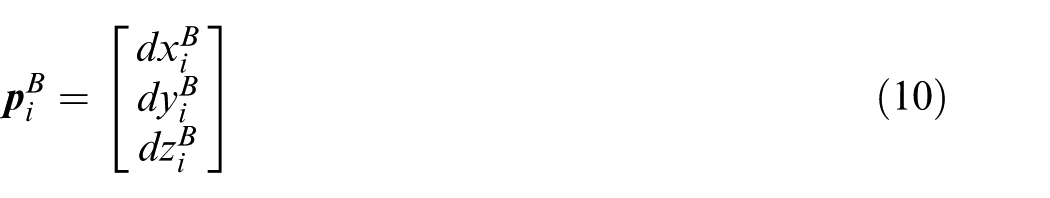
The position error vector of geometry eccentric deviation
where
The coefficient factor matrix of mass eccentric deviation for the ith component
where
where ki is the coefficient factor of mass eccentric deviation for the ith component and is determined by the three-dimensional shape of the ith component. For example, for the ideal standard cylindrical component, the k is equal to 2 and the position of the center of mass at the 1/2 height of the component.
The correction factor matrix of mass eccentric deviation for the ith component
where
where
In cylindrical components assembly, the amount of unbalance can be minimized by controlling the assembly angle of each component. The assembly orientation adjustment process can be expressed as the matrix

The assembly orientation matrix of the ith component
where
where
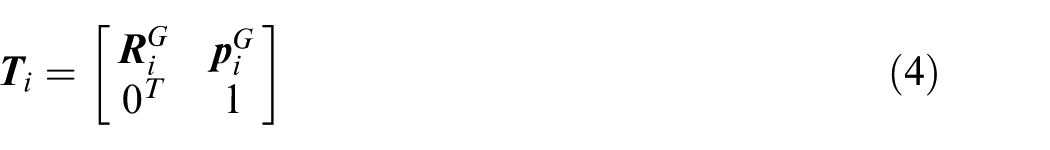
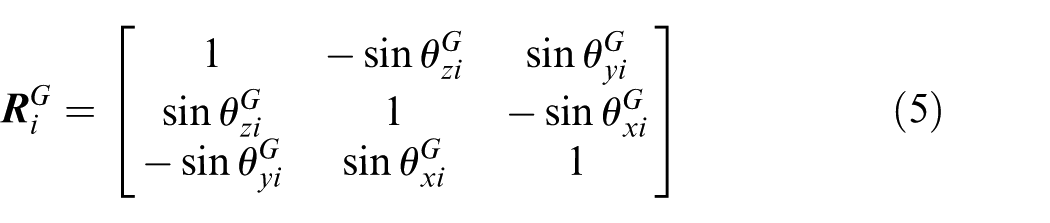
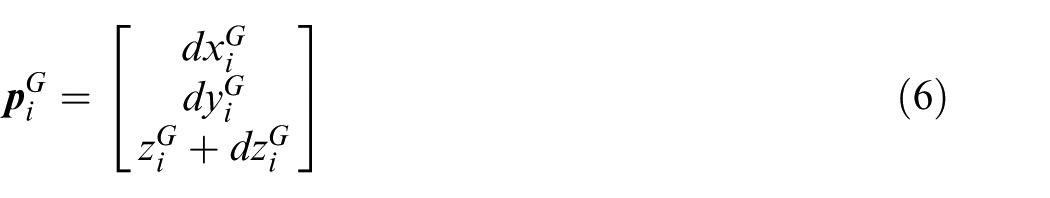
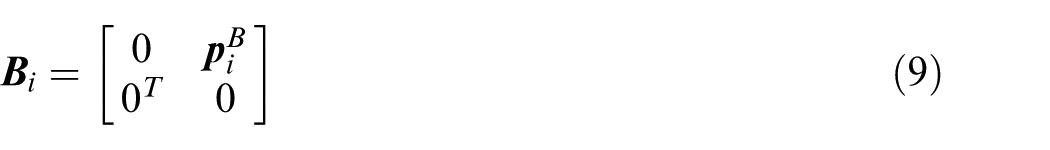
If a feature on a part is not placed in its nominal design position, there is an assembly error of mis-position and mis-orientation for the feature. The assembly error of the ith component can be expressed as the matrix

The assembly error matrix of the ith component
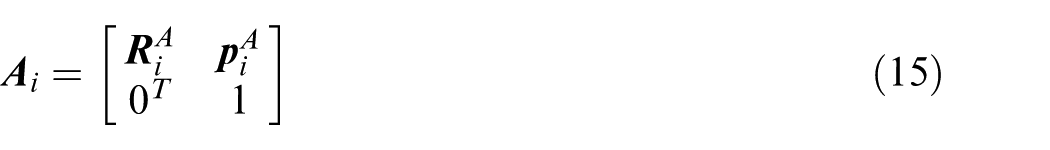
where
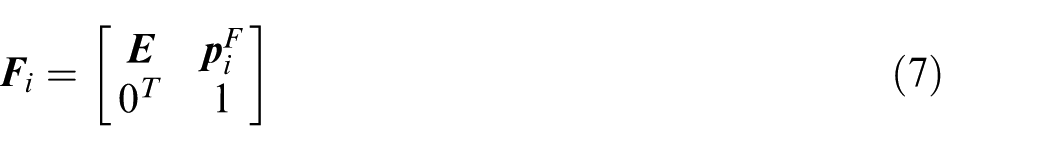
In a similar way, if the measurement error is involved, the assembly error of the ith component can be expressed as the matrix

The measurement error matrix of the ith component
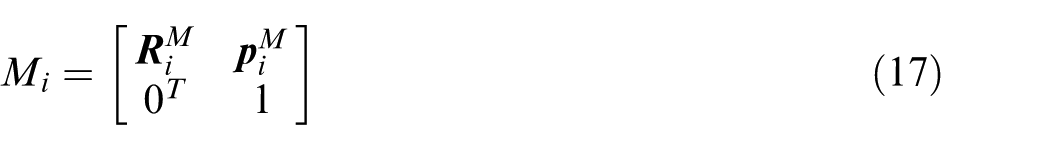
where
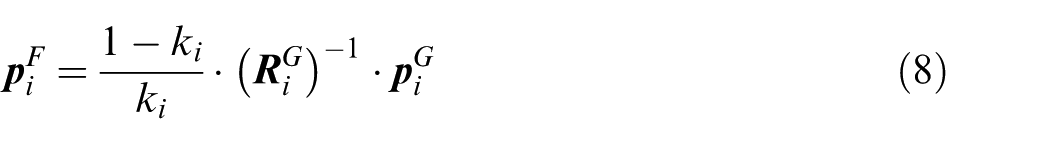
Using equations (4), (7), (9), (12), (15), and (17) in equation (16), the mass eccentric deviation matrix of component 2

The position vector of mass eccentric deviation of component 2 in the assembly
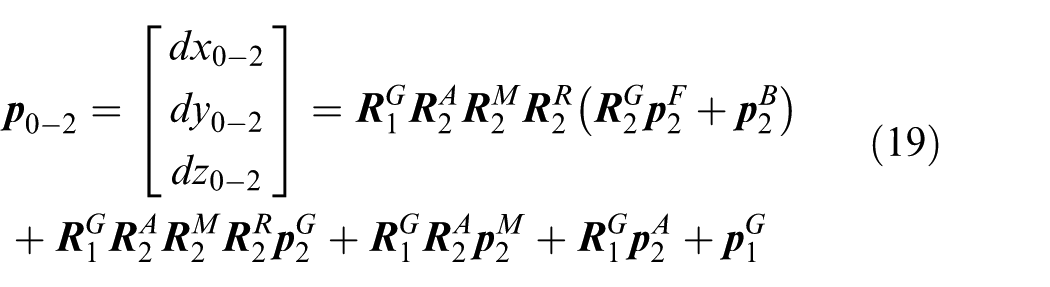
where
It can be seen from equation (19) that the cumulative mass eccentric deviation is related to the machining error, the assembly error, and the measurement error. In two components assembly, the cumulative mass eccentricity can be reduced by controlling the assembly angle of component 2.
Propagation of amount of unbalance in the assembly
On the basis of the mentioned analysis in two components assembly, the mass eccentric deviation matrix of the nth component
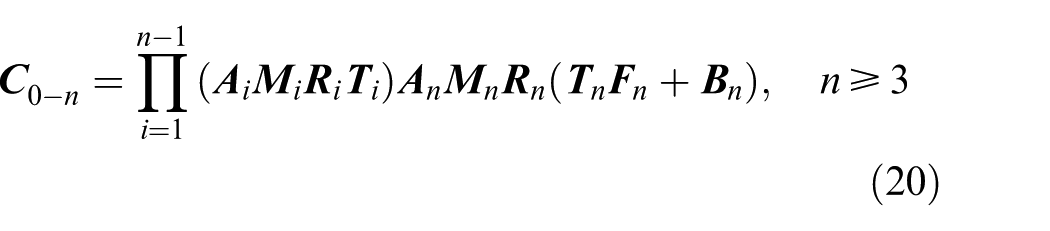
where
Using equations (4), (7), (9), (12), (15), and (17) in equation (20), the matrix
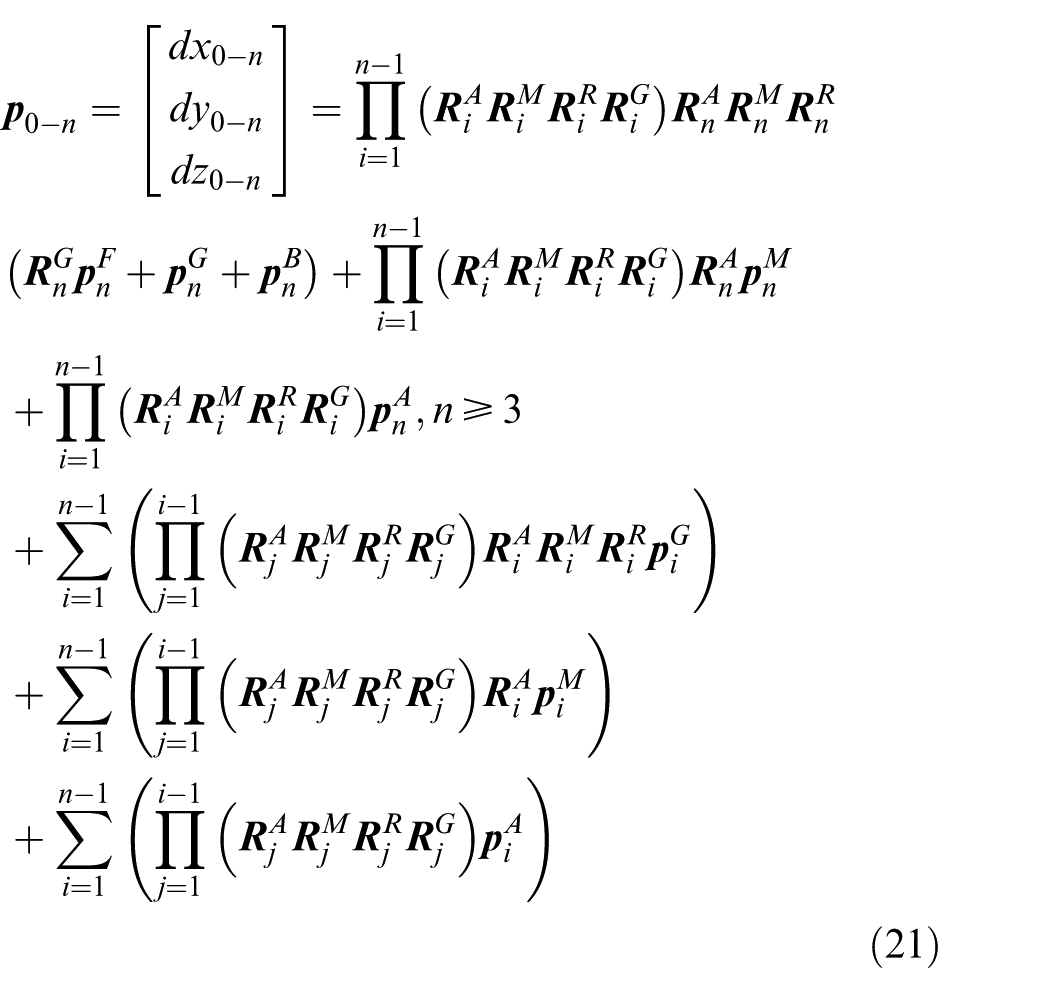
where
The unbalance vector of the nth component
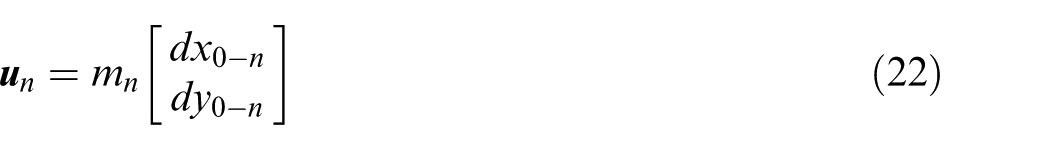
where
Balancing plane is defined as plane perpendicular to the rotation axis of a rotor in which correction for unbalance is made. 25 The balancing planes A and B are used to adjust the mass distribution to ensure that the residual unbalance is within specified limits. Therefore, the unbalance vectors of the balancing planes A and B can be expressed as
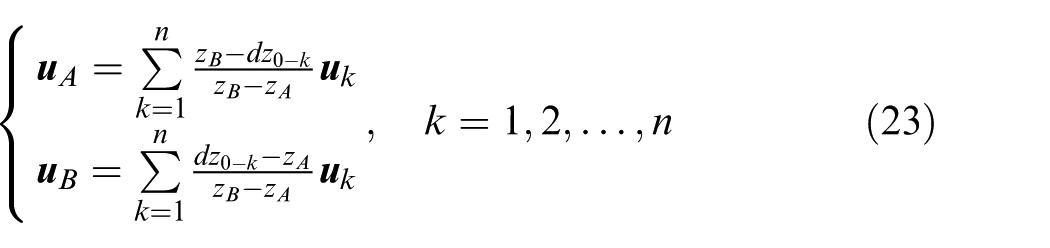
where
The value of amount of unbalance for final assembly u can be expressed as

where uA and uB are the norms of the amount of unbalance of the balancing planes A and B, respectively.
Using equations (5), (6), (8), (10), (13), (21), (22), and (23) in equation (24), under the condition of real physical assembly with assembly angle as control variable, the amount of unbalance of final assembly u can be improved as

where
Simulation results
Assembly with different assembly angles
Using equation (25), the relationship between the amount of unbalance for three components assembly and the assembly angle of each component is shown in Figure 5. For example, the height and the diameter of each component are 70 and 100 mm, respectively; the mass of each component is 250 g; the machining error, the measurement error, and the assembly error δ are 0.01 mm based on the real assembly environment, such as aero-engine rotor; the coefficient factor of mass eccentric deviation k is 0.5; and the correction factor of mass eccentric deviation is 0.01 mm.
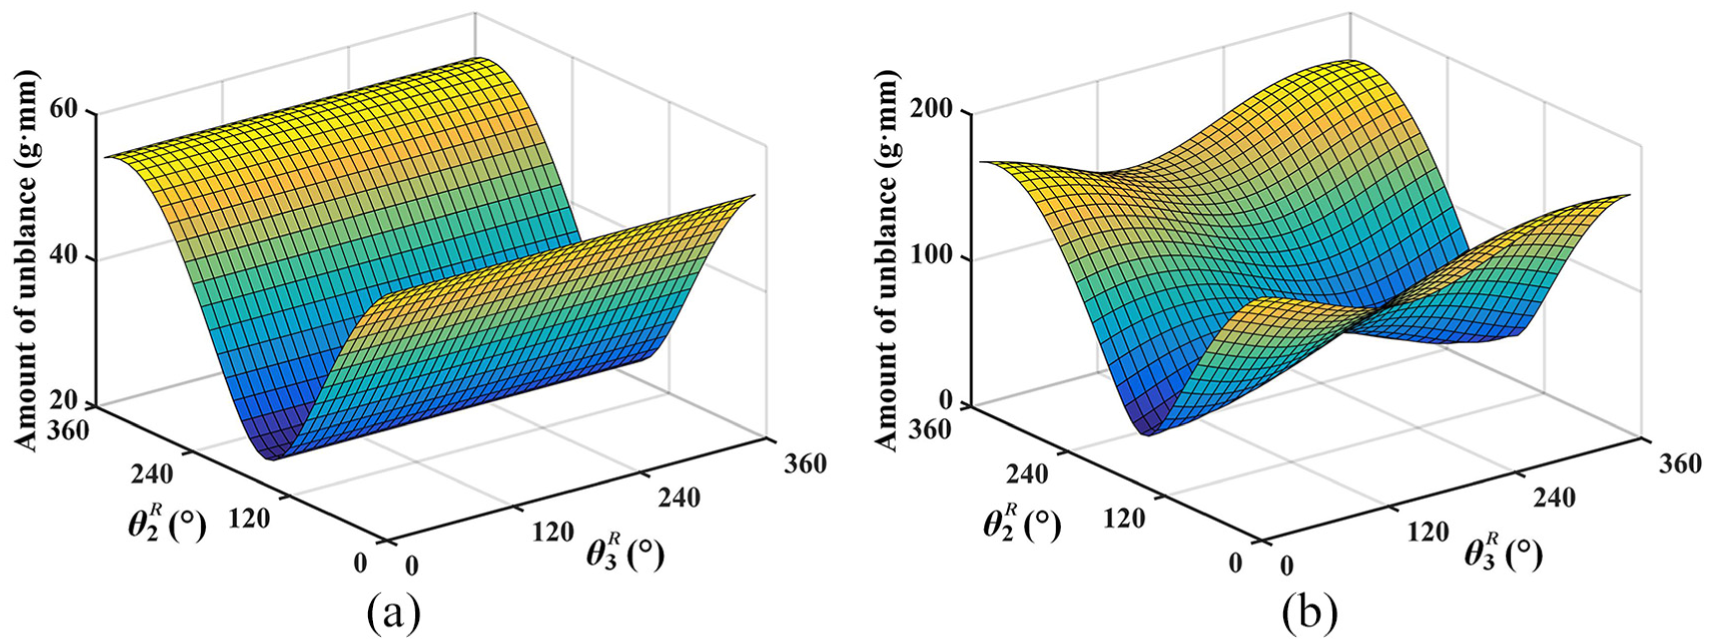
Amount of unbalance of final assembly for different assembly angles: (a) amount of unbalance for first two components assembly and (b) amount of unbalance for three components assembly.
As shown in Figure 5, the amount of unbalance of final assembly is minimized greatly by properly selecting the component orientations. Figure 5(a) shows that the minimum amount of unbalance for first two components assembly is 28 g·mm, when
Assembly with different strategies
In the article, three kinds of assembly strategies are defined and the mathematical forms are expressed as follows. The optimal assembly strategy can be expressed as
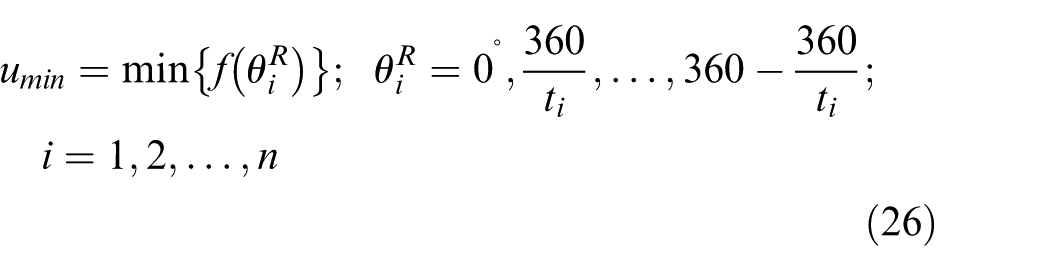
The worst assembly strategy can be expressed as
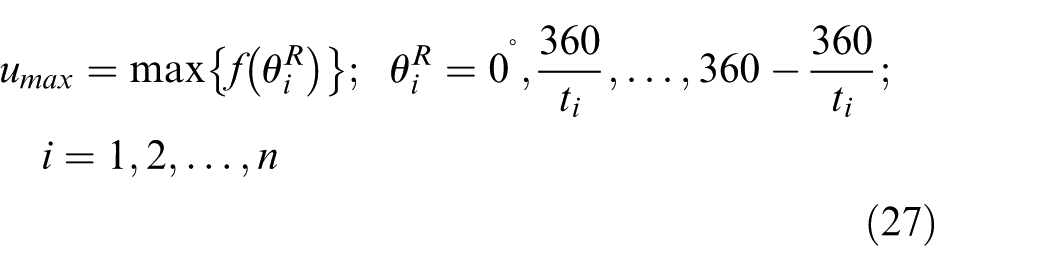
The direct assembly strategy can be expressed as
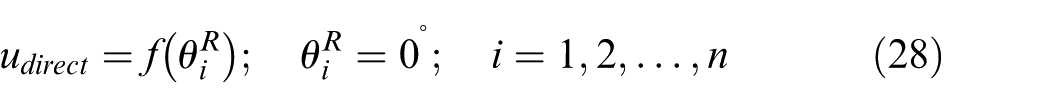
where ti is the number of mounting holes for the ith component.
To test the optimal assembly strategy procedure, the article compares it to the worst assembly and direct assembly. Each assembly procedure is simulated 10,000 times using standard Monte Carlo methods. The machining error, the measurement error, and the assembly error δ are 0.1 mm and assumed to be normally distributed, where the standard deviation σ is taken to be one-third of the error value. The position errors
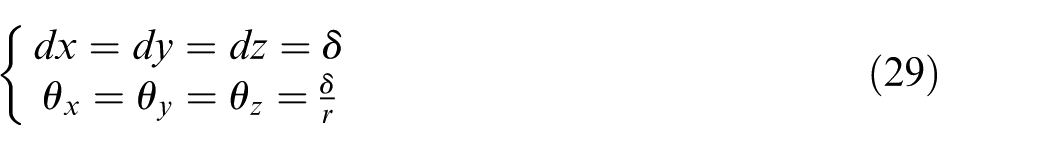
where r is the radius of each component.
Using equations (26) to (29), the statistical distributions of the amount of unbalance are shown in Figure 6, and the mean value and standard deviation of the amount of unbalance are provided in Figure 7.
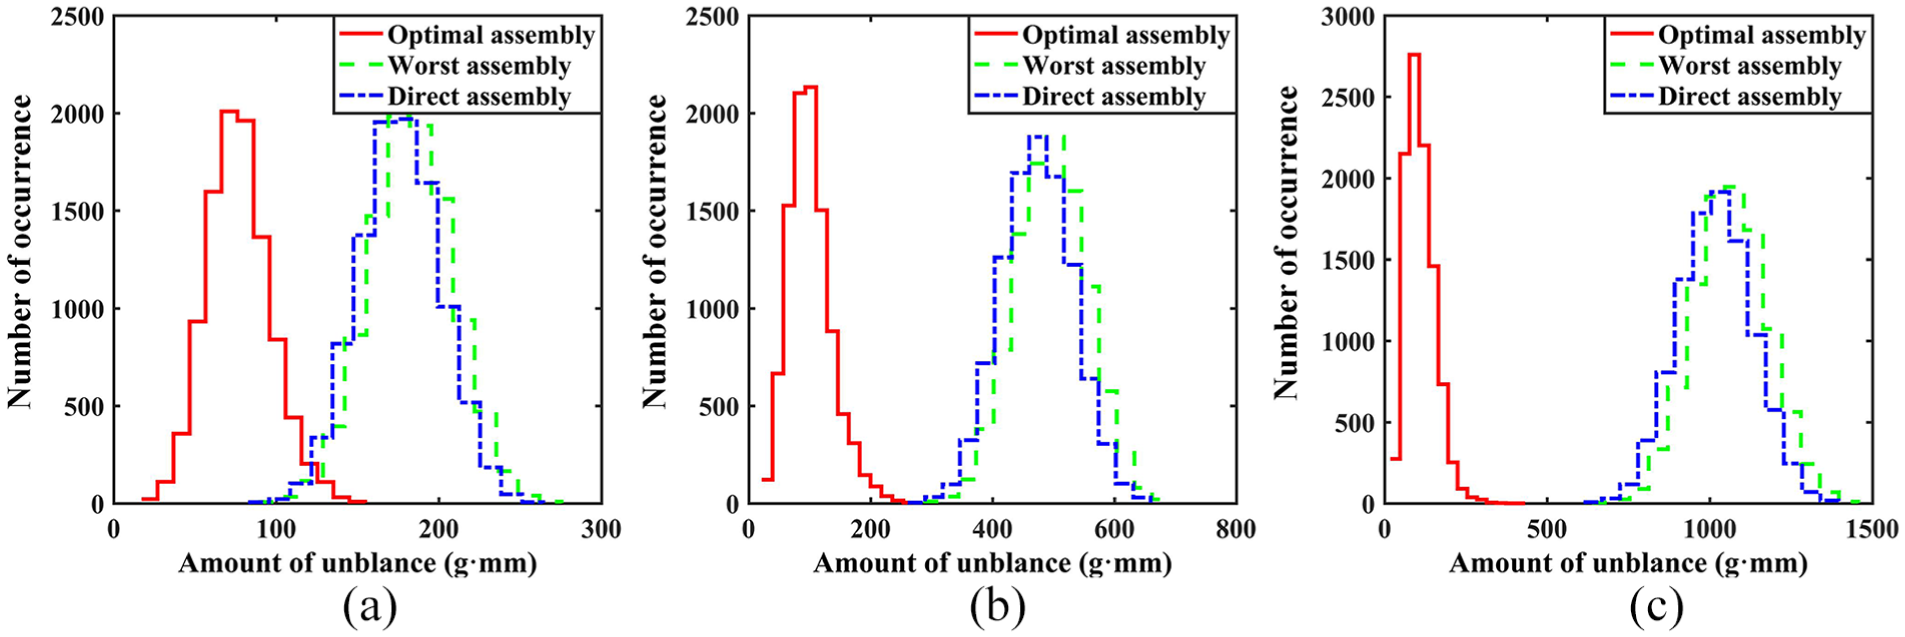
Histogram of amount of unbalance in the assembly: (a) two components assembly, (b) three components assembly, and (c) four components assembly.
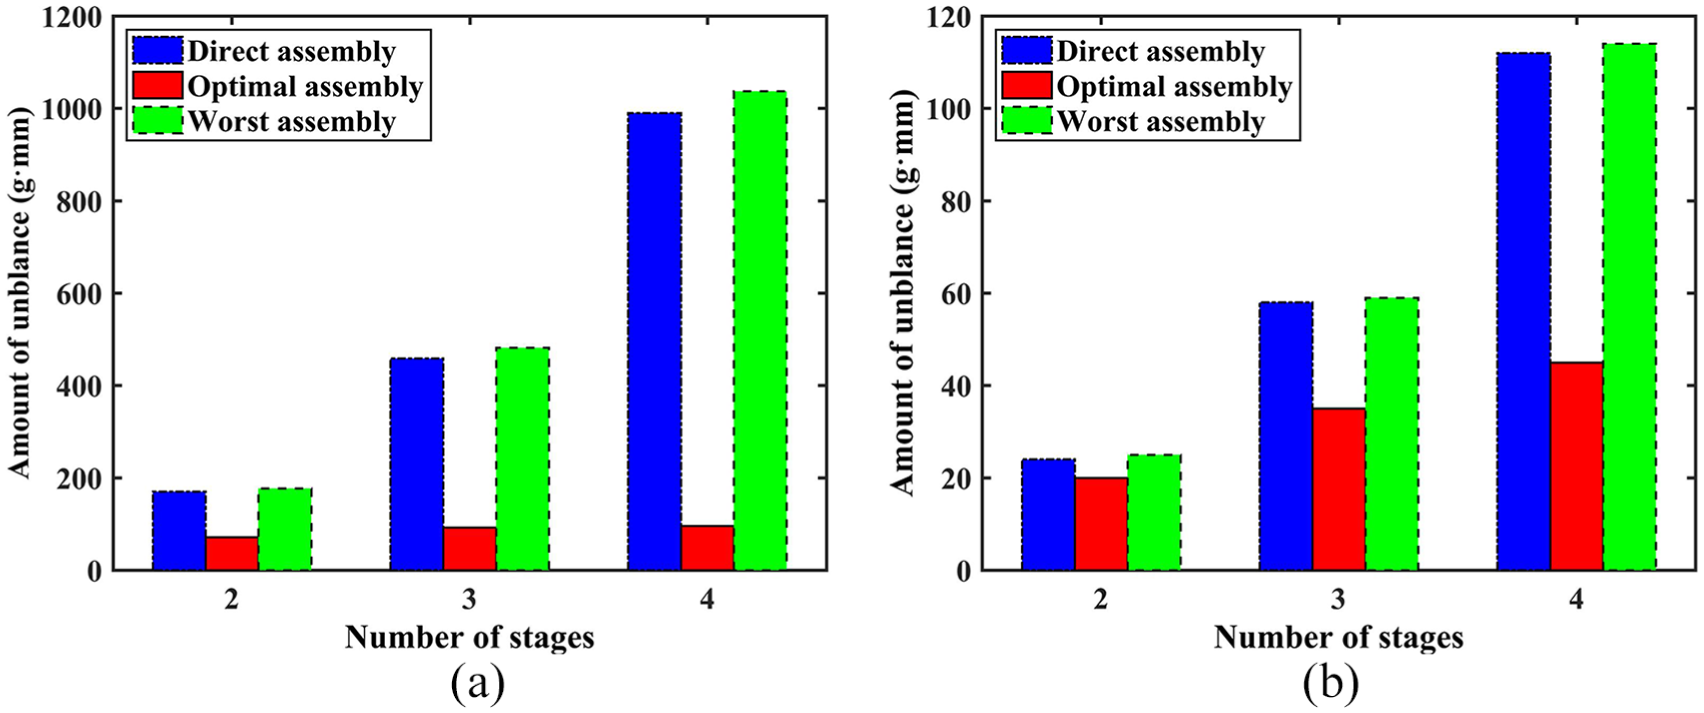
Histogram of amount of unbalance for mean value and standard deviation in the assembly: (a) the mean value of final assembly and (b) the standard deviation of final assembly.
As shown in Figures 6 and 7, the best assembly result is obtained with the optimal assembly strategy. For example, in two components assembly, the mean values of the amount of unbalance using the optimal, direct, and worst assembly strategies are 72, 169, and 177 g·mm, respectively. As the number of components increases, the effect of the propagation and amplification of single component error is more obvious in the assembly. For example, the mean values of the amount of unbalance for 2, 3, and 4 components assembly using the worst assembly strategy are 177, 482, and 1037 g·mm, respectively. Besides, as the number of components increases, the optimization performance using the optimal assembly strategy becomes more and more obvious. For example, as the number of components increases, the mean value of the amount of unbalance using the optimal assembly strategy is “further and further away” from the mean value using the worst assembly strategy in Figure 6. Compared to the worst assembly strategy, the mean values of the amount of unbalance are reduced by 59%, 81%, and 91% for two, three, and four components assembly, respectively. In a similar way, the standard deviation of the amount of unbalance using the optimal assembly strategy is “taller and thinner” than the standard deviation using the worst assembly strategy in Figure 6. Compared to the worst assembly strategy, the standard deviations of the amount of unbalance are reduced by 20%, 41%, and 61% for two, three, and four components assembly, respectively.
Tolerance design in the assembly
The proposed method can not only be used for assembly guidance but also be used for tolerance design. It is assumed that the ratio of the machining error of the second component δ2 and the first component δ1 is t (δ2/δ1 = t). The machining errors of the first component are 0.02, 0.065, 0.11, 0.155, and 0.2 mm, respectively. In two components assembly, the relationship between machining error and the amount of unbalance using optimal assembly strategy is shown in Figure 8.
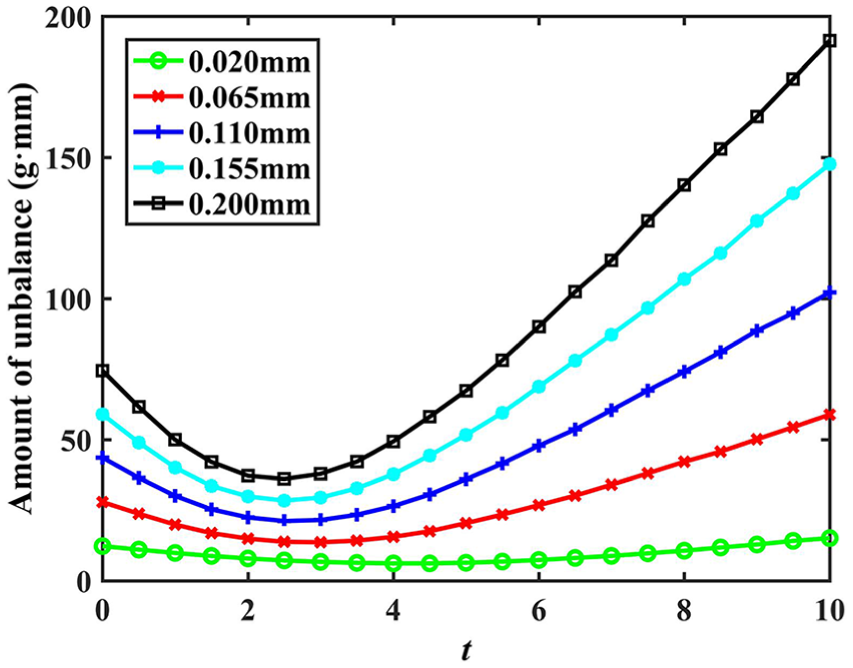
Amount of unbalance using the optimal assembly for different machining errors.
As shown in Figure 8, as ratio t increases, the amount of unbalance of final assembly first decreases and then increases. The optimal design value of machining error for component 2 is obtained, which minimizes the amount of unbalance of final assembly. For example, the amount of unbalance in the assembly is minimization when the design values of machining error for components 1 and 2 are 0.11 and 0.275 mm (t = 2.5), respectively. It is obvious that the proposed method can be used to guide the tolerance design, which effectively reduces the amount of unbalance in the assembly. Besides, as the machining error of component 1 increases, the assembly result using optimal assembly strategy increases. For example, as the machining error of component 1 increases from 0.02 to 0.2 mm, the smallest value of amount of unbalance for final assembly increases from 6 to 36 g·mm.
Experimental results
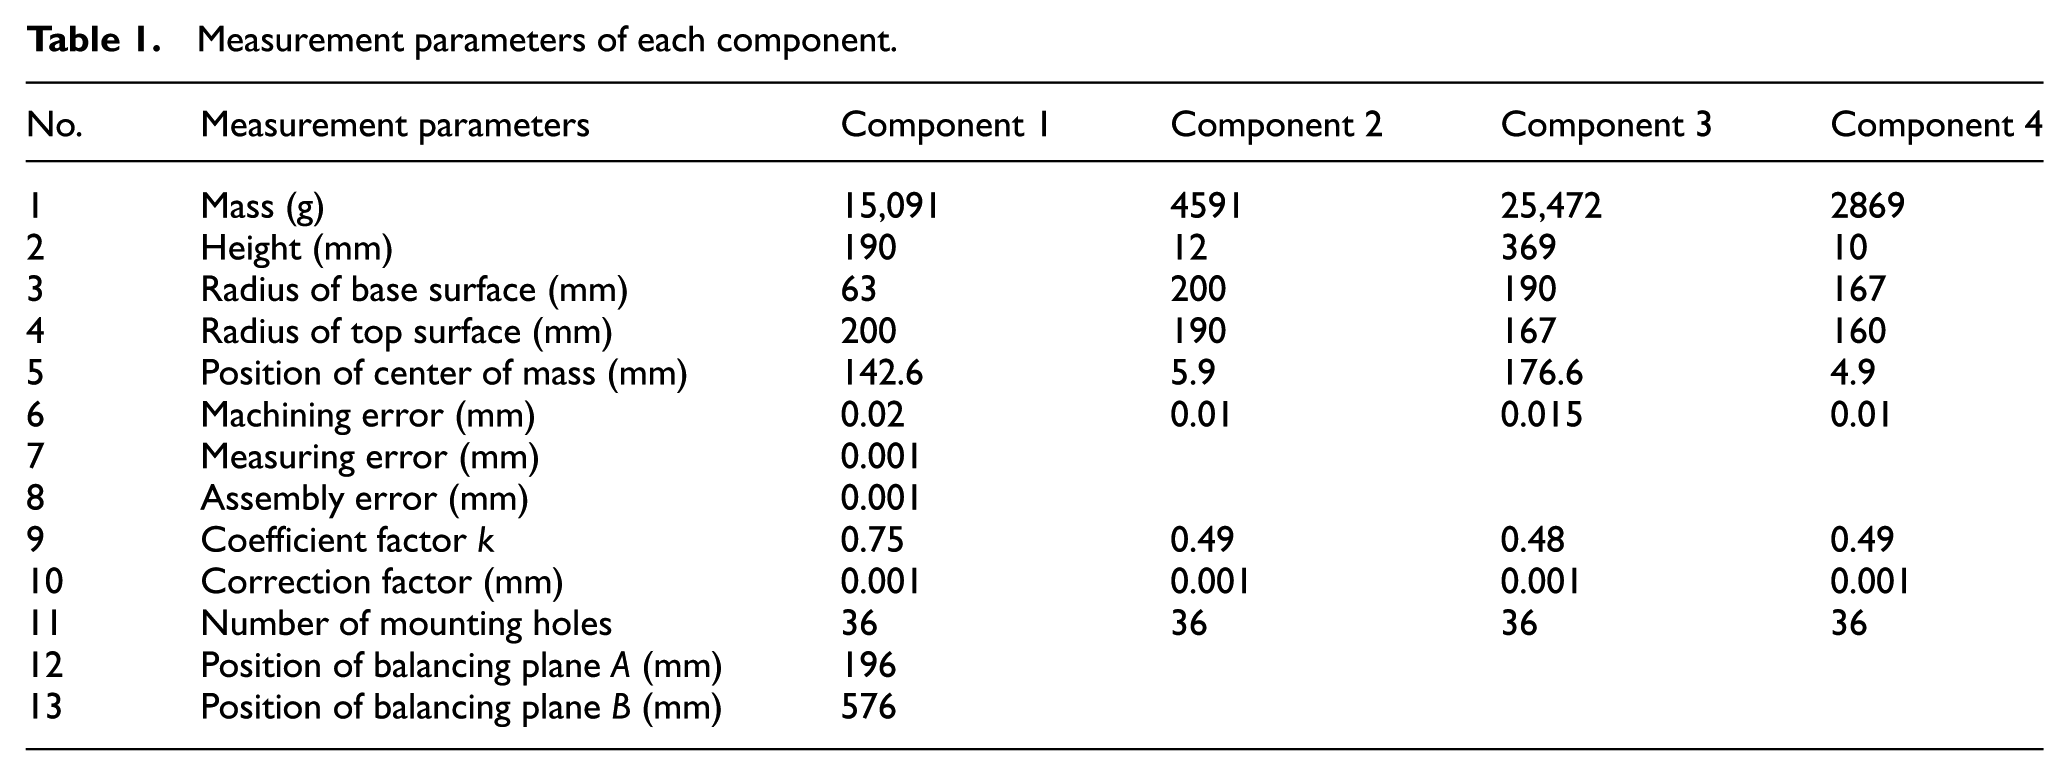
The effectiveness of the proposed method is verified through the real aero-engine assembly experiments and the measurement parameters of each component are shown in Table 1. The mass eccentric deviation can be measured by the dynamic balance measurement instrument.
Measurement parameters of each component.
The statistical distributions of the amount of unbalance are shown in Figure 9, and the mean value and standard deviation of the amount of unbalance are provided in Figure 10.
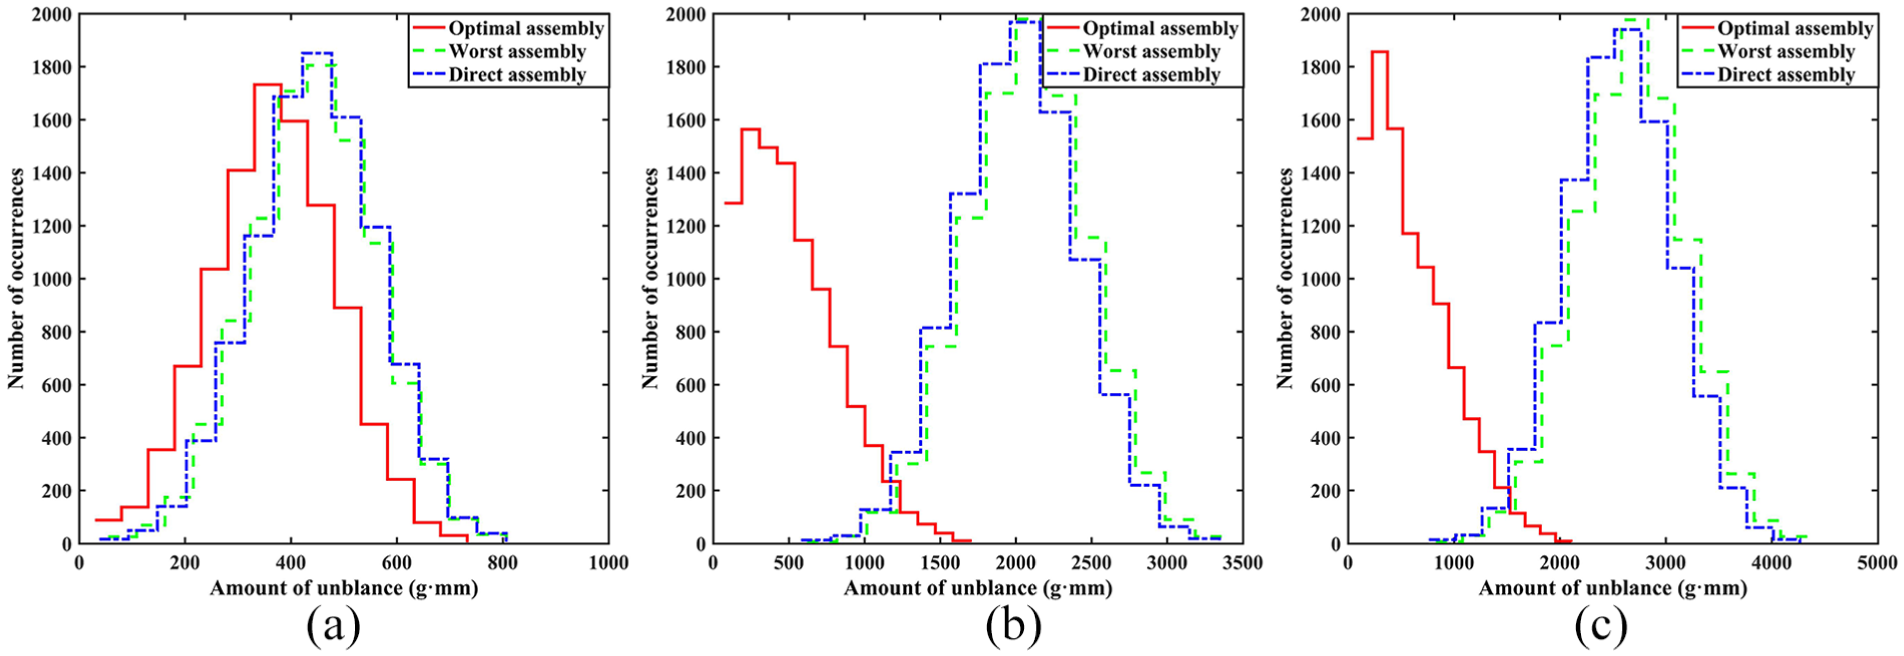
Histogram of amount of unbalance in the real aero-engine assembly: (a) two components assembly, (b) three components assembly, and (c) four components assembly.
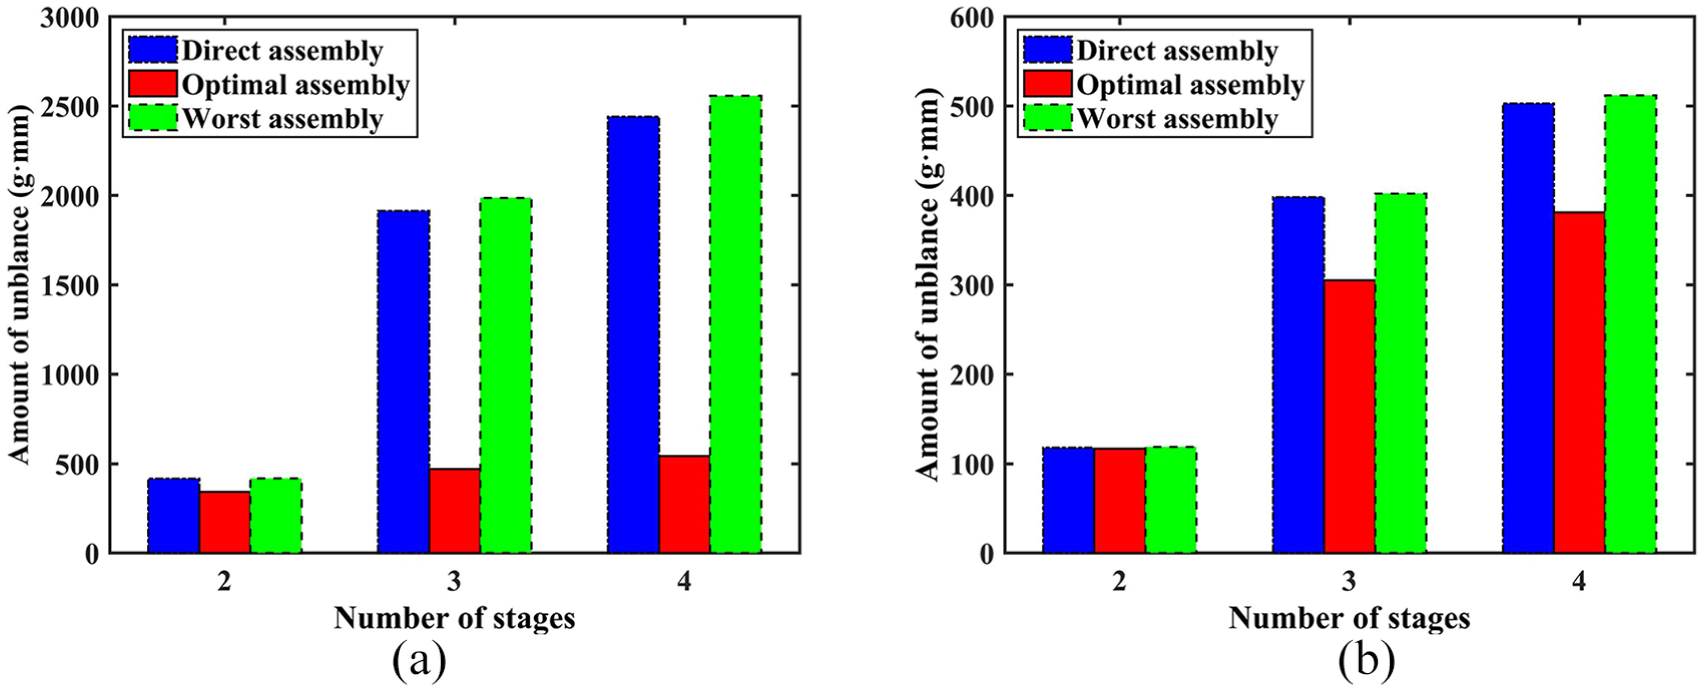
Histogram of amount of unbalance for mean value and standard deviation in the real aero-engine assembly: (a) the mean value of final assembly and (b) the standard deviation of final assembly.
As shown in Figures 9 and 10, the best assembly result is obtained with the optimal assembly strategy. For example, in two components assembly, the mean values of the amount of unbalance are 343, 417, and 418 g·mm using the optimal, direct, and worst assembly strategies, respectively. In a similar way, the standard deviations of the amount of unbalance are 117, 118, and 119 g·mm using different assembly strategies, respectively. As the number of components increases, the mean values and standard deviations of final assembly increase. For example, using the worst assembly strategy, the mean values of the amount of unbalance are 418, 1986, and 2557 g·mm, and the standard deviations are 119, 402, and 512 g·mm for two, three, and four components assembly, respectively.
Besides, as the number of components increases, the optimization performance using the optimal assembly strategy becomes more and more obvious. For example, as the number of components increases, compared to the worst assembly strategy, the mean values of the amount of unbalance using the optimal assembly strategy are reduced by 20%, 76%, and 79%, and the standard deviations are reduced by 2%, 24%, and 26% for two, three, and four components assembly, respectively. The optimal assembly strategy can not only reduce the amount of unbalance of final assembly but also enhance the dispersion of the assembly results.
The proposed method can be used to guide the tolerance design for the real aero-engine. Assume that the machining errors of components 1, 2, 3, and 4 are δ1, δ2, δ3, and δ4, respectively. The ratio of the machining error for each component is t (δ2/δ1 = δ3/δ1 = δ4/δ1 = t). The machining errors of component 1 are 0.005, 0.01, 0.015, and 0.02 mm, respectively. In the aero-engine assembly, the relationship between the machining error and the amount of unbalance using the optimal assembly strategy is shown in Figure 11.
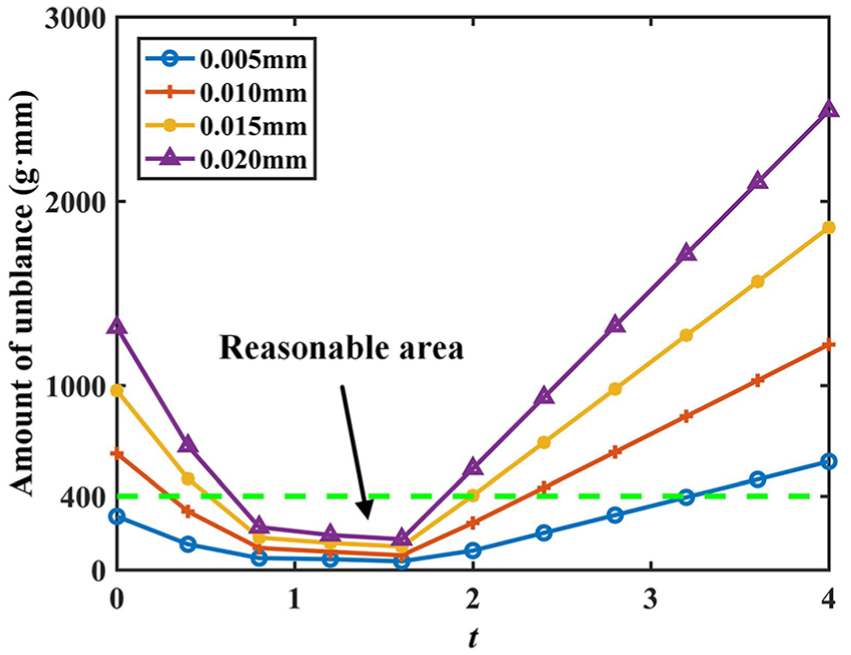
Amount of unbalance for different machining errors in the aero-engine assembly.
Figure 11 shows that the optimal ratio t of machining error is obtained in the aero-engine assembly, which makes the amount of unbalance minimization. In this way, the optimal design value of machining error for each component is obtained. For example, the minimum amount of unbalance of final assembly is 47 g·mm when the machining error of component 1 is 0.005 mm and the ratio t is 1.6, that means the machining errors of other components are 0.008 mm.
In the real machining process, the machining error cannot be controlled in the optimal value. The machining error can only be limited within a certain range. For example, in order to limit the amount of unbalance less than 400 g·mm, the reasonable design range of machining error is obtained in Figure 11. If the machining error of component 1 is 0.01 mm, the reasonable design range of t is [0.4, 2], that means the reasonable range of machining error for other components is [0.004, 0.02 mm]. Therefore, in order to limit the amount of unbalance under a certain value, as the machining error of the first component increases, the reasonable design range of machining error for other components is controlled more and more strict.
Using the proposed method, the assembly result can be improved by limiting the design range of machining error for each component. As shown in Figure 10, the mean value of amount of unbalance is 543 g·mm in the aero-engine assembly. When the ratio of machining error t is [0.8, 1.6], that means the design range of machining error for other components is [0.016, 0.032 mm], the amount of unbalance of final assembly is reduced to 167 g·mm.
Conclusion
The article proposes a novel method to control the amount of unbalance in the assembly, which takes the machining error, the assembly error, and the measuring error into account. The coefficient and correction factor matrices of mass eccentric deviations are defined in the article to analyze the mass eccentricity propagation and amplification in the assembly. The influence of the machining error, the measurement error, and the assembly error on the mass center is analyzed in the assembly. The connective model is developed in the assembly and the amount of unbalance can be minimized by controlling the assembly angle of component.
The effectiveness of the proposed method in improving the amount of unbalance propagation for cylindrical components is verified through the real aero-engine assembly experiments. As the number of components increases, compared to the worst assembly strategy, the mean values of the amount of unbalance using the optimal assembly strategy are reduced by 20%, 76%, and 79%, and the standard deviations are reduced by 2%, 24%, and 26% for two, three, and four components assembly, respectively. The optimal assembly strategy not only reduces the amount of unbalance of final assembly but also enhances the dispersion of the assembly result. The proposed method can improve the assembly result by limiting the design range of machining error for each component in the assembly. The amount of unbalance of final assembly reduces from 543 to 167 g·mm by selecting the reasonable design range of machining error for each component.
The proposed method can be applied to guide not only the tolerance design but also the assembly of cylindrical components. Besides, the assembly quality and efficiency are greatly improved based on the optimal assembly strategy, especially for the assembly of multistage precise cylindrical components.
Footnotes
Declaration of conflicting interests
The author(s) declared no potential conflicts of interest with respect to the research, authorship, and/or publication of this article.
Funding
The author(s) disclosed receipt of the following financial support for the research, authorship, and/or publication of this article: This research was supported by the National Natural Science Foundation of China (Grant Numbers 51805117 and 61575056), the Fundamental Research Funds for the Central Universities (Grant Number HIT.NSRIF. 2019019), and the Natural Science Foundation of Heilongjiang Province (Grant Number F2016012).