
Abstract
Sufficient preload in a bolted joint is key to ensuring the reliability of mechanical products; however, under vibration, preload decrease often occurs. The mechanism of preload decrease has not yet been fully clarified. In this study, finite element models of bolted joints with and without helix angles were constructed to study the mechanism of preload decrease under transversal vibration. Based on the finite element analysis results, a new cause of preload decrease, denoted as stress release and redistribution, was discovered and explained in detail. The mechanism of preload decrease caused by stress release and redistribution, cyclic plasticity deformation and rotation loosening is studied systematically, and the typical mode of preload decrease is proposed. Based on the preload decrease curve, more comprehensive evaluation criteria are established, quantified using three parameters to represent the locking behavior of bolted joints. Finally, experiments were conducted to verify the reliability of the preload decrease results.
Introduction
Bolted joints are very important components in mechanical products, 1 providing connecting, fastening and sealing functions. A bolted joint requires sufficient preload to provide these potential functions; however, under vibration, a decrease in the preload often occurs; 2 excessive preload decrease can induce fatigue failure 3 and bolt fracture, 4 resulting in catastrophic consequences in certain situations.
It is widely known that preload decrease mainly results from rotation loosening between the internal and external thread, and the mechanism of rotation loosening has been studied systematically over several decades. Early studies focused on the effect of axial vibration loading (parallel to the bolt axis),5–7 but no obvious rotation loosening was found under pure axial vibration loading. In 1969, a German engineer named Junker 8 designed an experimental set-up to study the loosening behavior of bolted joints due to shear or transversal vibration loading (vibration loading perpendicular to the thread axis) and found that bolted joints can loosen quickly under shear vibration loading. Since then, shear or transversal vibration loading has been regarded as the major form of vibration influencing the loosening failure of bolted joints. Many researchers have attempted to establish theoretical models to understand the mechanism of rotation loosening under transversal vibration;9–14 however, these theoretical models were mainly based on some unknown assumptions that require further validation. More investigations were carried out to reveal the mechanism of rotation loosening under transversal vibration using finite element analysis (FEA) and experiments. Pai and Hess15,16 researched the relationship between rotation loosening and the contact state at the thread and bearing surfaces. First, the concept of local slip was proposed and it was found that the accumulation and expansion of local slip occurring at the thread and bearing surfaces contributed to continuous rotation loosening. In addition, the results also showed that the process of rotation loosening could be divided into four different types, depending on the nature of the slip at the thread and bearing surfaces. Izumi et al. 17 found that rotation loosening was initiated when the thread surface reached a complete slip state, regardless of the slip state at the bearing surface. In another article, Izumi et al. 18 introduced the concept of micro slip, which involves a no-constant-sticking region over a vibration cycle. They found that rotation loosening can proceed when either micro slip or complete slip has occurred. Dinger and Friedrich 19 proposed a parameter based on the ratio of the slip to the total contact area to represent the rotation loosening behavior of bolted joints.
Besides rotation loosening, cyclic plasticity deformation is believed to be another factor contributing to preload decrease. A typical sequence curve for preload decrease, which contains two distinct stages, was depicted by Jiang et al. 20 In the first stage, 21 there is no relative rotation between the nut and bolt. Preload decrease results from local cyclic plasticity deformation occurring near the roots of the engaged threads. According to Jiang et al.’s report, the clamping force reduction could range from 10% to more than 40% of the initial preload after 200 loading cycles, depending on the loading magnitude. Hou and Liao 22 further investigated the effects of various factors on the preload decrease caused by cyclic plasticity deformation, such as load direction, preload, side load amplitude and friction factor. In the second stage, 23 the preload decreases rapidly, attributed to significant rotation between the bolt and nut. Jiang et al., 24 Zhang et al. 25 and Sanclemente and Hess 26 systematically studied the effects of various factors on the rotation loosening behavior of bolted joints. The factors investigated by them include the initial preload, nut type, clamped length, loading direction, material elastic modulus, nominal diameter, thread pitch, hole fit and lubrication.
In this study, finite element (FE) models of bolted joints were constructed, and cyclic transversal vibration applied to the bolted joints was simulated. Based on the simulation results, we found another cause for preload decrease, stress release and distribution, which has not been discussed in previous studies. The mechanism of preload decrease is discussed systematically. A typical mode for preload decrease is first proposed, and based on the preload decrease curve, more comprehensive evaluation criteria are established, quantified using three parameters, to represent the locking behavior of bolted joints. Finally, experiments were conducted to verify the reliability of the study of preload decrease.
FE model
A FE model was built to simulate the process of the Junker test. Our model used a typical bolted joint structure. Figure 1 provides two-dimensional (2D) sketches of the nut, bolt and joint structure, where A = 6.4 mm, B = 15 mm, L = 40 mm, D = 10 mm, S = 15.7 mm, E = 18.1 mm, M = 7.5 mm and H1 = H2 = 12 mm. In addition, the helix angle is 2.8° and the pitch is 1.5 mm. An FE mesh was built using the commercially available preprocessor HyperMesh 12.0 (Figure 2(a)) software. Here, the mesh of the bolted joint was generated using Fukuoka and Nomura’s 27 method, which accurately takes into account the helical geometry and generates an orderly three-dimensional hexahedral mesh for the bolted joint. The bolt head and nut are both simplified to cylinders for meshing convenience. Only the movable plate (upper plate in Figure 1(c)) was modeled, because the frictional effect between the upper and bottom plate is negligible.16–18 Meshes of a bolted joint both with and without helix angles were established for comparison, as shown in Figure 2(b) and (c).
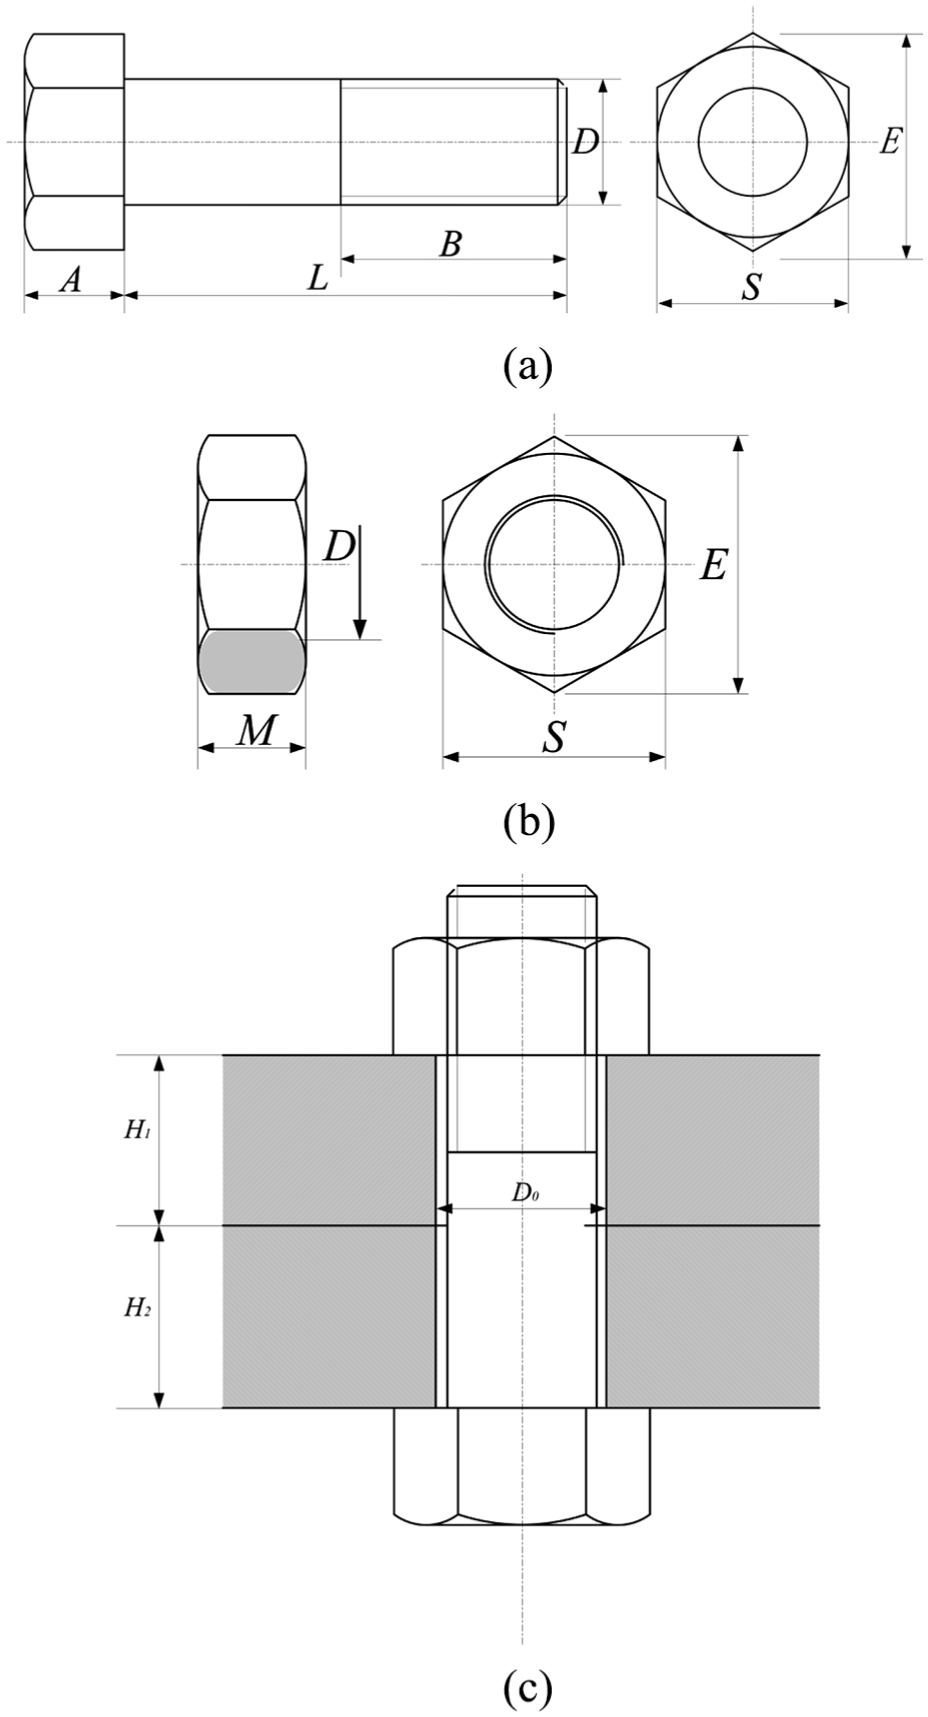
Two-dimensional sketches of (a) the nut, (b) the bolt and (c) the bolted joint.
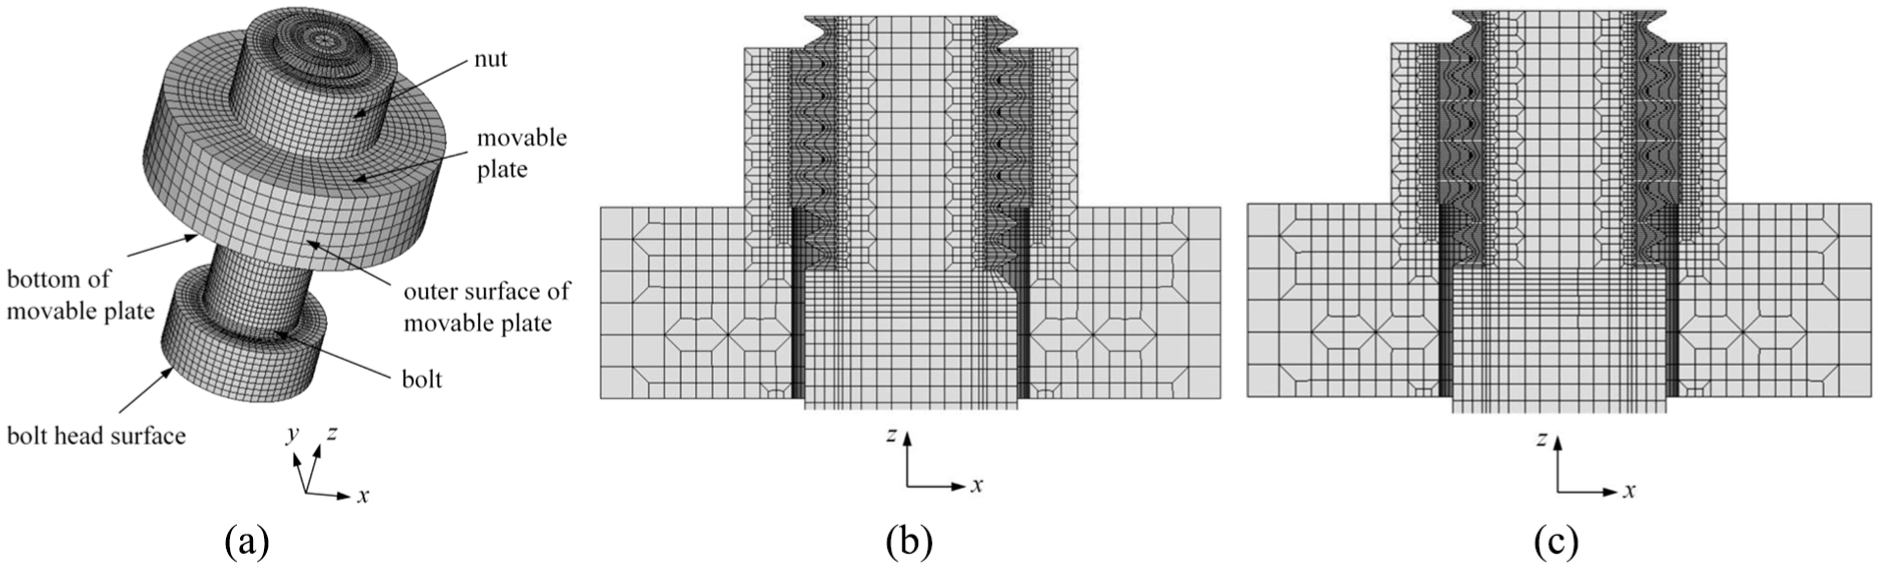
The finite element mesh of the bolted joint: (a) the entire bolted joint, (b) the cross-section of the threaded part with a helical angle and (c) the cross-section of the threaded part without a helical angle.
The FEA was implemented using the commercial software Ansys 14.5, with a Solid 185 mesh type. The material applied was 1045 steel, with a Young’s modulus of 206 GPa and a Poisson’s ratio of 0.3. The material was linear elastic, and plastic effects were not considered. The model has two contact interfaces: between the mating threads and between the nut and the movable plate. A friction coefficient value of 0.15 was assigned to all sliding interfaces (a typical value also adopted by other researchers, for example). 17 To generate the preload, the bolt (no-thread portion) was first divided into two portions by a plane perpendicular to the axis of bolt. Then, these two portions were pulled together (i.e. a penetration displacement was generated) by the pretension element PRETS 179. 28 Thereby, an equivalent expected preload was generated. The preload was set to be 10 kN. A transversal force was applied to the outer surface of the movable plate. The simulation was based on the quasi-static assumption, because the vibration frequency of the actual Junker test is relatively low (typically <15 Hz).16–18 Other boundary conditions were as follows: (1) the bolt head surface was constrained in all directions and (2) the bottom of the movable plate was restricted in the y and z directions. Based on a grid refinement study, the appropriate mesh density of the FE model was determined to be around 160,000.
Preload decrease with and without helix angles
The shear force Fs required to cause complete bearing slip was calculated to be 1500 N according to equation (1)

where Fb is the preload of the bolted joint and μb is the friction coefficient at the bearing surface. A transversal force of 1350 N, accounting for 90% of Fs, was exerted cyclically on the movable plate along the x+ and x– directions. The number of vibration cycles was set to 50, and FE models with and without helix angles were applied. Figure 3 shows the changes in the preloads with an increase in vibration cycle for the two cases, and it can be clearly seen that there are two distinct stages in the preload decrease curves. In the initial vibration cycles (about the first three vibration cycles), the preloads both decreased rapidly. This indicates that the severe preload decrease occurring in this stage is independent of the helix angle; that is to say, rotation loosening does not contribute to the sharp preload decrease because rotation loosening cannot occur in a bolted joint without a helix angle. Therefore, there must exist another unknown cause resulting in preload decrease in the initial vibration cycles. We will state and analyze this cause in detail in the next section. In the following vibration cycles, the changes in preloads were different. For the FE model with helix angle, the preload decreased nearly linearly, as a result of rotation loosening. For the model without helix angle, the preload remained almost constant (ignoring fluctuations), according to expectation.
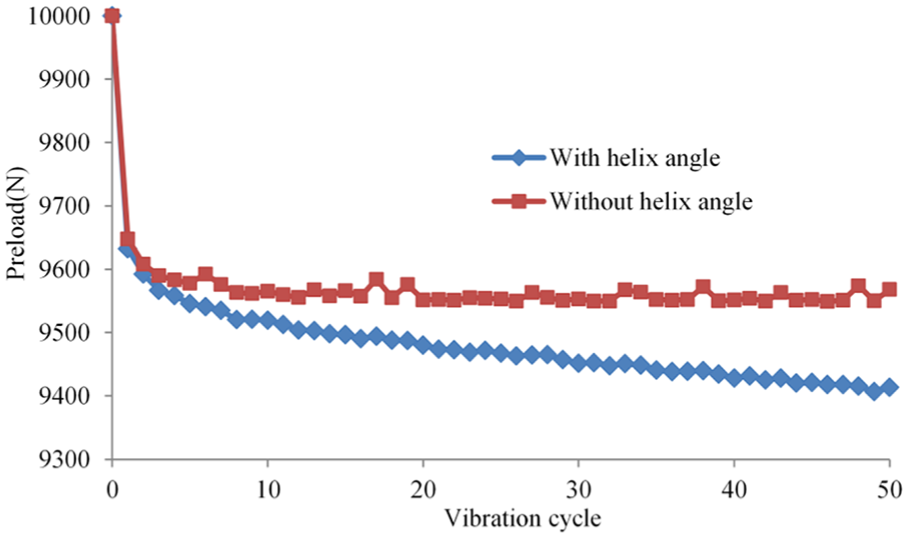
Changes in preloads with increasing vibration cycle for FE models with and without helix angles.
Another cause of preload decrease: stress release and redistribution
In this section, the mechanism of sharp preload decrease in the initial vibration cycles is revealed from the perspective of the distribution of contact stress. The FE model without helix angle was applied. Figure 4 shows the exertion process of the cyclic transversal force within a complete vibration cycle, and Figure 5 presents a schematic diagram of deformation and slip at the first layer of the engaged thread surface (see Figure 4) during the different vibration positions: a, b, c, d and e. I and J refer to the two positions at the external thread surface denoted by dots, while I′ and J′ refer to the two positions at the internal thread surface denoted by crosses. At position a, I and I′, as well as J and J′, are coincident (see Figure 5(a)) due to friction effects. During the first half of the vibration cycle (ab and bc), relative slip between I and I′ may occur, as well as between J and J′. When the transversal force is exerted from a to b, the relative slip between I and I′ occurs more easily than when the transversal force is exerted from b to c due to the thread angle. This indicates that when the transversal force is recovered to 0 at the position c, there should be a slip distance between I and I′ and the positions of I and I′ can no longer be coincident (see Figure 5(c)), as with position a. Similarly, the positions of J and J′ also cannot be coincident at position c (see Figure 5(c)). In the same way, in the other half of the vibration cycle (cd and de), the position of I does not overlap with I′ and J does not overlap with J′ (see Figure 5(e)) at position e after one complete vibration cycle. Therefore, the pressure distribution at the engaged thread surface may change after vibration.
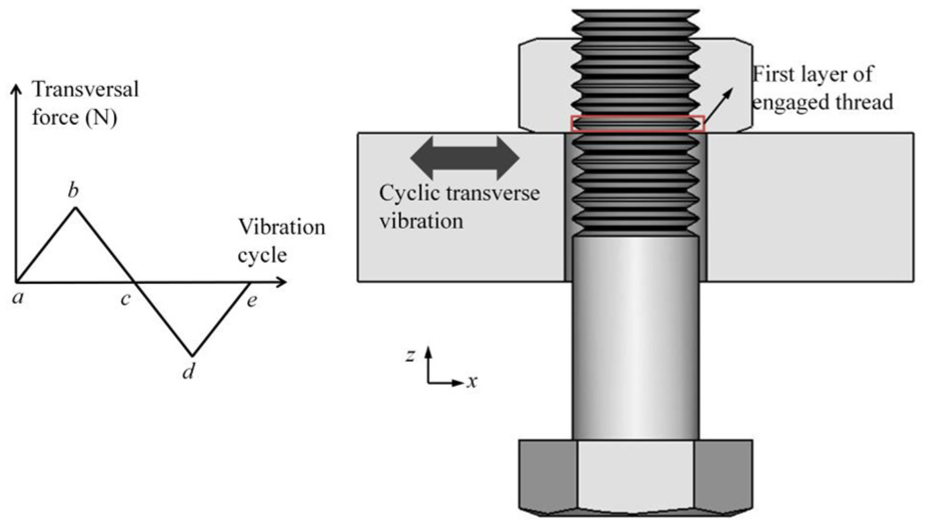
Exertion process of cyclic transversal force within a complete vibration cycle.
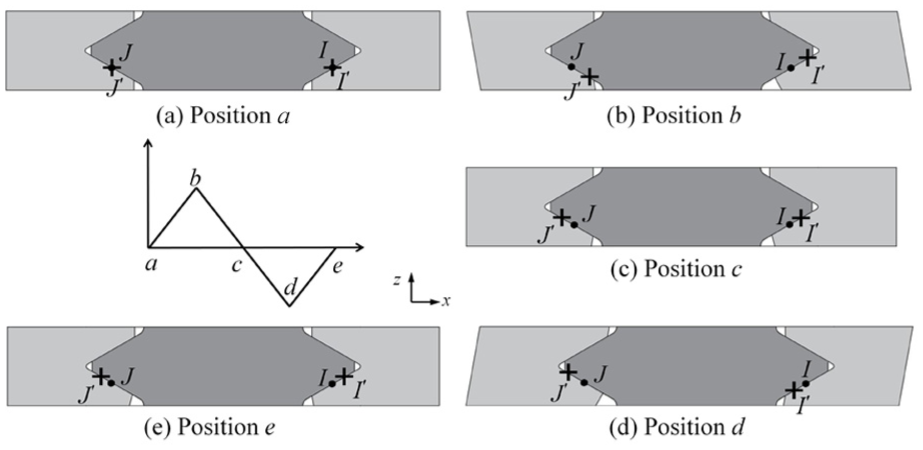
Schematic diagram of deformation and slip at the first layer of the engaged thread surface during the different vibrational positions: (a) Position a, (b) Position b, (c) Position c, (d) Position d and (e) Position e.
Figure 6 shows the contact pressure distributions of the engaged thread surface at the positions a, c and e. We can find that the contact pressure distributions at the positions c and e varied, compared to the position a. For quantitative comparison, the contact pressure of the first layer of engaged thread was analyzed. Figure 7 shows the front and bottom view of the engaged thread. Four nodes, N, P, Q and R, were on the engaged thread surface and lay on the circumference of the pitch diameter. The pressure distributions of the first layer of the engaged thread at positions a, c and e are presented in Figure 8. It can be seen that the contact pressure was distributed nearly uniformly at position a; however, the contact pressures were redistributed at positions c and e. At position c, the contact pressure was at a minimum at node Q; this is because a large slip occurred at node Q that led to the release of stress there. At position e, a large slip occurred at node N, and hence, the minimum contact pressure appears there due to stress release. The average contact pressures at positions a, c and e were calculated to be 91.32, 89.38 and 89.20 MPa, respectively. It indicates that the overall contact pressure decreased from position a to position e. Based on above analysis, a new factor, stress release and redistribution, contributing to a sharp preload drop in the initial vibration cycles, was identified.
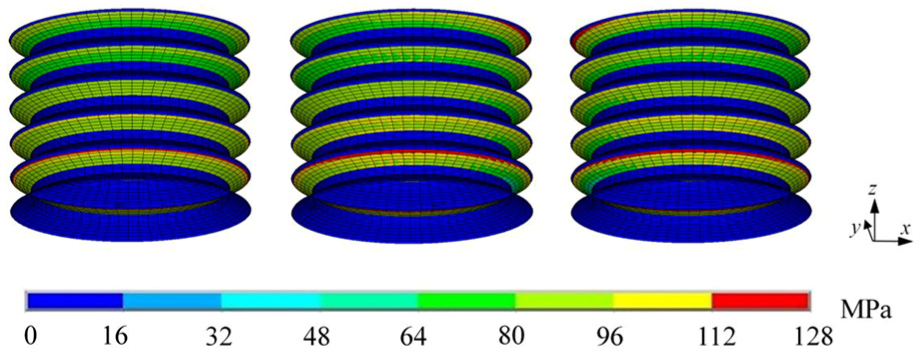
Contact pressure distributions of the engaged thread surface at the points a, c and e.
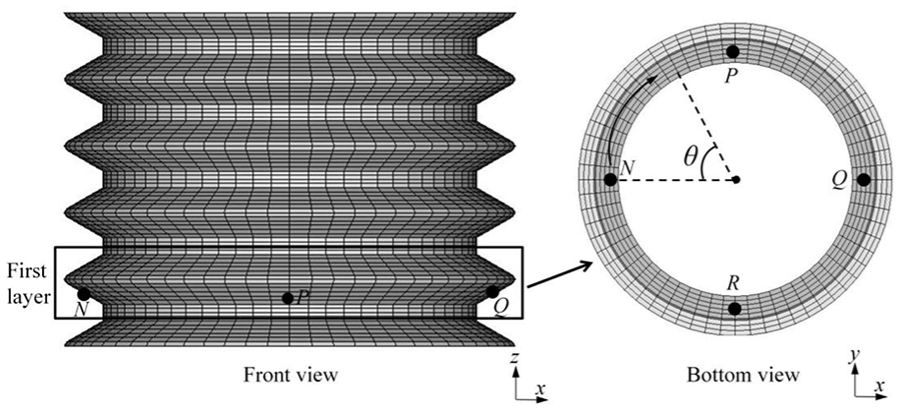
Front and bottom view of the first layer of the engaged thread.
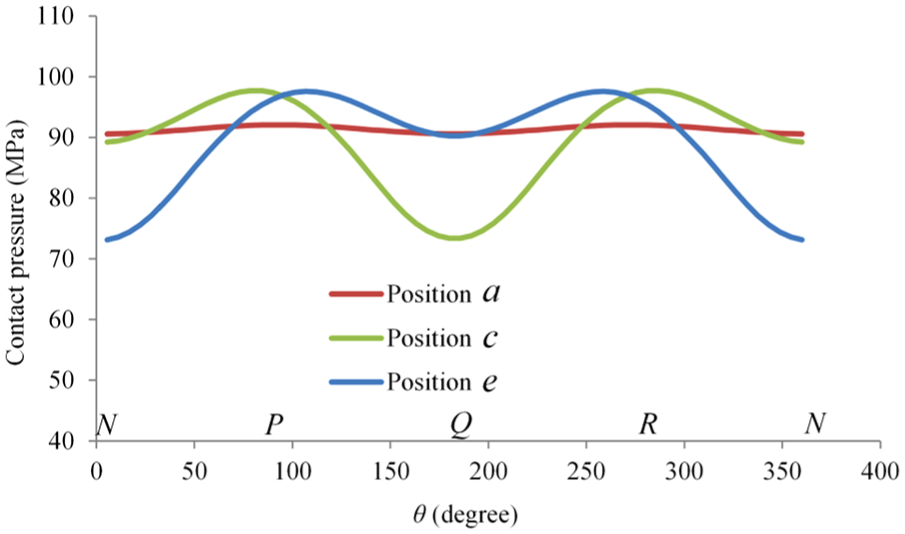
Pressure distributions of the first layer of the engaged thread.
Mechanism of preload decrease
Jiang et al.20,21,23–25 systematically researched the effects of cyclic plasticity deformation and rotation loosening on preload decrease, and divided the process of preload decrease into two different stages. However, no studies published thus far have considered the effect of stress release and distribution. In this section, the effects of stress release and distribution, cyclic plasticity deformation and rotation loosening on the preload decrease were studied and discussed systematically.
Three types of FE model for bolted joints were applied, including an elastic model without helix angle, a plastic model without helix angle and a plastic model with helix angle. In the plastic model, the plastic material was applied to the bolt and nut while the elastic material was applied to the moving plate. The typical plastic material of the Chaboche kinematic hardening model 29 shown in Table 1 was used. The number of vibration cycles was set to 50. Three different cases, listed in Table 2, were analyzed. The effect of each cause on the preload decrease can be calculated and distinguished through a comparison of the results of the three types of FE model. To be specific, the preload decrease due to stress release and redistribution can be obtained directly from the elastic model without helix angle. The influence of cyclic plasticity deformation on the preload decrease can be determined from the result of the preload decrease of the plastic model without helix angle, subtracting that of the elastic model without helix angle. Similarly, the effect of rotation loosening on the preload decrease can be determined from the difference between the results of the preload decrease of the plastic models with and without helix angle.
Material parameters of the Chaboche kinematic hardening model.
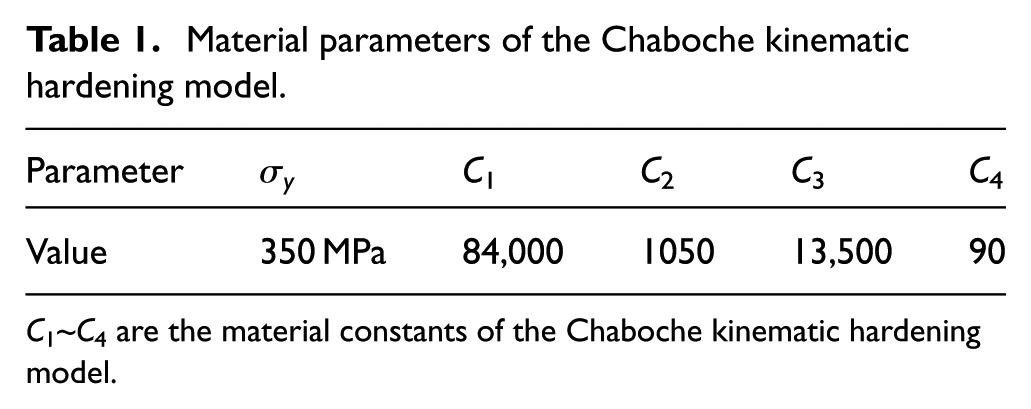
C1~C4 are the material constants of the Chaboche kinematic hardening model.
Three cases with different preloads and transversal forces.
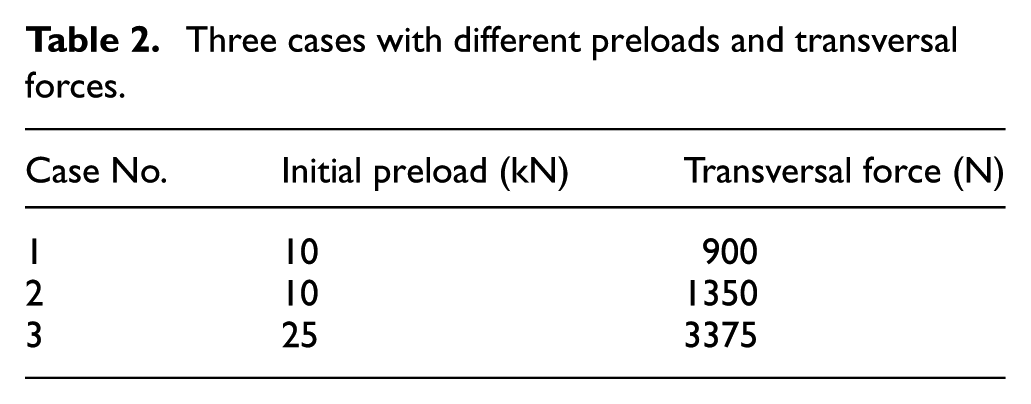
Figure 9(a), (c) and (e) shows the changes of preloads with an increase in vibration cycle under the three different types of FE model for cases 1–3. Based on the results, the influence of each cause on the preload decrease is obtained and presented in Figure 9(b), (d) and (f). It can be clearly seen that stress release and redistribution and cyclic plasticity deformation commonly cause a large preload decrease in the initial few vibration cycles. With further vibration cycles, the effects of these two factors on the preload will disappear. It can also be seen that the preload decrease caused by rotation loosening is almost proportional to the vibration cycle and is sustained with an increase in vibration cycle.
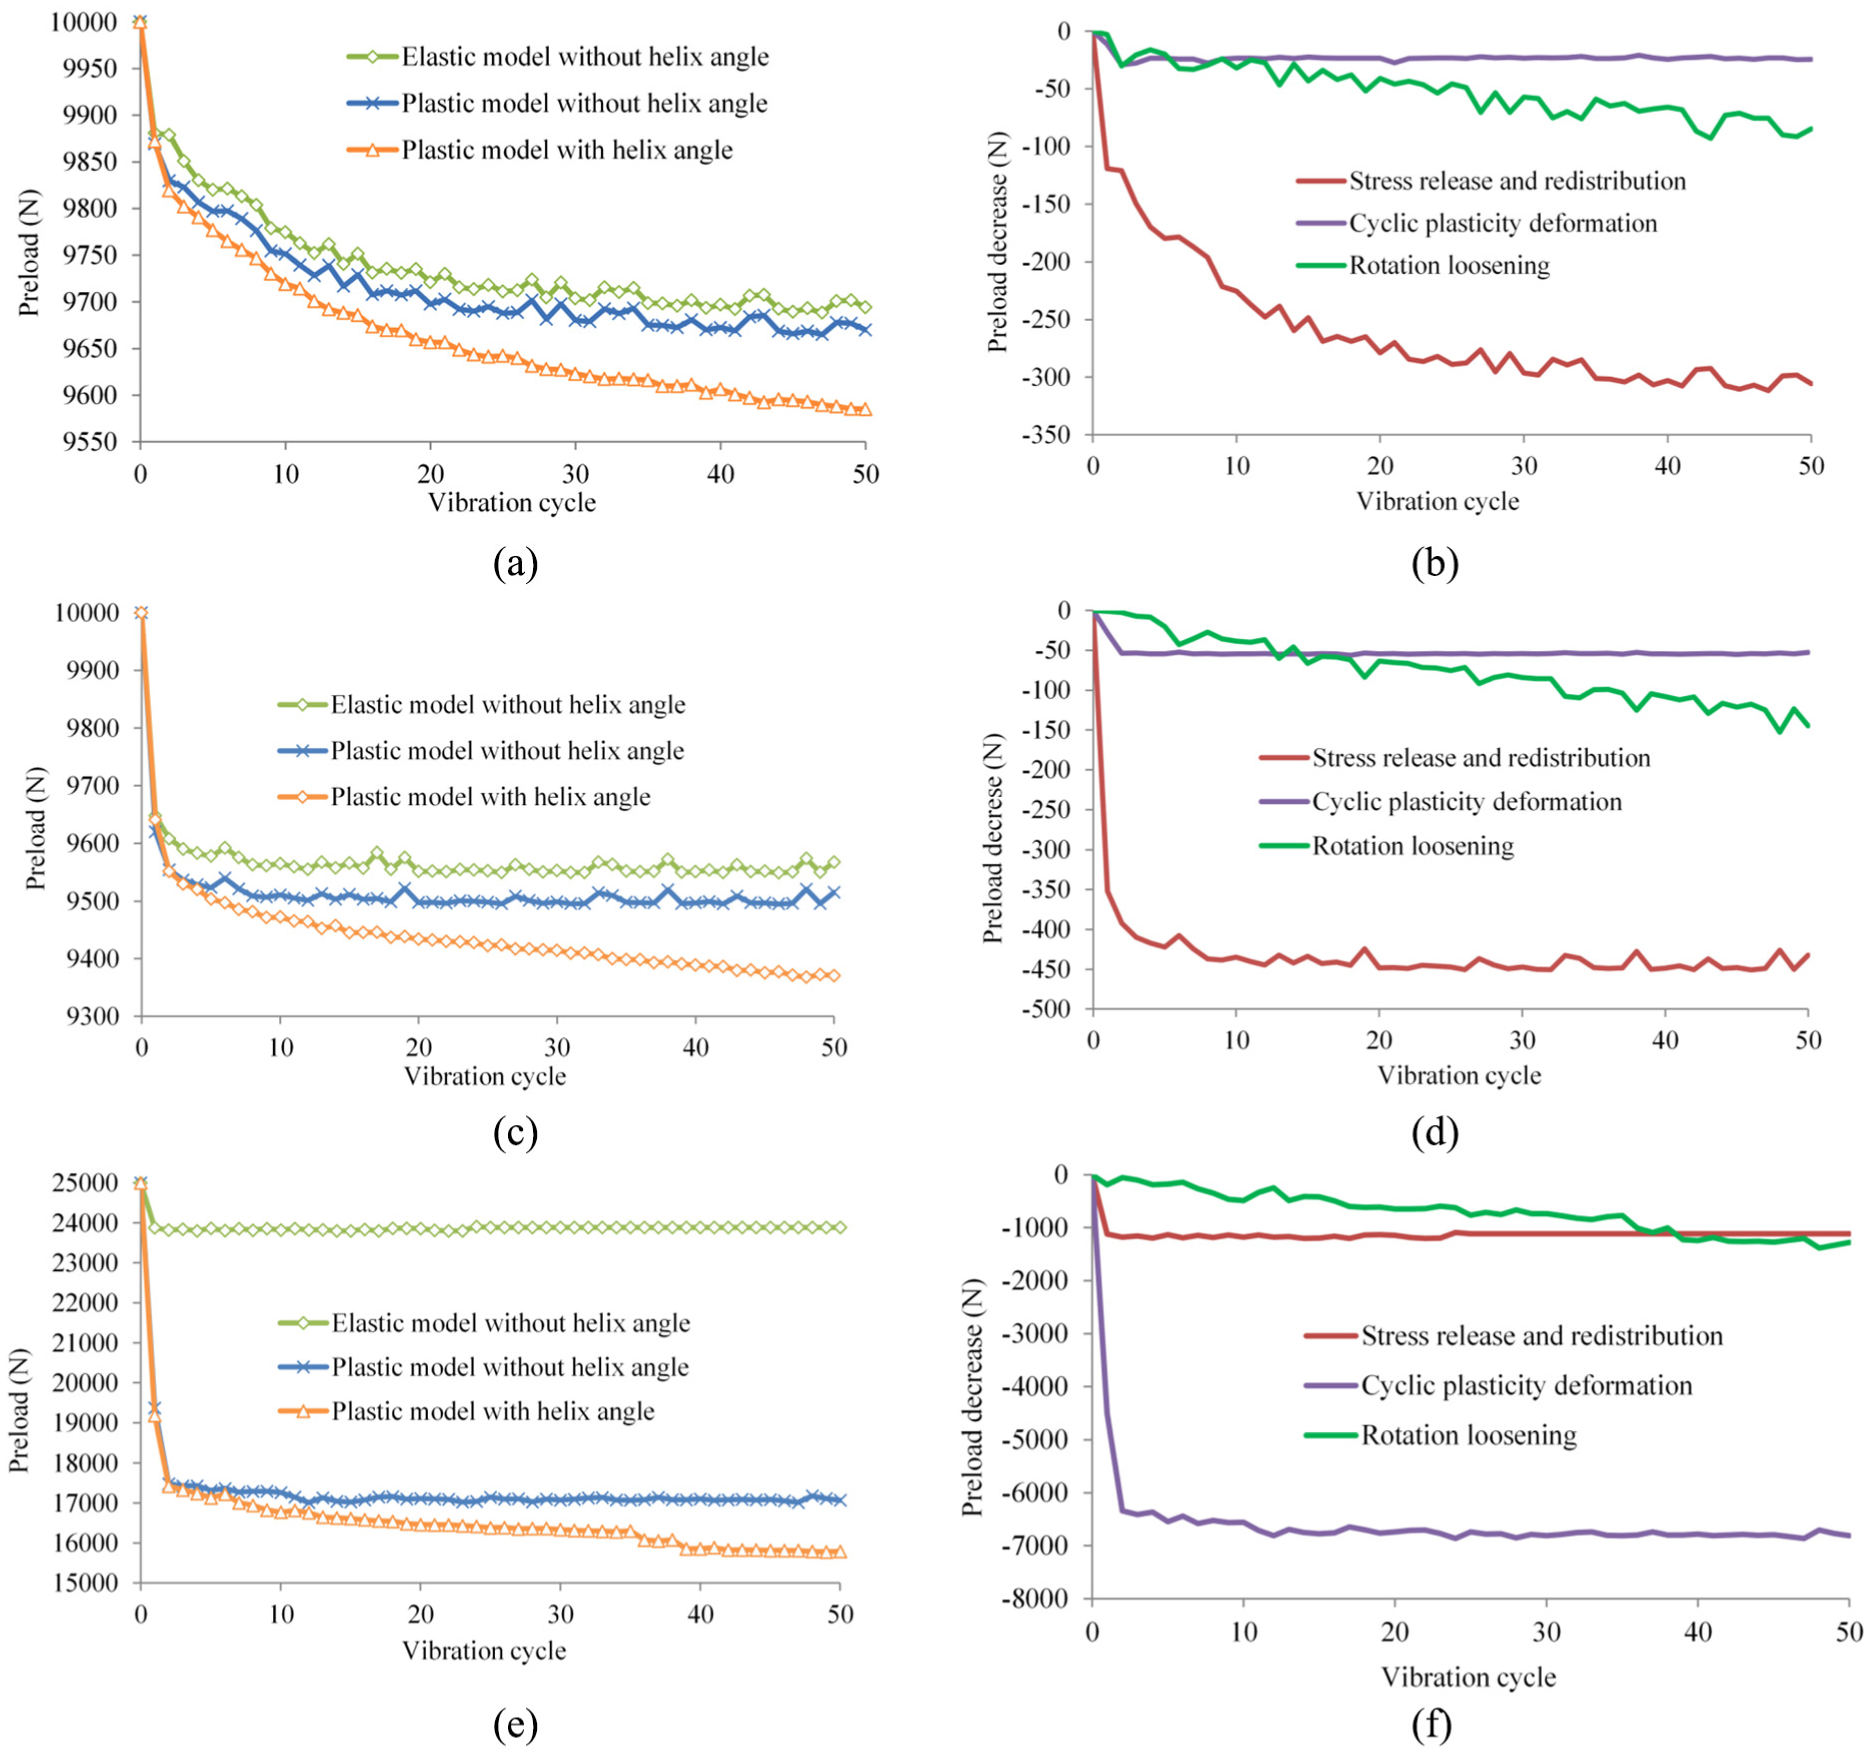
Changes of preloads for cases 1–3: (a), (c) and (e): changes of preloads with an increase in vibration cycle under three types of FE model for cases 1, 2 and 3, respectively; (b), (d) and (f): influence of each cause on the preload decrease for cases 1, 2 and 3, respectively.
Above analyses are based on the hypothesis that the effects of each cause are completely independent or have weak correlations with each other. This hypothesis is hard to be demonstrated theoretically. However, based on the simulation results, no apparent correlations among the effects of each cause have been found. First, in Figure 9(b), the preload decrease caused by stress release and redistribution becomes larger with an increase in vibration cycles. Meanwhile, the preload decrease caused by cyclic plasticity deformation is almost unchanged after three vibration cycles. This is scarcely to happen if the effect of stress release and redistribution and that of cyclic plasticity deformation correlate with each other. Similarly, in Figure 9(d), it can be seen that the results of preload decrease caused by stress release and redistribution and cyclic plasticity deformation are almost unchanged after 10 vibration cycles. However, the preload decrease caused by rotation loosening continues all the time. It is an evidence that the rotation loosening is not affected by the stress release and redistribution and the cyclic plasticity deformation. In summary, no apparent correlations among the effects of each cause have been found, so above discussion about the results shown in Figure 9 is valid.
Based on the above discussion, a typical curve of preload decrease for bolted joints under transversal vibration should contain three different stages, as shown in Figure 10. Stage I is located within the initial vibration cycles. At this stage, the preload decrease curve is nonlinear, mainly caused by stress release and redistribution and cyclic plastic deformation. In addition, rotation loosening will also occur. In stage II, the effects of stress release and redistribution and cyclic plastic deformation have finished, and the preload decrease mainly results from rotation loosening. Thus, the preload decrease curve is nearly linear. As the preload decreases continuously, at stage III, fatigue fracture will appear under vibration. Furthermore, it is important to note that when the cyclic transversal force is sufficiently small, rotation loosening will not occur.16,18 Under this circumstance, the preload decrease slope at stage II may be zero. The preload decrease is mainly caused by stress release and redistribution and cyclic plastic deformation. Fatigue fracture at stage III will still occur after enough vibration cycles.
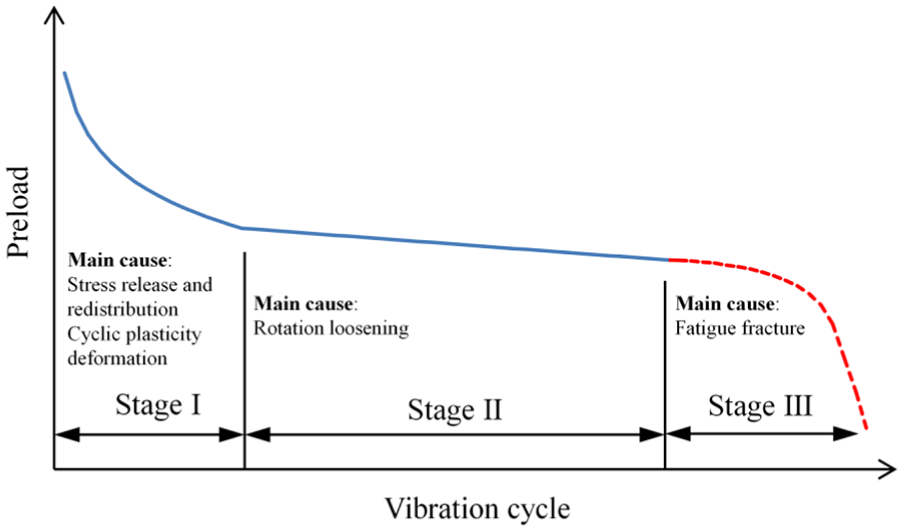
Typical curve of preload decrease comprising three stages.
Discussion on evaluation criteria for locking behavior
The international standard ISO 16130 30 provides three evaluation criteria for the locking behavior of bolted joints under transversal vibration. The first criterion is determination of the number of vibration cycles at the time of complete loss of clamp force, the second is determination of the residual clamp force following a defined number of vibration cycles, and the third is determination of the number of vibration cycles completed before fatigue fracture of the bolt. ISO 16130 states that, in practice, any of the above three options can be used. However, according to the analyses of the preload decrease curves (see Figure 10), these three evaluation criteria may be questionable. For the first criterion, under vibration, it is difficult to make the clamp force of a bolt joint vanish completely without fracture; hence, the number of vibration cycles at the time of complete loss of clamp force cannot be calculated to compare the locking behavior of bolted joints. For the second criterion, the proper value of the so-called defined number of vibration cycles is unclear. For example, Figure 11 shows two different preload decrease curves under cyclic transversal vibration. It can be seen that the residual clamp force of bolted joint 1 is larger than that of bolted joint 2 when the defined number of vibration cycles is more than Nd. This indicates that the locking behavior of bolted joint 1 is better than that of bolted joint 2. However, the opposite conclusion will be reached when the defined number is below Nd. For the last criterion, this actually characterizes the fatigue property of bolts, not the anti-loosening capability. In fact, locking behavior subsumes both the anti-loosening capability and the fatigue properties. Therefore, new and extended evaluation criteria need to be established to accurately compare the locking behavior of bolted joints.
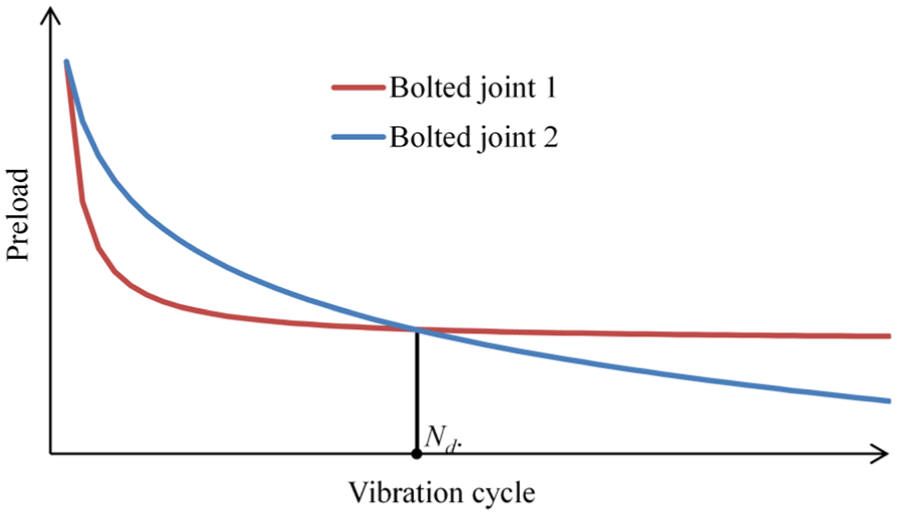
Two different curves of preload decrease for bolted joints.
Based on the preload decrease curve shown in Figure 10, more comprehensive evaluation criteria are proposed and quantified using three parameters: the initial preload drop, the rate of steady preload decrease and the number of vibration cycles until fatigue fracture of the bolt, as shown in Figure 12. The three parameters show the behavior of the preload decrease at stages I, II and III, respectively, and can comprehensively represent the locking behavior of bolted joints. At stage I, the initial preload drop is used to characterize the final preload decrease caused by stress release and redistribution and cyclic plasticity deformation. This parameter characterizes the anti-loosening capability of bolted joints caused by stress release and redistribution and cyclic plasticity deformation. The second parameter is the slope of the preload decrease curve at stage II, denoted as the rate of steady preload decrease. This parameter is used to represent the anti-loosening capability of bolted joints resulting from rotation loosening. At stage III, the last parameter is calculated from the number of vibration cycles until fatigue fracture of the bolt, which is used to characterize the fatigue properties of bolts. Hence, the locking behavior of a bolted joint can be compared and analyzed comprehensively using the above three parameters.
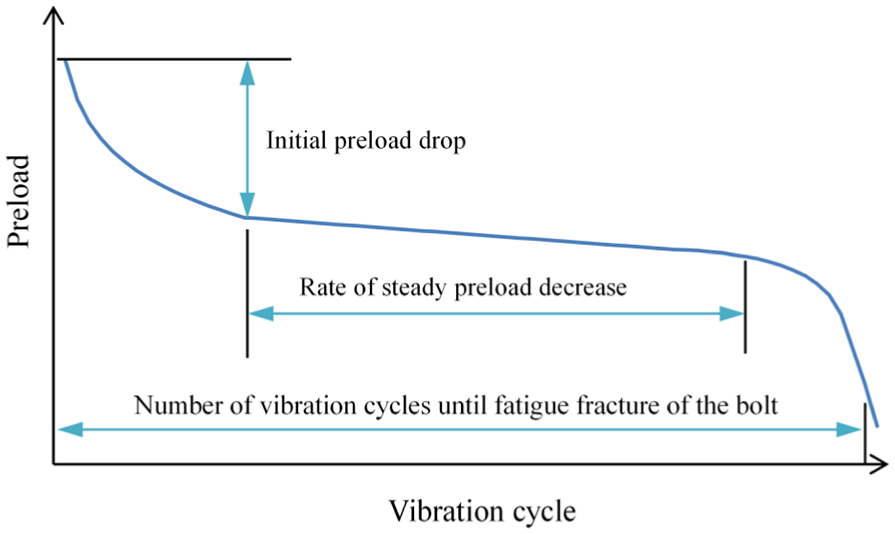
Three parameters representing the locking behavior of bolted joints under transversal vibration.
Experimental results
Experiments were conducted to investigate the behavior of preload decrease of bolted joints under cyclic transversal loading. As shown in Figure 13(a), the Junker test apparatus was used, following the DIN 65151 standard, 31 and Figure 13(b) shows the test principle schematically. Using this test apparatus, the nut and bolt are tightened together with the required preload. Then, a transversal displacement was set to generate cyclic shear loading by an eccentric structure, which is applied to the joint. Several sensors are used to monitor the preload, shear loading and transversal displacement, and standard bolts and nuts, with a nominal diameter of 10 mm and a pitch of 1.5 mm, were applied.
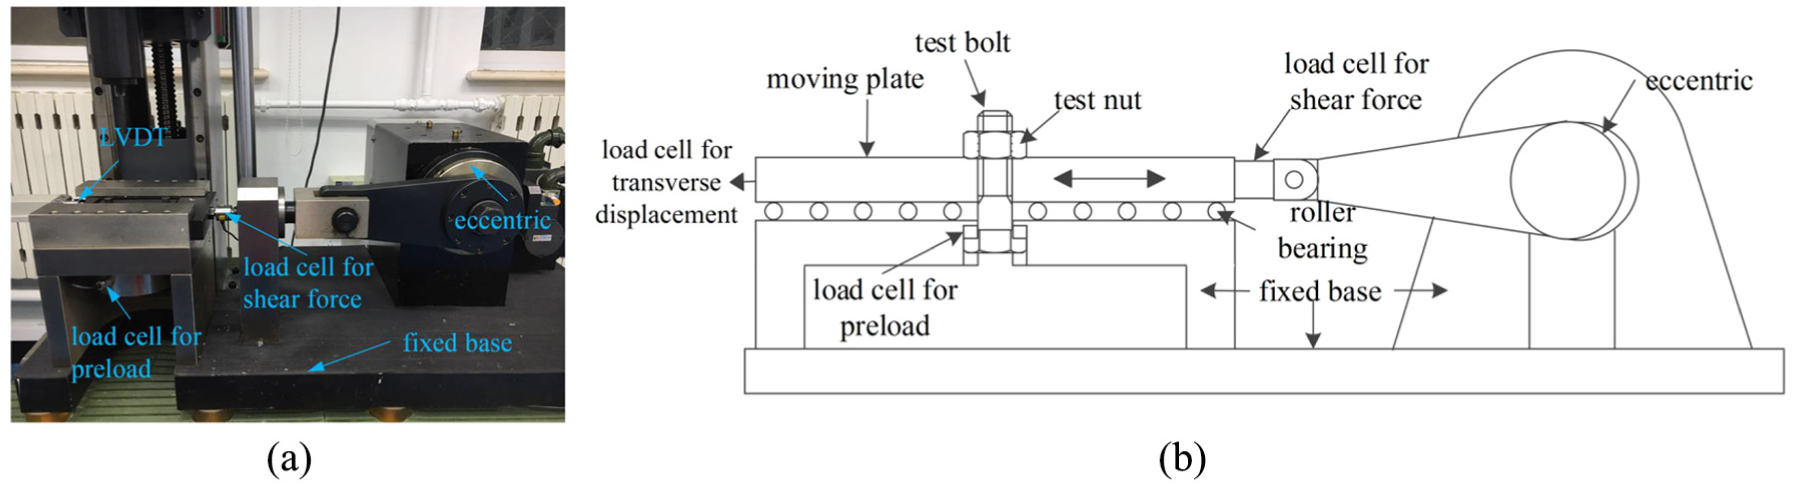
The Junker test apparatus: (a) the test apparatus and (b) the test schematic.
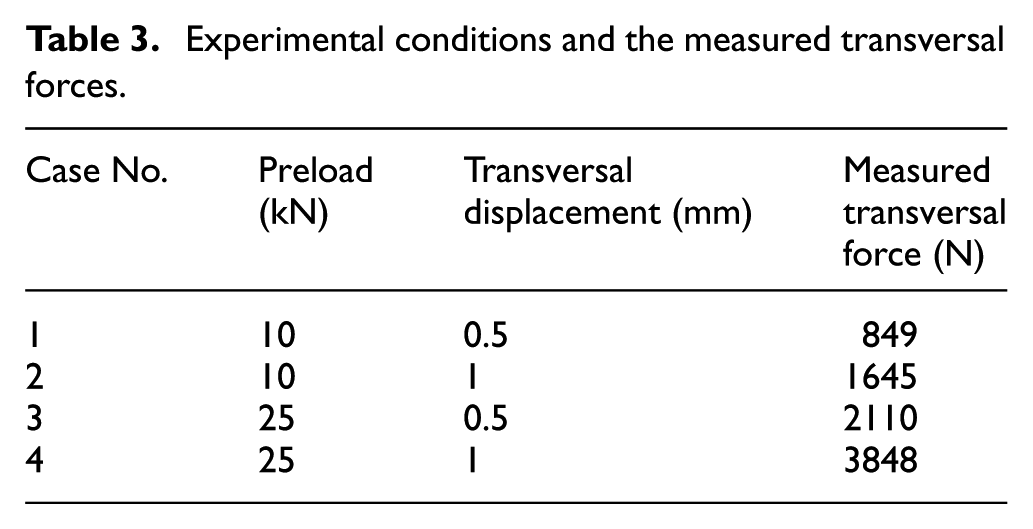
The experimental conditions are listed in Table 3. The transversal force for each case was also measured. Three independent tests were repeated for each case. The transversal vibration frequency was set at 12.5 Hz. Figure 14 shows a bolted joint before and after test. Figure 15 shows the change in preload with an increase in vibration cycle for each sample; it can be clearly seen that the preload decrease curves obtained from all samples agreed with that shown in Figure 10, and contained three different stages. At stage I, the preload dropped sharply. Then there was a steady preload decrease at stage II, caused by rotation loosening. At the last stage (stage III), the bolt fractured due to fatigue failure, as shown in Figure 14(b). The experimental results verify the reliability of the studies on preload decrease.
Experimental conditions and the measured transversal forces.
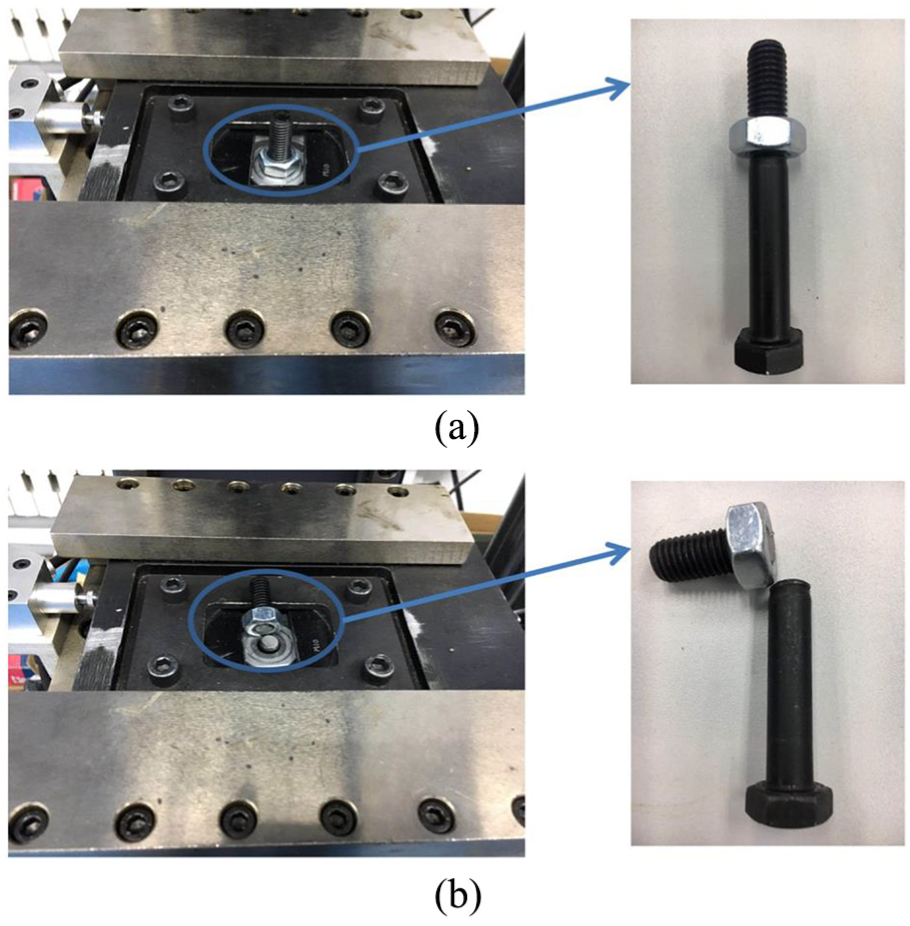
The connection states of a bolted joint before and after cyclic transversal vibration: (a) before vibration and (b) after vibration.
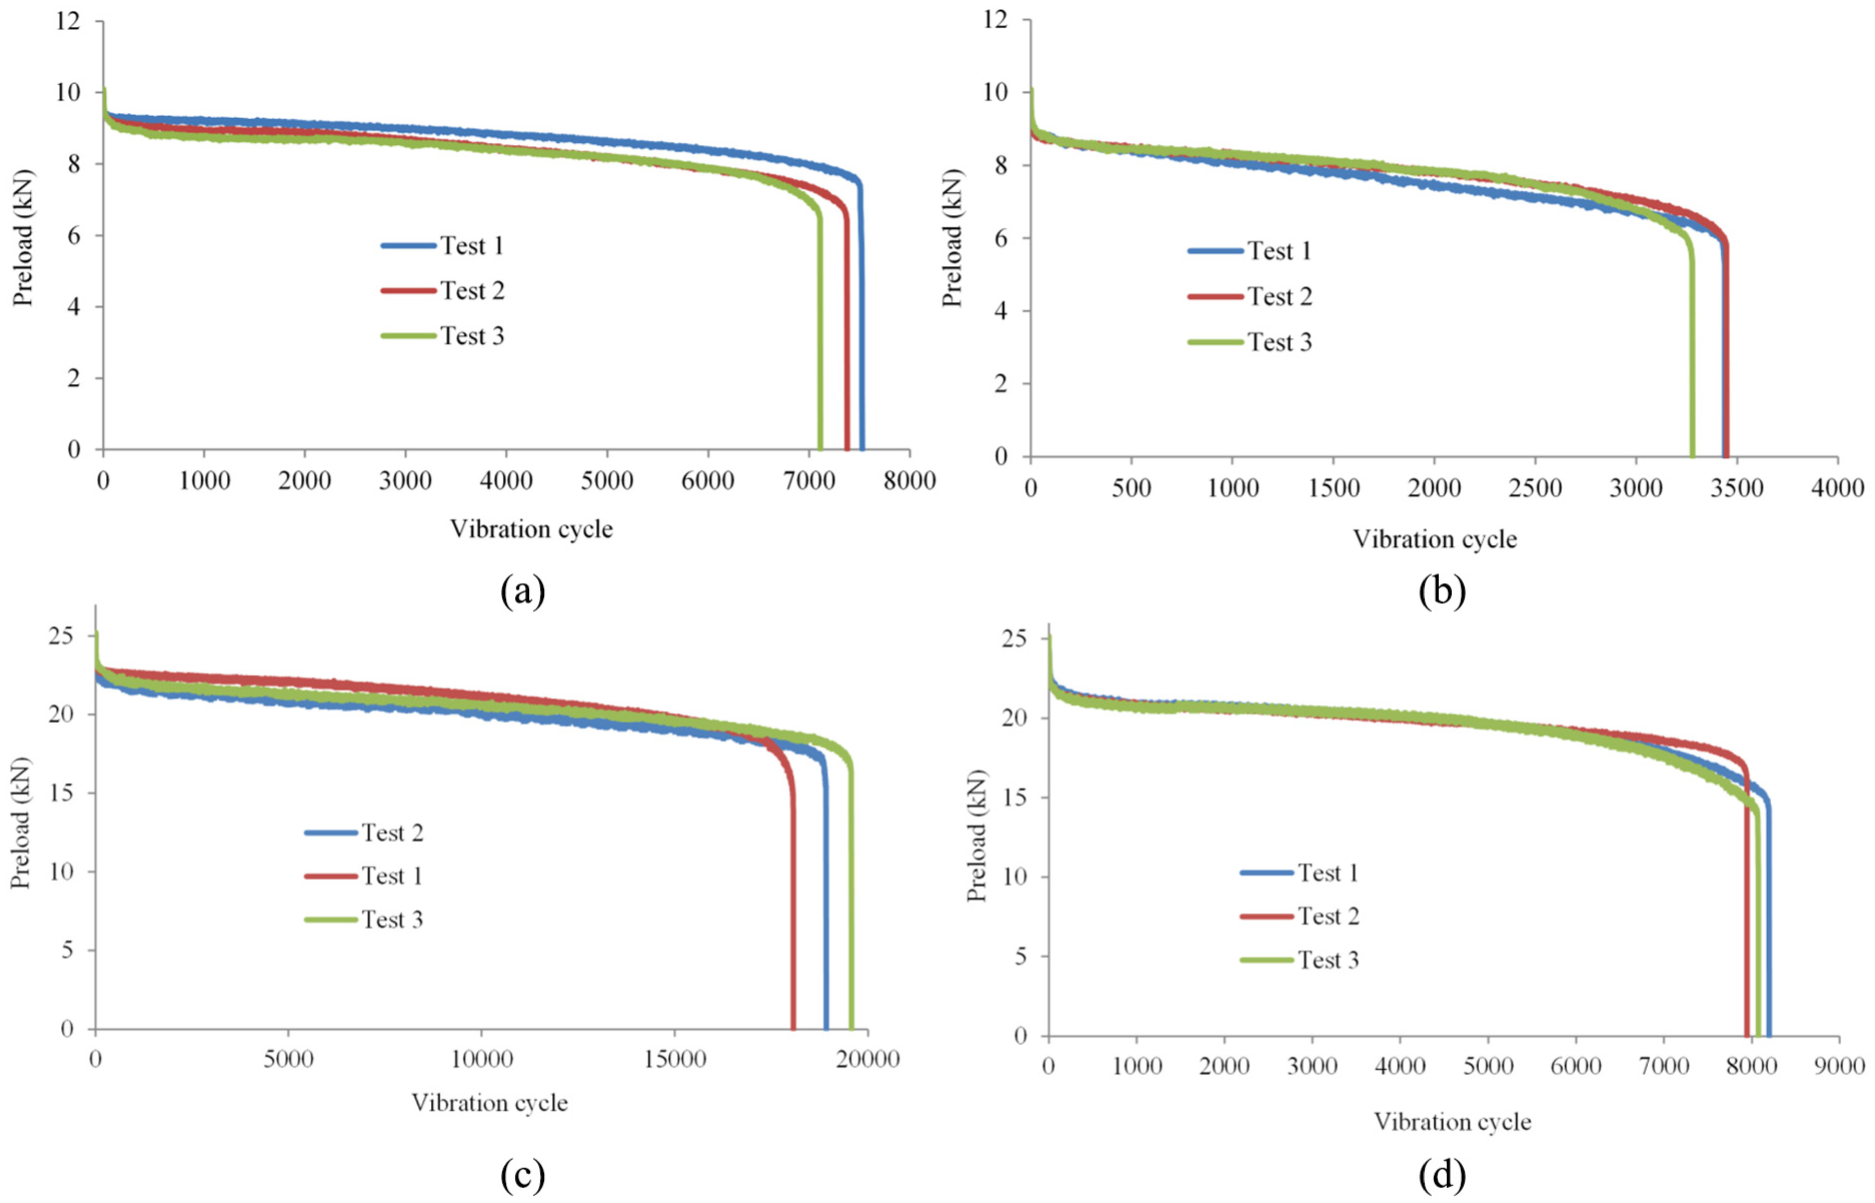
Changes of preloads with an increase in vibration cycle in the transversal vibration experiments: (a) preload of 10 kN and transversal displacement of 0.5 mm, (b) preload of 10 kN and transversal displacement of 1.0 mm, (c) preload of 25 kN and transversal displacement of 0.5 mm and (d) preload of 25 kN and transversal displacement of 1.0 mm.
Conclusion
In this study, FE models of bolted joints with and without helix angles were constructed to study the mechanism of preload decrease under transversal vibration. Based on the FEA results, we first found that stress release and redistribution was an important cause of preload decrease. The mechanism of preload decrease was then discussed considering two other causes: cyclic plasticity deformation and rotation loosening, and a typical mode of preload decrease was proposed. Based on the preload decrease curve, more comprehensive evaluation criteria were established and quantified using three parameters to represent the locking behavior of bolted joints. Finally, experiments were conducted to verify the reliability of the preload decrease results.
Footnotes
Declaration of conflicting interests
The author(s) declared no potential conflicts of interest with respect to the research, authorship, and/or publication of this article.
Funding
The author(s) disclosed receipt of the following financial support for the research, authorship, and/or publication of this article: The authors are grateful for support by the Science Challenge Project (Grant No. TZ2018007), the National Natural Science Foundation of China (Grant No. 51675050 & 51605030) and the National Defense Fundamental Research Foundation of China (Grant No. JCKY2016204B201).