
Abstract
This study focuses on the usage of fly-ash and Al-12%Si as diffusive coating materials over AISI 304 steel welded with AA 6061 in friction stir welding process to improve the joint quality. Various mechanical and metallurgical studies have been carried out to evaluate the characteristics of the weld, and investigate and compare the effect of the two coating materials. Formation of intermetallic reaction layer has been found to be an influential parameter affecting the joint quality. Aluminium-rich intermetallic reaction layer has been observed in the bare welds, whereas the coated samples have been found to have ferrous-rich intermetallic reaction layer.
Introduction
Friction stir welding (FSW) was developed with the aim to join aluminium alloys, but, at present, it is being used to join a wide range of materials such as magnesium, copper, lead, zinc, steel, titanium and thermoplastics.1–3 It is a popular technique among other solid state welding methods like ultrasonic welding and friction welding, because of the lesser heat input during the welding process, and formation of superior welds. The process has also proved its potential to be far better than the traditional fusion welding processes, such as metal inert gas (MIG) welding and tungsten inter gas (TIG) welding, because of the welds having higher joint strength and fatigue life.4–6 A promising advantage of FSW is its ability to join dissimilar material combinations yielding high joint strength and superior metallurgical properties.1,2,4,5 Various combinations of dissimilar materials have been attempted such as aluminium to steel, magnesium to steel and aluminium to copper.7–9 Out of these, combination of aluminium to steel in a lap joint configuration has been observed as the highly explored one.9–11
In joining of aluminium to steel by using FSW, the heat generation in the process has been observed to be one of the crucial factors which determines the material mixing and metallurgical bonding.12,13 The heat generation in the process results in the formation of intermetallic compounds (IMCs).14–16 These welds have aluminium (Al)- and ferrous (Fe)-rich IMCs which tend to increase the joint strength of the weld.17–19 However, it has also been observed that the presence of thick IMCs, that is, beyond a thickness of 10 µm, adversely affects the joint strength. 20 Various studies have reported the use of coatings which have caused reduction in the formation of thick IMCs. However, in some cases, the tool has been observed causing an abrasion to the coated steel surface during joining with aluminium, and results in the formation of IMCs, which are often referred as intermetallic reaction layer (IRL). During FSW, the coating material has been observed to be diffusing between the aluminium and steel weld matrix, and results in the formation of IRL.
In order to restrict the abrasion on the interface, a SiO2 rich compound, available in fly-ash, has been used. 21 Fly-ash not only restricts the abrasion but also decreases the permeability of gas or liquid into it which results in reduced corrosion and moisture accommodation in the weldments. 22 In a similar way, researchers have also made use of other coating materials to decrease the formation of thick IRL compounds and increase the joint strength. Zinc (Zn) and Al-Si were applied on dual phase (DP) steel and 22MnB5 alloy steel, respectively, during dissimilar joining with AA5754 Al alloy by using FSW.23,24 The Zn-coated weld was found to have higher joint strength as compared to the Al-Si coated weld due to the formation of only Fe-Al compound in the former, whereas detrimental IRL compounds reveal brittle nature in the latter case. In Al-Si, the melting point of Al is around 660°C and that of Si is around 1414°C, and the eutectic reaction of the combination occurs around a temperature of 577°C. 25 The temperature prevailing during lap welding is close to this eutectic temperature, and hence, diffusion of the coating occurs in the interface of Al and steel. 26 The coatings, that is, Zn and Al-Si as mentioned above, have been found influencing the joint strength and metallurgical properties; however, the cost involved with them is too high.
The present work proposes and makes use of a new coating material, that is, fly-ash for joining Al and steel, and its usage has been evaluated and compared with bare welds, that is, welds fabricated without any coating. The study also involves the usage of Al-Si coating with the same base materials to have a comparative analysis with fly-ash. The weld quality has been analysed with various physical quantities such as variation of axial force and temperature prevailing during the welding process, which have not been reported in the previous studies. In addition to these, the mechanical and metallurgical aspects of the weld have also been reported.
Experimental procedure
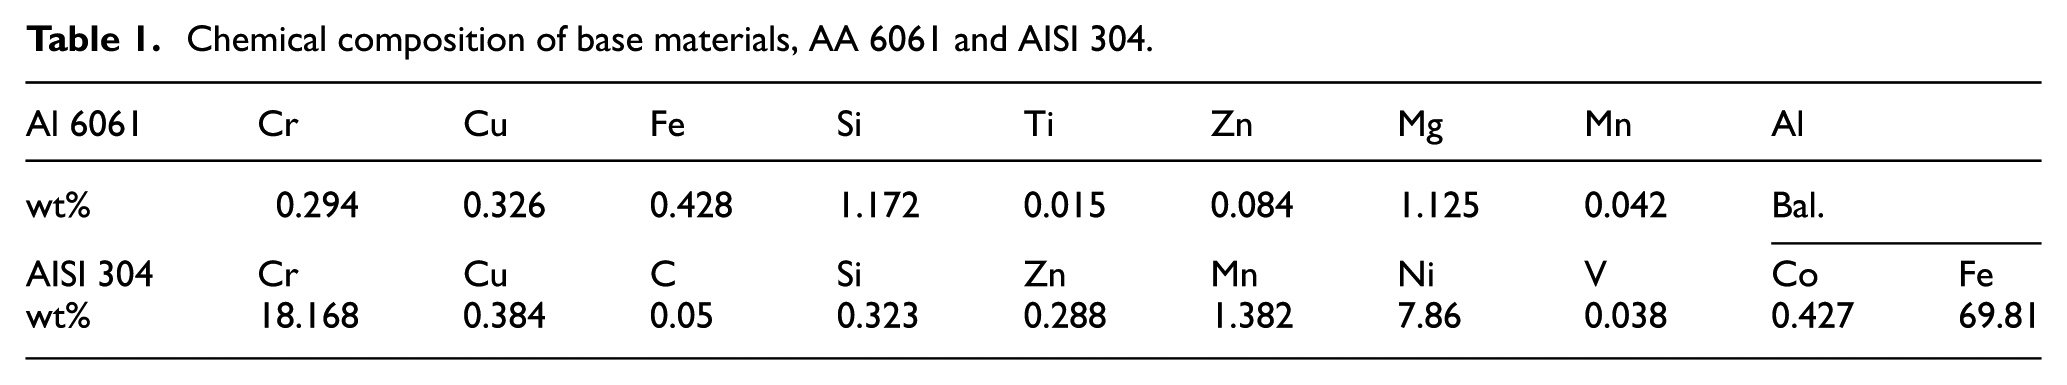
The base materials used are sheets of Al 6061 of 1.5 mm thickness and sheets of AISI 304 of 1 mm thickness, both having a dimension of 100 mm × 80 mm. The chemical compositions of the base materials have been provided in Table 1. The process parameters used for fabricating the joints have been listed in Table 2. Initially, the study started with a wide range of rotational speed, that is, from 800 to 2400 r/min, weld speed of 50 to 200 mm/min, tilt angle of 0° to 2° and plunge depth of 0.1 to 0.3 mm. During the study, it was observed that at lower rotational speed of 800 r/min, the amount of heat generation due to less frictional heat caused by the tool leads to improper mixing of material, which noted less tensile force for the weld samples. At the higher rotational speed (at 2400 r/min), there will be high heat generation which leads to the formation of more detrimental IRL, which decreases the joint strength. The optimum value of tilt angle (α) and plunge depth (pd) are chosen based on the tensile test results. To evaluate the effectiveness of coating material to hinder the formation of detrimental IRL, a higher rotational speed of 2400 r/min was chosen and the variation of weld speed has been studied. Prior to the experiments, emery paper with a grit size of 220 has been used to polish the base aluminium samples before performing the experiments, and the steel samples were cleaned with acetone. The steel samples were then coated with fly-ash and Al-Si. The coating on the substrates has been done by using a coating machine (Model: K Control Coater, RK Print Coat Instruments Ltd., UK). The machine uses an adjustable spreading blade by using micrometre which helped to maintain a uniform layer of 20 µm thickness. The chemical compositions of fly-ash and Al-Si have been provided in Table 3. The fly-ash was collected from Thermal Power Station, Vijayawada, Andhra Pradesh, whereas Al-Si powder was manufactured by M/s. Alfa Aesar. The coatings were prepared by mixing the coating materials (fly-ash and Al-Si) individually with polyvinyl alcohol at a ratio of 3:1 to form a paste and then applied with a curing time of 25 min and furnace temperature of 100°C. 27 The particle sizes of coating substances were measured by capturing the powder images in a scanning electron microscope (SEM) at 2000× magnification. The average particle size of Al-Si is 9.75 µm, whereas fly-ash has 11.65 µm, and have been shown in Figure 1. Hereafter, the samples welded with fly-ash are referred as coated fly-ash (CFA), that with Al-Si as coated Al-12%Si (CAS) and the bare weld as non-coated (NC).
Chemical composition of base materials, AA 6061 and AISI 304.
Process parameters.
Chemical composition of coating materials: Al-Si and fly-ash.
Particle size of the coating powders: (a) Al-Si and (b) fly-ash.
A linear instrumented, numerical controlled FSW machine (WS004, ETA Bangalore) was used to fabricate the joints. During the welding, Al was placed over the steel and positioned on the retreating side (RS) with an overlapping distance of 35 mm, as shown in Figure 2(a). A tungsten carbide tool having a pin height of 1.5 mm, pin diameter of 5 mm and shoulder diameter of 16 mm was utilized for fabricating the joints, as shown in Figure 2(b). Four K-type thermocouples (T0, T1 and T2, T3), connected to a data acquisition system (NI 9211), were used to measure and record the temperature evolution during the welding. The temperature was acquired at a sampling rate of 10 Hz. Figure 2 shows the positioning of the base materials, coating, thermocouples and tool.
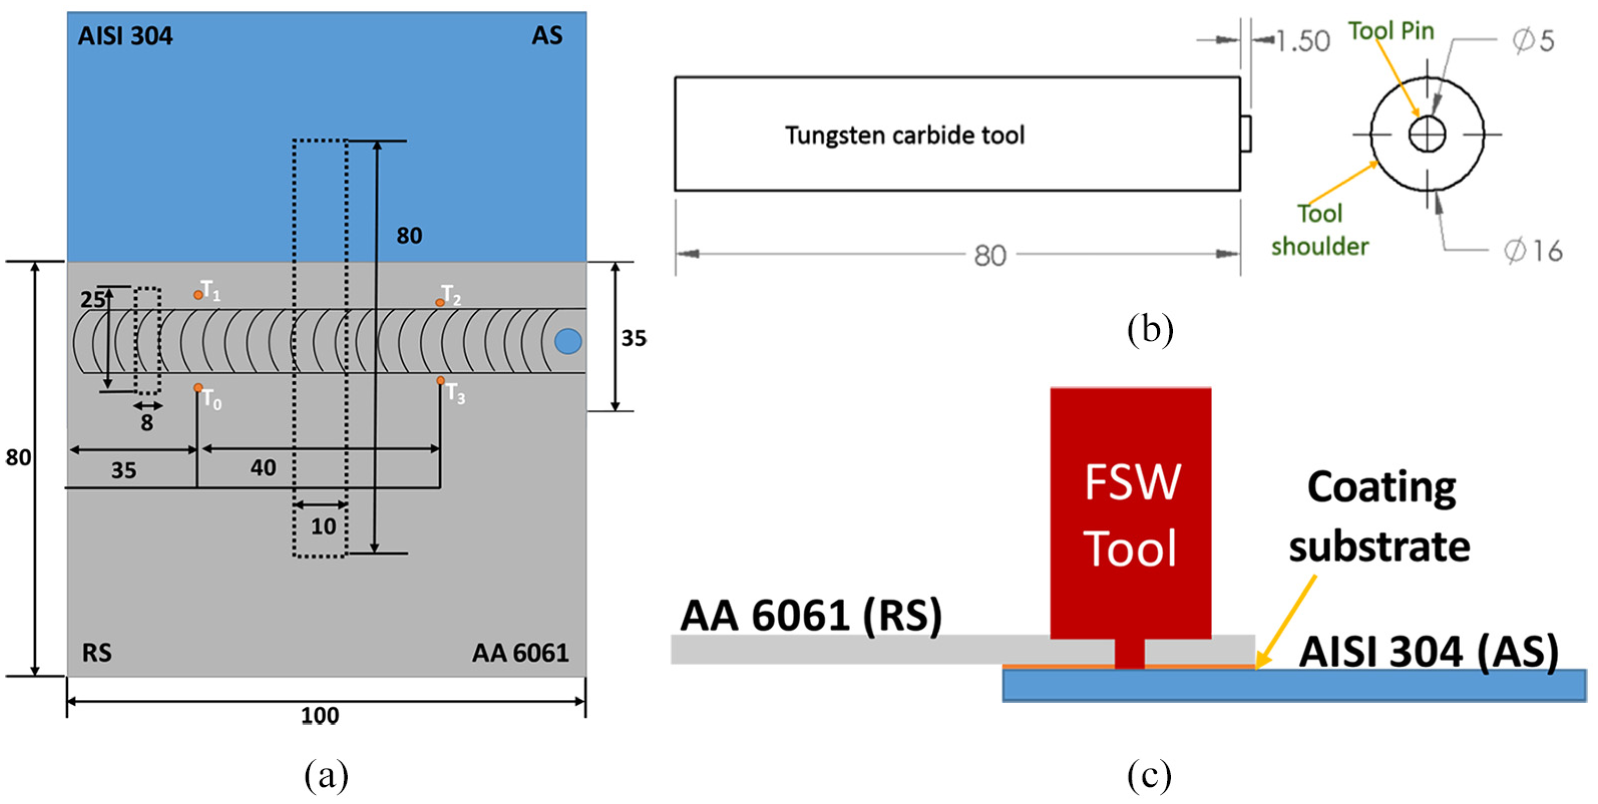
Schematic diagram: (a) positioning of base materials and thermocouple, (b) positioning of tool and (c) positioning of coating substrate (all dimensions are in millimetres).
After welding, tensile specimens were cut out from the welded samples using a wire electric discharge machining (EDM) machine (Elektra, Maxicut 523). The fracture load of the welded samples with a dimension of 10 mm × 80 mm, keeping welding zone in centre, was evaluated using a universal tensile testing machine (Instron, 8862). The overlapping zone was left outside and the rest was clamped, and operated with a ramp rate of 1 mm/min. Samples of dimension 25 mm × 8 mm were also cut from the welded samples and were mounted by using the cold mounting process for characterization. These mounted samples were polished using emery papers of different grit sizes ranging from 220 to 2000, and finally were polished by using the diamond polisher (Struers, Laboforce 50). Then, the microhardness was determined using a hardness testing machine (UHL, VMHT 001). The average hardness value of AA6061-T6 was found to be 121.25 HV, and the average hardness value of AISI 304 was found to be 247 HV. These samples were again polished and etched by Keller’s reagent (distilled water: 190 mL, nitric acid: 5 mL, hydrochloric acid: 3 mL and hydrofluoric acid: 2 mL). An inverted metallurgical optical microscope (Leica, BFC 295) was used to analyse the microstructure. The average grain size of the base materials was measured by using the line intercept method, where AA6061 has 82.94 µm and AISI 304 has 56.65 µm. The IRL thickness was determined through SEM (Zeiss, EVO 60). The elemental composition of the weld region was identified through SEM–Energy Dispersive Spectroscopy (EDS) analysis . The phases of IRL were captured from 20° to 120° range by using Cu target maintaining a current of 40 mA and a voltage of 40 kV in X-ray diffraction (XRD) machine (PANalytical B.V, 7602 EA (IIT Kharagpur, India)).
Results and discussion
Axial force variation
The typical behaviour of axial force in FSW for lap welding configuration has been depicted in Figure 3(a). The figure has been divided into five regions to understand various stages of welding. Region 1 refers to the plunging of the tool with a speed of 5 mm/min in Al, followed by region 2, where initially a sudden decrease in the force for a fraction of time is seen which is due to the deformation of the Al sheet due to frictional heat generated between the tool and workpiece and may be air gap between Al and steel, and then there is a rise in the force which is due to the contact of the pin with steel. The region 3 depicts dwelling, where the force is seen to be decreasing. This effect is due to the conduction of heat from Al to steel resulting in surface heating of the steel. Dwelling is followed by the linear movement of the machine bed causing the force to rise again, as seen in region 4, and the simultaneous rotation of tool and movement of bed create the joint, marked as region 5.
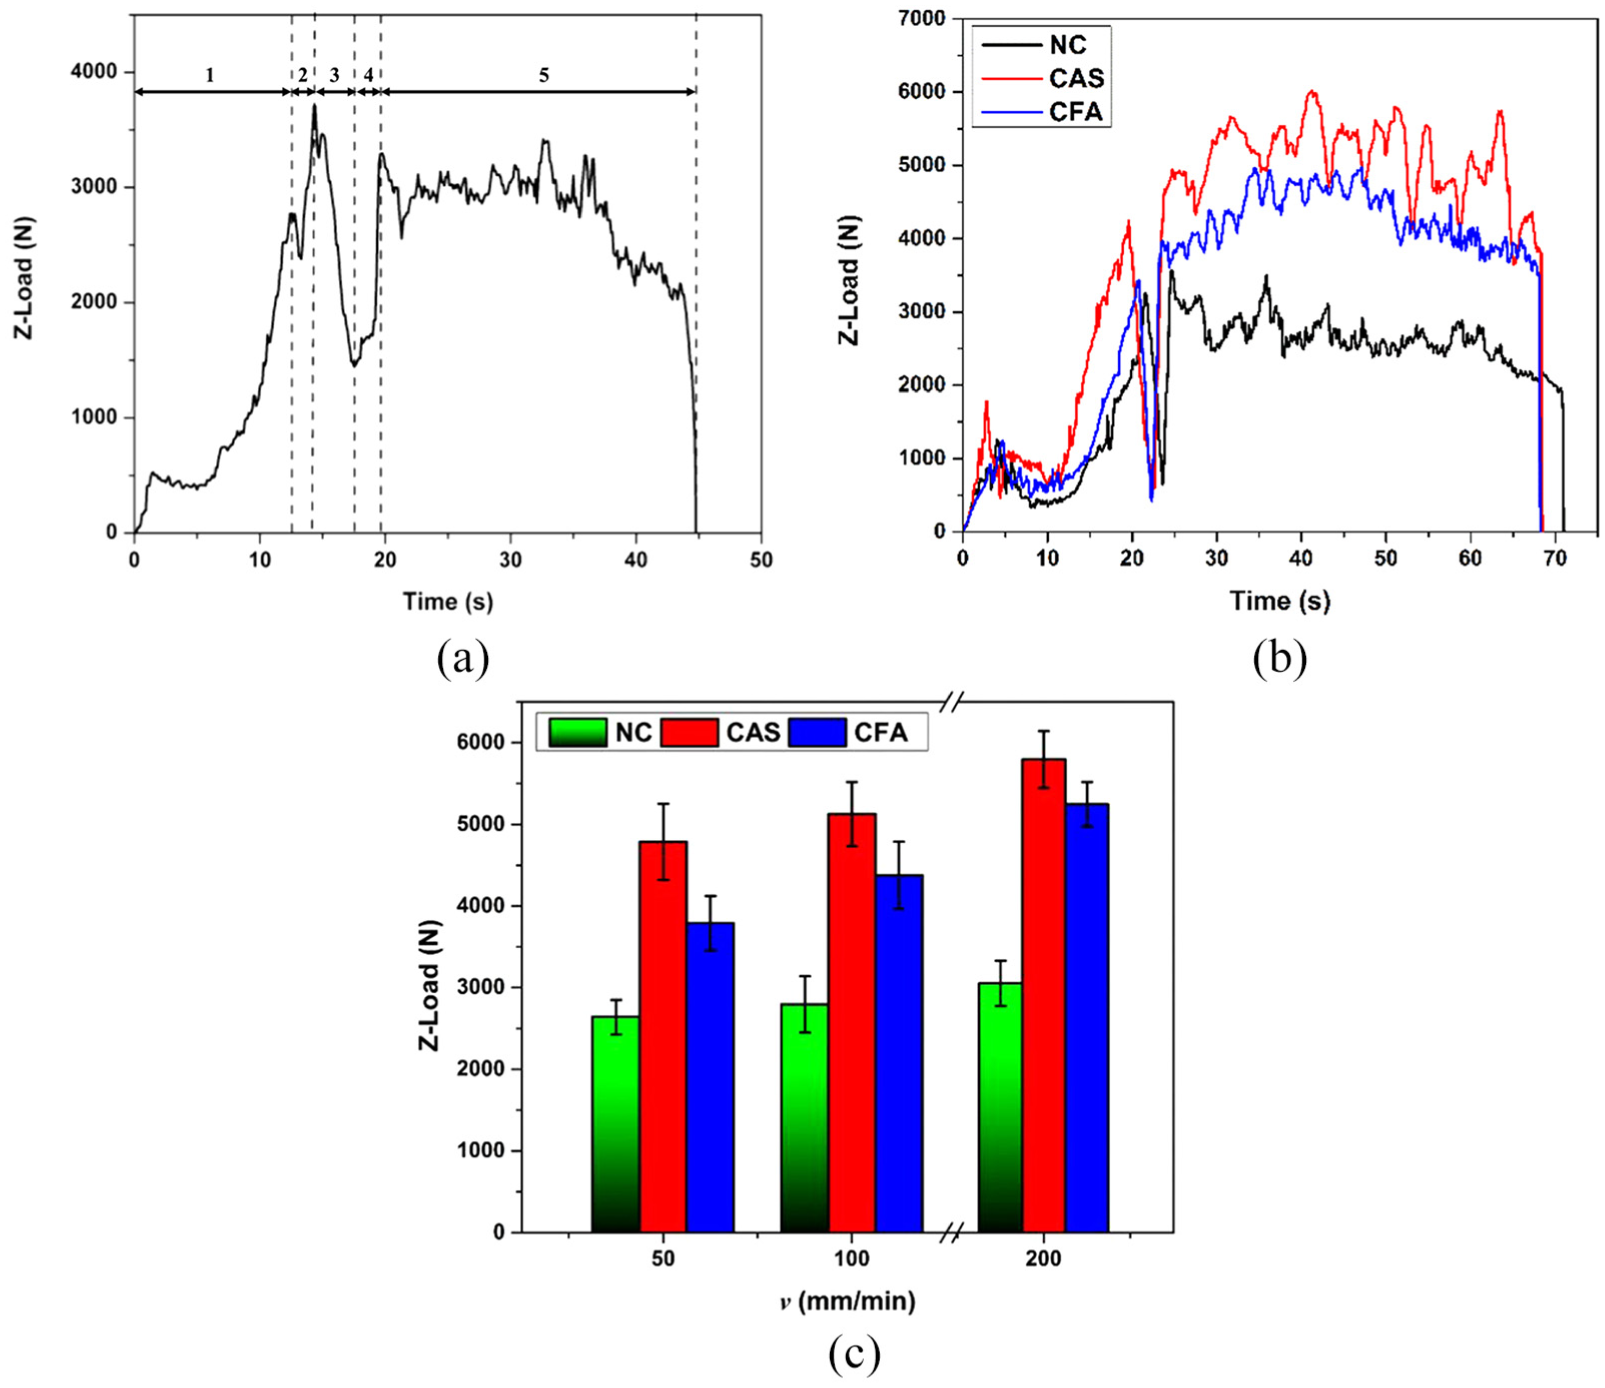
Axial force variation in FSW: (a) NC with ω = 2400 r/min and v = 200 mm/min; (b) NC, CAS and CFA, with ω = 2400 r/min and v = 50, 100 and 200 mm/min; and (c) average axial load variation.
Figure 3(b) depicts the variation of axial load with time for the NC, CAS and CFA. The presence of hard particles and oxides in the coating substrate cause more resistance during plunging of tool, which cause more axial force compared to NC. Figure 3(c) shows the variation in average axial load during welding (region 5) of CAS, CFA and NC samples varying v while keeping the other parameters constant. It can be seen that for all the samples, with increase in v, the average axial load increases, which occurs because of the reduction in heat available in the weld zone. The average axial load of both (CAS and CFA) the coated samples has been found to be more than NC, due to the presence of coating substance. The Al-Si contains mixture of aluminium and silica in powder form, whereas fly-ash contains SiO2 (a low-density oxide) in higher concentration. The presence of SiO2 in CFA causes less reactive force during plunging of tool compared to CAS; hence, the CAS sample has higher average load than CFA. From Figure 3(c), it is observed that the change in axial force with respect to v for the coated samples is high due to more resistance for the tool traverse.
Temperature evolution
Figure 4(a)–(c) shows the temperature versus time plot of samples CAS, CFA and NC for T1, T2 and T0, T3 positioned in the AS and RS, respectively. The initial rise in temperature is due to the plunging of the tool into the Al sheet, and then a sudden drop is observed which accounts for the dwelling. This is followed by welding for which the temperature rises again, and the peak is observed at the position when tool reached T1, T2 and T0, T3, in AS and RS, respectively. In addition, the temperature in AS has been found to be more as compared to that of in RS, which is because of the movement of the plasticized material which occurs from AS to RS. 28 The tangential velocity vector’s direction is same as the forward velocity vector’s direction in AS. So, these two vectors add up. On the other hand, the two vectors are opposite in direction in RS, which makes them subtractive in nature. The resultant velocity of weld material thus is found to be more in AS than RS. This leads to more plastic deformation of the material in AS, and thus, the peak temperature on AS is more than RS. In support of this phenomenon, the authors have now cited few research papers in the revised manuscript.2,29,30 This typical material flow has been depicted in Figure 4(d).
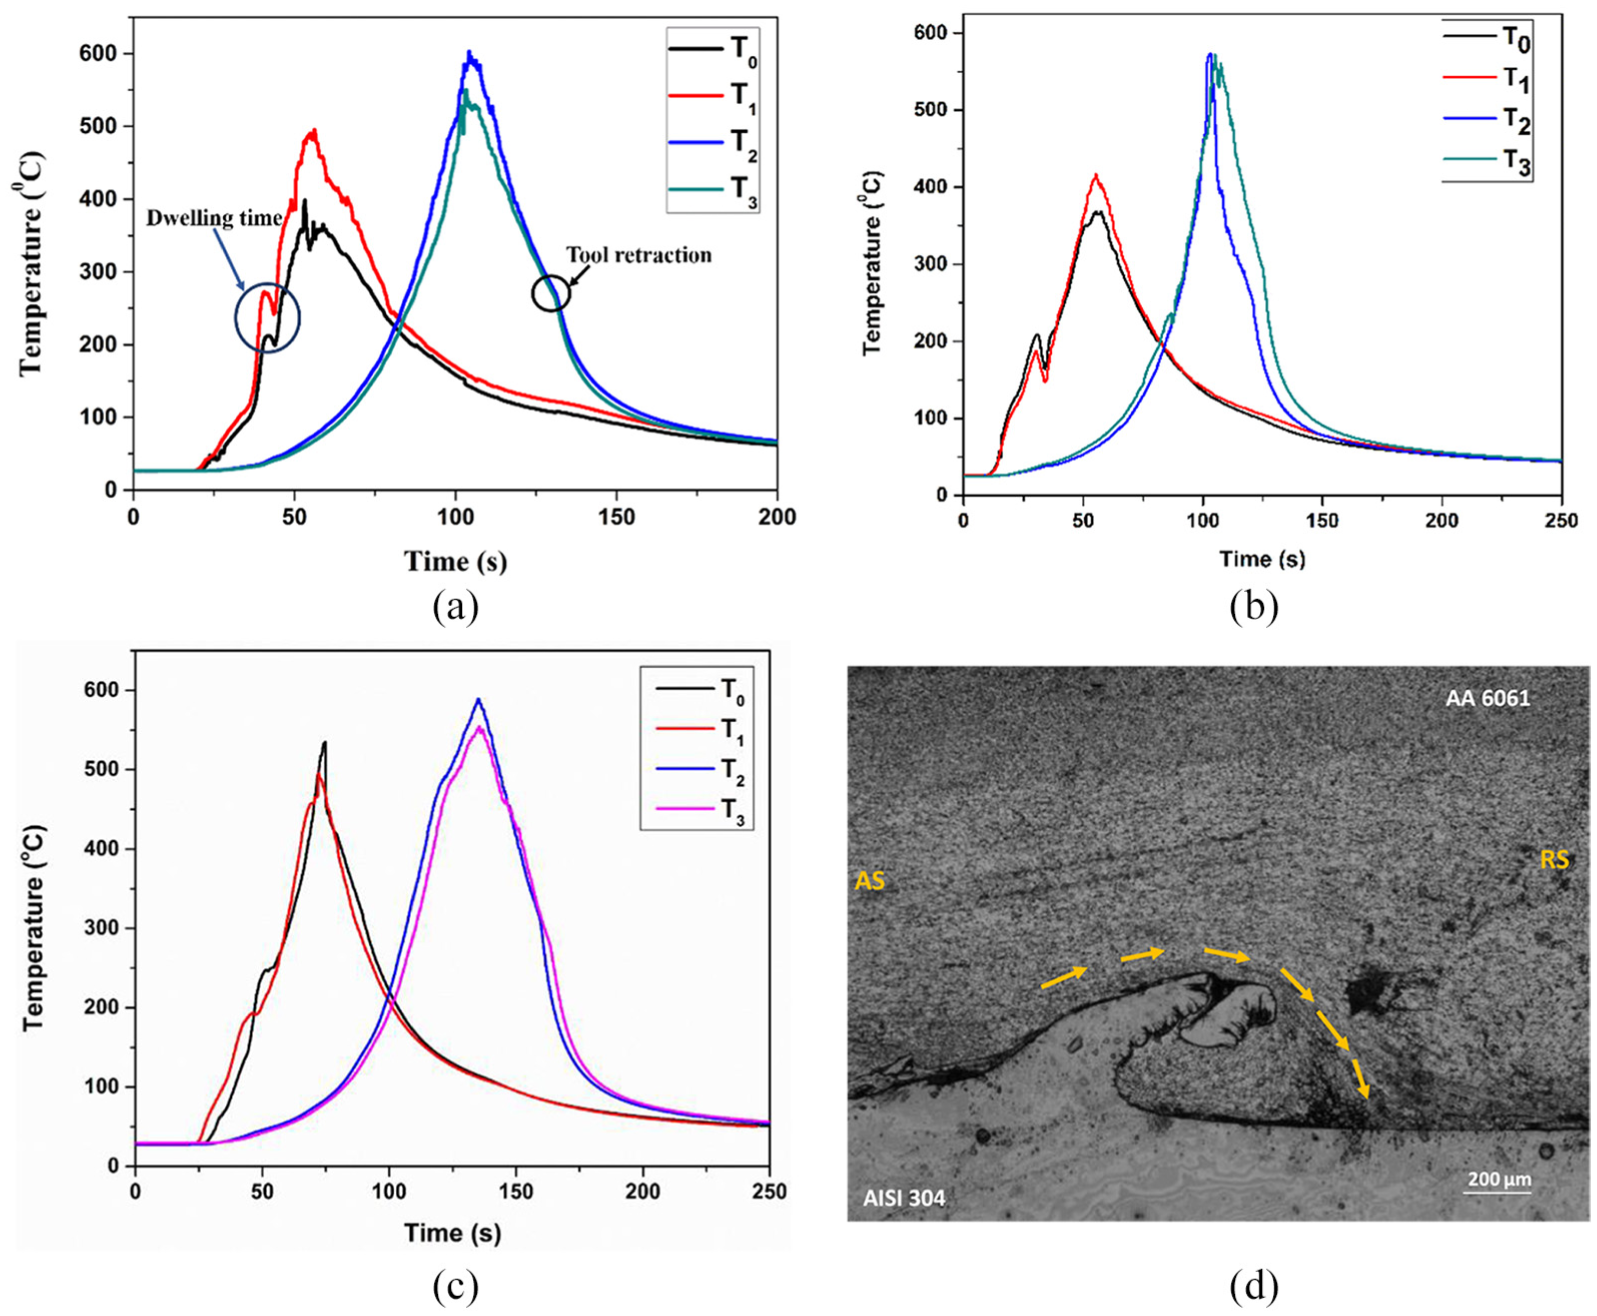
Evolution of temperature for T0, T1 and T2, T3 located in AS and RS of (a) CAS, (b) CFA, (c) NC and (d) picture indicating material flow in CFA sample welded at ω = 2400 r/min and v = 50 mm/min.
The temperature gradient during heating cycle is more for T1 as compared to T2, since T1 is located close to the weld start point, and the heat conduction for T1 is rapid as compared to T2. As the tool crosses the T1 position, the heat continues to flow to the same position as the welding continues. So, there is a gradual cooling observed for T1. The same is also true for T2 until welding continued. With the tool approaching T2, the temperature gradient of the heating cycle is found to be increasing. An interesting phenomenon is the cooling cycle of T2 and T3, where a sudden change in the temperature gradient is observed which is because of the retraction of the tool. However, as the tool retracts out from the welded joint, the source of heat was no longer available and resulted in sudden drop in the temperature. 31
The traverse speed, v, is inversely proportional to the peak temperature generation, due to insufficient time for plastic deformation of material, as shown in Figure 5. The heat capacity of CAS has been found to be 0.895 J/gm K and that of CFA is 0.72 J/gm K. This made the coating materials (fly-ash and Al-Si) to absorb the heat during the welding process resulting in peak temperatures lesser than that of the peak temperature obtained in the case of NC. Furthermore, as the heat capacity of CAS is more than CFA, the decreasing rate of peak temperature with increasing v is higher than CFA.
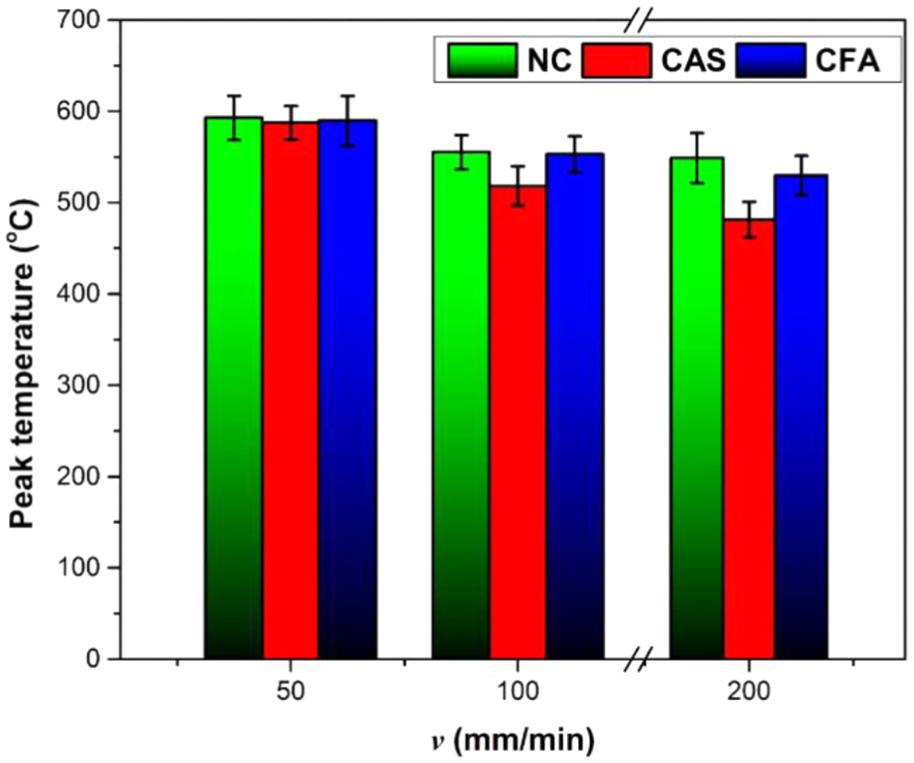
Variation in peak temperature.
Mechanical properties
Tensile force
The joint strength of the welds has been evaluated on the basis of failure load, and Figure 6(a) depicts the failure load as obtained in the case of NC, CFA and CAS welded with different parametric combinations. The more the formation of IRL compounds (thickness greater than 12 µm), the weaker the zone will be, and thus, it results in less failure load. 32 In the same way, the failure load in the NC, CAS and CFA samples has been found to decrease with increase in v from 50 to 200 mm/min. This is due to the dissolution of coating substances that diffuses into the weld zone at low v (high heat generation) and results in high failure load in CAS and CFA. The joint strength efficiency of the NC sample has been found to be 72% of the base material strength, whereas for CAS and CFA samples, it was found to be 101.4% and 96.9%, respectively, as shown in Figure 6(b).
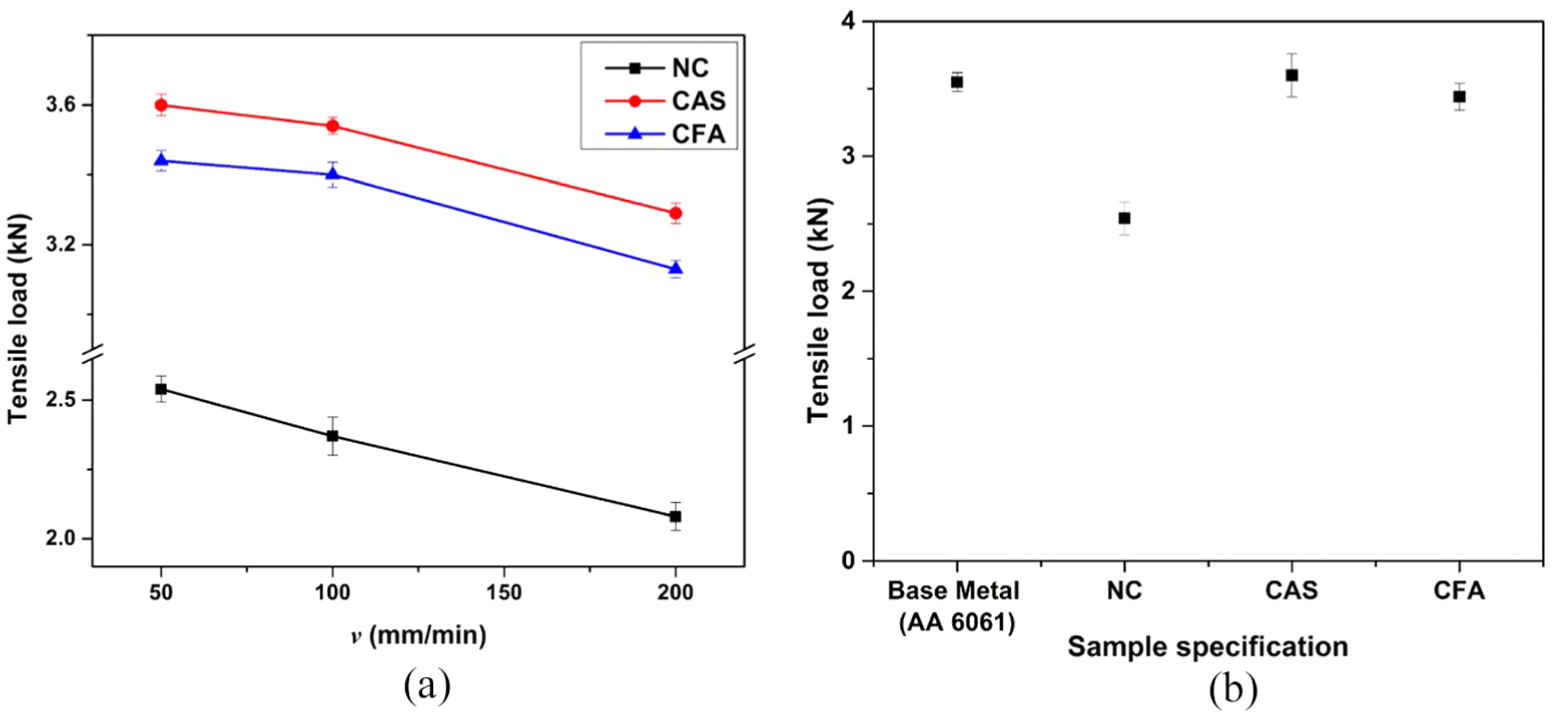
(a) Variation of failure load for NC, CAS and CFA samples with v, and (b) comparison of failure load for different samples welded at ω = 2400 r/min and v = 50 mm/min with respect to aluminium.
In order to further investigate on the results of failure load, XRD analysis has been carried out to determine the phases formed in the weld interface of NC, CAS and CFA samples. The base metal XRD has been shown in Figure 7(a) and (b). The result of the welded sample varying with v has been depicted in Figure 7(c)–(e). In the NC sample, the IRL compounds formed are found to be rich in Al, that is, Al13Fe4 and FeAl3, as shown in Figure 7(c). Similarly, the IRL found in CAS are Al-Fe, Al-Fe3, Fe-Si and Fe3-Si, and CFA are Al-Fe, Al-Fe3 and Fe-Si2. The results of the same have been depicted in Figure 7(d) and (e), respectively. As the NC sample is found to have Al-rich IRL, which has high hardness and is brittle in nature, it accounts for the least failure load among the three, whereas diffusion of Si in the weld interface replaces Al in Al-Fe phase and forms Fe-Si IRL. This exhibits high failure load 16 for CAS and CFA. Furthermore, the higher concentration of Si (Fe-Si2) in CFA sample reduced its failure load as compared with CAS sample. Si is brittle in nature, which resulted in lesser failure load. However, it may happen that with different compositions of fly-ash, the results may differ.
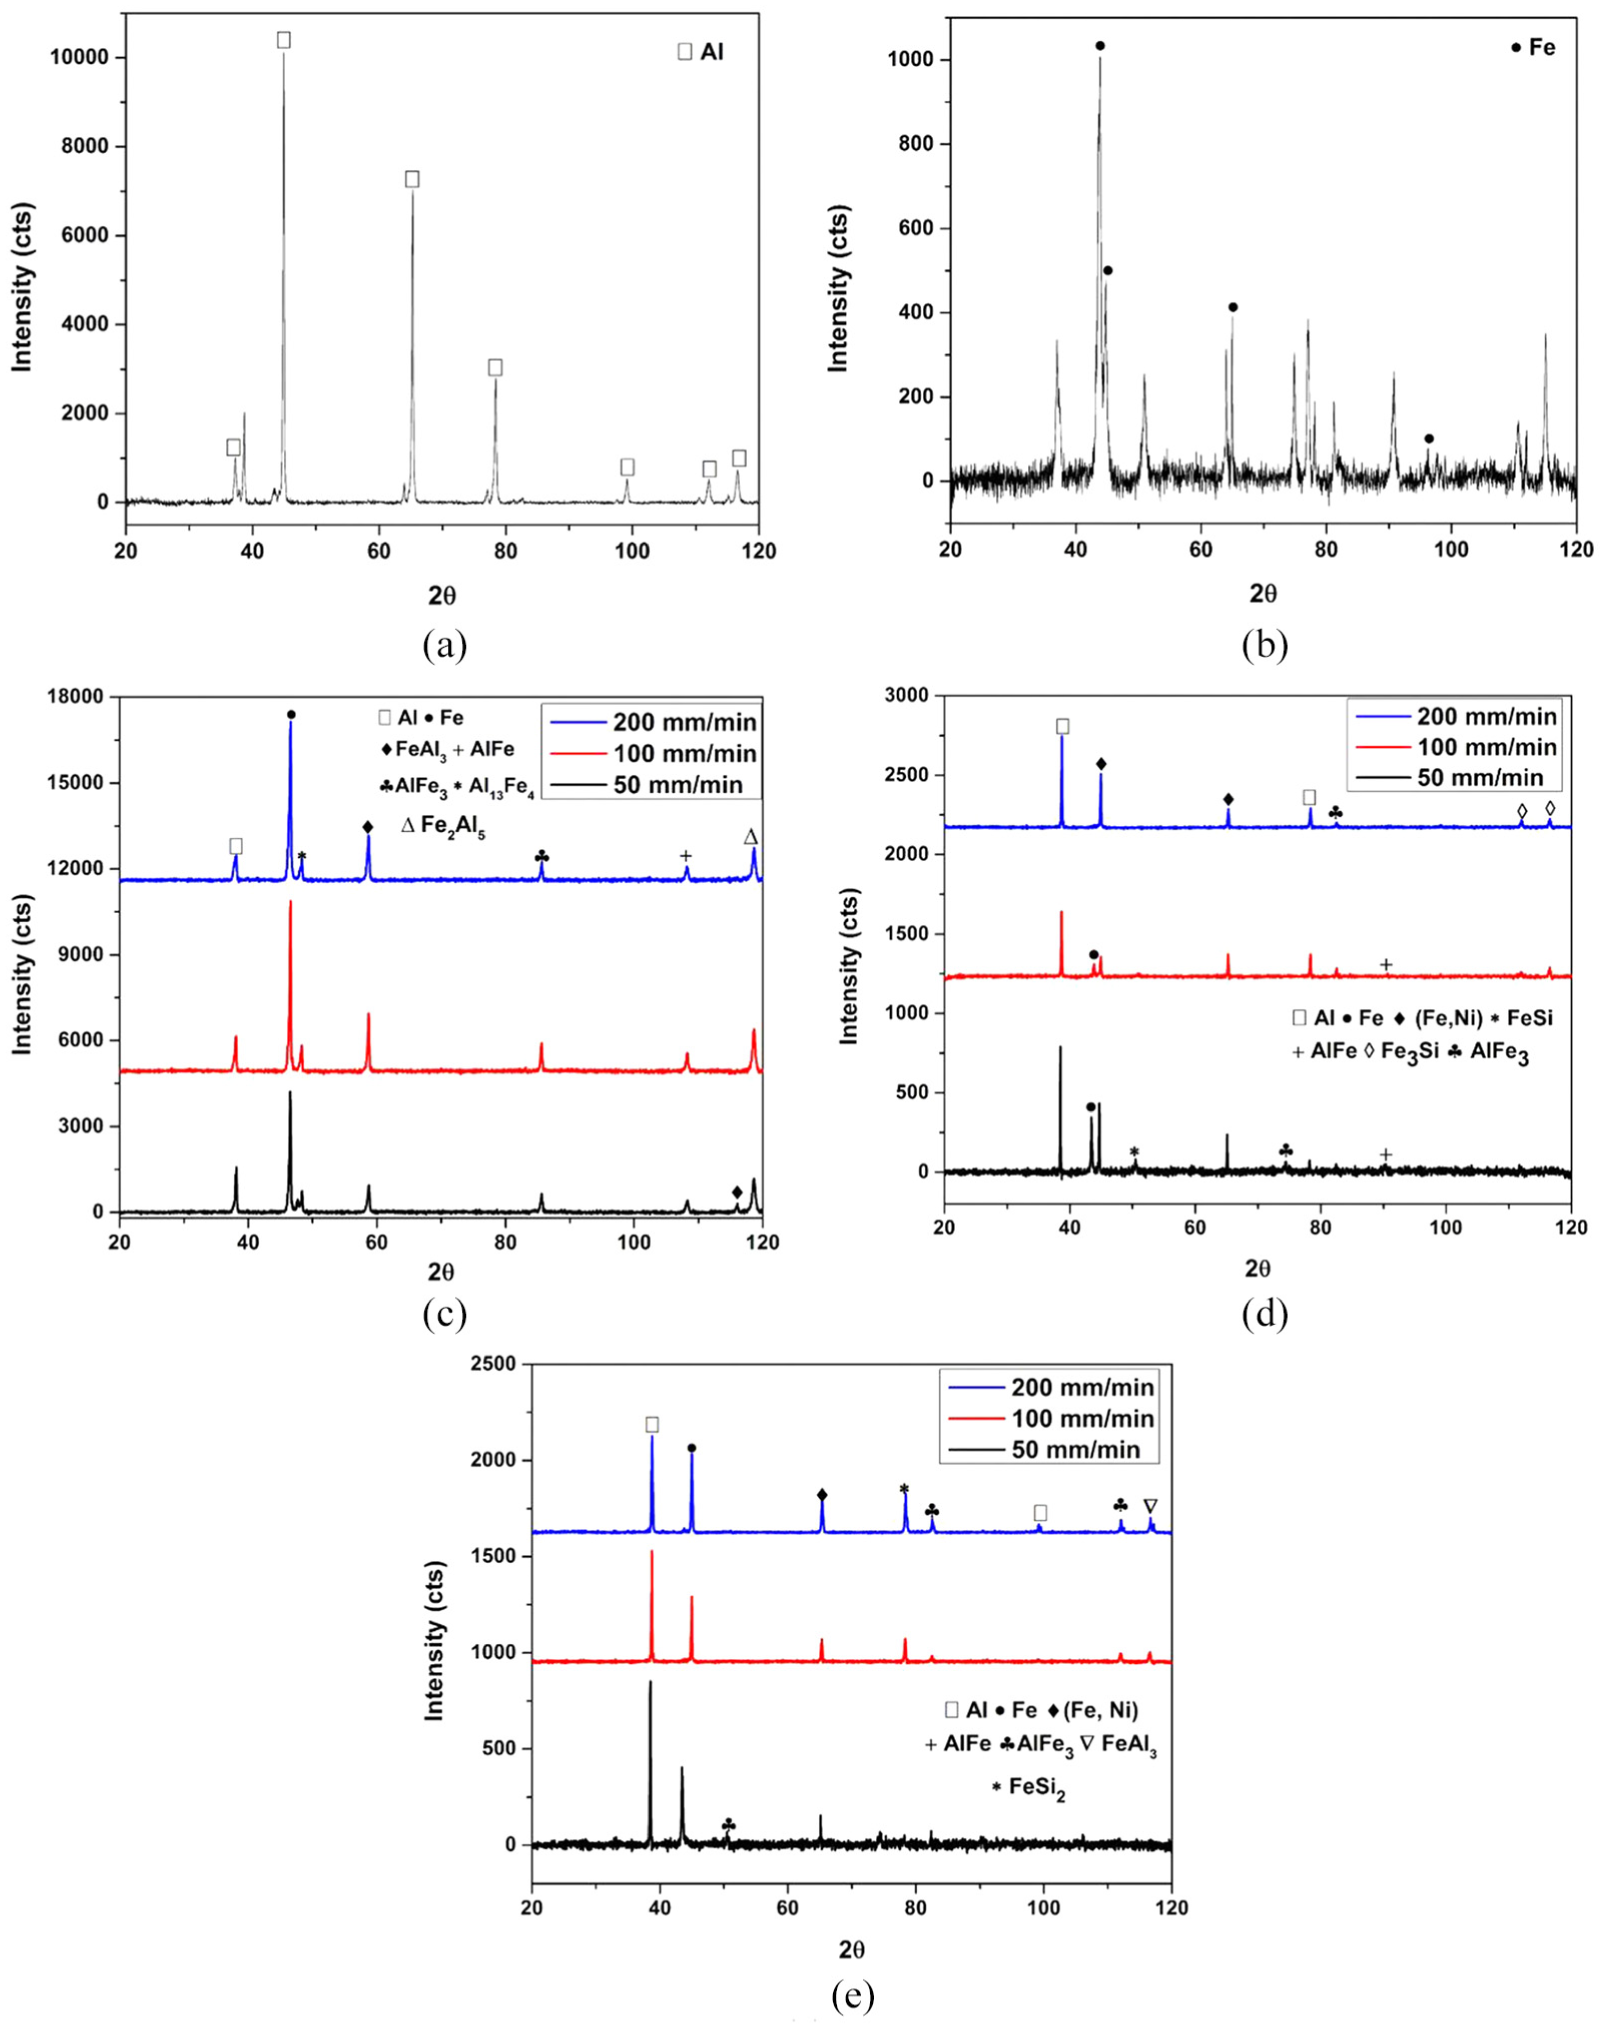
XRD analysis of the welded samples, namely, (a) Base AA6061, (b) Base AISI 304, (c) NC, (d) CAS and (e) CFA (all welded samples at ω = 2400 r/min).
From Figure 7(c), the intensity of the detrimental IRL peaks (FeAl3, Fe2Al5 and Al13Fe4) at 50 mm/min is comparatively lower than 100 and 200 mm/min, which determines high failure load. The growth rates of the Fe2Al5 and the FeAl3 are decreased with the increase in Si content;33,34 the same can be observed from Figure 7(d) and (e). The presence of Fe-rich (Al-Fe and (Fe, Ni)) at 50 mm/min in CAS exhibits higher failure load, and Si decreases the formation of detrimental IRL, as shown in Figure 7(d). From Figure 7(e), it is observed that Fe-Si2 peak is detected with higher intensity at v of 100 and 200 mm/min, which decreases the failure load.
In order to analyse the variation of failure load of CAS and CFA samples, the EDAX analyses of both the samples have been carried out. The overlapping of elemental composition lines has been considered as the formation of IRL at the interface and has been shown in Figures 8 and 9. The formation of micro-cracks has been determined to be the reason for the failure of the samples. These micro-cracks have been found in CFA samples welded with v = 100 mm/min, as shown in Figure 9. Generally, the formation of micro-crack occurs because of the generation of tensile stress during the cooling period of welded sample. But this observation has not been found in the CAS sample, as shown in Figure 8. However, their presence is there in the CFA sample, which is due to the improper dissolution of oxides and the presence of Si in higher concentration. Similar observations regarding the micro cracks formation, these are formed due to presence of higher concentration of Si. 23
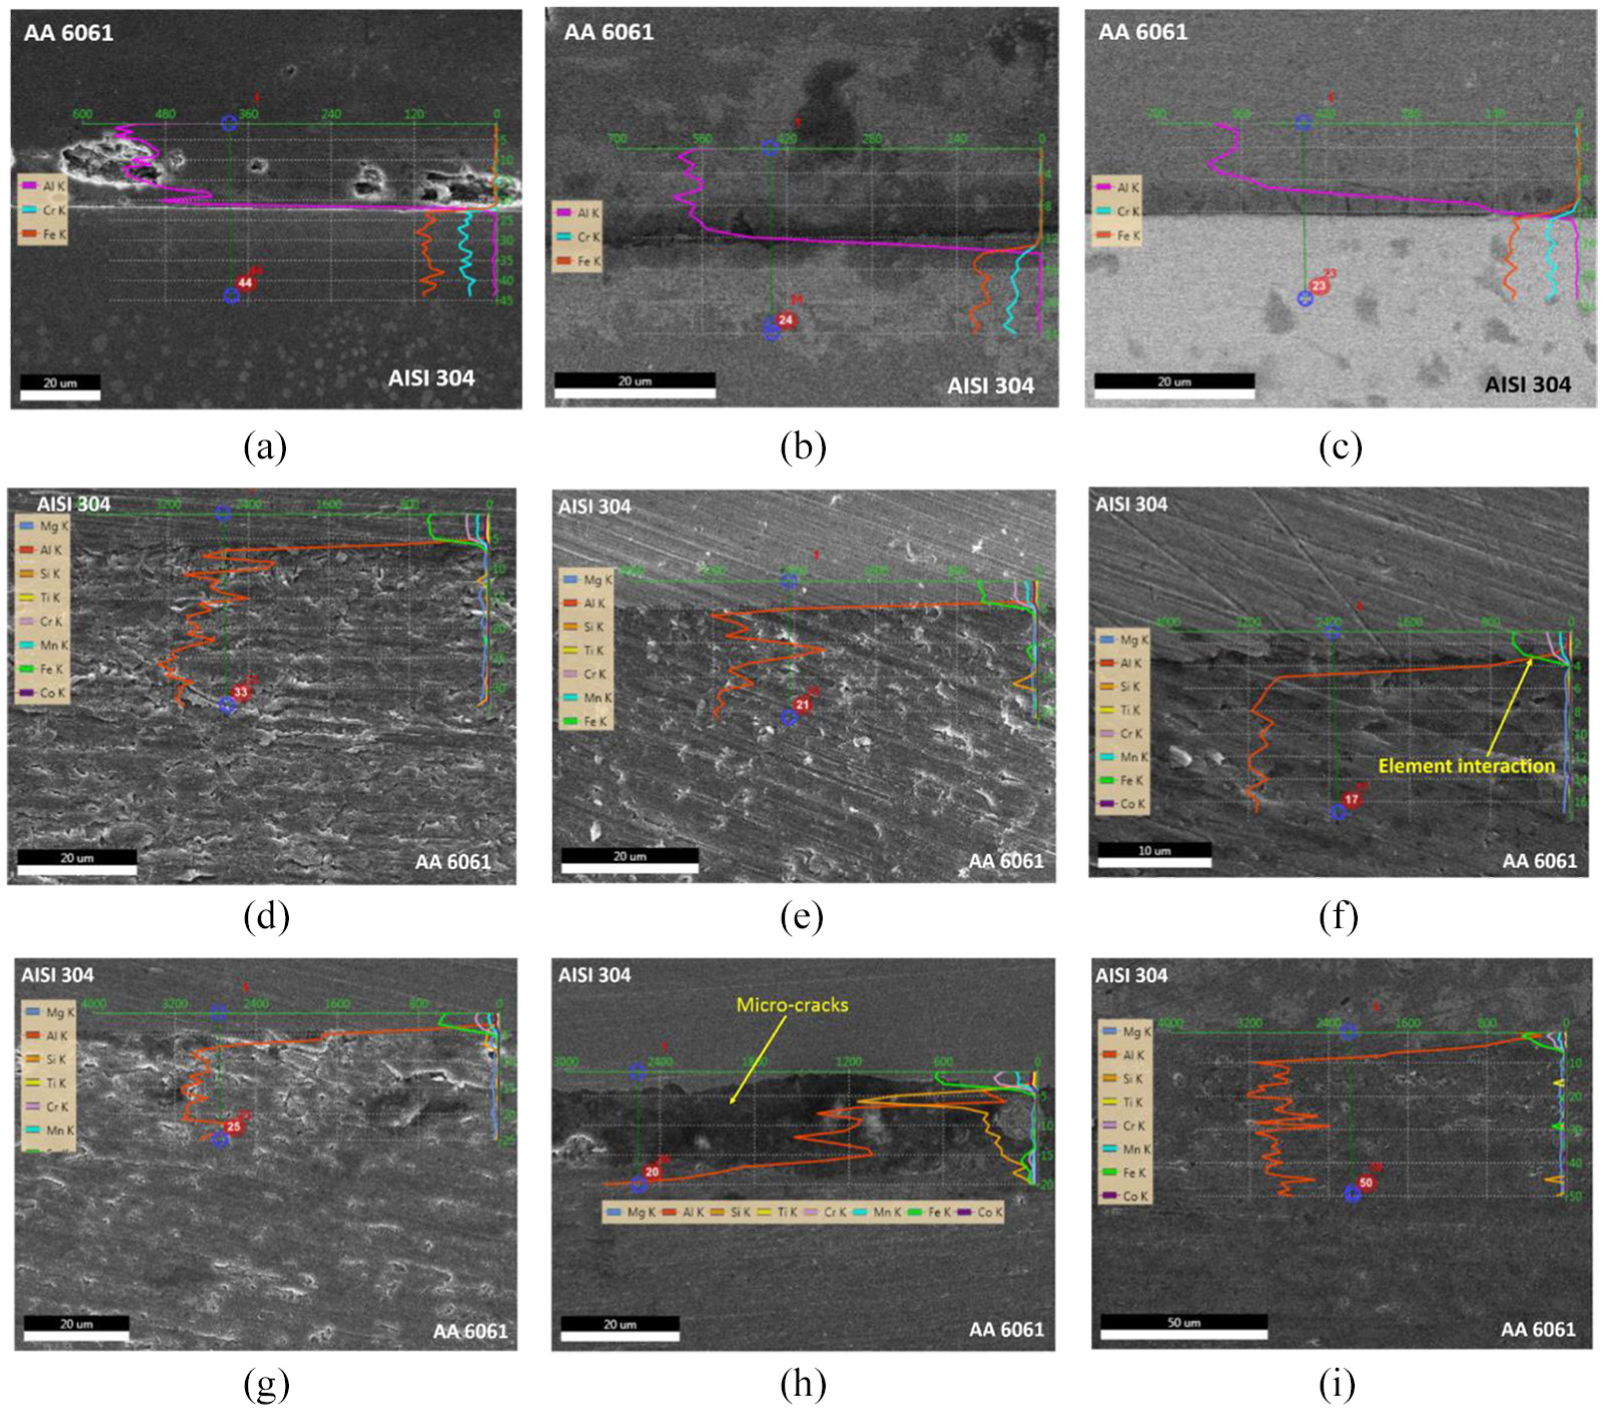
Micrograph EDAX line scan of (a)–(c) for NC sample; (d)–(f) for CAS sample; and (g)–(i) for CFA sample welded with ω = 2400 r/min and v = 50, 100 and 200 mm/min.
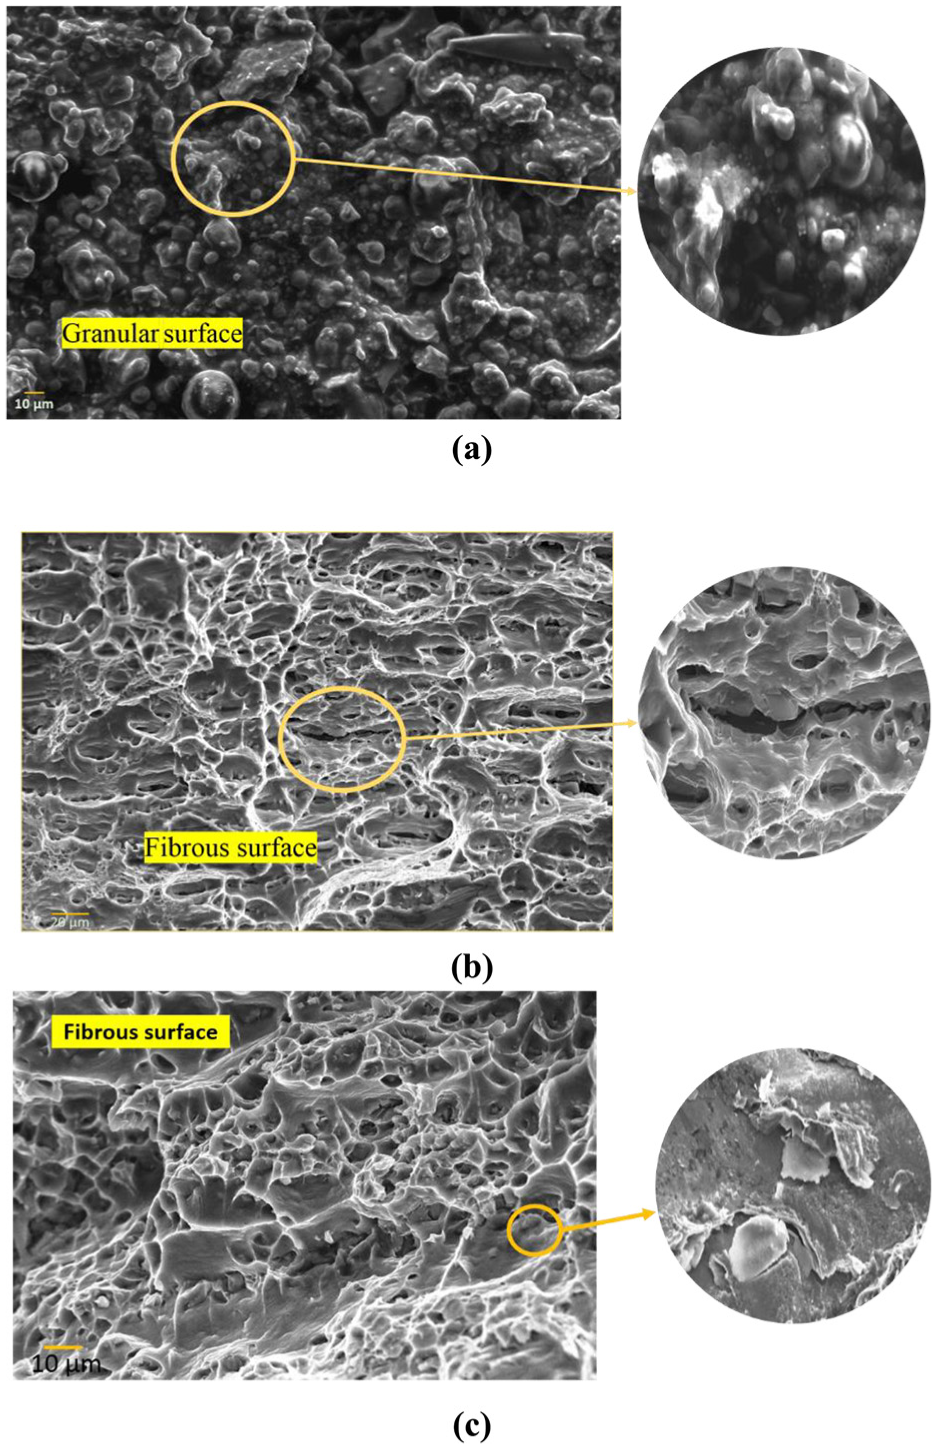
Fractography analysis of the fractured samples of (a) CAS, (b) CFA and (c) NC welded with ω = 2400 r/min and v = 50 mm/min.
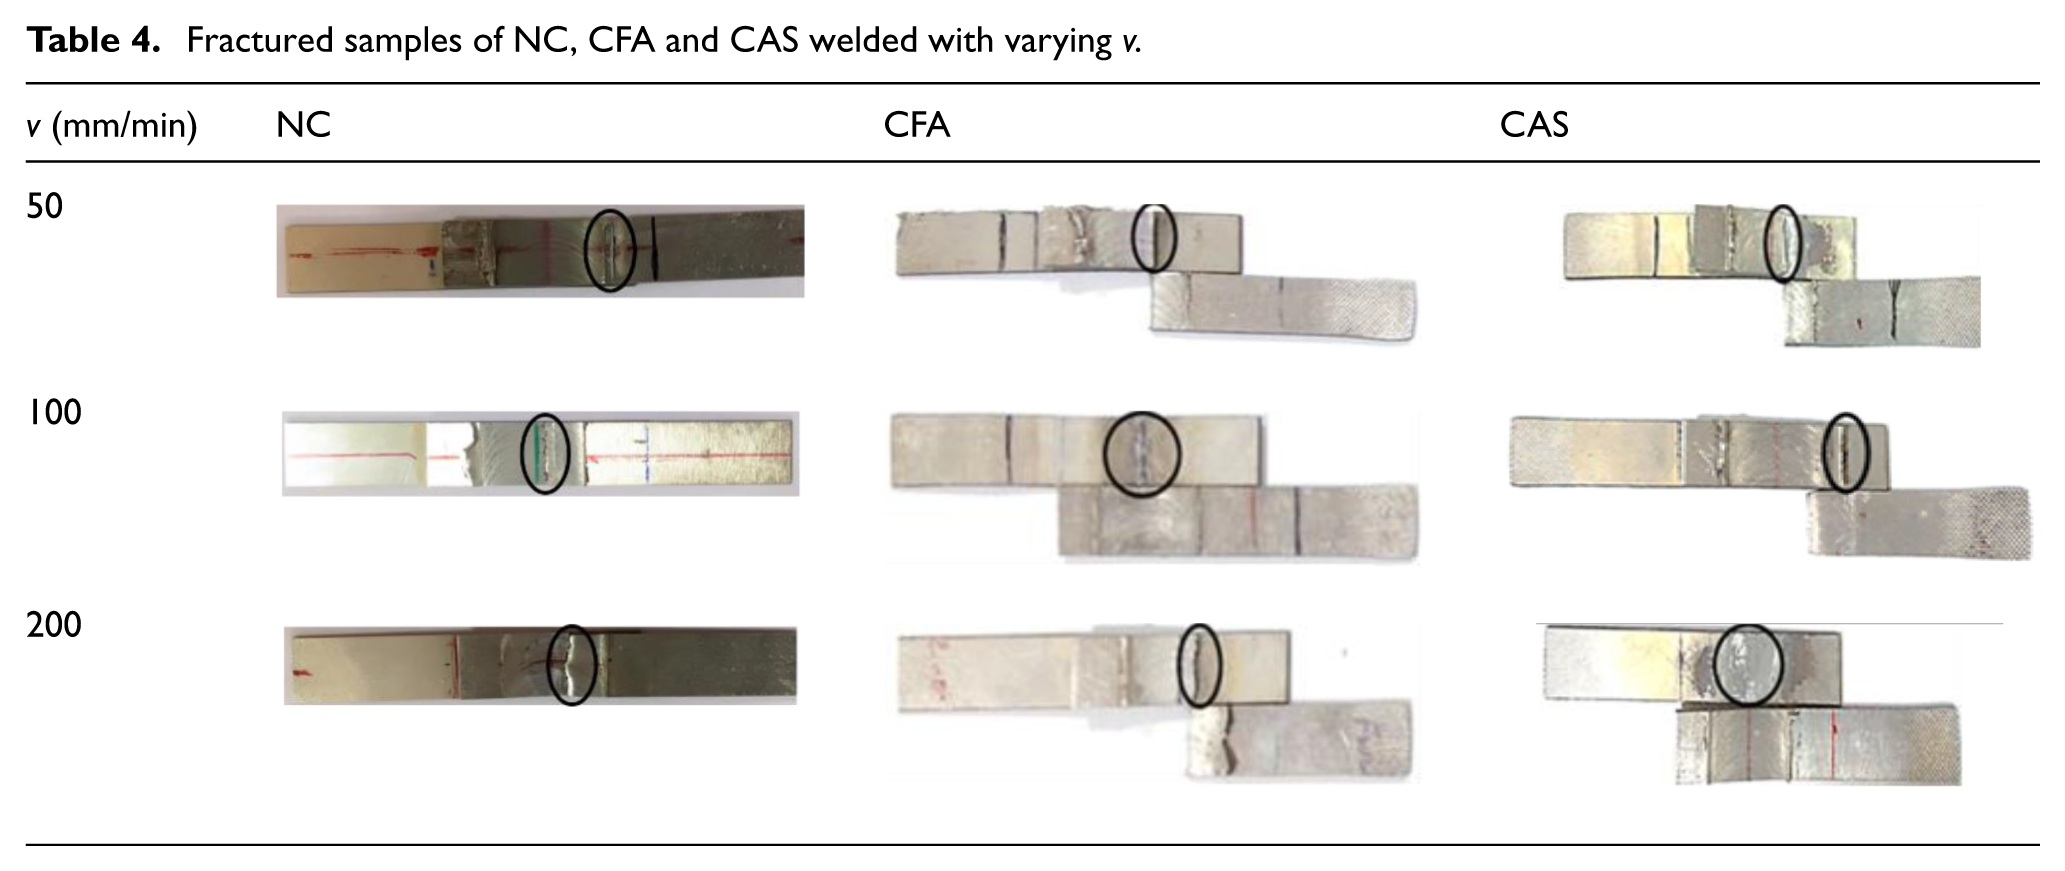
The fractured samples of NC, CFA and CAS welded at different vs have been shown in Table 4. Both CFA and CAS samples welded at 50 mm/min failed from the thermomechanically affected zone (TMAZ). Also, the CFA sample welded with 200 mm/min fractured from TMAZ zone. Both ductile and brittle modes of failure have been found existing in this zone by various researchers.23,35 Hence, fractography analysis was then carried out to analyse the failure modes, and the results of the same have been depicted in Figure 9(a)–(c). The figure shows the presence of granular surface in CAS samples, which are brittle in nature. This brittleness is because of the presence of Si. On the other hand, threaded and dimple appearance is seen for CFA sample, which represents the ductile mode of failure. Similar observations have also been reported in Haghshenas et al. 23 and Gupta and Ling. 36
Fractured samples of NC, CFA and CAS welded with varying v.
Microhardness
Figure 10(a)–(c) shows a comparison among the microhardness of NC, CAS and CFA samples, all welded with ω = 2400 r/min and v = 50, 100 and 200 mm/min, respectively. It can be seen that the microhardness of NC sample is the highest among the three which is because of the presence of Al-rich IRL that is hard and brittle in nature. Similar type of hardness profile has been observed by the researcher by joining AA 6082T6 and Q235A steel. 37 It can be found from Figure 11(a), which the microhardness along the IRL zone increased because of the formation of fine grains. The formation of fine grains is the result of higher deformation of aluminium which ultimately resulted in restricting the movement of aluminium towards the steel. 35 The corresponding microstructure of the sample has been shown in Figure 10(d), where the variation in grain size can be observed.
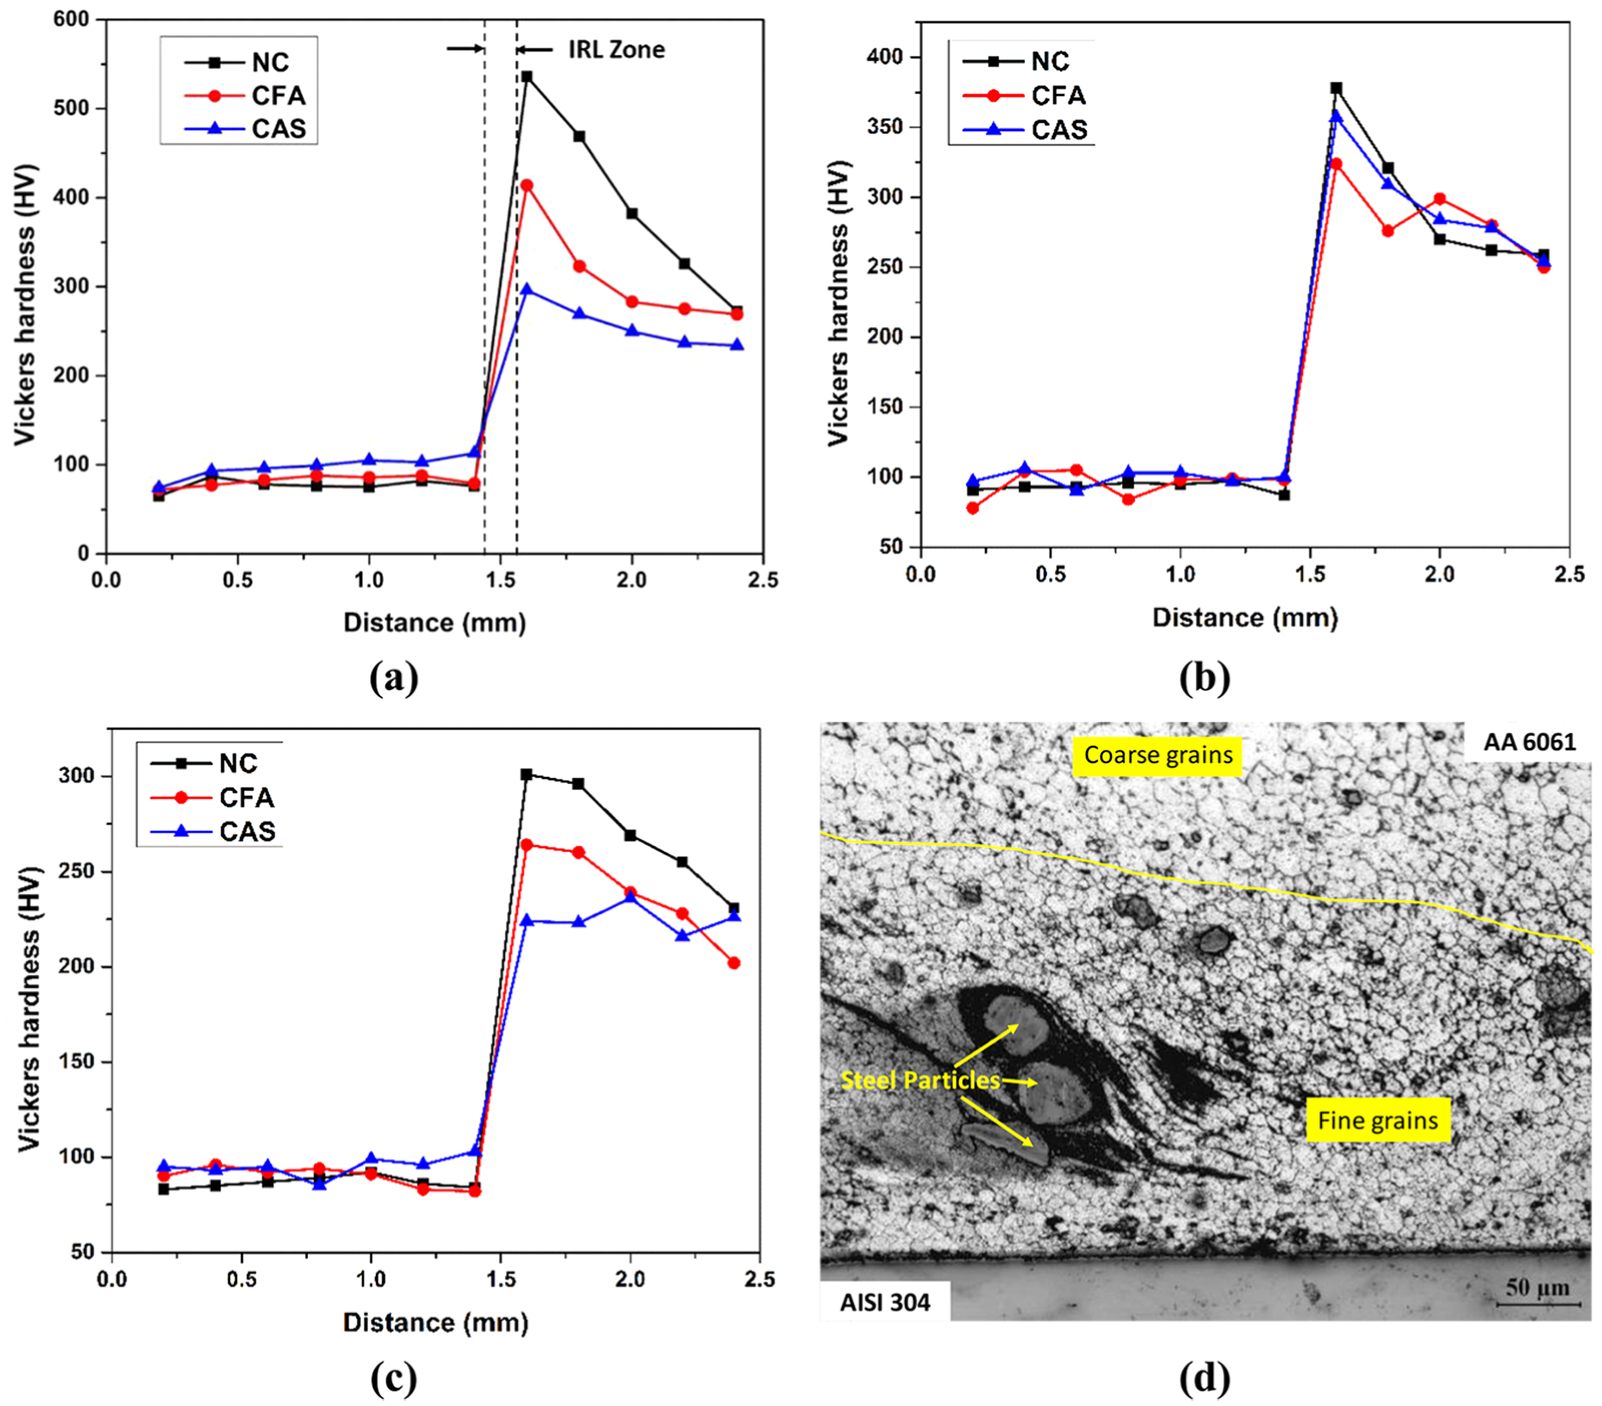
(a)–(c) Microhardness profile with ω = 2400 r/min and v = 50, 100 and 200 mm/min, and (d) microstructure of CAS sample welded with ω = 2400 r/min and v = 50 mm/min.
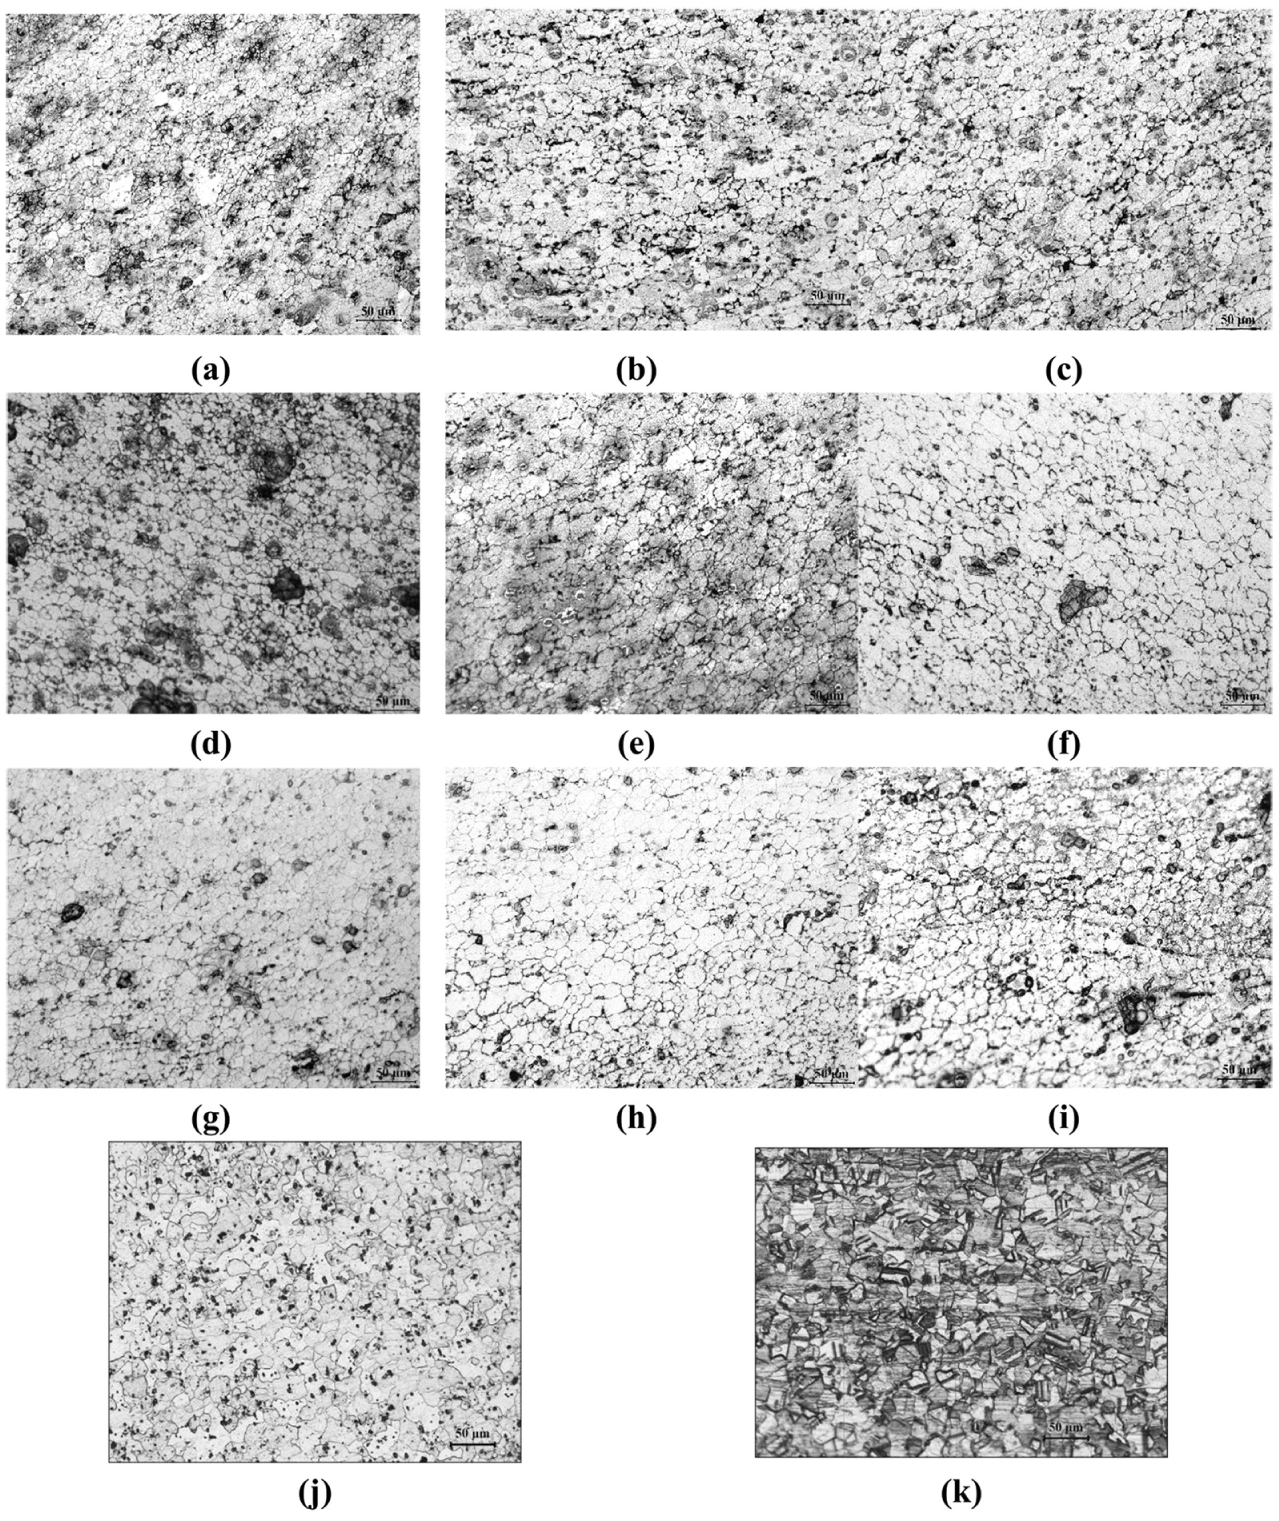
Microstructure of Al at the weld zone: (a)–(c) NC; (d)–(f) CAS; and (g)–(i) CFA, base materials (j) AA6061 and (k) AISI 304 (all welded with ω = 2400 r/min and v = 50, 10 and 200 mm/min, respectively).
In between NC, CAS and CFA, the microhardness of CAS sample has been found to be more, which is because of the lesser grain size, that is, 8.8 µm, as compared to that of the grain size of CFA which is found to be 9.1 µm. The microstructural images of aluminium near the weld interface for NC (Figure 11(a)–(c)), CAS (Figure 11(d)–(f)) and CFA (Figure 11(g)–(i)) vary with v = 50, 100 and 200 mm/min, respectively. The grain size of the aluminium and steel base materials are shown in Figure 11(j) and (k).
Furthermore, the hardness in the IRL zone has been studied using nano-indentation (Anton Paar, nanoindentation tester (NHT)) with a load of 10 mN and 10 s of indentation time. The measurement of hardness in the IRL zone has been taken at three distinct positions, that is, one towards the Al side, one towards the steel side and the last at the centre position of the zone; the plot for the same has been depicted in Figure 12(a). It can be seen that the hardness is the maximum at the centre point, which owes to the fact that more IRL compounds are formed in this zone. Moreover, it is also found that the hardness of this zone is more than that of the base materials. Similar results have also been reported in another research work, where the IRL formed are Al13Fe4 and Al5Fe2 while joining AA-5083 and St-12 as base materials. 38 It can also be seen that the hardness of the point taken towards Al side in this zone is more than that of the one taken in steel side. This is because of the formation of Al-rich compounds in Al side, which are brittle and harder in nature, while Fe-rich compounds are formed in steel side, which are comparatively less hard than the former.
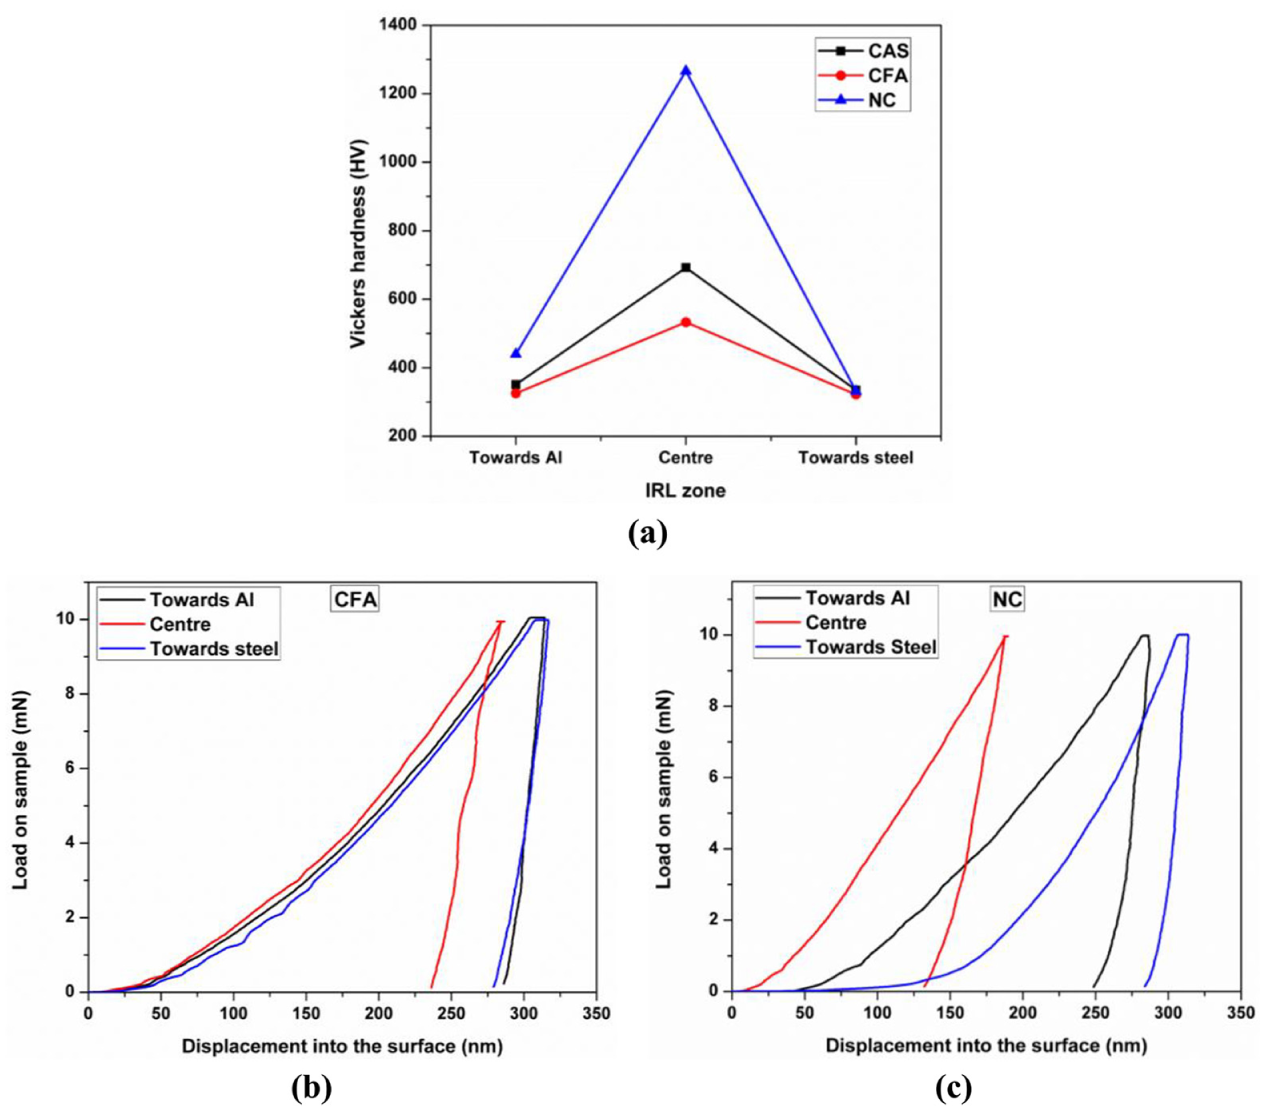
(a) Variation of hardness in IRL zone, load versus displacement plots at three distinct points; (b) CFA; and (c) NC.
Among the three selected samples in the present study, the hardness of NC has been found to be the highest, which is due to the presence of hard IRL compounds like Al13Fe4 and FeAl3, whereas in CAS and CFA, the hardness is comparatively less due to the formation of Al-rich IRL compounds and Fe-Si compounds like Fe-Si, Fe-Si2 and Fe3-Si, respectively. The variation of load–displacement has also been measured at those three points, and the results have been shown in Figure 12(b) and (c), respectively. In CFA and NC, the deformation of IRL compound at the centre of IRL zone is low compared to other points due to the formation of more IRL compounds; the same is observed by Das et al. 39
Microstructural analysis
The formation of IRL and their elemental composition has been studied, and the results have been shown in Figure 13. For comparing the IRL formed in CAS and CFA, the point EDAX analysis has been done. The elemental composition of spot in Figure 13(a) and (b) has been listed in Table 5. The elemental composition of the CAS sample shows higher concentration of Fe, which concludes the formation of Fe-rich IRL, and this led to high fracture load. Similarly, in CFA sample, the presence of Si and Al is observed in higher concentration as compared to Fe which resulted in lesser abrasion of steel at the interface of CFA. The abrasion of steel results in the formation of sawtooth structure at the interface which increases the contact surface area of Al and steel, leading to the formation of high IRL, as shown in Figure 14.19,35 In this study, the abrasion of steel has been found to be eliminated in CFA sample, which decreases the contact area and also reduces the formation of IRL.
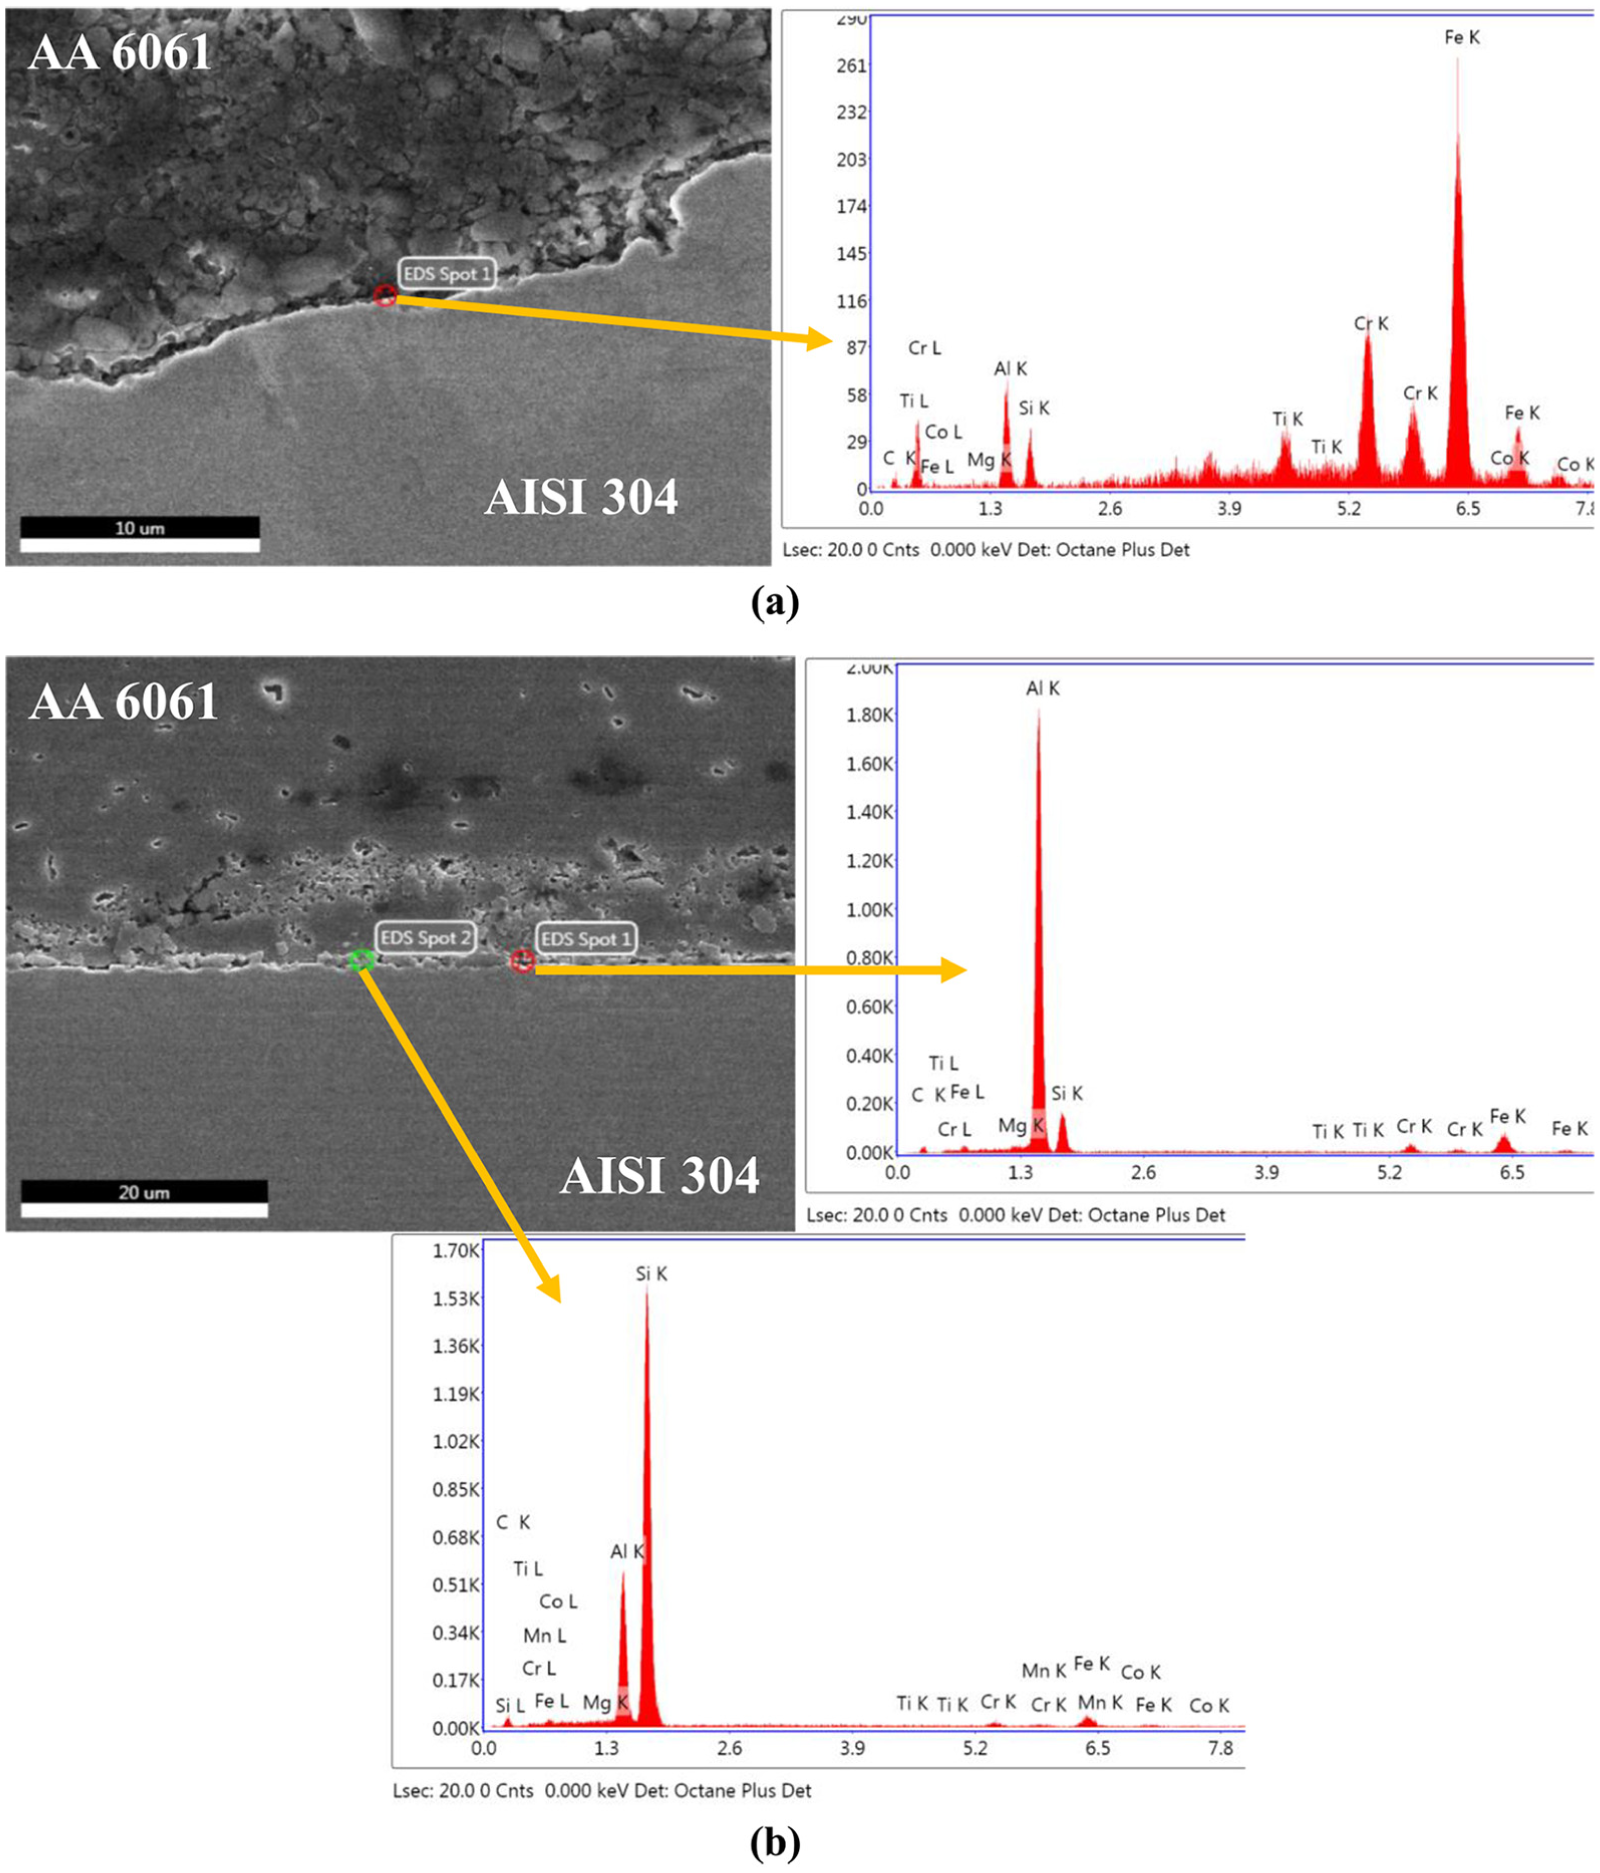
EDAX of (a) CAS and (b) CFA, welded with ω = 2400 r/min and v = 50 mm/min.
Elemental composition (wt%) of welded samples at the weld interface.
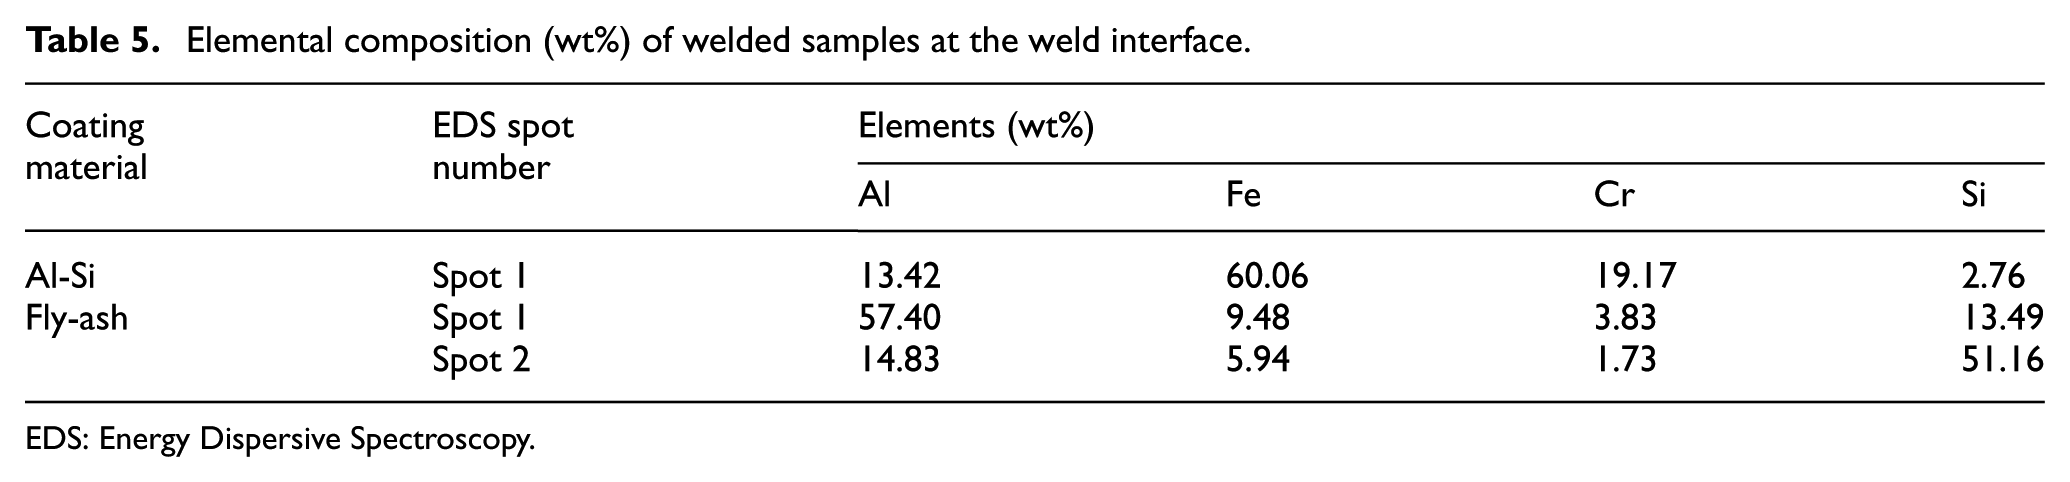
EDS: Energy Dispersive Spectroscopy.
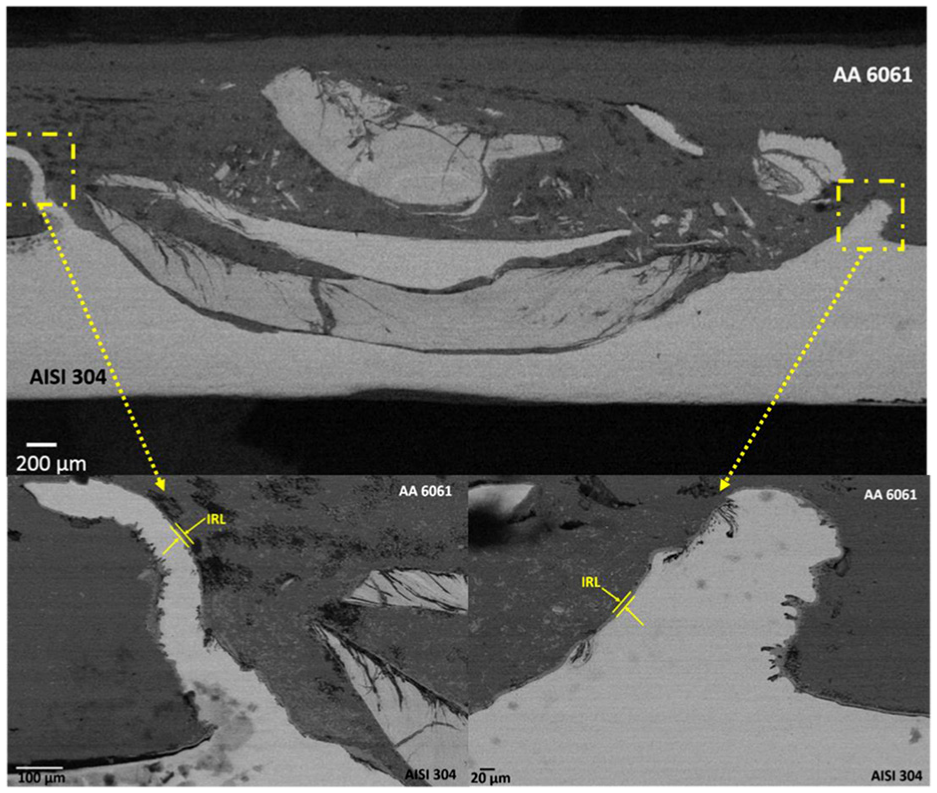
The abrasion of steel particles and the formation of sawtooth structure at the weld interface; SEM image of NC welded sample at nugget zone with ω = 2400 r/min and v = 50 mm/min.
Conclusion
The present work demonstrates the use of Al-Si and fly-ash as coating materials over steel which has been welded with aluminium by using FSW process. From the experimental observations, the following conclusions have been drawn:
The axial force of the NC welded sample is less compared to coated samples due to the presence of interlayer present over the steel in coating process. Among the coatings, the CFA exhibits low axial force during welding due to the presence of low-density oxides.
CAS sample has been found to be exhibiting brittle mode of failure in TMAZ zone, while ductile mode has been observed in the case of CFA sample.
The IRL compounds formed in the case of CAS and CFA samples have been found to be rich in Fe, while the ones formed in the case of NC are rich in Al. The failure load was thus observed to be high in the case of CAS and CFA samples, whereas it was low in the case of NC sample because of the hard and brittle compounds rich in Al.
CAS sample has been found to be high hardness as compared to the CFA sample because of higher grain size.
The joint strength efficiency of NC welded sample has been found to be 72% with respect to the base material, and the joint strength efficiency for CAS and CFA samples is 141.7% and 135.4%, respectively, with respect to the NC sample.
The abrasion of steel particles has been observed in the case of CAS and NC samples but has been reduced in the case of CFA sample due to the presence of metal oxides.
Footnotes
Declaration of conflicting interests
The author(s) declared no potential conflicts of interest with respect to the research, authorship, and/or publication of this article.
Funding
The author(s) disclosed receipt of the following financial support for the research, authorship and/or publication of this article: The authors acknowledge Department of Science and Technology-Science and Engineering Research Board (DST-SERB), New Delhi, India, for providing fund to the present research work, under the project sanction code EMR/2015/001588.