
Abstract
At present, the status of the monitoring of computerized numerical control machine tools is still in the initial stage, and there is no uniform standard for fault early warning and diagnosis of machine tools. A standardized and comprehensive machine tool condition monitoring method based on energy fault tree analysis is proposed. The power, current and temperature inside the numerical control system and the signal of the external vibration sensor are collectively referred to as energy. A new energy fault tree is used to identify the location of the fault. At the same time, the client of computerized numerical control system internal information collection and analysis is developed. The characteristic frequency of each key component is analysed by theoretical mechanics, and an overall monitoring method is proposed to improve the monitoring efficiency. Finally, the reliability of the monitoring method is verified by experiments. The surface roughness of the parts is reduced by approximately 50%, which lays the foundation for the application of the engineering.
Introduction
The manufacturing process generates a large number of data for a machine tool, such as the current, the load and the following error of each axis. These data reflect the real-time running state of the machine tool. In industry, because of the characteristics of process data, it is very common to fail to understand the records stored in the database, resulting in, to a certain extent, the waste of valuable information resources. Thus, machine tool status monitoring may also be difficult to achieve.
In terms of status monitoring, collecting the data from the machine tool is indispensable. The most common method for acquiring data is installing various sensors on the machine tool, and the raw data will be transmitted via a signal acquisition card through computer terminals. Ferraz and Coelho 1 presented a data acquisition system using sensors, including an acoustic pressure sensor and a voltage sensor, to monitor the state of tool wear. Chi et al. 2 developed a monitoring system of the grinding process, and the electric spindle power was measured using a power sensor. Moreover, Lin et al. 3 employed the accelerometers to collect vibration signals accompanying the machine tool operations. Yuan et al. 4 presented a radio frequency identification–based visibility monitoring rule and the manufacturing information was acquired through the various sensors. However, these methods can only be used in the case of dismantling the protective cover of the machine tool, so it is difficult to install sensors and communication systems at the critical position.
To address these problems, the Object Linking and Embedding (OLE) for Process Control protocol, which is called OPC and supported on machine tools, is developed to exchange data. 5 The OPC protocol simplifies the process of collecting data from NC systems. Moreover, using the OPC protocol can guarantee stable equipment operation. Thus, the OPC protocol is a good method for acquiring data without any additional monitoring equipment while ensuring that manufacturing operates smoothly. Uhlmann et al. 6 acquired machine tool data through OPC technology to monitor the condition of the feed axes. Silvestre et al. 7 presented an approach for automatic supervision and remote fault detection by using the OPC standard, which allows promotion of the interoperation of software objects in distributed-heterogeneous environments and allows incorporation in the system remote supervision. The above OPC method can only be used for the overall fault diagnosis. But the fault cannot be identified to the specific key components.
After obtaining sufficient data via the OPC protocol, the data mining, such as fault diagnosis, is most significant for maintaining a machine tool. Wang et al. 8 used the support vector machine and differential evolution optimization to achieve the tool wear classification. Zhao et al. 9 provided a multimedia solution combined with rough set theory and information technology for a diagnosis module developed in modern CNC grinding machines. Pan et al. 10 developed a method to online monitor the condition of an operational shaft using the pattern of the multiscale entropy (MSE). Rehorn et al. 11 presented the detection and diagnosis of brush seizing faults in the spindle positioning servo drive of a high-precision machining centre using a developed time–frequency pattern classification technique known as selective regional correlation (SRC). Yang et al. 12 presented a novel tool wear prediction model based on improved least squares support vector machine method to predict tool performance. Boutros and Liang 13 developed a diagnosis method for mechanical faults using the discrete Hidden Markov method. All of these methods can effectively perform fault diagnosis; however, they cannot easily identify the fault causes, which is also important to improve the security of machine tool.
Fault tree analysis (FTA) is a well-established and well-understood technique that is widely used to determine system dependability. 14 In this method, the logical connections between faults and their causes are represented graphically. The basic mechanism of FTA is that the analysis starts with a top event and works backwards from the top of the tree towards the leaves of the tree to determine the root causes of the top event. Moreover, the occurrence probability of the top event is a function of the occurrence probability of basic events. Therefore, uncertainties raised in the basic event reliability evaluations will accordingly generate uncertainties in the results. 15 Hyman and Johnson 16 presented an FTA of the patient harm-related clinical alarm failures. Park and Lee 17 established an FTA of a handwashing process to investigate the causes of faults in hygiene management. Abecassis et al. 18 used FTA to prevent wrong-site surgery. However, FTA does not integrate OPC monitoring with external sensor monitoring.
Through the summary of the above research, the traditional OPC monitoring cannot identify the fault of the specific components. When most scholars monitor the external information, sensors that need to be calibrated regularly are often installed on specific components, so it is not convenient for engineering applications. This article presents a new strategy for monitoring CNC machine tools in the second part, and the definition of energy is described in detail. In addition, the current and temperature inside the numerical control system and the external vibration sensor signal are all collectively referred to as energy. Then, the related work, which is client development and theoretical analysis, is carried out in the third and fourth part, respectively. The method of EFTA is used to monitor machine tools and is an approach that other scholars have never put forward. The feasibility of the strategy is validated by experimental verification in the fifth part. The results show that the proposed method can solve the limitations and reliability of monitoring CNC machine tools.
Fault warning strategy for CNC machine tools based on EFTA
In this article, the fault warning is divided into three stages. First, data acquisition is the basis. The data collection should be comprehensive and reliable. Second, fault diagnosis is the core. The fault is accurately diagnosed according to the data. Third, the fault early warning is the vision. If the contents of the first and second stages are reasonable, the third stage of the fault warning is formed naturally. At present, the status monitoring of CNC machine tools is used mainly in production data and process display. In the early warning and diagnosis of machine tool fault, the optimization of the fault analysis algorithm is emphasized, whereas the engineering application is considered to a lesser extent.
According to the properties of CNC machine tools, combined with the internal information of CNC systems and the vibration characteristics of key components, a new method is proposed for early warning of machine tool failure. The specific concept of energy is put forward, because the temperature, current and power of the CNC machine tools, and the vibration information of the external sensors can produce thermal or mechanical energy.
The principle of energy operation
The running energy of the CNC machine tool can evaluate the state of the CNC machine tool. The main reason is that the machine tool control system drives the motor, and the motor drives the key parts. When the function of the parts in the transmission system and feed system of the CNC machine tool is abnormal or invalid, it will affect the energy state in the operation of the machine tool. In this article, the monitoring system of the total energy and the energy distribution are used to monitor the control system and the key components of the transmission, thereby realizing the application of engineering fault early warning.
The total energy of the CNC machine tool includes the energy of the main drive system, the feed system and the machine auxiliary system (hydraulic systems, cooling systems, chip removal systems, etc.). This article studies mainly the CNC machine tool itself; therefore, the energy of the main drive system and the energy of the feed system are primarily considered.
Principle of energy in the main drive system
When the CNC machine tool is in operation, the energy operation principle can be expressed as follows
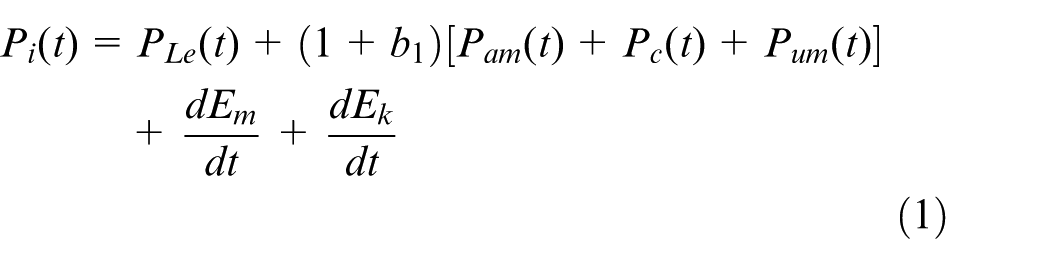
where
To consider monitoring the consistency of the data, the machine tool is generally in steady mode. Thus, the speed change is small, and

If the monitoring mode adopts a no-load operation method, then the cutting power
Principle of energy in the feed system
The feed system energy of a CNC machine tool is generally composed of servo drives and servo motors. The power loss of alternating current (AC) servo drives can be obtained by the following formula
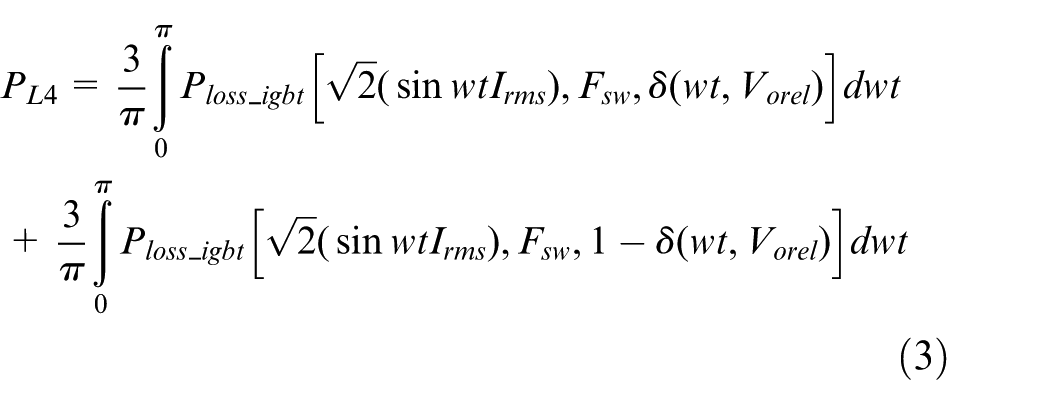
where
Considering the load loss power, the no-load power and correlation coefficient of the drive system, the energy operation principle of the single feed system can be analysed as follows

where
The influence of the key components on the energy of the transmission system
Through the above energy analysis formula of the main drive system and feed system, the total power of the machine tool can contain the characteristics well. However, as the time of the machine tool changes, the wear of the guide, screw and bearing gradually increases. As a result, the corresponding power will gradually increase. For example, the principle that the state of a screw rod affects power can be expressed by the following formula

In the above formula

where I is the vice wear of the screw nut,
An EFTA is a type of logic diagram that can monitor and identify the state of the components by analysing the total energy of the system and the energy of each branch. An EFTA is also an inverted tree shape analysis method. The abnormal information of the energy characteristics is taken as the starting point, and then the reason for the fault is found step by step until the case of no fault is achieved. The operational state of the CNC machine tool transmission system is closely related to the energy of the machine tool. In this article, based on the energy characteristics of the main drive system and the feed system of CNC machine tools as well as the influence of key components on the energy of the transmission system, a fault early-warning strategy for CNC machine tools is proposed that includes the principle of the EFTA.
Fault early warning strategy for CNC machine tools
The system of advanced CNC machine tools can generate and store various driving and state data. To achieve better performance, NC machine tools integrate many sensors and feedback devices. Therefore, numerical control systems store and process numerous machine-tool state data. Making full use of the data of the control system, sensors and feedback devices of CNC machine tools can ensure the stability and continuity of the data source when monitoring the state of CNC machine tools. Moreover, making full use of the data can reduce the cost of sensor installation and data acquisition. Because of the design optimization of the machine tool itself, the factory production environment has less influence on data acquisition. Energy feature data such as drive motor current, with high signal-to-noise ratio and high information integration, are convenient to acquire and suitable for use in machine tool fault early-warning analysis. However, the drive data can only reflect the state of the drive system and cannot accurately pinpoint the location where the malfunction or the failure may occur.
There is a wide range of parts for which the features are very complicated, and the cutting parameters vary greatly. Hence, a great challenge is to achieve real-time machining data processing and machine tool fault early analysis and warning. In response to this situation, a method of fault early warning based on the energy feature data of a machine tool and the characteristic frequency signal of key components is proposed. A specific NC machining program for testing machine tool performance has been designed. The NC machining program of different types of machine tools is inconsistent, but the programs of the same type of machine tools are basically the same. The main principles of the program are the following: (1) Considering the comprehensiveness of acquisition and monitoring, the coordinates should run in full range; (2) The running speed is the fast feed speed of each machine tool; and (3) The spindle rotating speed is at the highest speed. The energy feature data of the machine tool are acquired when running the specific NC program periodically. In general, this program runs once a day. The characteristic frequency of each key part of the machine drive system is calculated in advance. This method improves the energy threshold of traditional fault early warning. The EFTA is applied to the fault warning of the NC machine tool in view of the variety of fault symptoms and the uncertainty of fault phenomena. When the whole energy of the equipment is abnormal, the EFTA is used to analyse the energy and the component frequency information of each linear axis, rotating shaft and its sub-transmission system, as well as the spindle, to pinpoint the sub-transmission system or components that may malfunction or lead to the decline of the machine performance. The early warning of machine failure can provide guidance for the regular precision inspection and maintenance of NC machine tools, thereby reducing the quality accidents caused by the failure of the key components providing the order preparation time for the parts replacement and reducing the machine downtime.
The failure prediction method of CNC machine tools based on the EFTA is shown in Figure 1. This research is divided into two parts: the energy characteristic analysis of the CNC system and the frequency analysis of the key components. In the analysis of the numerical control system energy feature, the total energy and the energy of the subsystems are monitored in real time. First, the energy failure system such as the spindle, linear axis or rotating axis is positioned according to the energy anomaly state. Second, in the analysis of the characteristic frequency of the key components, the machine tool global detection method is adopted, the sensor is installed on the worktable or column of the transmission system and the sensor data collected in real time are used for frequency signal analysis to accurately locate the faulty parts.
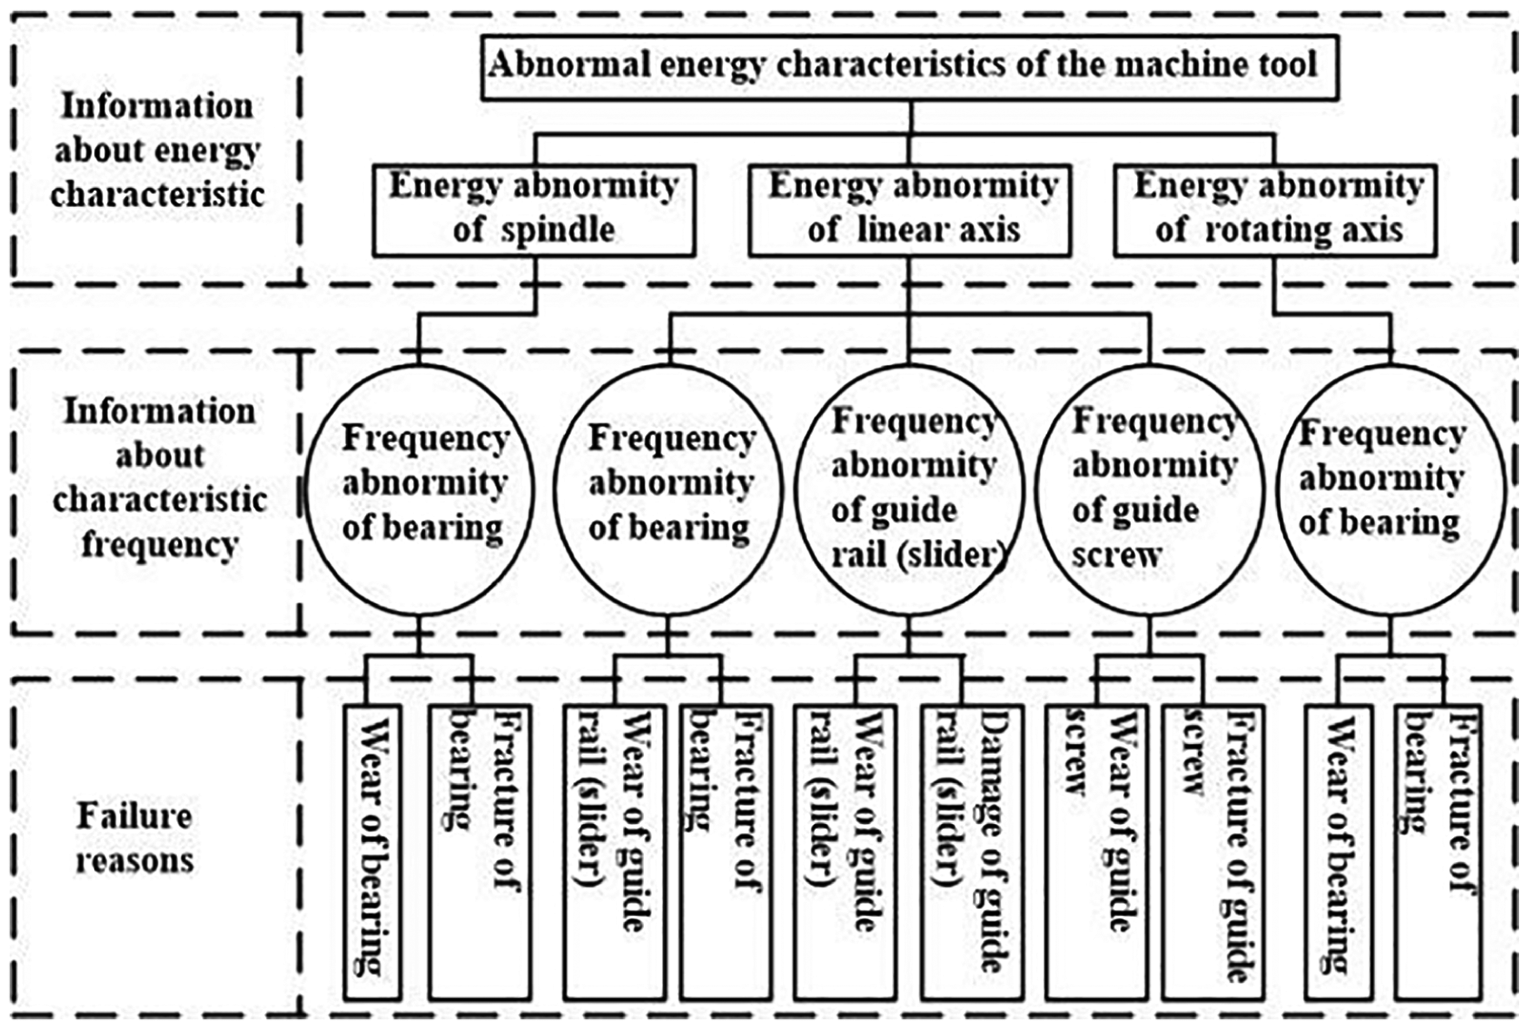
Fault warning method of a CNC machine tool based on EFTA.
To ensure the reliability of the research, we must make some assumptions about the research. First, when the internal information of the NC system is collected, each machine must run the same program to ensure the effectiveness of the data. Second, the wear state of the key components must be the initial state of the fault so that the location of the fault can be identified. If a key component is seriously worn, that is, a large amount of pitting wear exists, this method will not be suitable. Because the serious wear signal is a disordered high-frequency signal, the method is unable to identify the specific location.
First-stage monitoring based on EFTA: client development of information collection and evaluation in a CNC system based on OPC
Selection of internal data acquisition method in a CNC system
The key to CNC machine tools fault warning is the state of the machine-related data collections. Machine data acquisition methods can be divided into four categories: data collection based on the direct numerical control (DNC) interface, serial interface and macro command, machine electrical circuit and Programmable Logic Controllers (PLC), and OPC interface. OPC effectively separates the underlying hardware drivers and the development of upper-level applications. With the unified data interface, data exchange visits are allowed between different device protocols. OPC supports communications of objects between different computers in a local area network (LAN), wide area network (WAN) and even Internet, with capabilities of high-performance remote data access. Therefore, this article considers the OPC interface for machine energy-related state data collections.
Framework of monitoring system based on OPC
There are two primary types of OPC interface: custom interface and automation standard interface. The custom interface is essentially a COM interface that facilitates the development of the C++ language client. Application development of the automatic interface uses script programming language. In this article, based on the visual basic (VB) language and the custom interface, the OPC client has been developed to collect the status data of CNC machine tools.
In this article, when the machine data are collected, a specific program is run. Before reading the data, it is necessary to establish the connection between the OPC client and the machine OPC servers according to the OPC standards. The main steps included are as follows:
Create OPC server objects and connect to the OPC servers;
Create an OPC group and set the OPC group object properties;
Add the OPC tag and set the OPC item properties.
When the data connection is completed, the data reading operation is performed when the NC machine runs the specific test program. After the program is completed, data storage and analysis are conducted. Finally, the OPC server is disconnected, and the resources are released. OPC-based machine data reading and processing are shown in Figure 2.
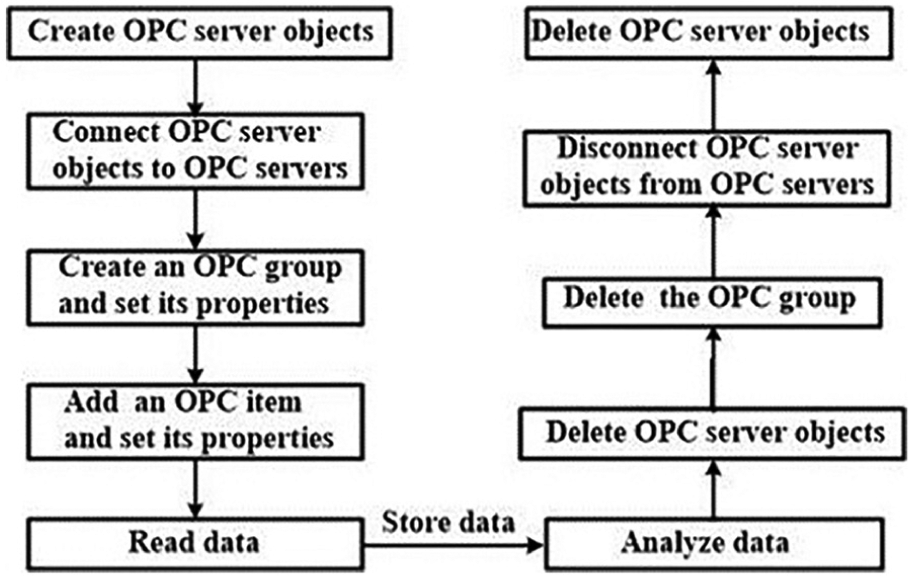
Machine data reading and processing flow based on the OPC interface.
System development
Taking the Siemens 840D NC system as an example, the machine state data monitoring system is developed based on the OPC. The system runs on the computer connected with the CNC system through the network. The monitoring system periodically collects machine-related data such as the power, the current and the temperature of the spindle and each transmission shaft. The data are saved and displayed in real time. The screen of the monitoring system is shown in Figure 3.
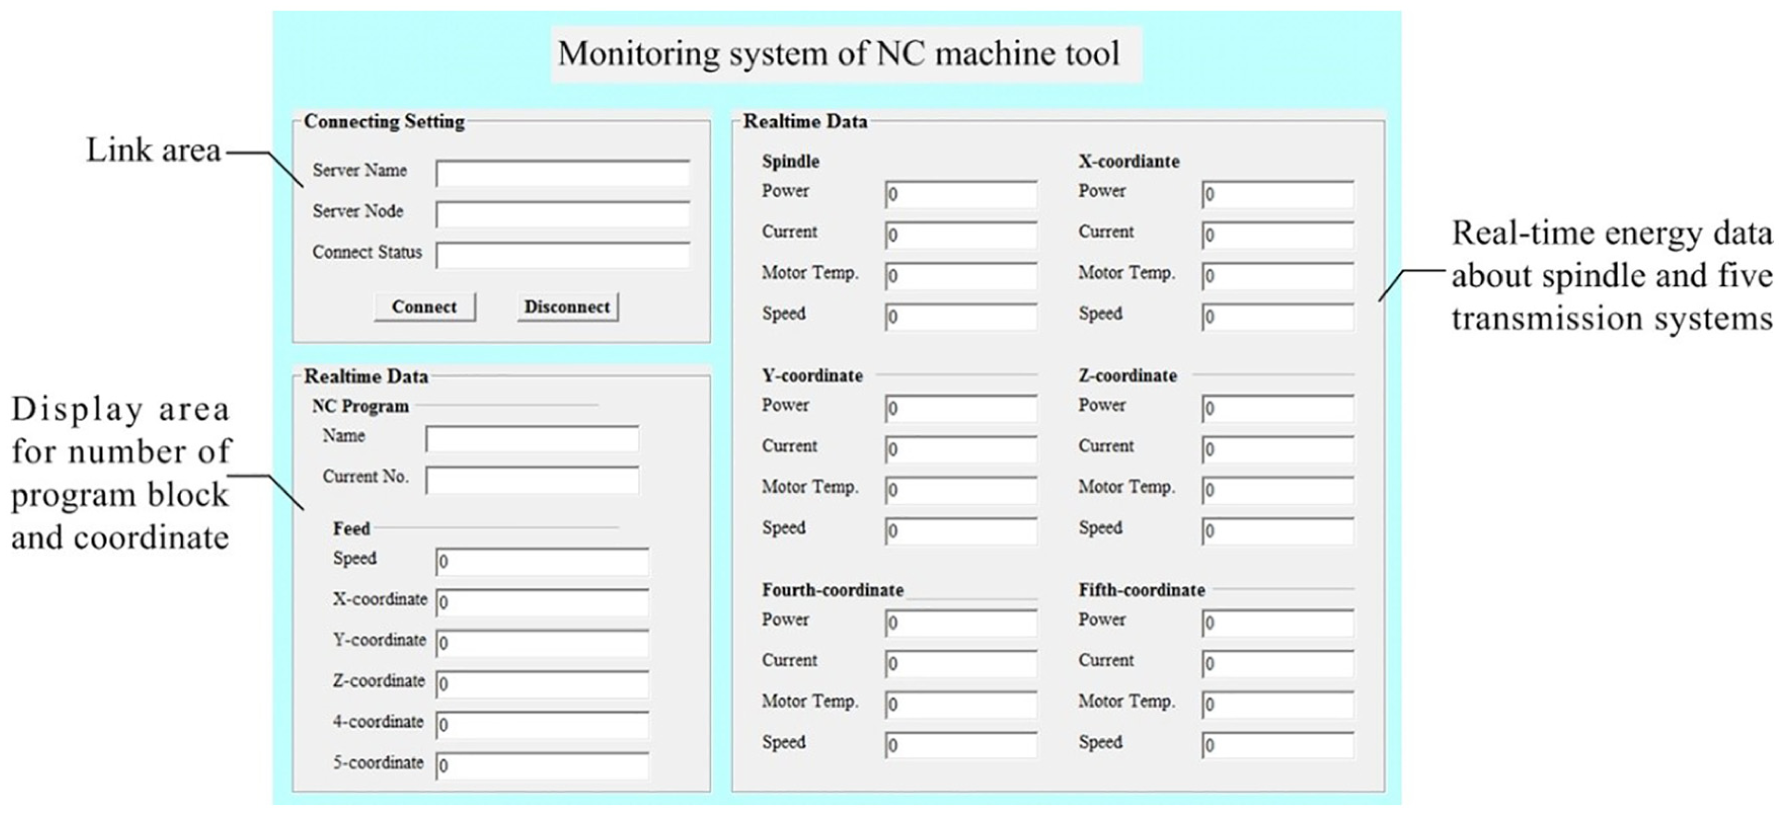
Monitoring system of the NC machine tool based on OPC.
To realize the engineering application, after collecting and displaying the data, the whole energy data of the standard program is analysed and processed by VB software. In addition, the real-time display interface of key indices such as the variance and mean of the data is developed through a MATLAB database.
The monitoring system based on OPC can monitor the state of the CNC machine tools in real time, that is, it can identify the energy abnormality of the transmission system. However, the specific location of the failure cannot be determined. Therefore, it is necessary to analyse the kinematics of the key components and then monitor the characteristic frequency of the components through the external sensors.
Second-stage monitoring based on EFTA: kinematic analysis of key parts of machine tools
To obtain the relationship between the results of raw data processing and the key parts of CNC machine tools, it is necessary to study the characteristic frequency of each component. In the traditional CNC machine tools, the bearing, the screw nut seat and the guide rail (slider) and other fixed parts make up the transmission system of each axis.19,20 When the parts are processed, the three key parts are coordinated to complete the ideal motion trajectory. Therefore, the above three parts are the key parts of the CNC machine tools and are also the most easily worn.
In this section, the key parts of the rolling drive system of CNC machine tools are studied. The ‘characteristic frequency’ of the three key parts, including the bearing, the screw nut seat and the guide rail (slider), are calculated sequentially, and the corresponding calculation method is obtained.
Kinematic analysis of the bearing
Because scholars have conducted thorough research on the ‘characteristic frequency’ of the bearings, this article does not introduce the topic in detail. 21 The bearing fault characteristic frequency formula is shown in Table 1, where D is the bearing diameter corresponding to the centre of the rollers and is known as the middle diameter, d is the diameter of the bearing rollers, Z is the number of rollers in the bearings, α is the contact angle and fi is the rotation frequency of the bearing. Then, fbpfi, fbpfo, fc and fbsf are, respectively, the characteristic frequencies of the inner ring raceway, the outer ring raceway, the holder and the roller (Figure 4).
Calculation formulae of the bearing characteristic frequencies.
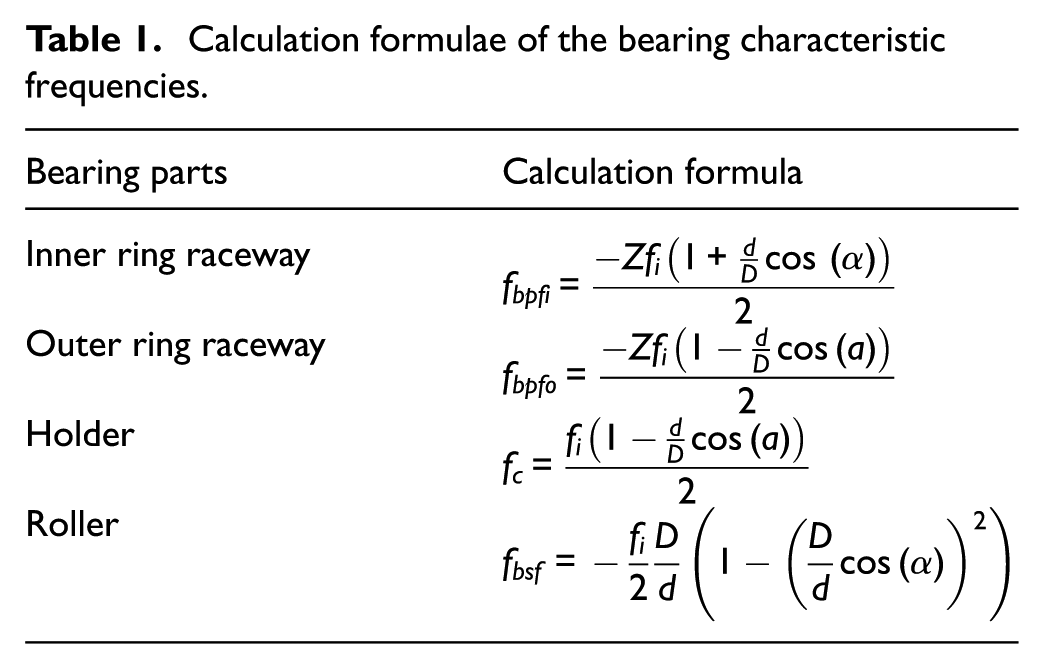
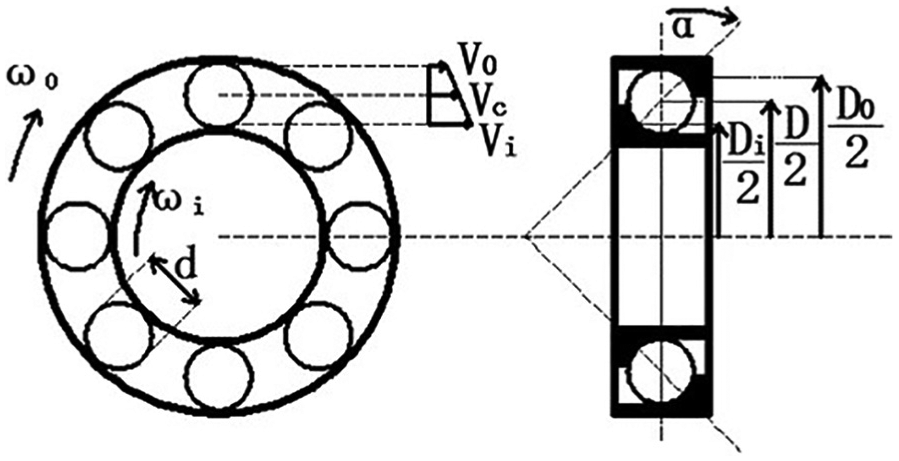
Diagram of the bearing rolling.
Kinematic analysis of the ball screw
The middle diameter of the screw is D. According to the geometric relationships given in the Figure 5, we know that the middle diameter is as follows

where Di is the diameter of the inner race raceway, and Do is the diameter of the outer race raceway. The relationship between the two diameters and the middle diameter can be written as follows


where d is the diameter of the screw rollers, and β is the contact angle.
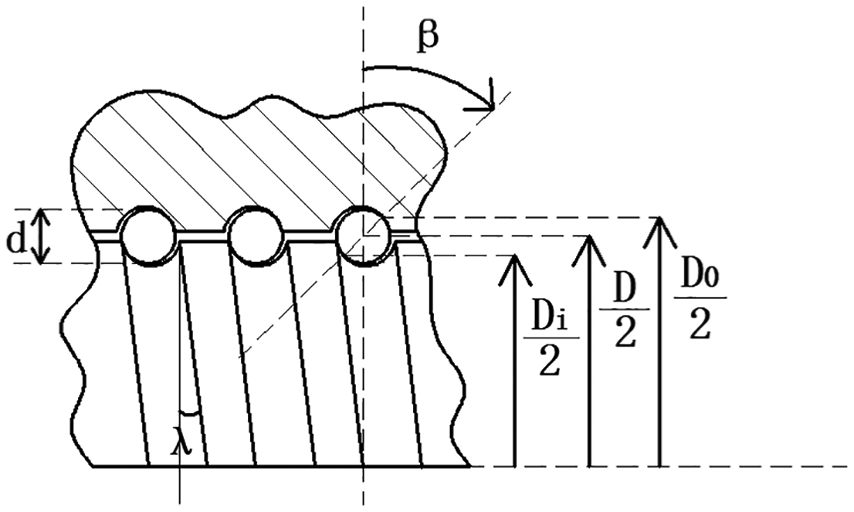
Diagram of the ball screw.
The following formula can be obtained by detailed calculation (among the variables, fc is the frequency of the roller centre; fi is the frequency of the inner raceway; and fo is the frequency of the outer raceway)

Normally, the outer raceway of the screw does not rotate. Thus, the above equation can be simplified to

The rolling frequency of the roller centre against the inner raceway (expressed in fri) can be written as follows

If the guide screw has Z rollers in a single lap, then the roller will be through the inner raceway fixed point Z times. Thus, the frequency of the roller passing through a fixed point on the inner raceway, that is, the characteristic frequency of the inner raceway fault (expressed in fbpfi), is as follows

When the outer raceway remains fixed and non-rotating, it can be simplified as follows

The rotation frequency of the roller core with respect to the outer raceway (expressed in fro) can be calculated similarly

Using the same method, the frequency of the roller passing through a fixed point on the outer raceway, that is, the characteristic frequency of the outer raceway fault (expressed in fbpfo), can be calculated as follows

In addition to circular motion, the roller in the guide screw still has linear motion in the horizontal direction. Moreover, the roller rolls ideally in the raceway of the guide screw without relative sliding between the roller and the raceway. Therefore, the distance of the roller movement track on the inner raceway is equal to the circumference of the roller rotation. That is

Among the variables, fbsf is the spin (rotation) frequency of the roller and is further written as follows

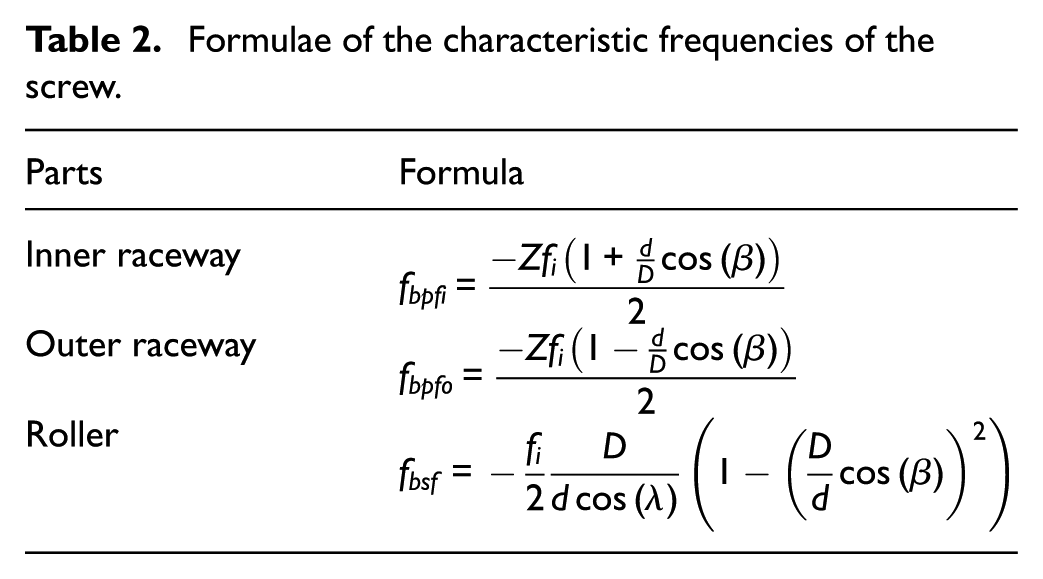
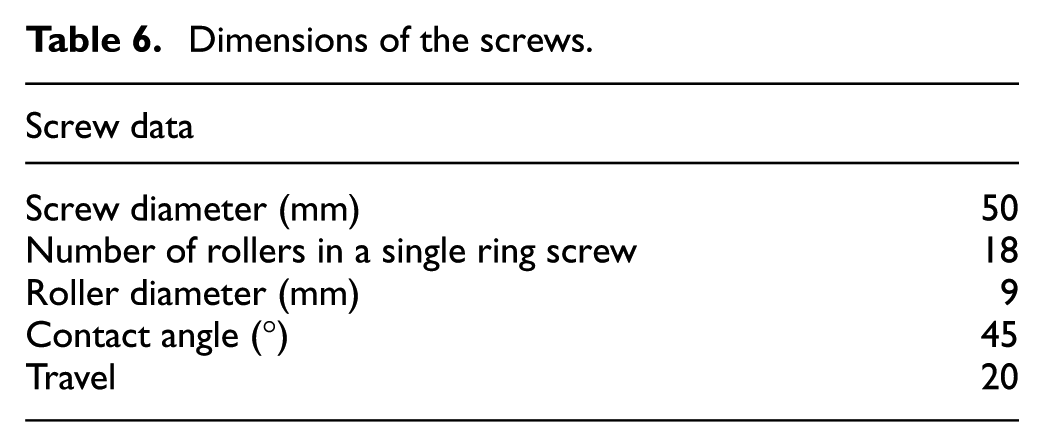
In summary, the characteristic frequency of the screw fault can be calculated using the formulas shown in Table 2. Among these formulas, D is the screw diameter corresponding to the roller core, namely, the mean diameter of the screw; d is the diameter of the roller; Z is the number of rollers in a single lap; β is the contact angle; λ is the rotation angle caused by lead; and fi is the rotation frequency of the inner raceway, namely, the rotation frequency of the screw.
Formulae of the characteristic frequencies of the screw.
Kinematic analysis of the guide rail
As seen from Figure 6, the velocity of the roller core is v/2 when the slide block moves linearly at speed v. Thus, the roller moves at speed of v/2 relative to the slide block during the time from the roller entering the slide block until the roller leaves it, and the relative movement distance is equal to the slide block length L. Moreover, the roller moves at speed of v/2 relative to the guide rail, and the relative movement distance is L.
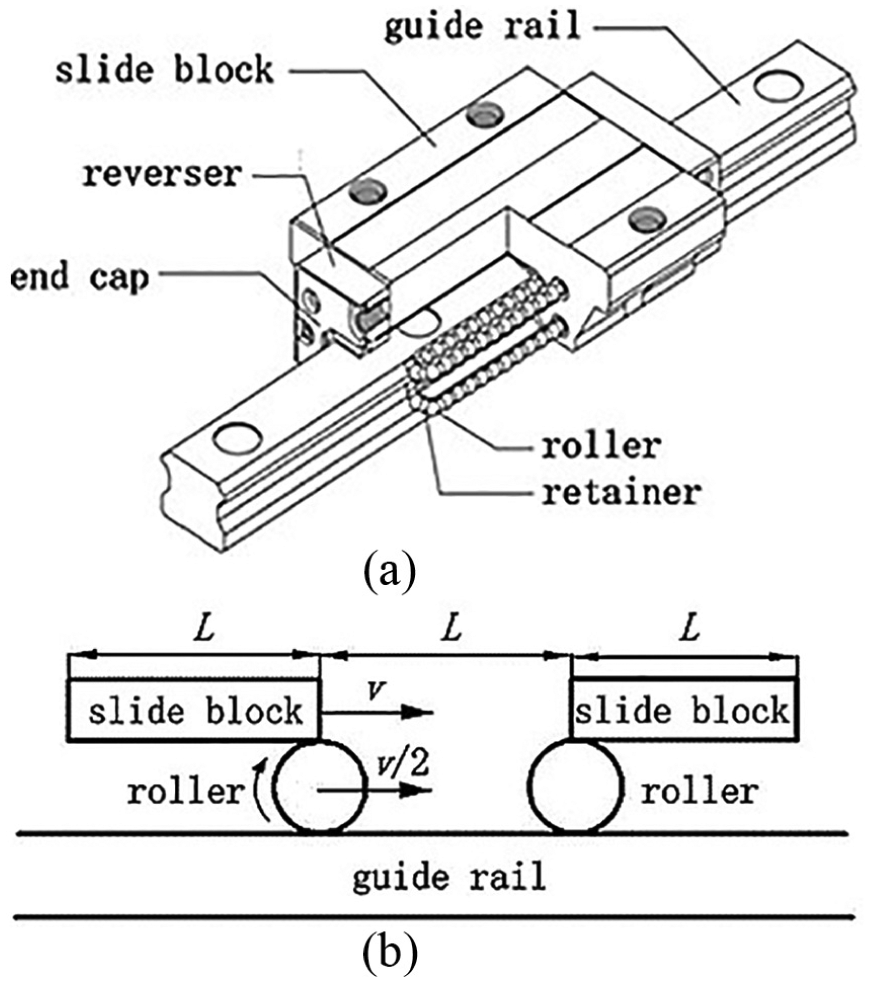
Motion schematic of the guide rail and the slide block: (a) structure of the guide rail and the slide block and (b) movement of the roller inside the slide block.
Therefore, the frequency of the roller passing through a fixed point on slide block or guide rail (where

If there are Z rollers between the slide block and guide rail, then the characteristic frequency of the slide block fault is the same as the guide rail fault (fbpfi is the characteristic frequency of the guide rail fault, and fbpfo is the characteristic frequency of the slide block fault)

The roller moves linearly at the speed of v/2. Thus, the angular velocity of the roller (expressed in ω) is as follows

The rolling frequency of the roller is as follows
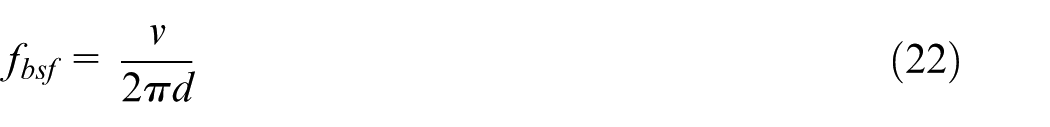
where
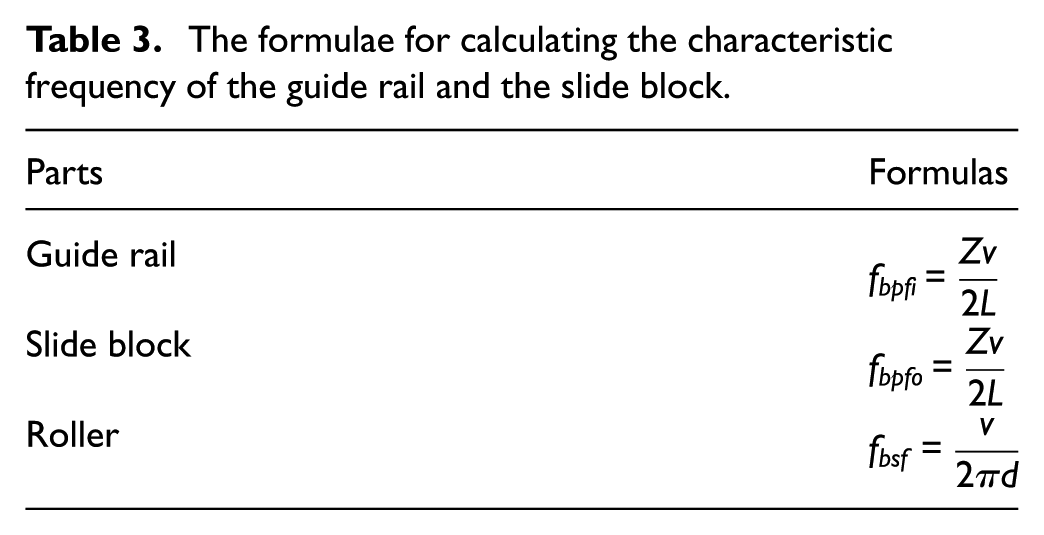
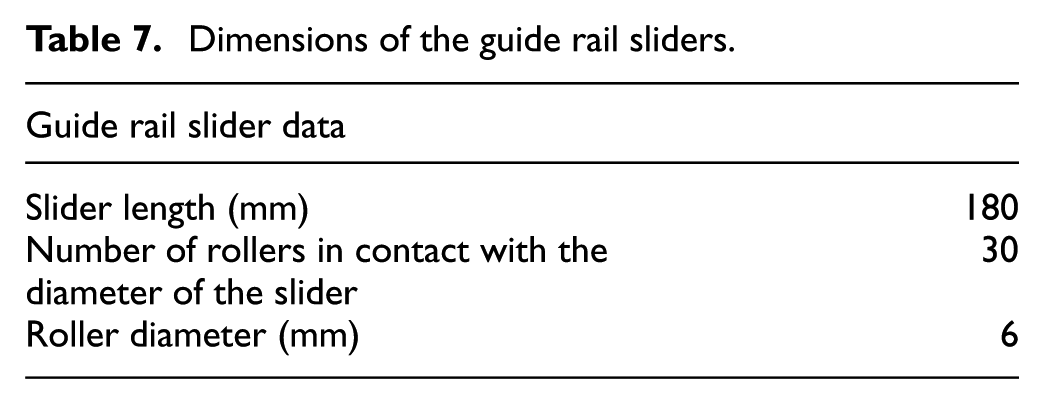
In summary, the characteristic frequency of the guide rail and slide block fault can be calculated with the formulas shown in Table 3. Among them, L is the length of the slide block, v is the velocity of the slide block, d is the diameter of the roller and Z is the number of rollers between the slide block and the guide rail.
The formulae for calculating the characteristic frequency of the guide rail and the slide block.
Test verification
Based on the above theoretical research, the state monitoring of CNC machine tools is closer to the engineering application. In this section, the transmission agent of a certain vertical-horizontal-switch machine is tested and analysed, and the correctness of the application of the research method of the CNC condition monitoring based on EFTA is verified.
Test background and purpose
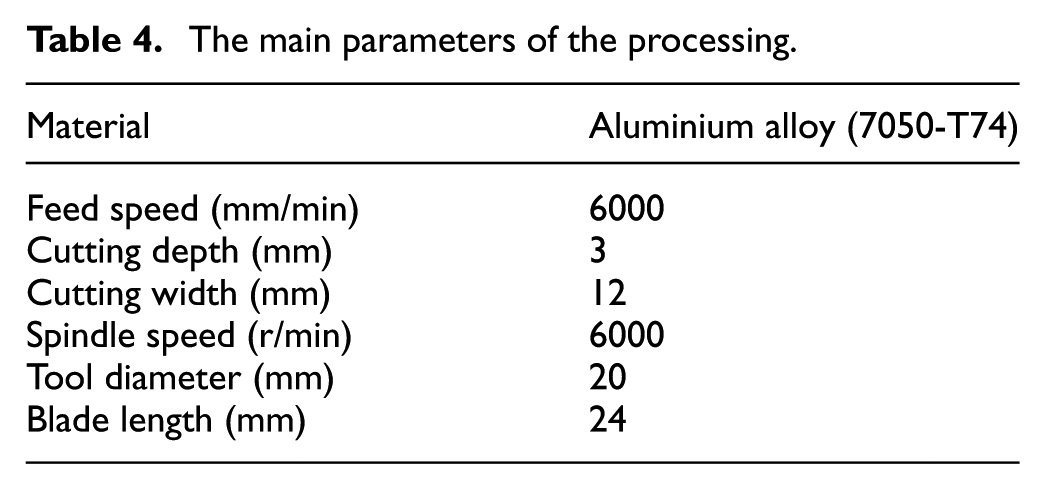
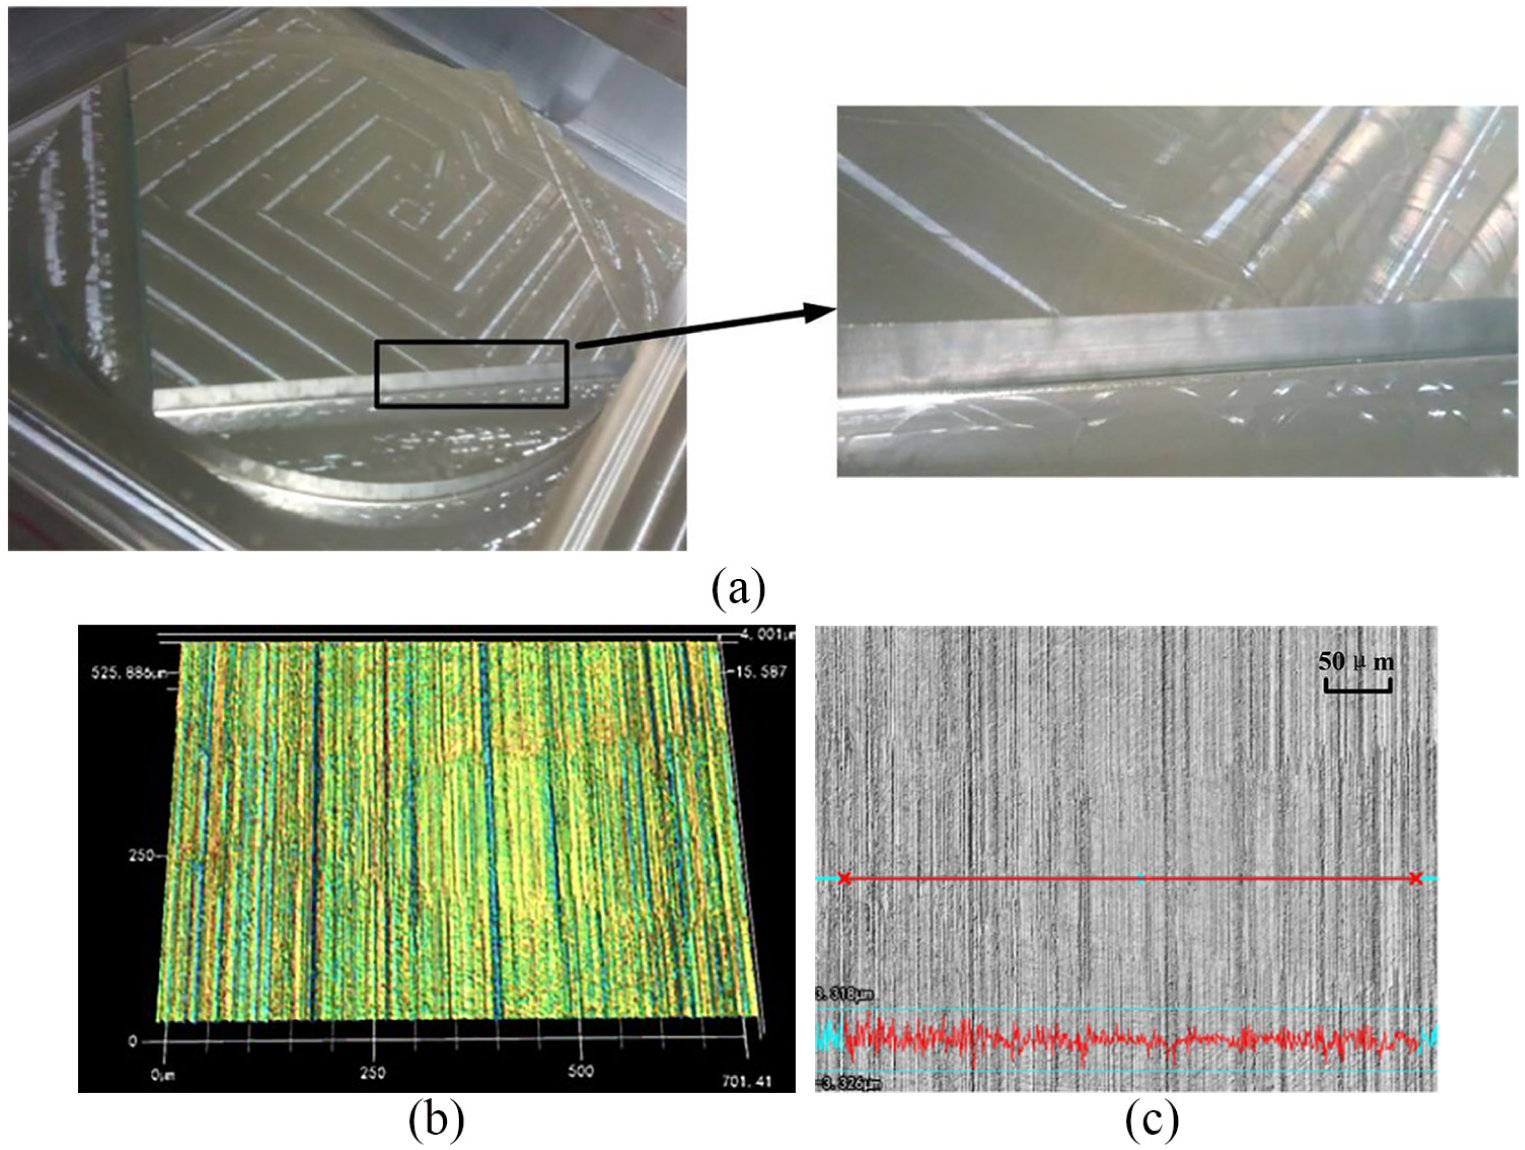
When a certain horizontal machining centre processes complex aircraft structures, there is an obvious ripple, as shown in Figure 7(a) and (b). The surface roughness is measured, as shown in Figure 7(c). The roughness is Ra = 1.236 μm and Rz = 9.176 μm. The centre contains a SHY580 machine tool, an operator computer (PC) and an operation panel, as shown in Figure 8. The machine with SIEMENS 840D and its work table size is 800 mm × 800 mm. The OPC client is installed on the PC. The main parameters of the processing are as shown in Table 4.
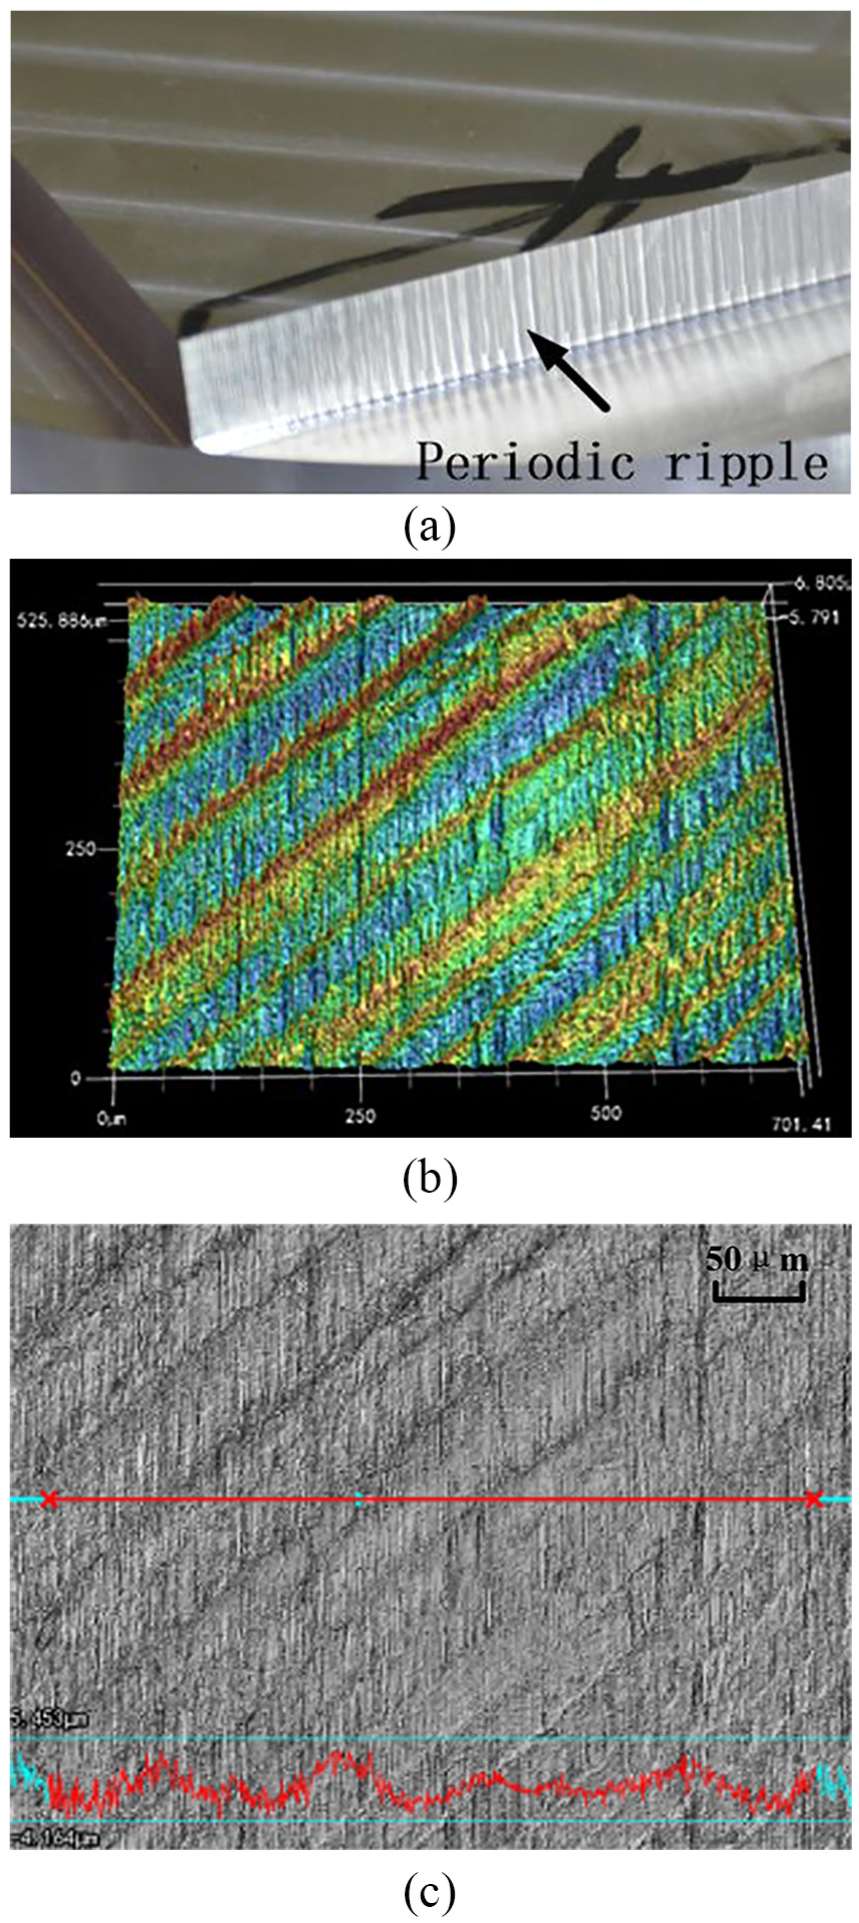
Surface ripple of the workpiece: (a) ripple display of actual part, (b) three-dimensional display under optical instrument and (c) surface roughness measurement.
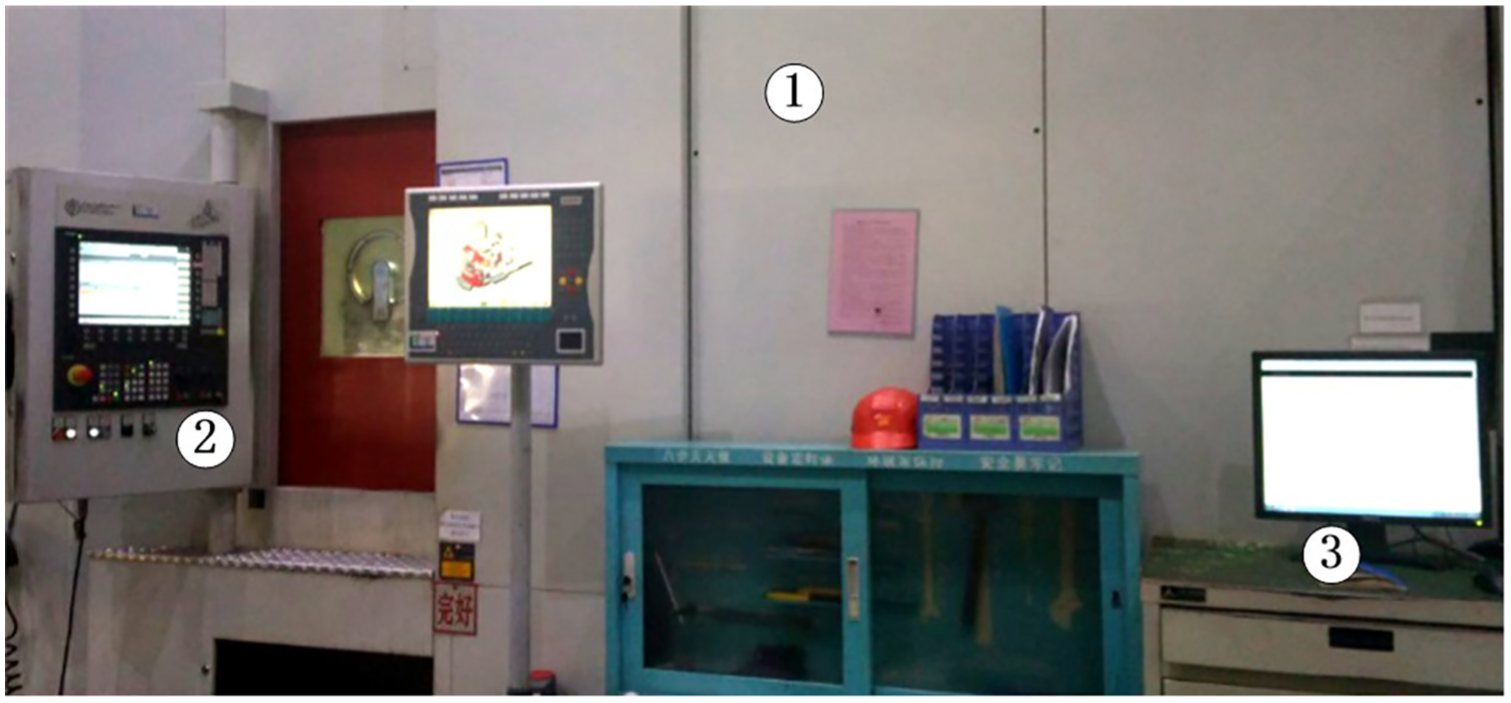
Horizontal machining centre: (1) five-axis machine tool, (2) operation panel and (3) PC.
The main parameters of the processing.
The causes of waves must be analysed carefully. First, the numerical control system parameters of the machine tool are unchanged, as are the processed materials and tool models. Second, since the parts have ripples in the X-Z linkage test and there are no waves in the Y-Z linkage, it is obvious that the X-axis has some problems. Simultaneously, the power, current and temperature of the X-axis are abnormal in the OPC client, which validates the feasibility of the OPC monitoring system. However, it is difficult to find the specific location of the fault. It is difficult to know where the problem is on the guide, the screw or the bearing.
The main purposes of cutting test and sensor testing are as follows: (1) the verification of the energy fault early warning and OPC monitoring system, (2) the verification of the calculation of the characteristic frequency of key components and (3) implementation of the normalized test of the CNC condition monitoring based on the EFTA.
Test condition and content
The test tool is the integrated collection box and the configured multichannel data acquisition card. The sensor adopts a unidirectional acceleration sensor, and the sensitivity is 100 mV/g over the range of ±50 g. The outside of the professional cable of the sensor is a metal shield, and its length is more than 3 m. The software is the LabVIEW graphical development system. The speed of the X-axis of the CNC is 6000 mm/min, and the running distance is 600 mm.
To verify the engineering application of the above theory, three tests have been conducted. The vibration tests of three directions of bearing, guide rail and column were conducted in sequence. Among them, the column vibration information acquisition is the overall detection method, which is also the most important method because the vibration of all the key components in the transmission system will pass on the column. The test of a single key component such as the bearing and the guide rail is theoretically verified. Because it is difficult to install the sensor in the screw nut seat, the sensor is not installed. The screw can be evaluated by theoretical and existing detection information.
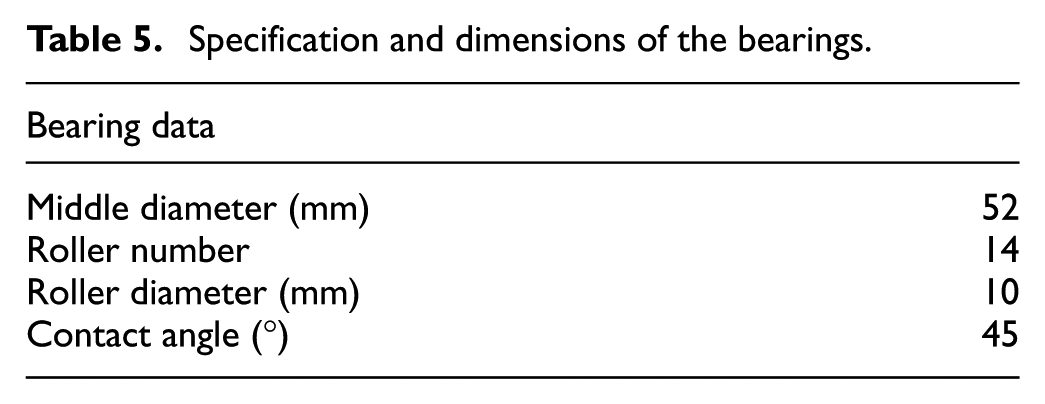
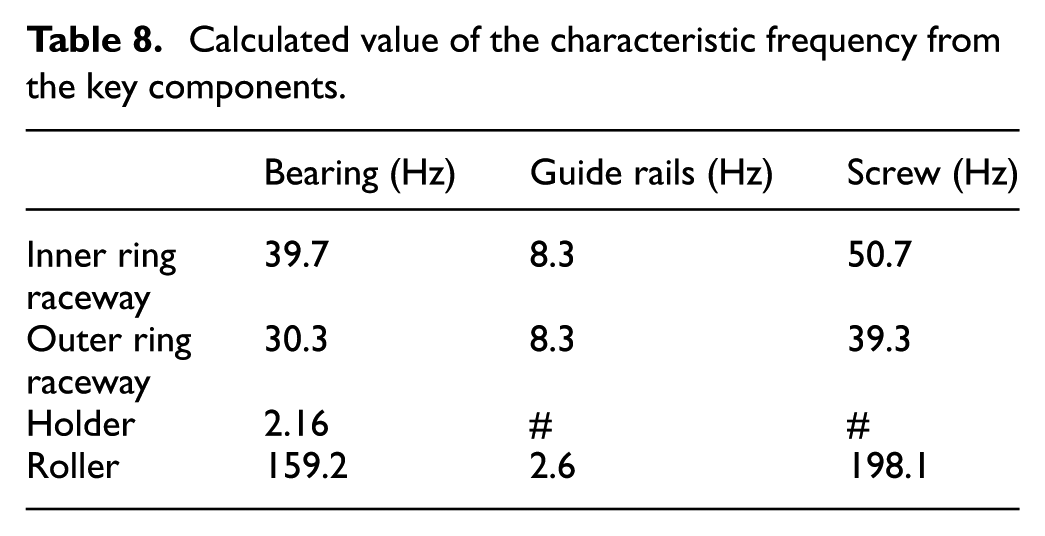
If the above research is accurate and verified, then the later vibration test needs to be installed only on the column because the column contains the vibration signals of all the key components. The specifications of the key component are shown in Tables 5–7, the calculated values of the characteristic frequency are shown in Table 8 and specific test scene is shown in Figure 9.
Specification and dimensions of the bearings.
Dimensions of the screws.
Dimensions of the guide rail sliders.
Calculated value of the characteristic frequency from the key components.
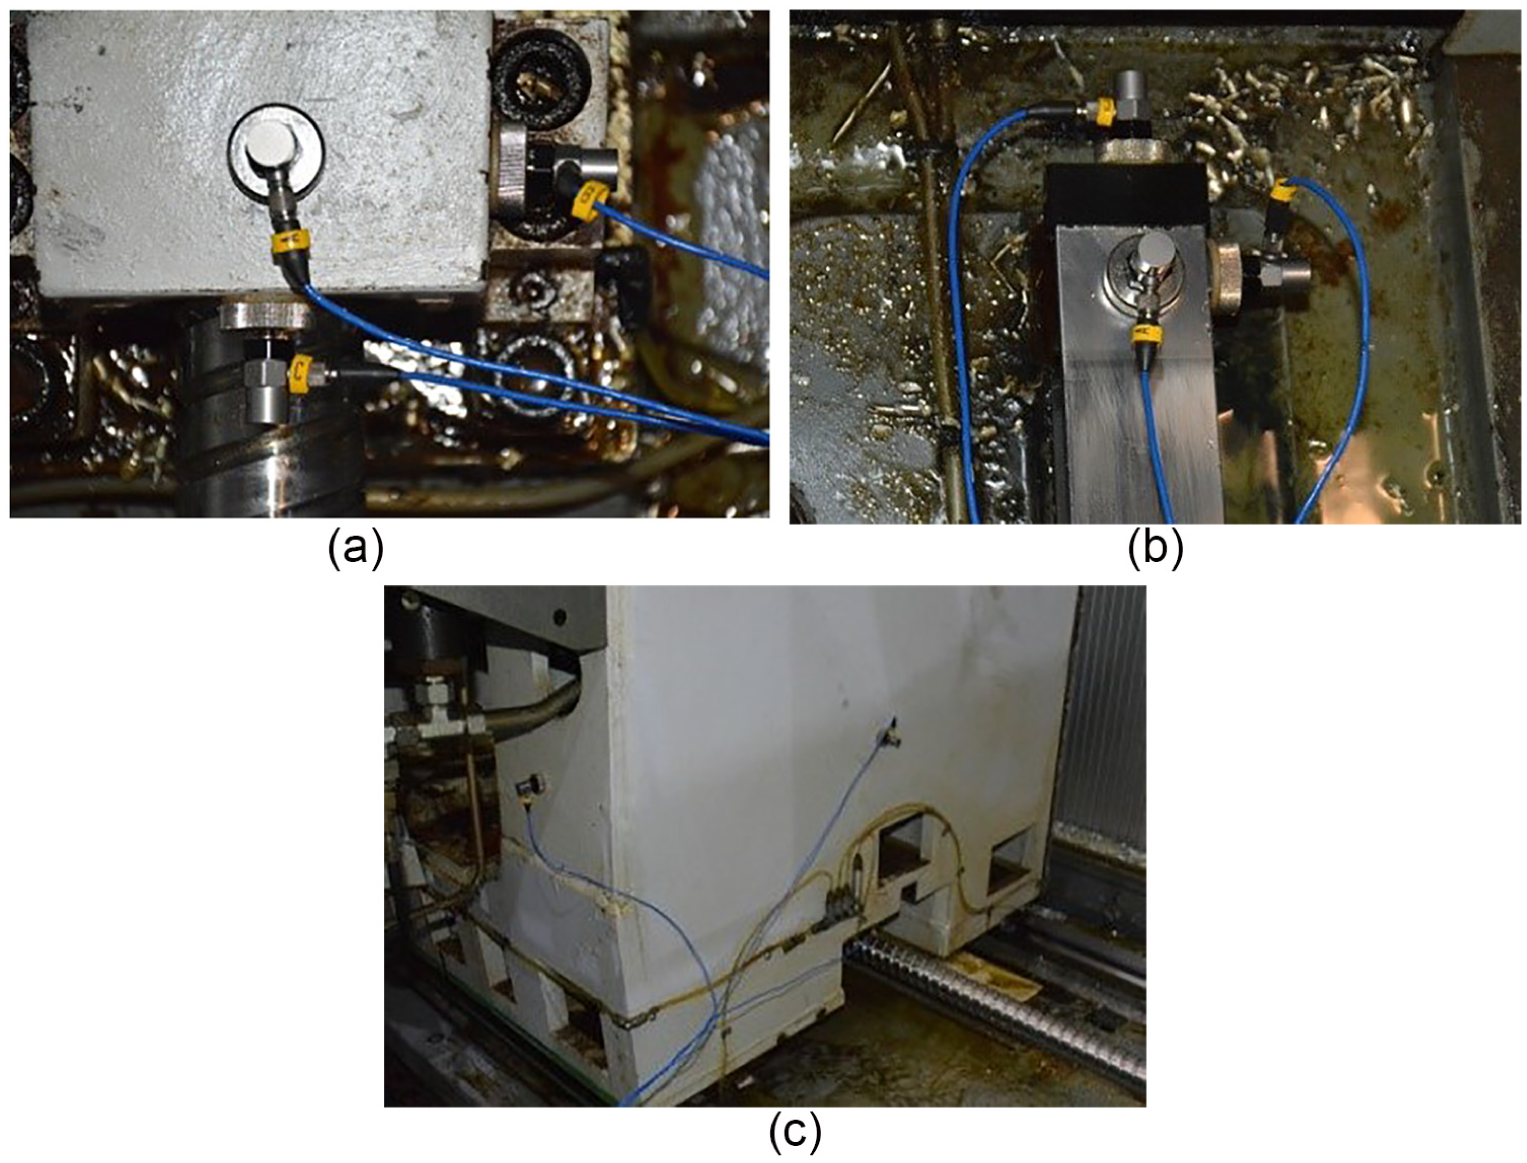
Diagrammatic sketches of the installation positions of the sensors: (a) bearing vibration test, (b) guide rail vibration test and (c) column vibration test.
Test results and analysis
The signal collected for analysis is processed through a Daubechies filter and Fourier transform. Finally, the vibration spectrum of the X-axis column, the guide rail and the bearing in the three directions is obtained. The test results are shown in Figures 10–12.
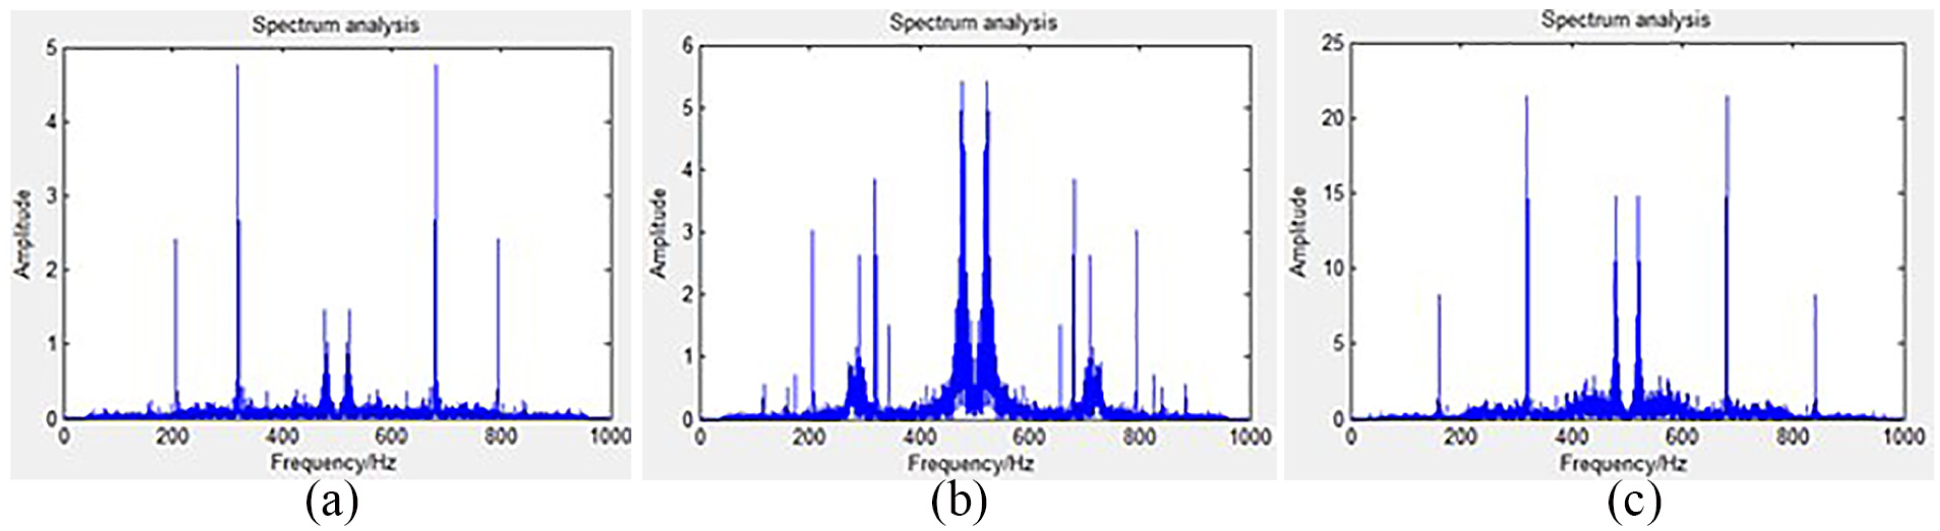
Vibrational spectra of bearing of the X-axis: (a) vertical, (b) lateral and (c) axial.
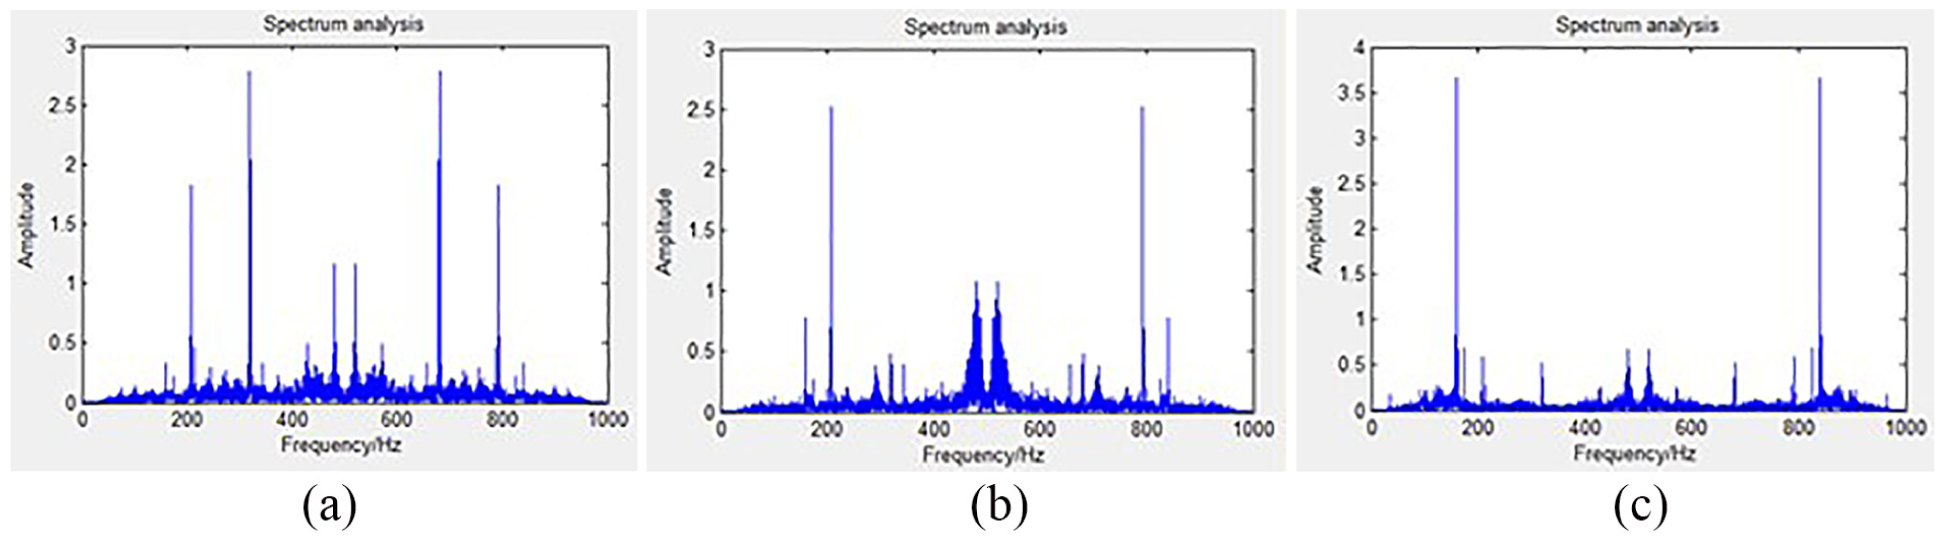
Vibrational spectra of guide rail of the X-axis: (a) vertical, (b) lateral and (c) axial.
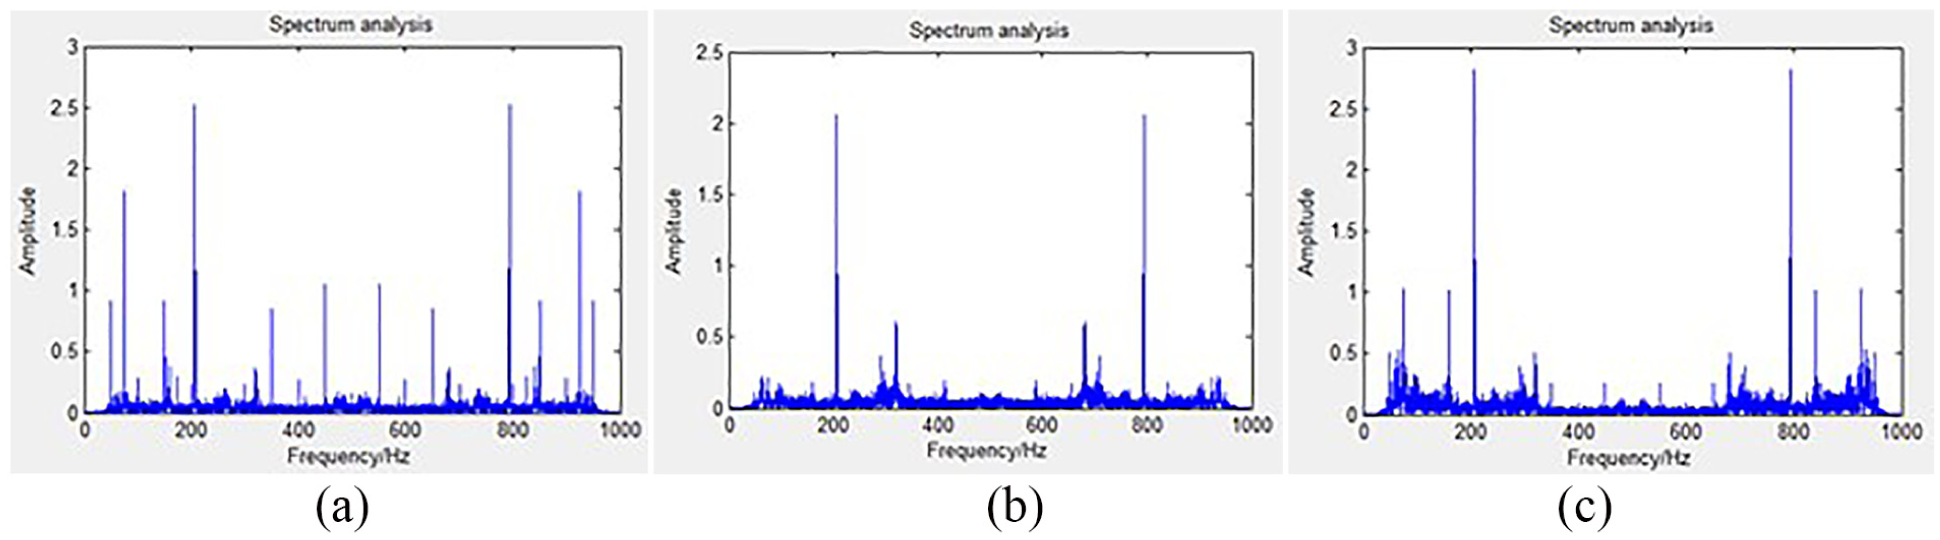
Vibrational spectra of column of the X-axis: (a) vertical, (b) lateral and (c) axial.
According to the test results as shown in Figures 10–12 and the theoretical calculation values as shown in Table 8, the vibrational spectra of the column, guide rail and bearing of the X-axis of the CNC machine tool are analysed. The analysis of the detection results in Figures 10–12 is as follows:
The amplitude of vibration signal with frequency of 160 and 320 Hz is larger in the bearing, as shown in Figure 10, than that in the guide rail and the column, as shown in Figures 11 and 12, indicating that the characteristic frequency of the bearing may be 160 and 320 Hz. Because of the damping effect of the cast iron material itself, the amplitude of these frequencies detected on the guide rail and the column is lowered. From the characteristic frequency calculation of the bearing, the calculated value of the characteristic frequency of the bearing roller is found to be approximately 160 Hz, which is consistent with the detection result, and the 320 Hz signal may be explained by frequency multiplication.
The amplitude of vibration signals of 50 and 200 Hz in the spectrum of the column as shown in Figure 12 is large, and the signal amplitude of these two frequencies is small and even undetected in the bearing and guide rail, as shown in Figures 10 and 11, indicating that the characteristic frequency of the screw may be 50 and 200 Hz. Compared with the calculation results of the frequency of the screw, the calculated values of the characteristic frequencies of the roller raceway and the roller are found to be approximately 50 and 200 Hz, respectively. The results are consistent with the test results. However, 200 Hz may also be the frequency doubling of the inner ring raceway fault frequency 50 Hz of the screw.
The characteristic frequency of the guide rail was not found in the test results. Moreover, the calculated characteristic frequency of the guide rail was found to be very low, below 10 Hz. Thus, this frequency was probably not detected.
According to the test results, there are still some high-frequency signals that may be attributable to some external interference signals.
In summary, there is a difference between the actual data being detected and the data being calculated. The actual frequency of the screw is 160 Hz, as shown in Figure 12, and the calculated frequency of the screw is 159.2 Hz, as shown in Table 8. The percentage of the difference is 0.5%. Similarly, the actual bearing frequency is 50 Hz, and the calculated bearing frequency is 50.7 Hz. The percentage of the difference is 1.4%. The slight difference above may be because the running speed is not exactly the same as planned; it does not affect the analysis of the test.
Therefore, the screw and bearing are found to be worn out. The screw and bearing are therefore replaced, and the part is cut further. The surface quality of the new part, as shown in Figure 13(a) and (b), is better than before, which is shown in Figure 7(a) and (b). The new surface roughness is measured, as shown in Figure 13(c). The roughness is Ra = 0.662 μm and Rz = 4.664 μm. The roughness is approximately 50% lower than before, which is shown in Figure 7(c).
The optimized surface of the part: (a) a smooth surface display, (b) three-dimensional display under optical instrument and (c) surface roughness measurement.
Conclusion
This article analyses the fault types of NC machine tools and defines the energy. The early-warning method of the NC machine tool based on EFTA is put forward. The main advantage is that the OPC client can monitor the energy conveniently. In addition, the whole installation method has been adopted to replace the traditional way of sensors installed on specific key components. According to the energy monitoring theory, frequency domain analysis theory and characteristic frequency calculation results, the status of each part can be accurately identified. The conclusions are as follows.
Through the OPC-based CNC machine state data monitoring system, the machine tool can be monitored by the state in real time. In addition, it can detect the abnormality of the transmission system in time. The OPC client can not only be used for real-time monitoring on the computer beside the machine but can also be configured in HMI to facilitate the use for the operators. In addition, the monitoring data can be fed back to the numerical control system to stop the machine automatically when the energy is abnormal.
Through the in-depth study of the characteristic frequency of each part of the machine tool, the corresponding calculation method can be obtained. Moreover, according to the data information collected by the sensors, the fault location of the machine tool can be accurately and quickly found. One of the important advantages of this research is the overall monitoring of CNC machine tools. Monitoring not only reduces the time for the machine tool detection. Moreover, the number of sensors has been greatly reduced, and the cost of monitoring has been reduced.
Combined with the processing parts, the wear location is diagnosed based on EFTA. This monitoring method can quickly determine the location of the fault. By replacing the worn parts, the surface roughness of the parts is increased by approximately 50%, which shows that this method has engineering applicability.
Footnotes
Declaration of conflicting interests
The author(s) declared no potential conflicts of interest with respect to the research, authorship and/or publication of this article.
Funding
The author(s) disclosed receipt of the following financial support for the research, authorship, and/or publication of this article: This work is supported by the Major Project of National Science and Technology (Grant No. 2015ZX 04001002).