
Abstract
Tool pin geometry plays an important role in the weld strength of friction stir welding process. In the current work, a thermo-mechanical model is developed to study the effect of three different pin shapes, namely, cylindrical, square and triflat, during friction stir welding process. The developed model is validated with the temperature, force and spindle torque at different welding conditions. Among the three geometries, triflat pin produced higher temperature, and strain rate. Material deposition for the square pin is stretched toward the advancing side while it is uniformly distributed for the triflat pin. Material rotates multiple times with the flat surfaced pin as compared with cylindrical pin.
Introduction
Friction stir welding (FSW) is a solid-state joining process. In this process, a non-consumable tool is used to plasticize and stir the material. Tool rotational and translational speed leads to difference in relative velocity on either sides of the workpiece. The side of the workpiece where tool rotation and translation direction is same is known as advancing side (AS) and the other side is termed as retreating side (RS) where the tool rotation and translation is in opposite direction. 1 The tool has two features: shoulder and pin. The shoulder is mainly responsible for the heat generation, while pin is responsible for the stirring of the material. 2 Tool pin geometry influences the material flow mechanism and in turn controls the formation of defects. Researchers have carried extensive experiments to evaluate the performance of different pin shapes. Zhao et al.3,4 compared among smooth, threaded cylindrical and conical pins. It was observed that threaded pin produced defect-free weld because of the occurrence of material flow in vertical direction. The material welded with threaded conical pin had slightly higher weld strength as compared with the threaded cylindrical pin. Lorrain et al. 5 studied the material flow path for the cylindrical and triflat pins. They found that the flat-surfaced pin changed the material flow generated by the tool shoulder. It also created more variation of the material velocity as compared with the cylindrical pin. Colligan 6 studied the material flow behavior for the threaded cylindrical pin for aluminum alloys. Researcher used steel balls as the tracer material. They reported that vertical movement of the material is observed due to presence of thread on the pin surface. Schneider et al. 7 used lead wire as a tracer material to study the material flow behavior during the FSW process. They used conventional radiography and three-dimensional (3D) computer tomography to study the material flow phenomenon. They reported that the material is deposited in a periodic arc-shaped segment toward the AS. Palanivel et al. 8 compared five pin profiles, namely, square, hexagonal, octagonal, tapered square and tapered octagonal. Both the tapered profiles produced defective welds, while the other three produced defect-free welds. Imam et al. 9 compared the tapered cylindrical, square and tapered square pins by varying the welding speed. Square pin produced the defect-free weld, while the other two produced defective weld. Trimble et al. 10 reported that in comparison with the cylindrical pin, square and triflute pins produced welds having higher tensile strength. Though tensile strength weld joints produced out of square and triflute pins were approximately same, higher elongation was observed for the triflute pin. Among the three, triflute pin produced the lowest welding force. Yuqing et al. 11 compared five different threaded pin profiles with different pin tips, namely, threaded taper, conical, triangular, square, and three grooves. The first two pin profiles were prone to micro-weld defects on AS, and other three produced defect-free welds. Among the triangular, square and three groove, the three-groove pin shape produced welds having higher tensile strength due to finer grain size and the optimum hardness.
Experimental investigation of pin geometry requires extensive post-weld analyses to evaluate the effectiveness of the pin. Also, experimental investigation of the material flow and heat generation for complex pin is exhaustive and difficult. This could be easily investigated using different numerical techniques such as finite element method. Researchers have used different numerical methods such as Lagrangian and Eulerian methods to study the influence of pin shapes on various output responses such as heat generation, material flow and forces. Song and Kovacevic 12 developed a 3D transient heat transfer model using moving co-ordinate technique. The workpiece is defined as the symmetric body and developed model is validated with experimentally measured temperatures. Pashazadeh et al. 13 developed a 3D thermo-mechanical model based on the Lagrangian method for the FSW of copper. Particle tracking method is used to study the material flow behavior. Based on the material flow behavior, the stir zone shape is divided into five distinct zones. Jain et al. 14 developed a 3D thermo-mechanical model using the Lagrangian method. They reported that conical pin produced lower axial force as compared with the cylindrical pin. The model was extended to compare the conical pin with threaded conical pin. Threaded pin produced vertical flow of the material and higher deformation as compared to the conical pin. 15 Trimble et al. 16 compared the cylindrical pin with the threaded cylindrical pin. They reported lower forces and higher weld strength in case of the threaded cylindrical pin. Buffa et al. 17 evaluated the performance of the conical pin having different taper angles. They reported that for taper angle above 30°, there is a negligible change in the peak temperature and deformation of the material. Mohanty et al. 18 developed a model using Eulerian method to compare the cylindrical pin with the conical pin. They assumed slip rate (ratio of material velocity with the tool velocity) as 0.6. It was found that conical pin produced higher temperature as compared with cylindrical pin. Also, higher material velocity was reported for the former as compared with the latter. Zinati and Razfar 19 have developed viscoplastic model to perform the modeling for FSW of polyamide 6. They reported that the material shearing in AS is higher than the RS. Saeidi et al. 20 performed the FSW of AA5083 with AA7075 aluminum alloys. They developed a mathematical relation between input process parameter with ultimate tensile strength. The developed equation was optimized to maximize the ultimate tensile strength. Yaduwanshi et al. 21 developed a 3D transient heat transfer model to simulate FSW process. Heat generation due to plastic deformation was incorporated in the heat source term. The model was validated with the experimentally measured temperature. The maximum error between the model predicted results and experimentally observed result is 5.5%.
Most of the researchers have considered simpler pin shape such as cylindrical and tapered pin. Experimental study suggests that flat-surfaced pin produced better weld joints as compared with smooth surface pins,22,23 but underlying mechanism resulting for good welds is not studied in detail. Also, a comparative study on the influence of different pin surface on heat generation, material deformation and material flow is yet to be investigated in detail. Therefore, in the current research work, a numerical model using Lagrangian method is developed to compare cylindrical, square and triflat pin shapes. The developed model is validated with the experimentally observed temperature, axial force and spindle torque. Furthermore, the model is used to compare the three pin shapes based on temperature distribution, strain rate, material flow and material velocity.
Experimental details
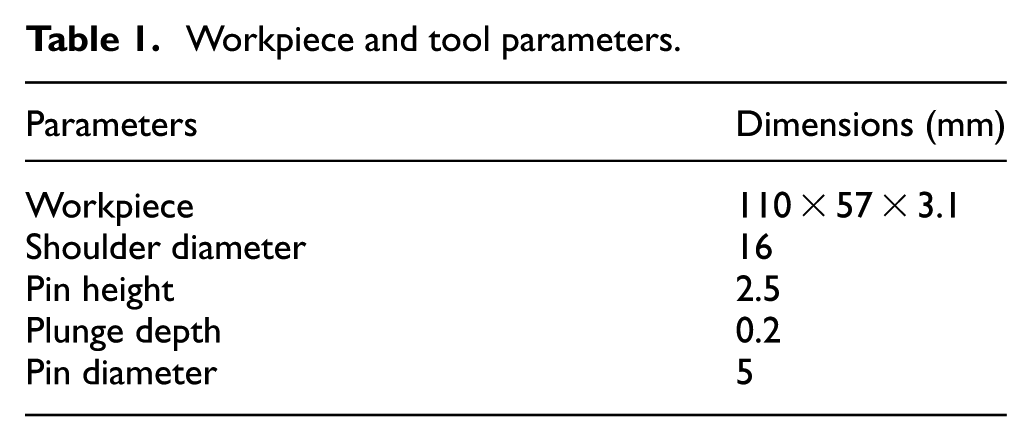
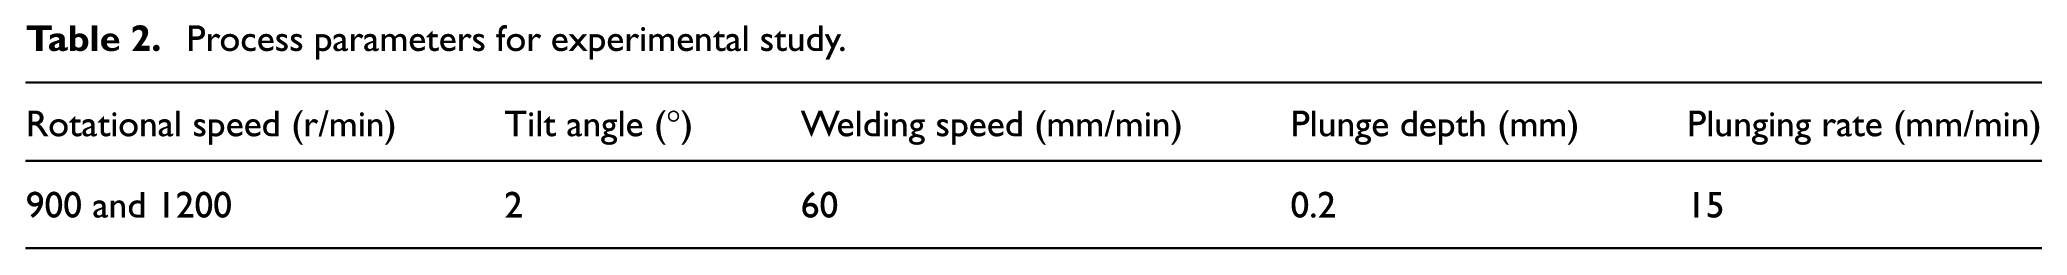
The experimental investigation involves FSW of 3.1-mm thick sheet of AA6061 T6. The workpiece is cut from rolled sheet to achieve dimensions of 110 and 57 mm in length and width, respectively, for each piece. H13 steel is used as the tool material with the cylindrical shape pin. The dimensions of the tool are given in Table 1. All the experiments are carried out in 20-kN computer numerical control (CNC) linear FSW machine (WS004; ETA, Bengaluru). The process parameters selected for the current research work are mentioned in Table 2. Authors’ previous publication showed that tilt angle of 2° provided the defect-free weld and rotational speed of 900 and 1200 r/min resulted in highest weld strength of 243 and 211 MPa, respectively. Further increase in rotational speed resulted in lower weld strength due to loss of traction between the tool and the workpiece. 24
Workpiece and tool parameters.
Process parameters for experimental study.
The experimental setup is shown in Figure 1(a) and (b). Two K-type thermocouples (TC) of 0.5 mm wire diameter each are used to measure the temperature evolution during the process. In the current work, 8-channel NI 9211 data acquisition card (DAQ) supplied by National Instrument (NI) is used. It directly provides the temperature data as an output by connecting through LabVIEW software in a computer. Data are captured continuously with a sampling rate of 1:10, that is, DAQ will acquire data at an interval of 0.1 s. The thermocouples are embedded 1 mm away from the tool shoulder circumference, and at a depth of 1.5 mm from the top surface. Schematic illustration of the location of the thermocouples and other experimental details are shown in Figure 2.
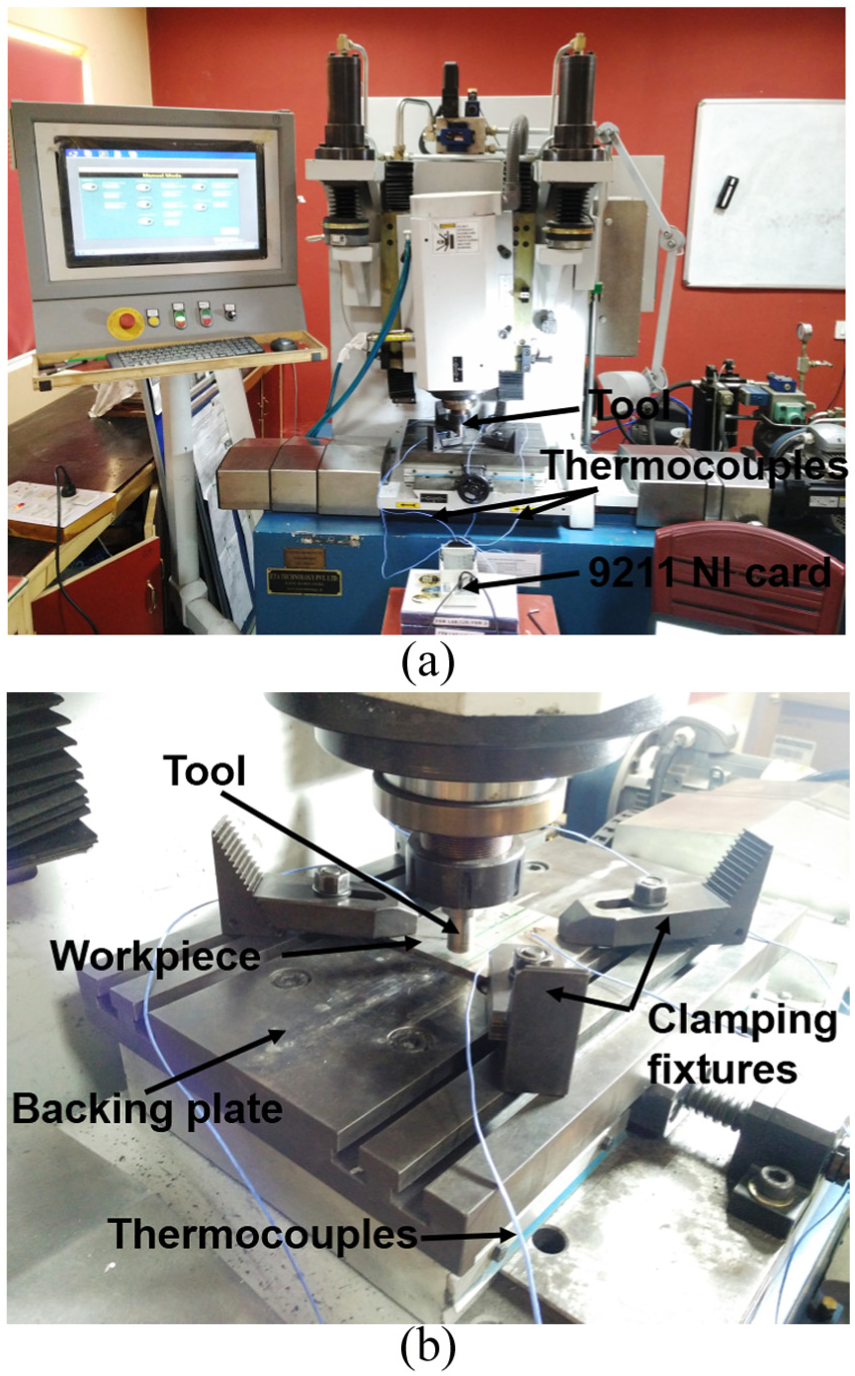
(a) Experimental setup for FSW experiment and (b) fixtures and thermocouples for experiment.
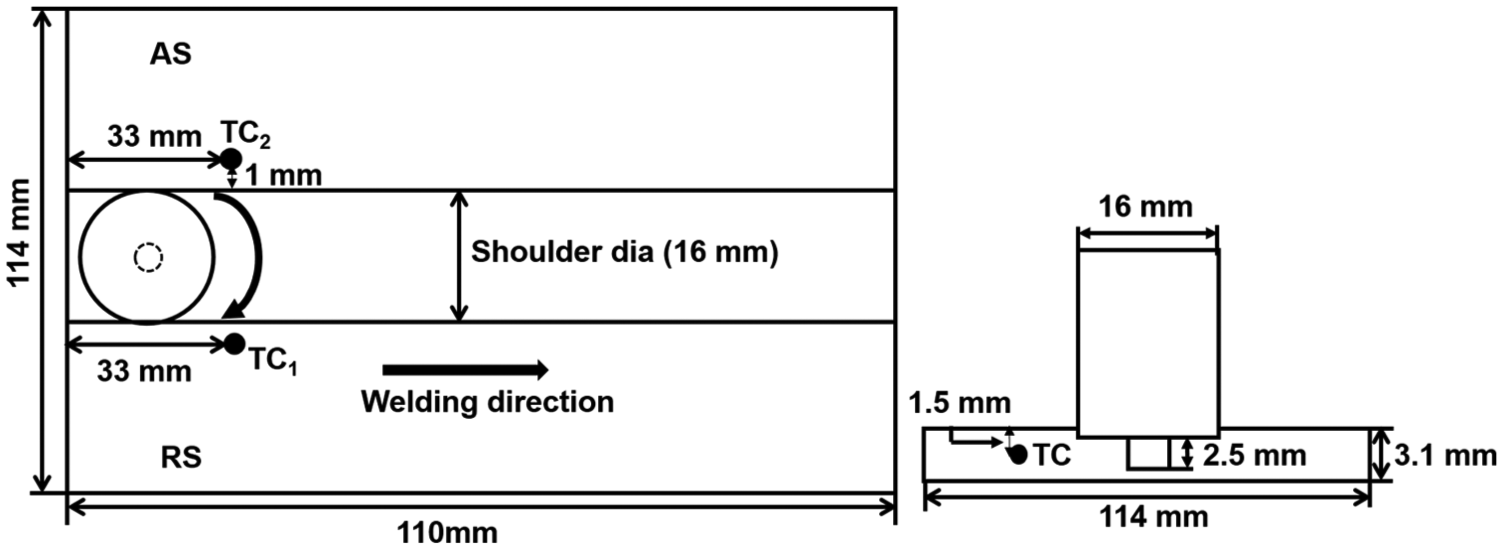
Schematic illustration of experimental setup and thermocouple (TC) location indicated by TC1 and TC2.
Inbuilt strain gauge–type load cell is used to measure the forces and spindle torque. Maximum capacity of the load cell is 20 kN. The data (forces and torque) are captured through the LabVIEW software and stored in the Excel files. Forces and torque data were acquired at an interval of 0.1 s.
Simulation details
Two-way coupled thermo-mechanical model using Lagrangian method is developed for the current analysis in DEFORM 3D v11. Mesh distortion is inevitable with this method; therefore, adaptive re-meshing is defined. Various assumptions undertaken during the development of the model are listed below:
Metallurgical aspect of the welding is not considered;
Mechanical properties and shear factor are defined as constant;
Backing plate and tool are defined as rigid bodies.
Geometric and material model
The workpiece and tool dimensions, and materials for simulation are in line with the experiments. The workpiece is defined as a rigid viscoplastic material. 25 Backing plate is defined as a rigid body with length and width of 150 and 150 mm, respectively. Its thickness is considered as 12 mm. The tool is tilted by 2° toward the negative Y-direction, as shown in Figure 3. AA6061 T6 sheet is defined as the workpiece material.
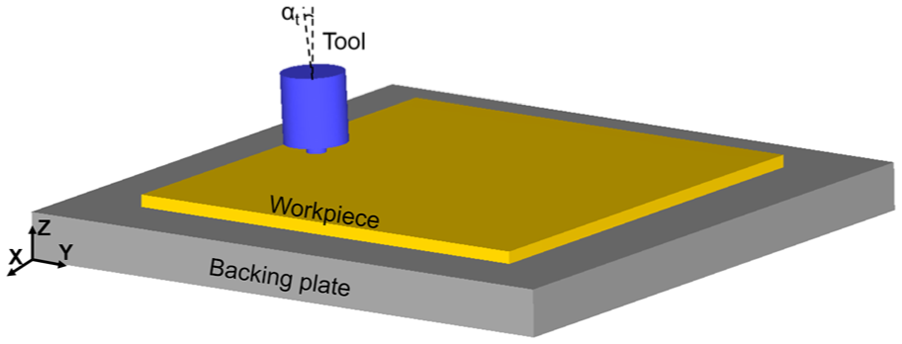
Assembly of the parts at the start of the simulation.
Sheppard and Wright’s 26 material model defines the flow stress as a function of temperature and strain rate as expressed in equation (1). This is best suited for the FSW process because material beneath the tool attains the viscous state and strain rate becomes the dominant factor instead of effective strain
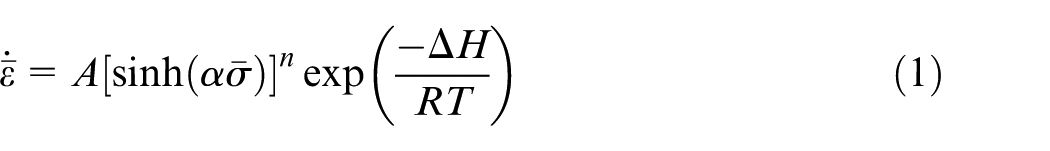
where
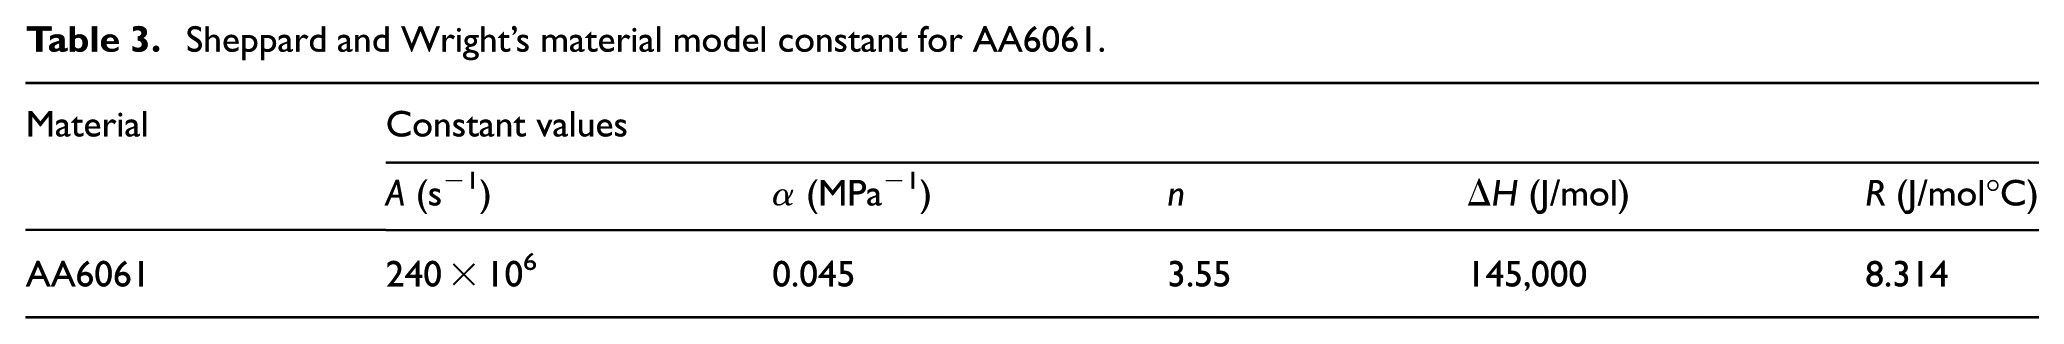
Sheppard and Wright’s material model constant for AA6061.
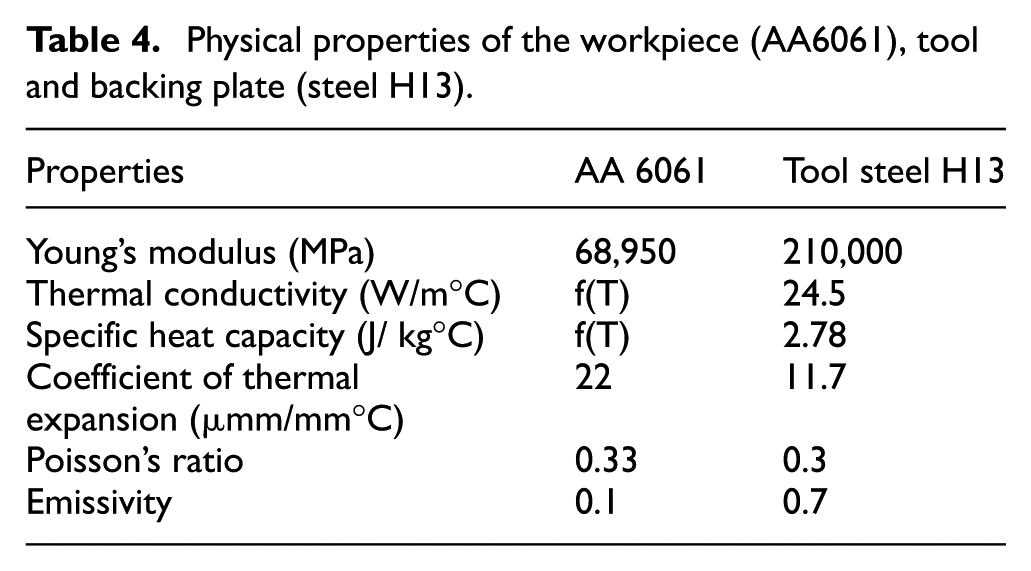
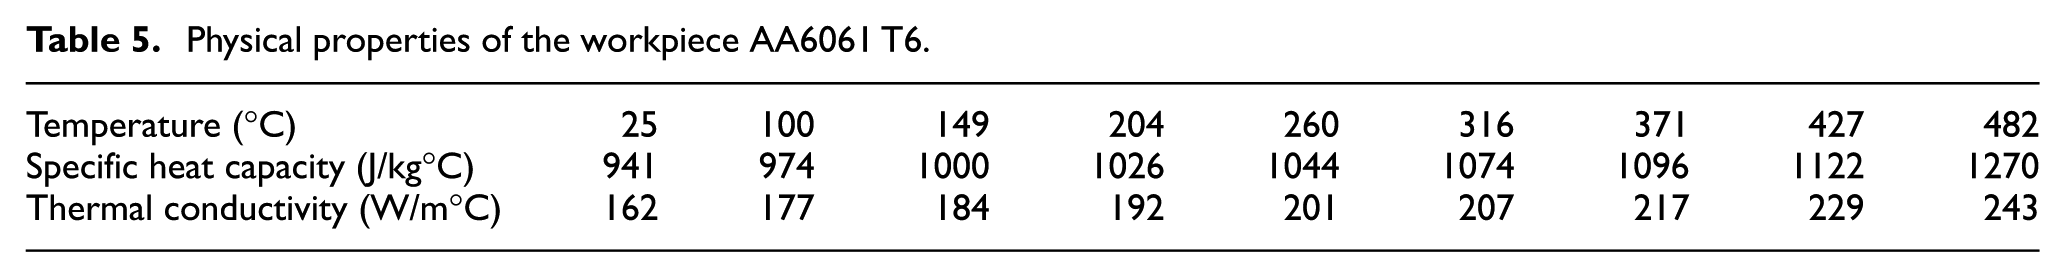
Various mechanical and physical properties of the workpiece and tool material are given in Table 4. 28 Thermal conductivity and specific heat capacity are defined as a function of temperature and are given in Table 5.29,30 Variation in the density for the temperature range of FSW is merely 3.5%. Hence, it is defined as a constant value of 2700 kg/m3.
Physical properties of the workpiece (AA6061), tool and backing plate (steel H13).
Physical properties of the workpiece AA6061 T6.
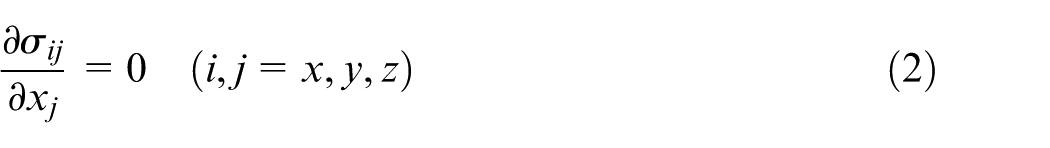
Governing equations are the mathematical relation that defines the change in dependent variables. Equilibrium equations, yield criterion and strain rate ratios from the flow rule form the fundamental governing equation for the current viscoplastic analysis.
Equilibrium equation
Yield criterion
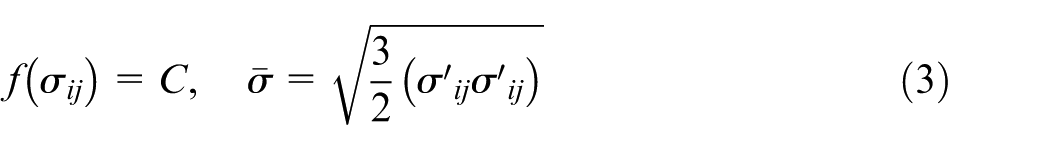
Constitutive equation
Compatibility conditions
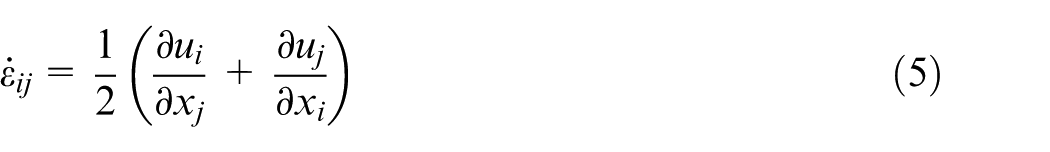
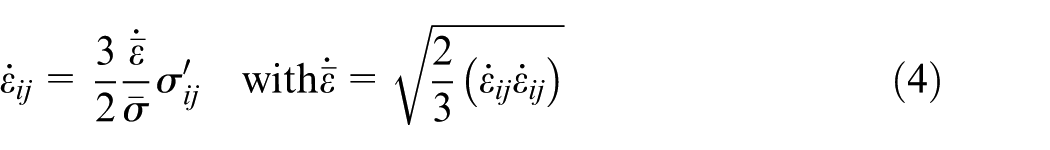
Flow rule
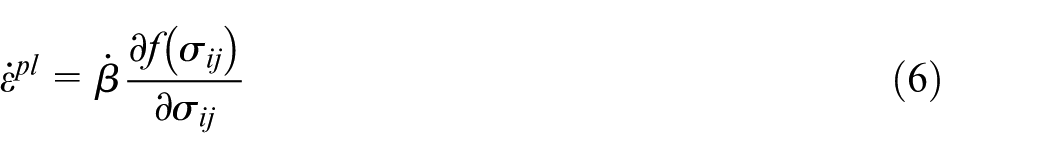
where,
Contact and boundary conditions
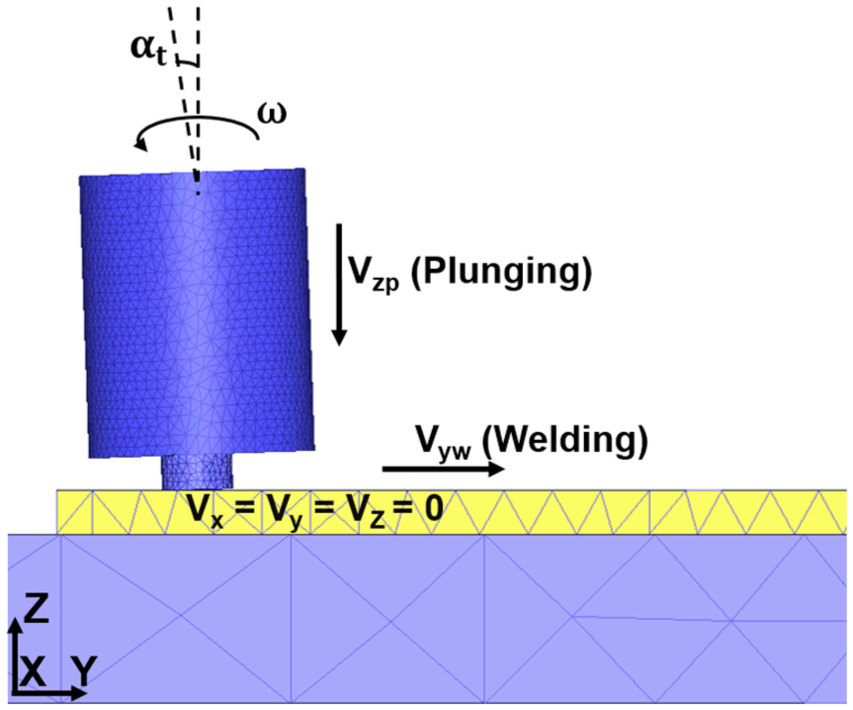
Shear friction law having a value of 0.4 14 is used to define the tangential contact stress between the workpiece–tool pair. Frictional interaction between the backing plate–workpiece 14 pair is defined with Coulomb’s law of friction with a coefficient friction of 0.2.31,33 In both the cases, the workpiece is defined as the slave object and tool, and backing plate is defined as the master surface. To constrain the rigid rotation of the workpiece, the side faces (along the width direction only) are constrained in all directions, that is, Vx = Vy = Vz = 0 as shown in Figure 4. Rotational speed is defined on the tool for all the phases of FSW process. During plunging, phase tool moves in negative Z-direction with a plunging velocity (Vzp = 15 mm/min) and for welding tool moves in positive Y-direction with welding velocity (Vyw = 60 mm/min) as shown in Figure 4.
Various mechanical boundary conditions defined on the workpiece and tool.
Initial temperature of the workpiece, tool and backing plate is set at 28°C. Backing plate is considered in the current research work. Therefore, convective heat transfer between the workpiece and backing plate is defined as expressed in equation (7)
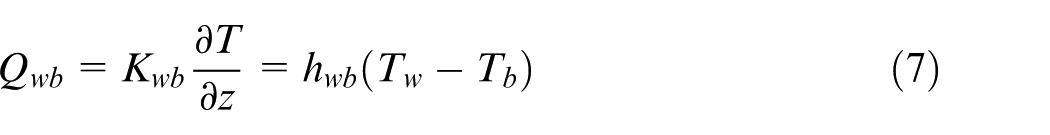
where
Mesh generation
In this analysis, coupled tetrahedral elements have been defined to discretize the workpiece. Meshed assembly of the model is shown in Figure 5.
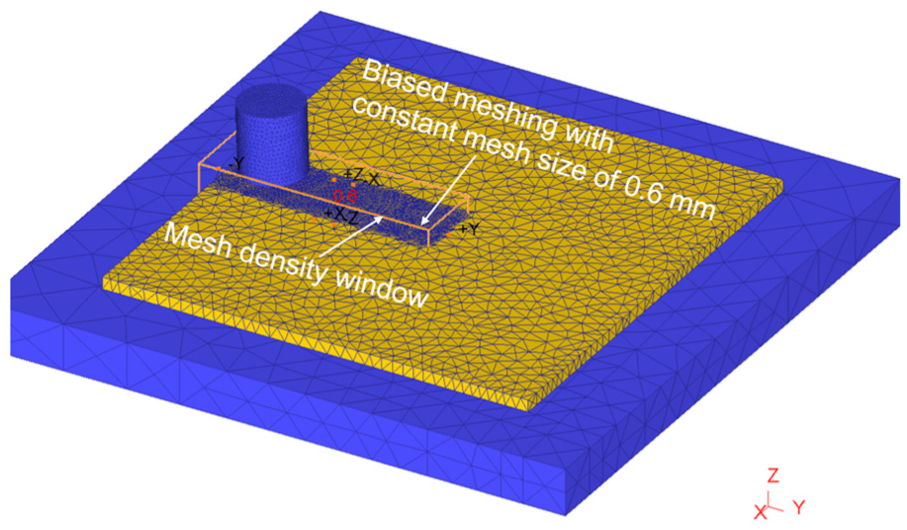
Meshed assembly of the model.
Mesh density window is used to define a mesh size of 0.6 mm at the interaction zone of the workpiece–tool pair to capture the output responses accurately as shown in Figure 5. Mesh size of 0.6 mm is selected based on the mesh refinement analysis. The rest of the workpiece domain is meshed with a minimum element size of 2.25 mm with a size ratio of 2. The workpiece is meshed with a total of 74,027 elements. The tool is meshed with 18,343 elements. Minimum element size on the tool is 0.5 mm with a size ratio of 2. The backing plate is meshed with 2646 elements with a minimum element size of 6 mm and size ratio of 2.
Results and discussion
Evolution of contact between workpiece and tool
Contact between the tool and workpiece is crucial as it determines the heat generation in FSW. Generation of contact between the tool and workpiece during plunging phase is shown in Figure 6. Initially, the tool bottom surface is placed on the top surface of workpiece to have some initial contact as shown at time t = 0 s. As the tool impinges into the workpiece, the contact area increases because the pin surface area comes in contact with the workpiece surface (t = 2.1 s). Further plunging of the tool leads to the extrusion of the material around the pin in upward direction (t = 5 s). This continues till the shoulder makes contact with the workpiece top surface (t = 10.8 s). The contact of the tool shoulder compresses the material beneath it till the plunging phase ends (t = 12 s). Similar behavior during the plunging is also reported in the literature. 36 This shows that the model has correctly predicted the material flow during the plunging phase of FSW.
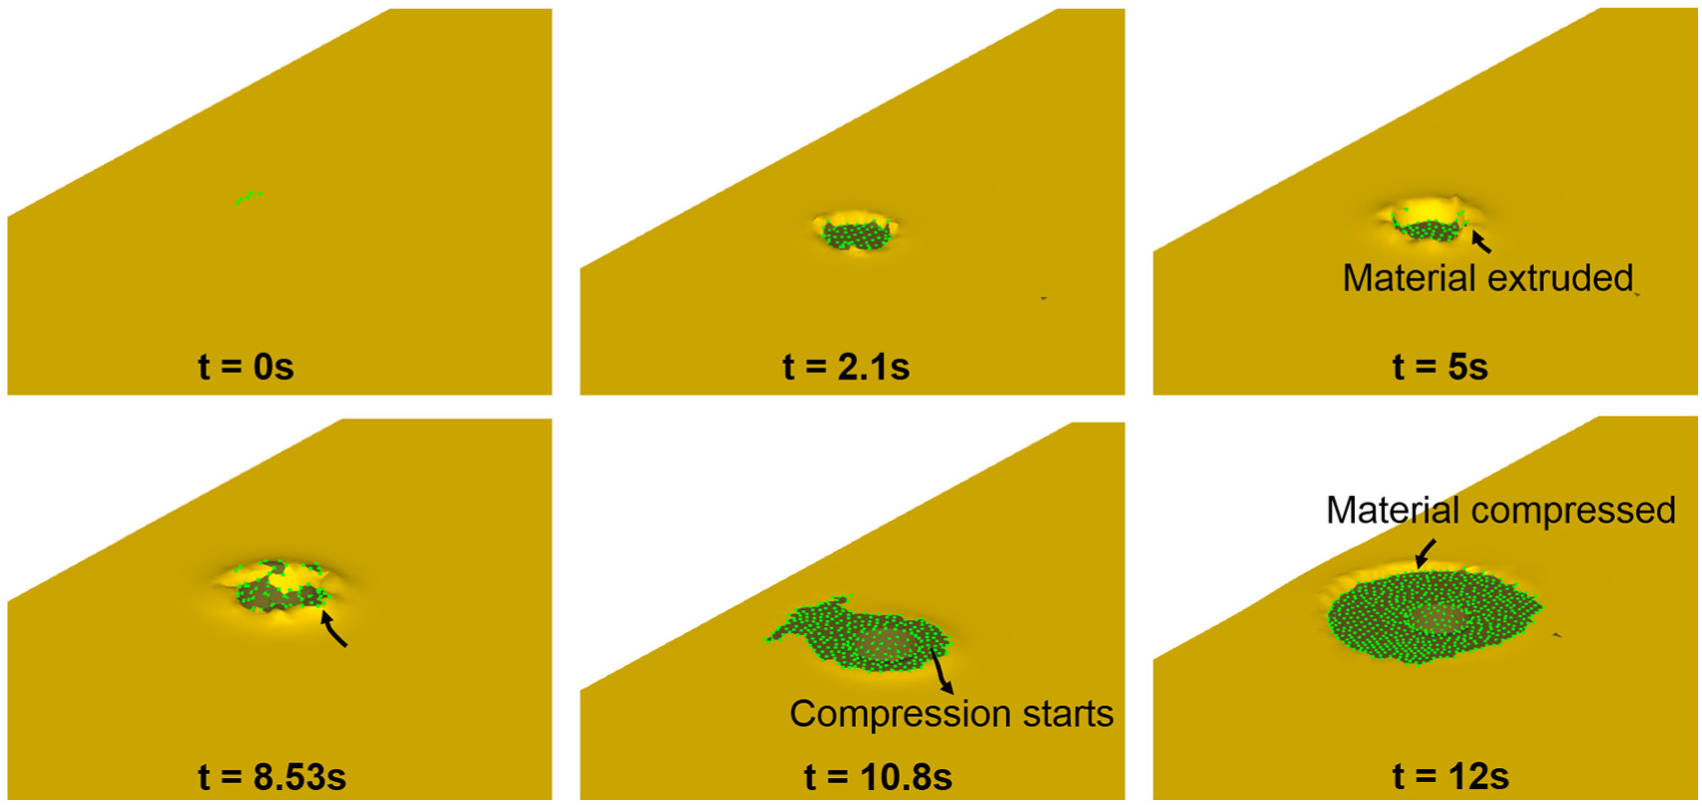
Variation in contact between the tool and workpiece during plunging.
Temperature distribution
Temperature evolution during different phases of FSW is shown in Figure 7. Total duration of plunging, dwelling and welding is 12, 3 and 30 s, respectively. During the plunging phase, temperature increases monotonically due to the increase in contact between the tool and the workpiece. At the end of plunging (t = 12 s), temperature beneath the tool is in the range of 402°C–455°C. Maximum temperature beneath the tool shoulder is 0.7 to 0.8 times the melting point of the material.
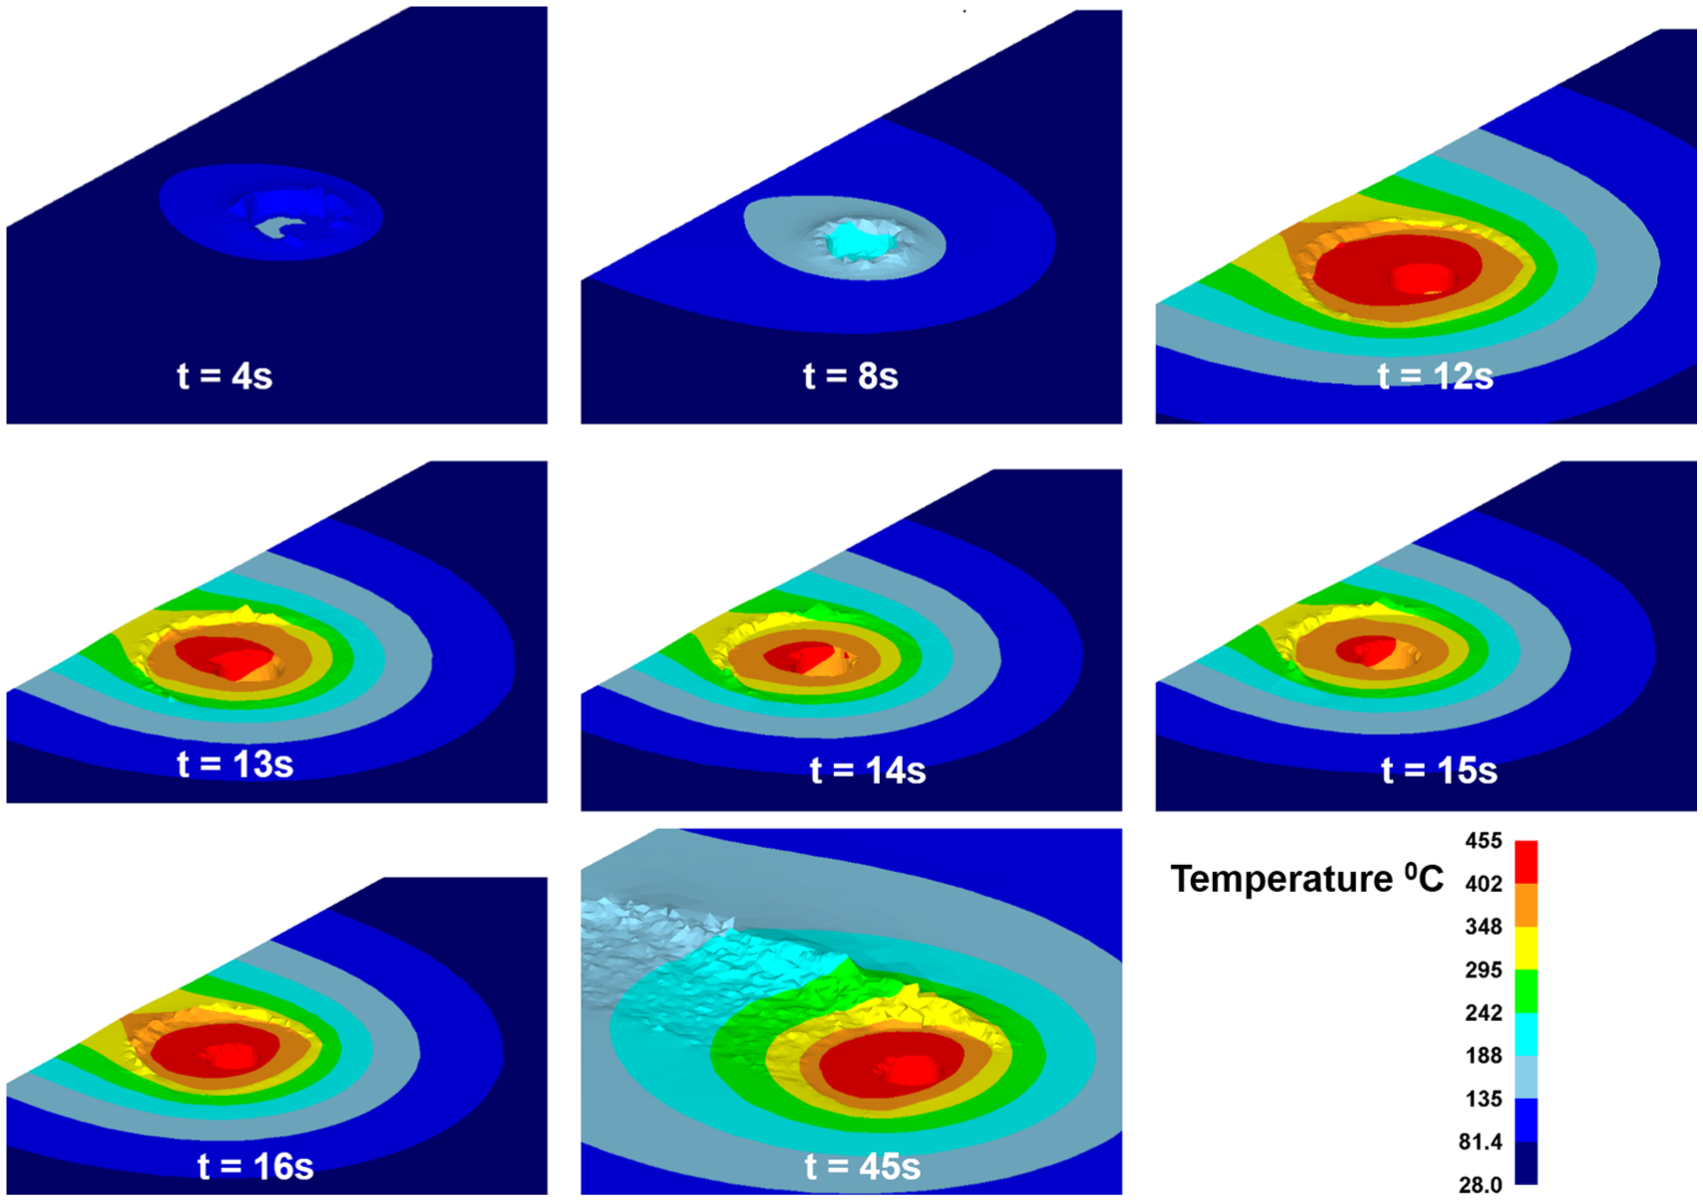
Temperature evolution during each phase of FSW.
During the dwelling phase, a drop in the temperature is observed. The temperature of 455°C at the end of plunging reduces to 415°C–420°C during the dwelling phase (t = 13–15 s). The temperature drop is also evident in the experimentally measured temperature value shown in Figure 9. It becomes more prominent for the higher rotational speed of 1200 r/min. The temperature drop is primarily because AA6061 has a moderate strength. At 455°C, the flow stress reduces to 55 MPa based on the defined Zener–Hollomon equation. This lower flow stress reduces the heat generation rate, making the heat dissipation more prominent than the heat generation.
Finally, as the welding starts, heat generation again becomes more prominent. This is because the tool travels through the colder material ahead of the tool. The peak temperature again reaches close to 455°C (t = 16 s). During the welding phase, fluctuation in peak temperature is approximately zero (t = 45 s) as shown in Figure 8. This confirms that the welding phase of FSW is a steady-state phenomenon.
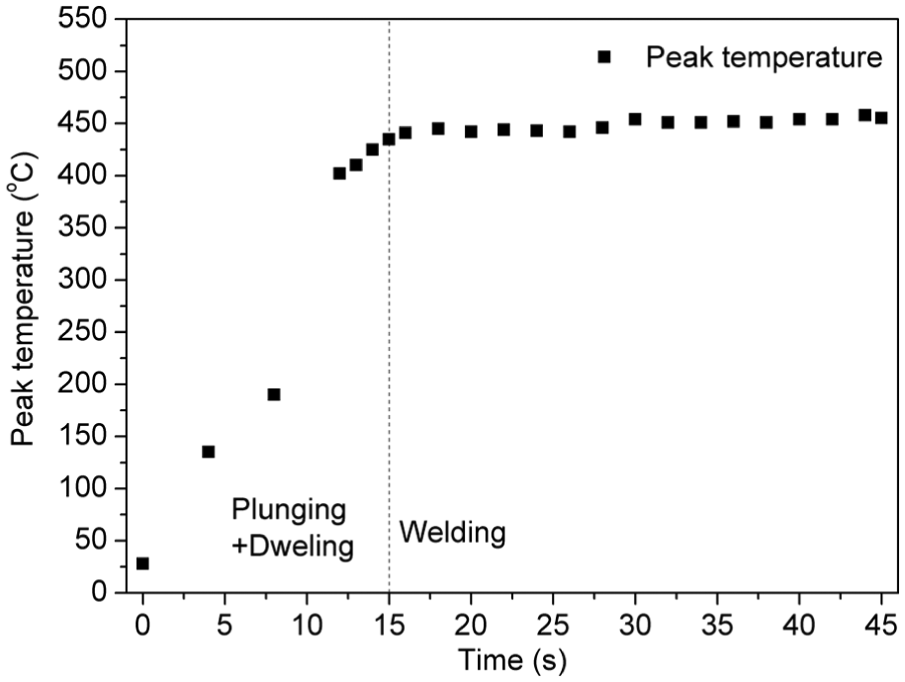
Evolution of peak temperature with time during the friction stir welding process.
Model validation with temperature
Predicted temperature is compared with the experimental observation at two different rotational speeds of 1200 and 900 r/min at a constant welding speed of 60 mm/min as shown in Figure 9. For all the cases, the simulation has been able to accurately predict the trend as well as the peak temperature. The maximum percentage error is within an acceptable limit of 7% for 900 r/min for thermocouple in AS, while for RS, the percentage error is 3%. In case of 1200 r/min, error is close to 1%. Simulation has also correctly predicted the influence of rotational speed on the temperature as both are directly proportional to each other. Experiment shows that increase in rotational speed from 900 to 1200 r/min has increased the temperature by 75°C. Simulation-predicted temperature difference for the same range is 74°C.
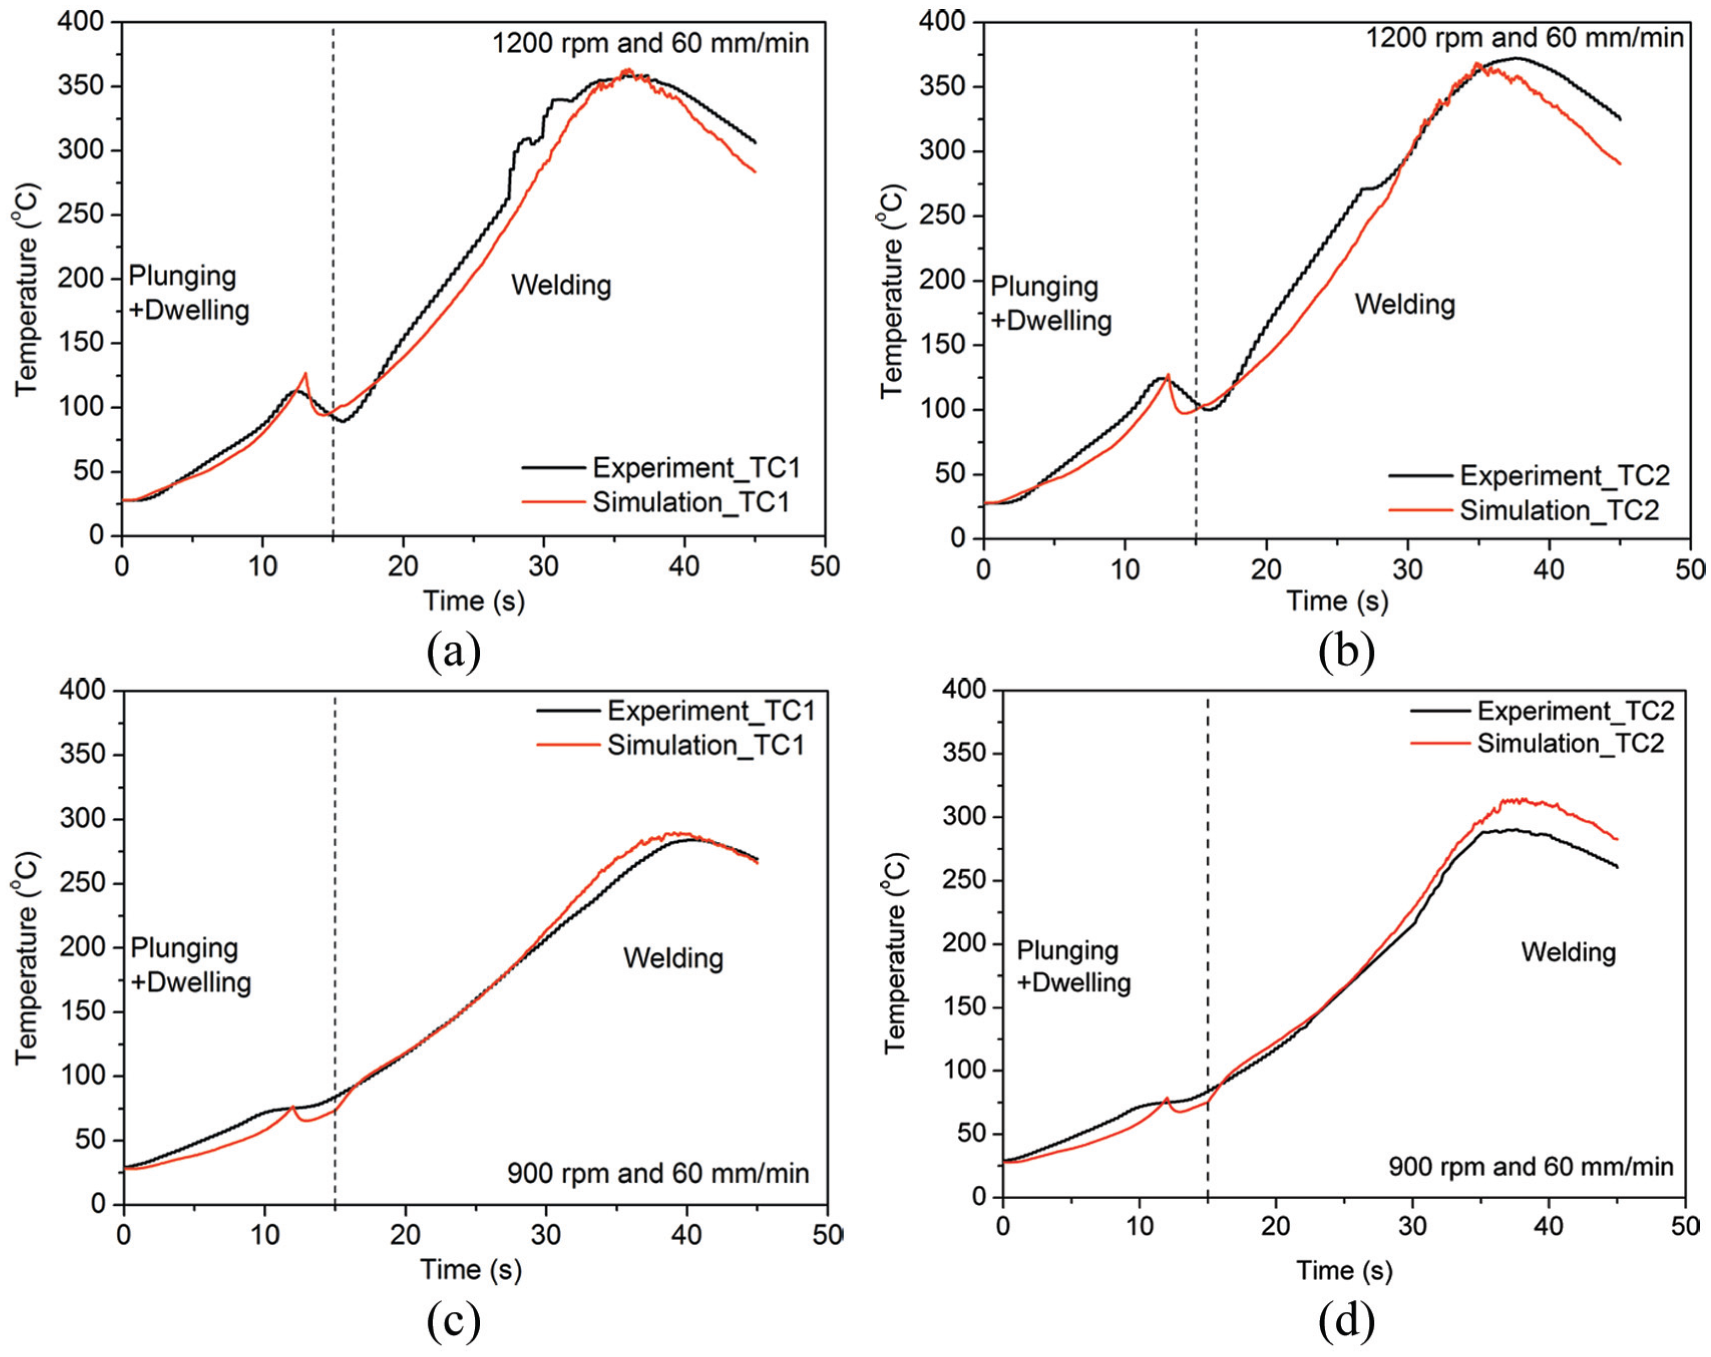
Comparison of simulation-predicted temperature with experiment at a welding speed of 60 mm/min: (a) 1200 r/min, RS; (b) 1200 r/min, AS; (c) 900 r/min, RS; and (d) 900 r/min, AS.
Validation with axial force and torque
Complete validation of the developed model is possible when all the output responses are compared. This has been achieved by comparing the average axial force and spindle torque during the welding phase for the simulation and experiment. The comparison is shown in Table 6. Experimentally observed average axial force for 900 and 1200 r/min is 4.54 and 4.02 kN, respectively, while the simulation has predicted 4.9 and 4.04 kN, respectively. In both the cases, simulation has predicted the results within the acceptable limit of 8% and 0.5%, respectively.
Comparison of simulation predicted axial force and spindle torque with experimental values.
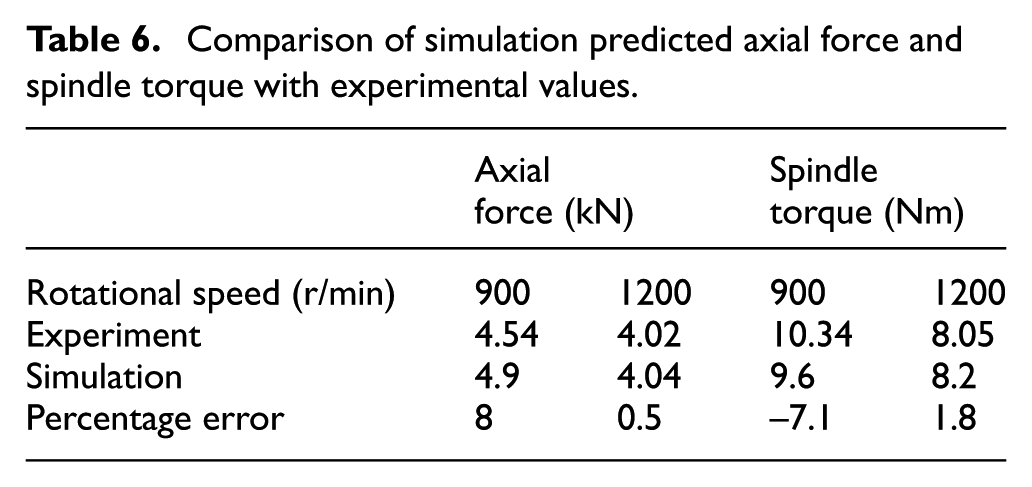
Similarly, experimentally observed average spindle torque for 900 and 1200 r/min is 10.34 and 8.05 Nm, respectively, while the simulation has predicted 9.6 and 8.2 Nm, respectively. Percentage error for rotational speeds of 900 and 1200 r/min is −7.1% and 1.8%, respectively. In all the cases, simulation has predicted the results within an error of 10%. Hence, it can be concluded that the developed model could be used for predicting the results for other parameters.
Comparison of pin shapes
The validated model is extended to compare three different pin profiles, namely, cylindrical, square and triflat. The dimensions of the pin are selected such that they occupy the same volume in the dynamic condition, as shown in Figure 10.
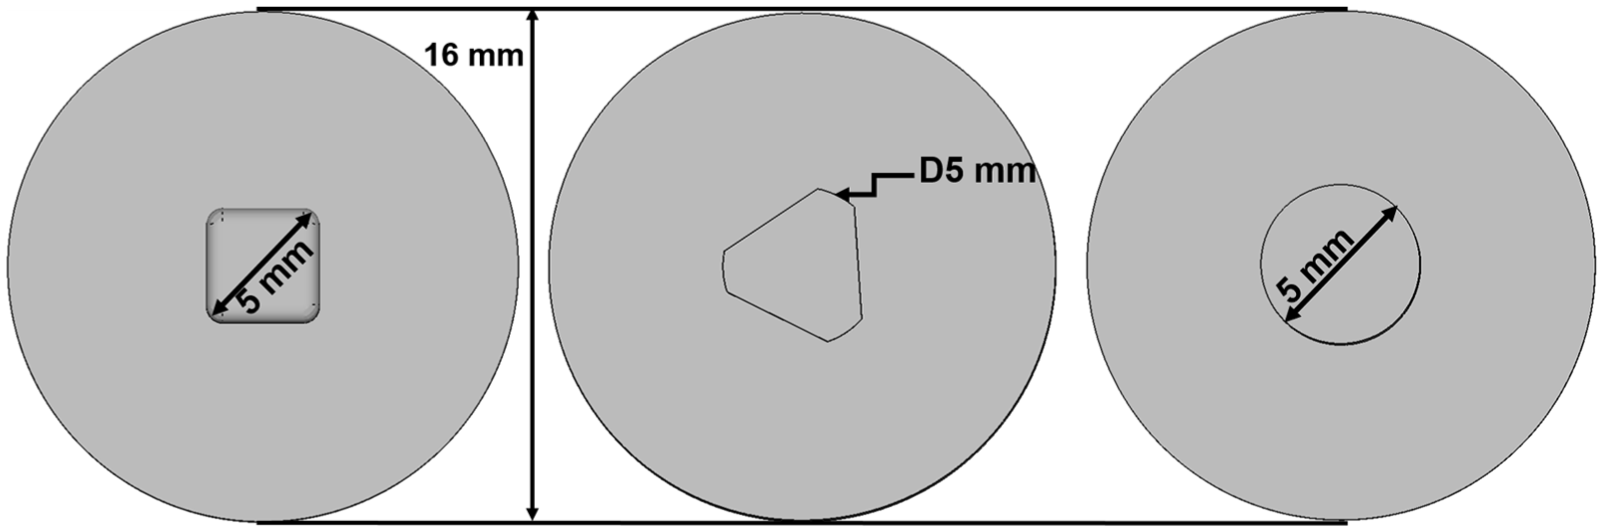
Tool pin profile: (a) square, (b) triflat and (c) cylindrical.
Temperature and effective strain distribution
Comparison of the temperature for different pin shapes is shown in Figure 11(a) and (b). Contour plot of temperature distribution shows that the maximum temperature is generated by the triflat pin, while least is generated by the square pin. Heat generation during FSW has contribution from friction and plastic deformation. Among the three pin shapes, cylindrical and square pins offer the maximum and minimum contact area, respectively. Also, the highest and lowest deformations are produced by triflat and cylindrical pin, respectively. Therefore, triflat pin produces the highest temperature. Figure 11(b) shows the measurement of temperature at three horizontal planes in thickness direction at z = 2.7, 1.5 and 0.1 mm, that is, top, middle and bottom plane, respectively. Triflat pin produces the maximum peak temperature followed by the cylindrical and square pins. Peak temperatures produced by triflat, cylindrical and square pins are 502°C, 445°C and 405°C, respectively. The tool shoulder is the primary source of the heat generation and is same for the three cases; therefore, temperature difference among the three pin shapes is not too high and is approximately 50°C. For all the three cases, thermal gradient exists just below the tool and vanishes away from it. This is because of the fact that the tool is the source of heat generation which is then conducted to other regions. Height of the temperature dome (difference between maximum and minimum temperature) is 264°C, 226°C and 208°C for triflat, cylindrical and square pins, respectively. Higher temperature gradient leads to higher residual stress. FSW is an asymmetric process with difference in relative velocity on either sides of the workpiece. Positive relative velocity on AS leads to higher heat generation and deformation, which in-turn results in higher temperature and strain on AS as compared with RS. Temperature on AS is higher for all the three cases, though difference in temperature between AS and RS is not same. Cylindrical pin produced temperature variation of 10°C, while for the triflat and square pins, it is close to 6°C.
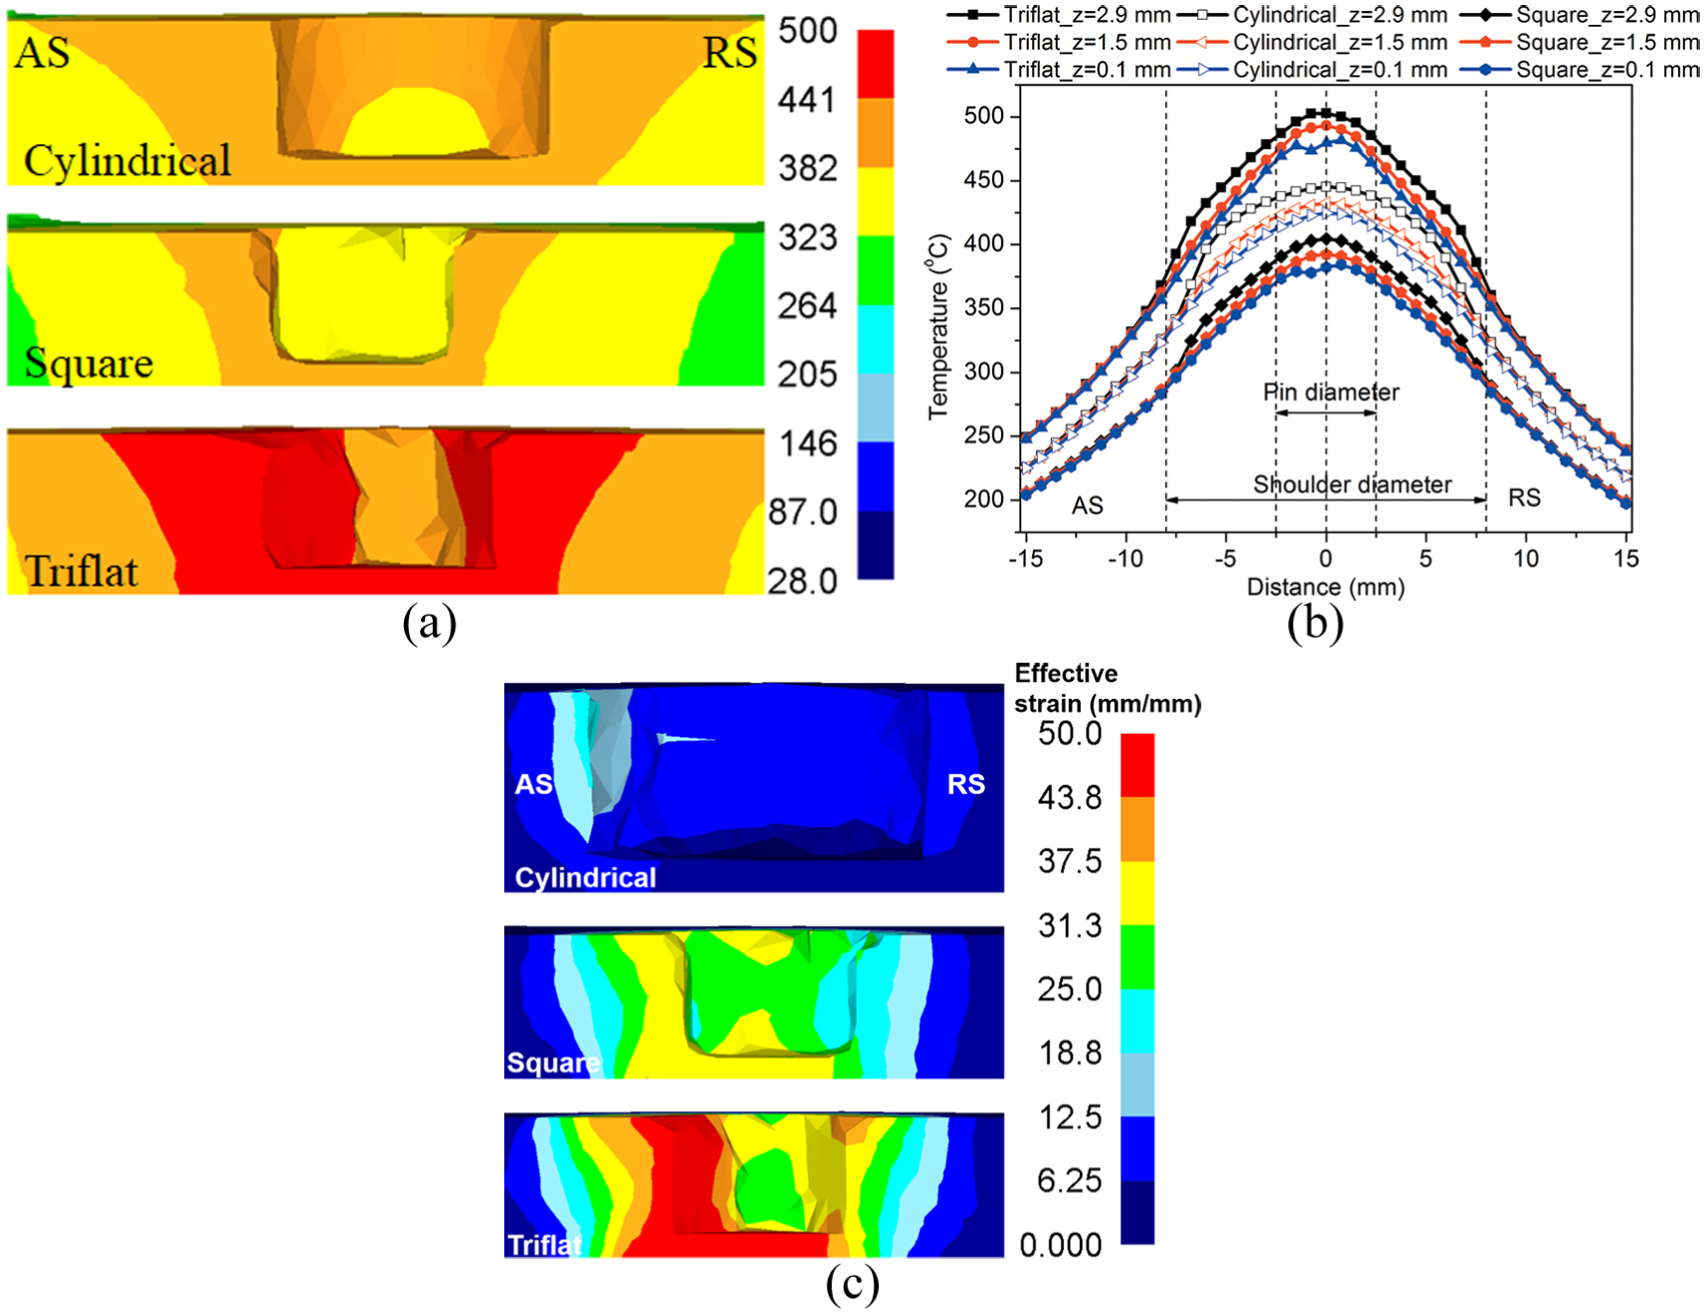
Influence of pin shape on (a) temperature distribution, (b) temperature distribution along the transverse direction and (c) effective strain.
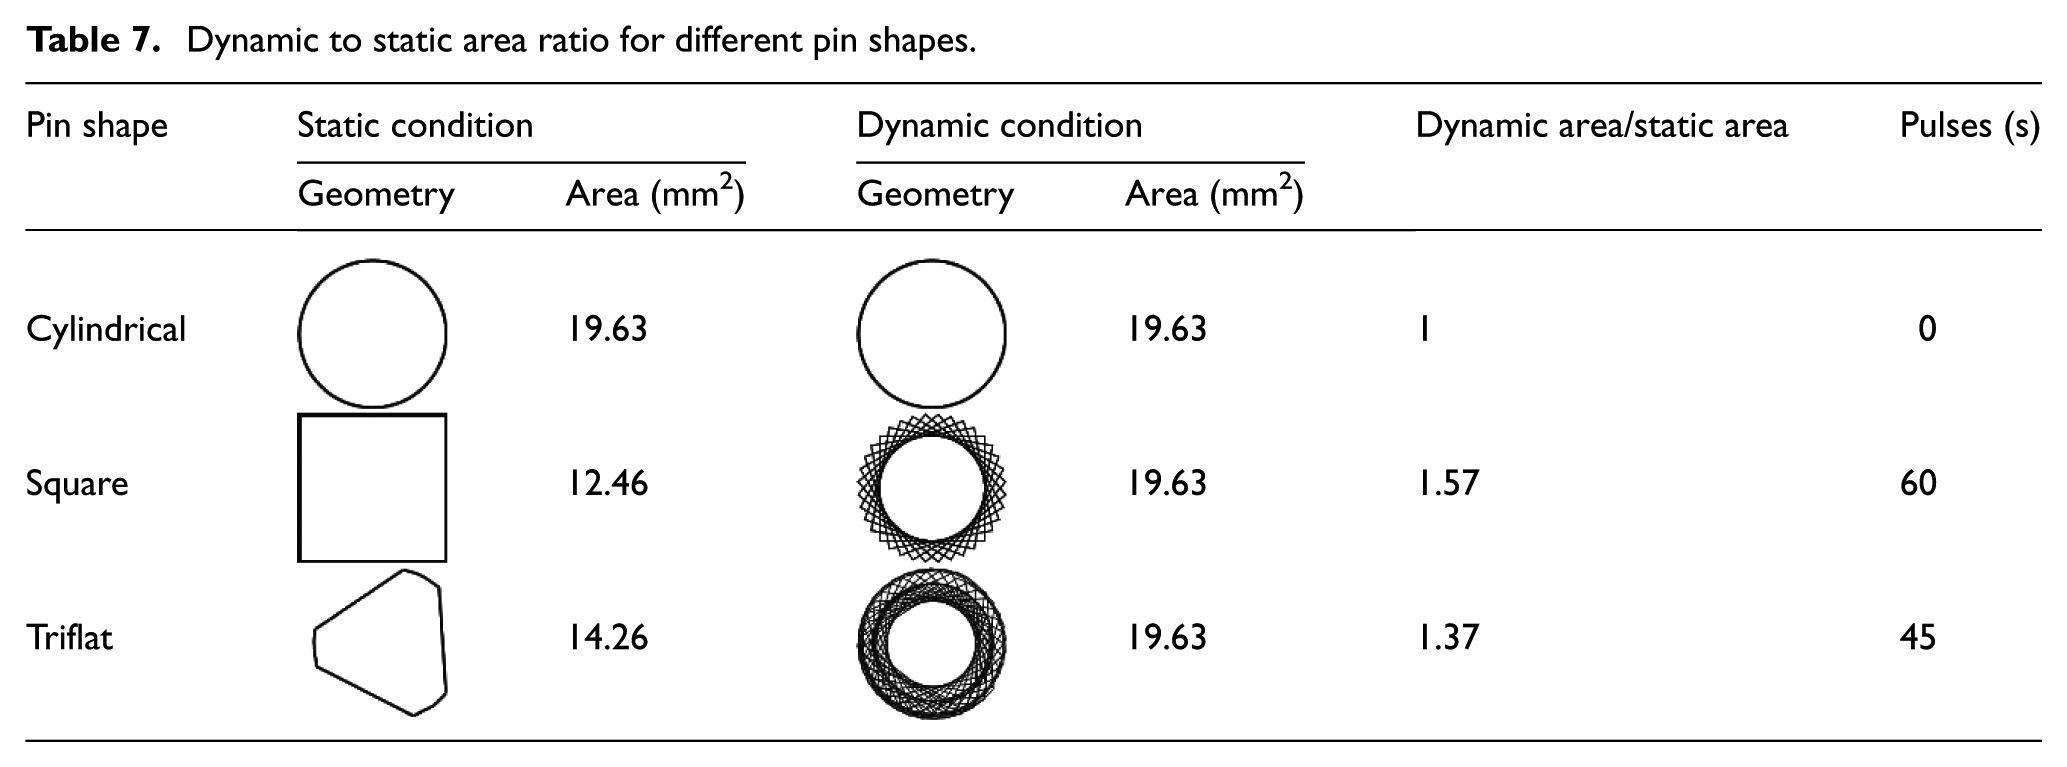
Along with temperature, effective strain also plays a vital role in the refinement of the grains in the nugget zone. Influence of the pin shapes on effective strain is shown in Figure 11(c). The highest strain produced by the triflat pin is greater than 50, whereas that for square and cylindrical pins is smaller. This is because of the eccentricity associated with the flat-shaped pin profiles. This can be determined by calculating the ratio of the dynamic volume occupied by the tool to the static volume. 10 It is 1 for the cylindrical pin, 1.57 and 1.37 for square and triflat pins, respectively, as shown in Table 7. Volume is calculated by taking the product of the pin cross-sectional area and height. Pin height of 2.5 mm is same for all the three pins. Eccentricity is associated with the dynamic orbit of the pin geometry,22,37 and the same is also shown in Table 7 under dynamic condition. Also, flat surface produces a pulsating effect which leads to the bulk movement of the material instead of shearing (layer by layer) movement. 10 Pulse per second is calculated by taking the product of the number of flat faces (4 and 3 for square and triflat pins, respectively) and rotational speed (in rps) of the pin. 22 Since the cylindrical pin has a smooth surface, it does not produce any pulsating effect. Triflat and square pins produce 45 and 60 pulses per second at a rotational speed of 900 r/min, respectively. Combined effect of eccentricity and pulsating effect leads to the higher effective strain for the flat-surfaced tool. Though square pin has a higher pulsating effect and volumetric ratio, still the triflat pin produced higher effective strain. This is because of the higher temperature generated for the triflat pin which makes deformation of the material easier.
Dynamic to static area ratio for different pin shapes.
Forces and spindle torque
Square pin produces maximum axial force followed by the cylindrical and triflat pins as shown in Figure 12. This is because the square pin generates lower temperature as compared with the other two pin shapes. Peak axial force for square, cylindrical and triflat pin is 29.43, 26.85 and 20.08 kN, respectively.
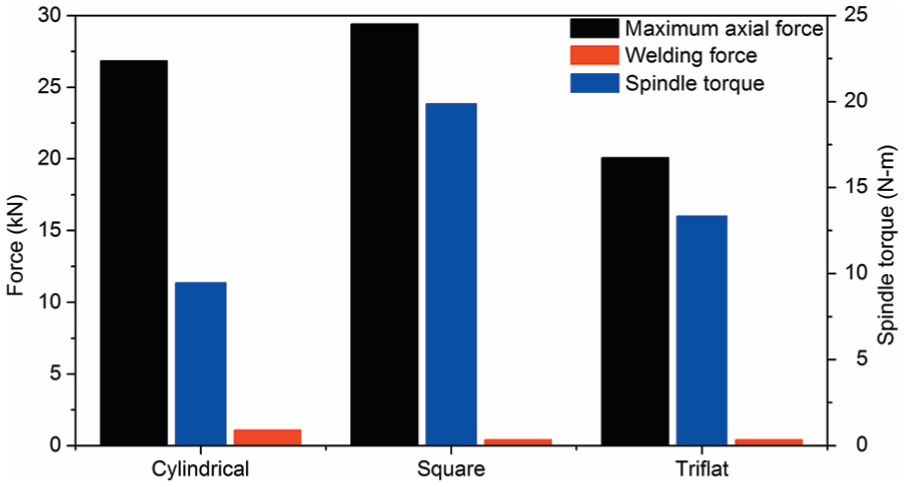
Influence of pin shape on forces and spindle torque for a rotational speed of 900 r/min and a welding speed of 60 mm/min.
Welding force is the measure of resistance offered by the material to the movement of the tool during welding. Hence, lower welding force would indicate the higher effectiveness of the pin shape as it would be able to stir the material efficiently and therefore, higher welding speed can be used. Cylindrical pin produces maximum welding force of 1.1 kN, while triflat and square produce 0.43 and 0.42 kN, respectively. This is due to the higher deformation produced by the flat surface pin. This indicates that triflat and square pins are more effective than the cylindrical pin. Spindle torque predicted for the square pin is the highest among the three with a value of 20 Nm, followed by the triflat and cylindrical pin with 13.35 and 9.45 Nm, respectively.
Material flow
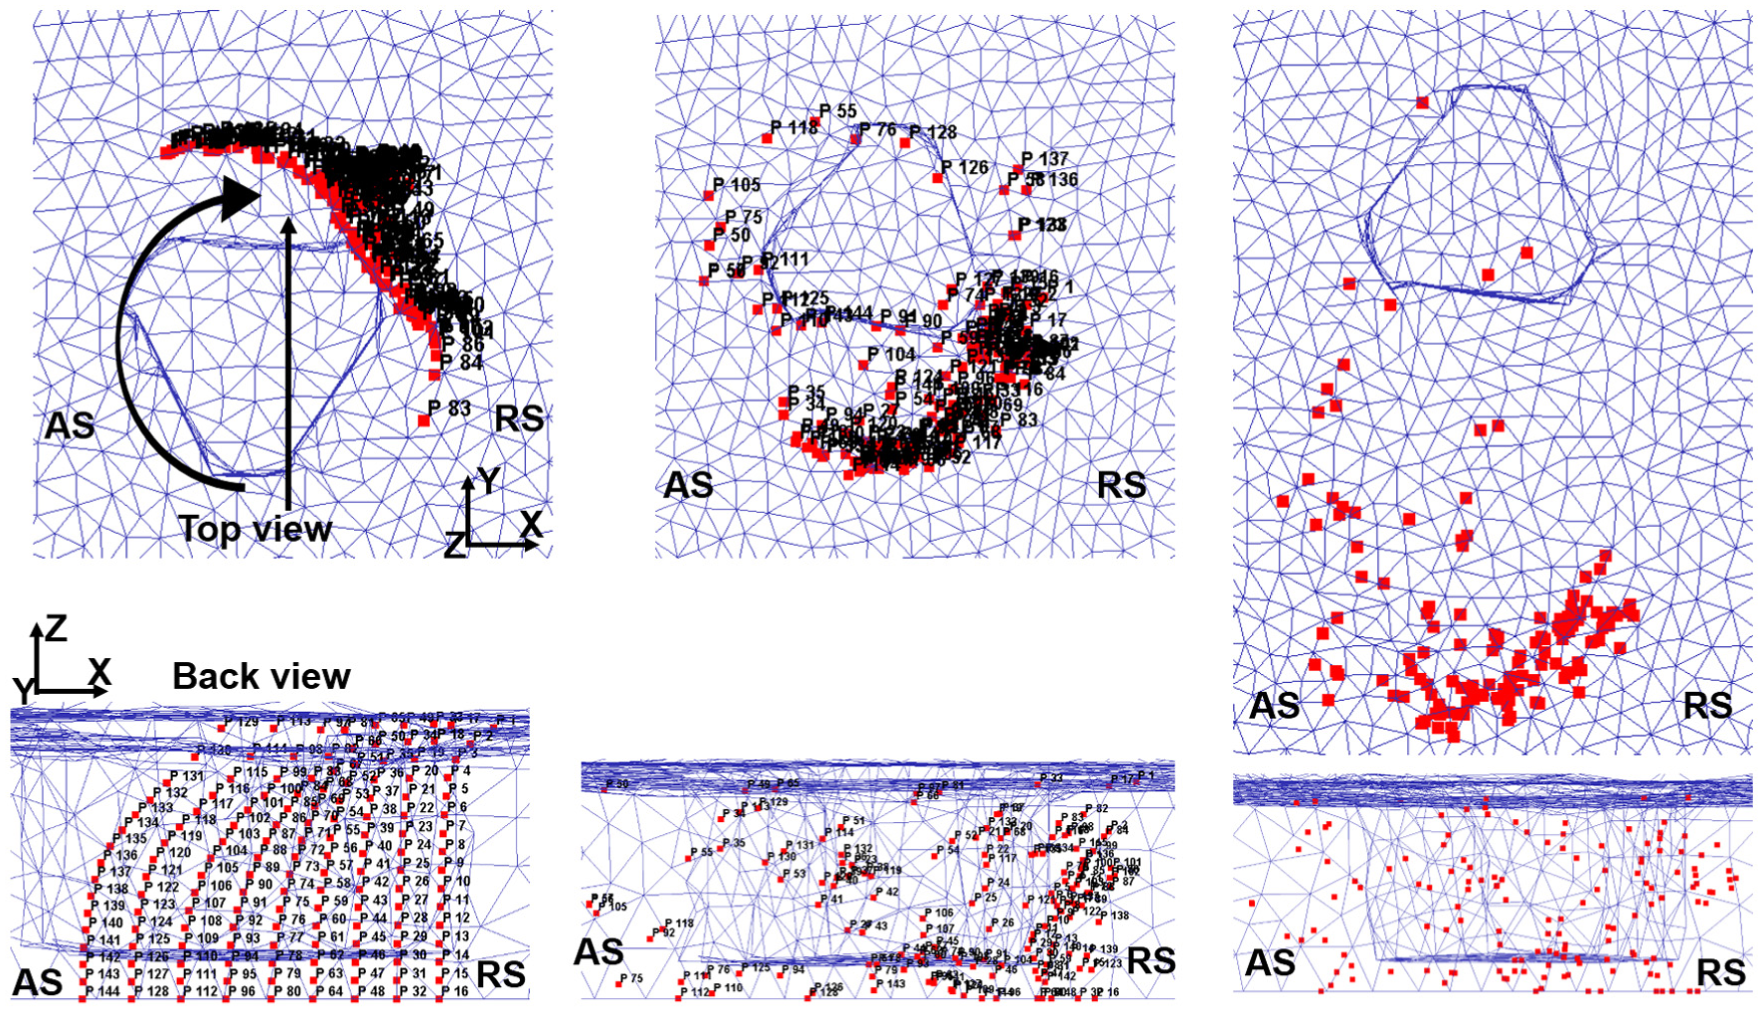
Particle tracking method is used to study the influence of the pin shape on the material flow. Material points are defined at a distance of 7.5 mm ahead of the pin center. Distance between the consecutive points in transverse and thickness directions are 0.5 and 0.2 mm, respectively. This makes 9 and 16 points in the respective direction as shown in the bottom view of Figure 13(a). A total of 144 points are defined to study the material flow in the nugget region. Top view is the workpiece top surface when visualized toward the negative Z-direction. Back view is along the welding direction when visualized toward the positive Y-direction.
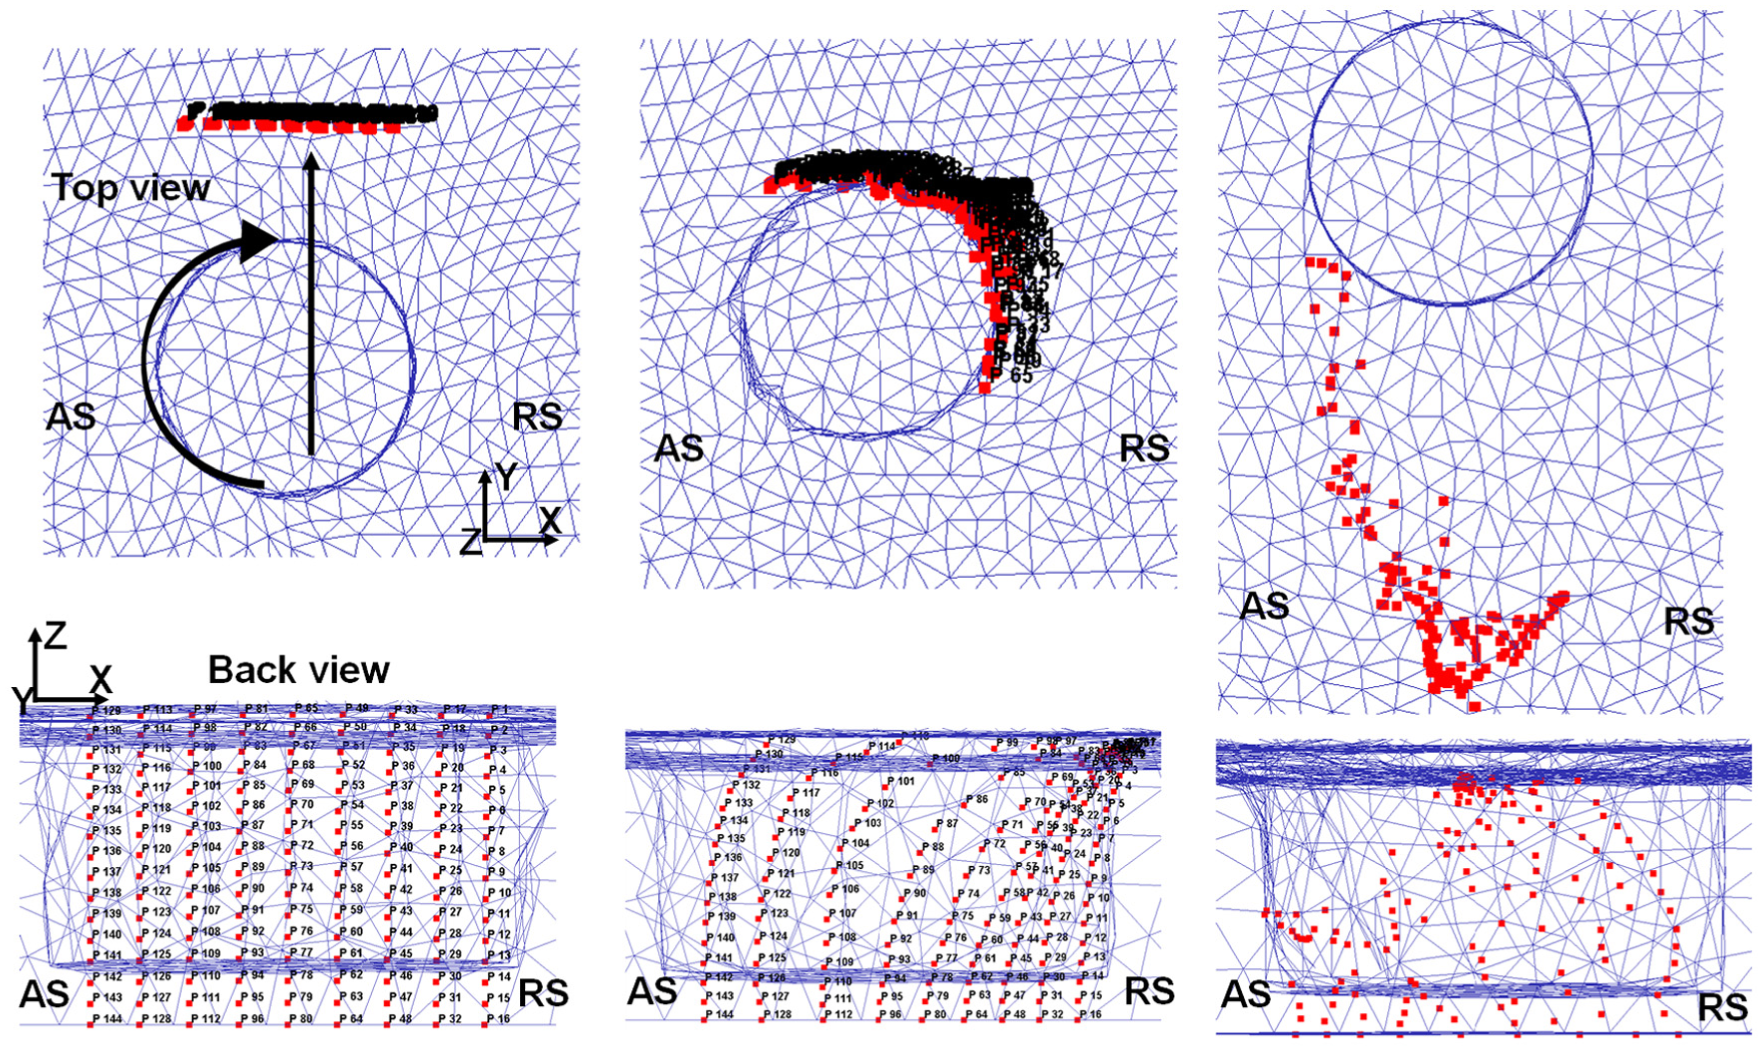
Material flow from stirred zone for cylindrical pin: (a) initial location, (b) intermittent position and (c) final location.
Basic mechanism of the material flow remains the same irrespective of the pin shape. The material stirs through RS and gets deposited on the back side of tool as shown in Figure 13(a)–(c) for the cylindrical pin. Labels of the material points are hidden from the final deposition figures to have a better visualization. In case of cylindrical pin, the materials from AS does not come back to its original location indicating insufficient flow of the material that can lead to defects such as wormhole and tunnel defect. 38 Material flow for the square pin is shown in Figure 14. Investigation of the final location of the material for square pin indicates that material is stretched toward the AS, indicating sufficient material flow. This behavior is because of the presence of flat surfaces that generate the pulsating effect as discussed earlier. Due to this, the material movement takes place in bulk along with the shearing action. 10 Since the pulsating effect of the square pin is the highest among the three selected pin shapes, material has stretched toward AS leading to a stretched stirred zone. Also, the material on the top surface takes several revolutions with the tool as seen in the top view of Figure 14(c). The material flow for the triflat pin is similar to that of the square pin as shown in Figure 15. But, here the material is uniformly distributed over the stirred zone as shown in back view of Figure 15(c). This is due to lower pulse generated by the triflat pin as compared with the square pin.
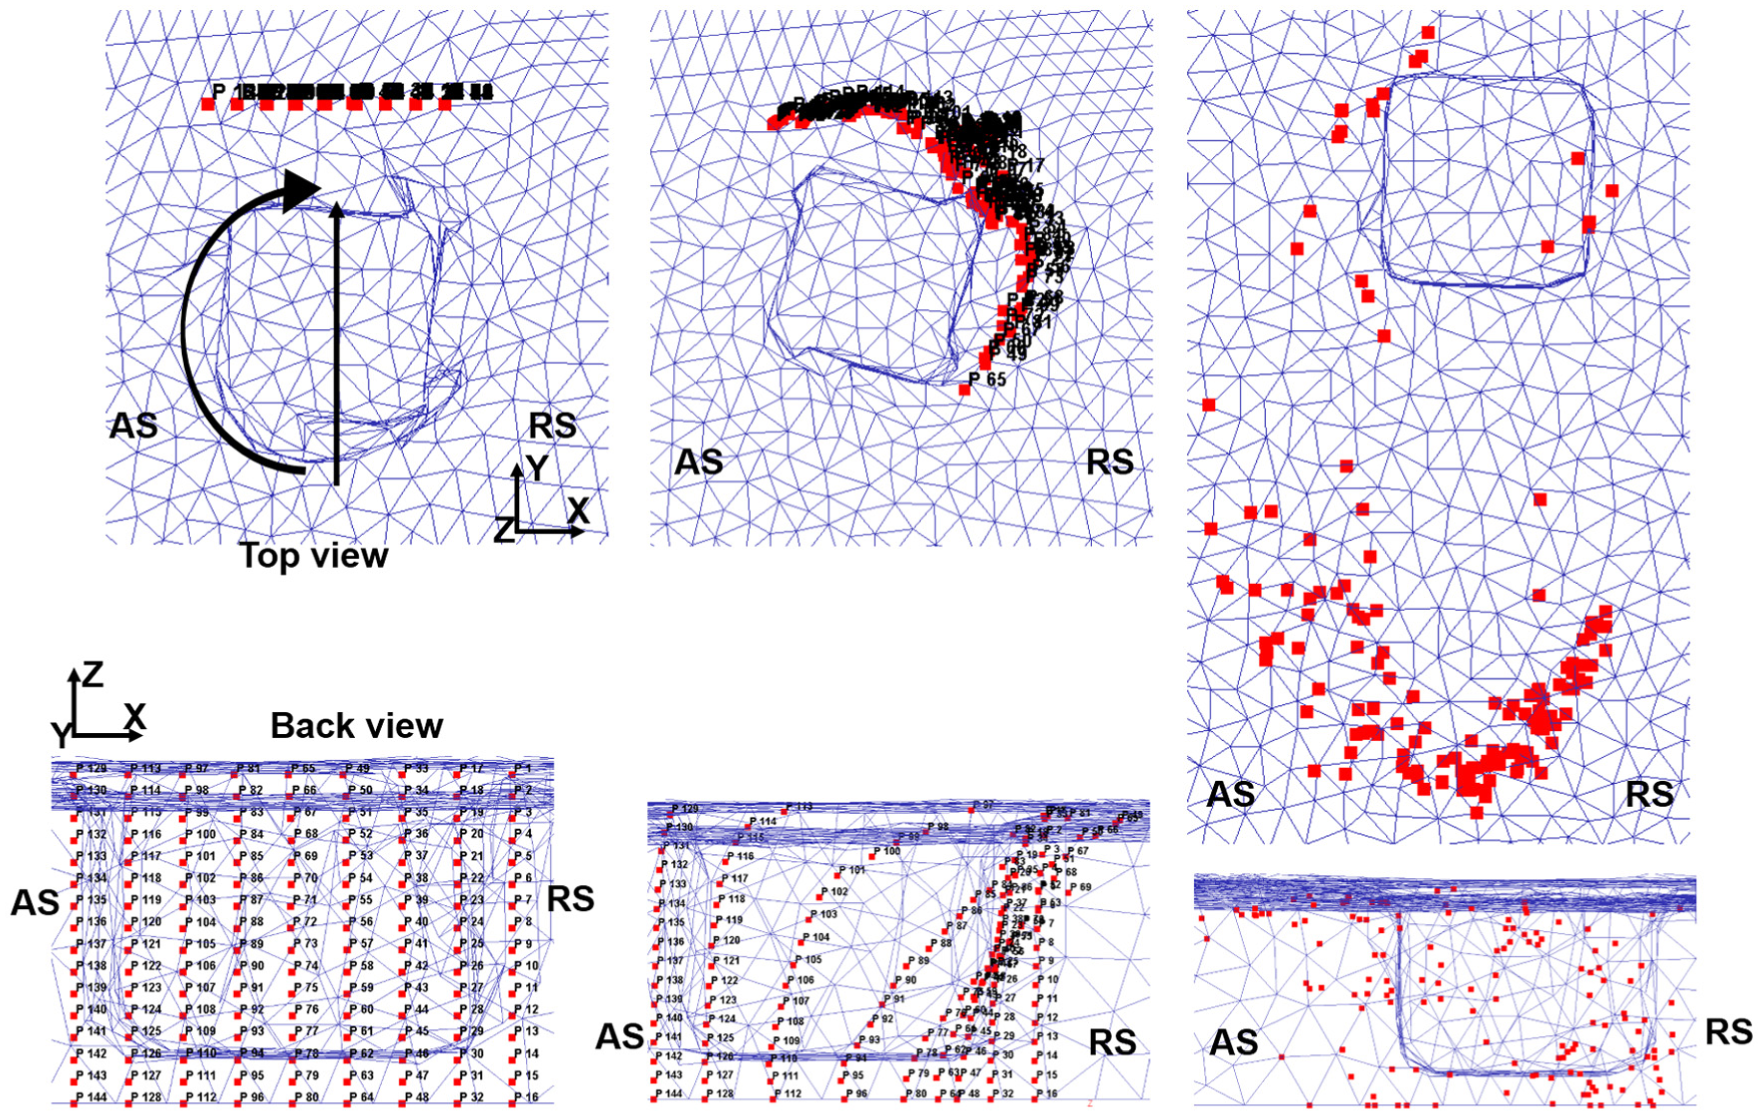
Material flow from stirred zone for square pin: (a) initial location, (b) intermittent location and (c) final location.
Material flow from stirred zone for triflat pin: (a, b) intermittent location and (c) final location.
A point on AS at z = 1.5 mm (midplane) and 1.5 mm away from the CL is selected to study the material flow path with time as shown in Figure 16(a). This point on the AS is considered as this region is prone to the defect formation. Final location of the material for all the pin shapes has negative coordinate value indicating that material is deposited on AS. Maximum displacement of the material for cylindrical, square and triflat pin is 4.05, 4.24 and 4.68 mm, respectively, which is slightly less than the pin diameter of 5 mm. Highest displacement is for the triflat pin, followed by the square and cylindrical pins. Therefore, highest strain and strain rate distribution are also in the same sequence. Mode of the material flow can be estimated by calculating the time required for the stirring action. Shearing and bulk movements of the material are the two prominent modes of material flow, while the former takes more time as compared with the latter. Time taken by the material from the start of the stirring till the end for cylindrical, triflat and square pins is 3, 3 and 2 s, respectively. Square pin takes the least time for material stirring indicating that bulk transportation of the material is more prominent and similar behavior is reported in literature for flat-faced pins.10,39 Cylindrical and triflat pins took approximately the same time for the stirring of the material even though triflat pin has three flat surfaces. One possible justification could be that the material with triflat pin could have traveled a longer path as compared with the cylindrical pin. Verification of this justification is carried out by plotting the same material point in transverse direction (TD)–welding direction (WD) plane as shown in Figure 16(b). It is evident from the material path in TD-WD plane that for triflat pin, the material is displaced by 5.3 mm in WD, while the same is 2.3 mm for the cylindrical pin. The material flow path of cylindrical pin is elliptical while it is arbitrary for square and triflat pins.
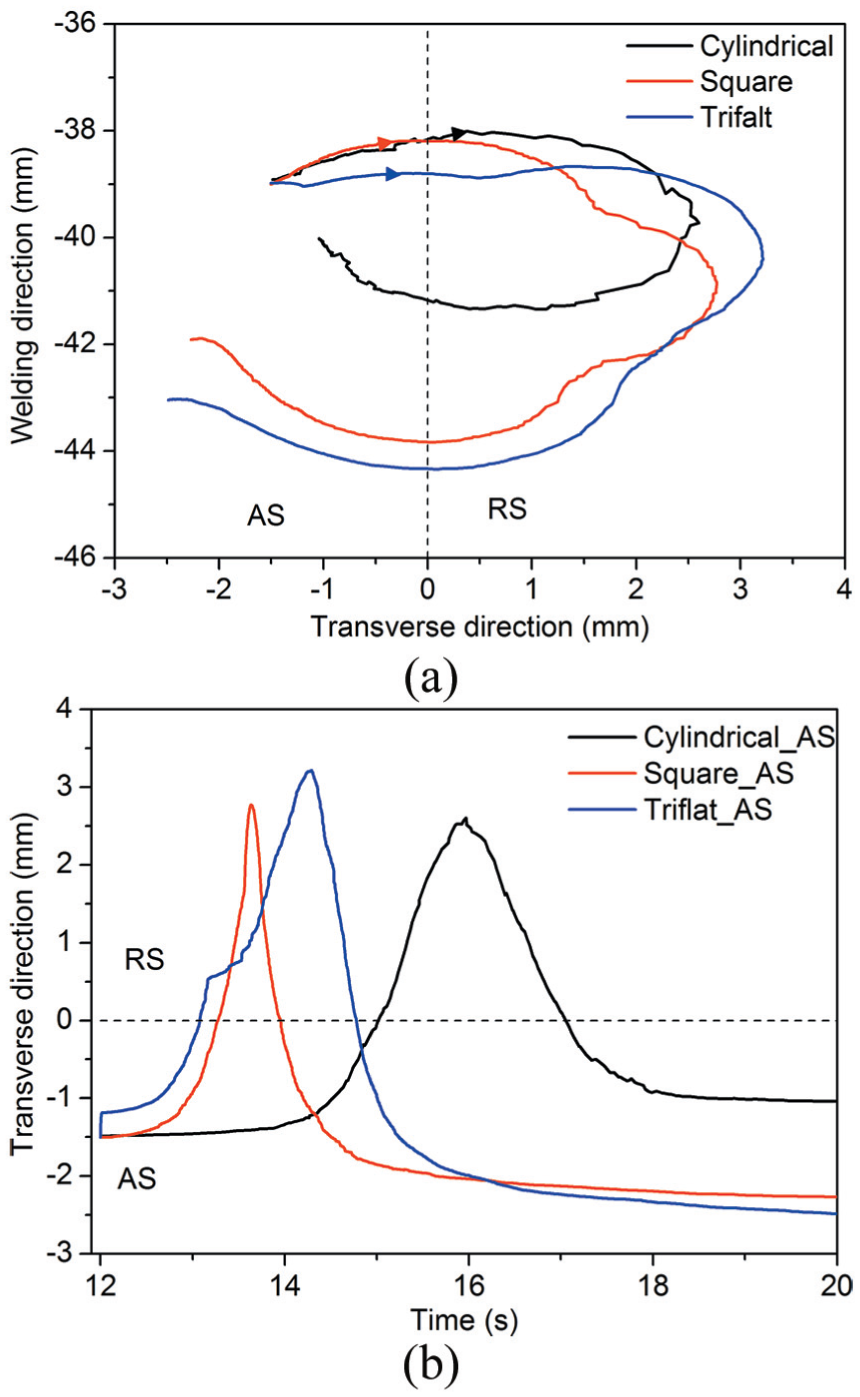
Material flow path from AS: (a) with time and (b) TD-WD plane.
Material velocity and strain rate
Material velocity is critical for achieving efficient weld as it provides information about the traction between the tool surface and workpiece. Triflat pin produces maximum material velocity followed by the square and cylindrical pins.
Maximum velocity for triflat, square and cylindrical pins is approximately 100, 78 and 12 mm/s, respectively, as shown in Figure 17(a). Thus slip-rate (ratio of the material velocity to the tool velocity) values are 0.42, 0.33 and 0.05, respectively. Literature suggests that slip rate in FSW ranges between 0 and 0.533,40,41 and the present results are consistent with these findings.
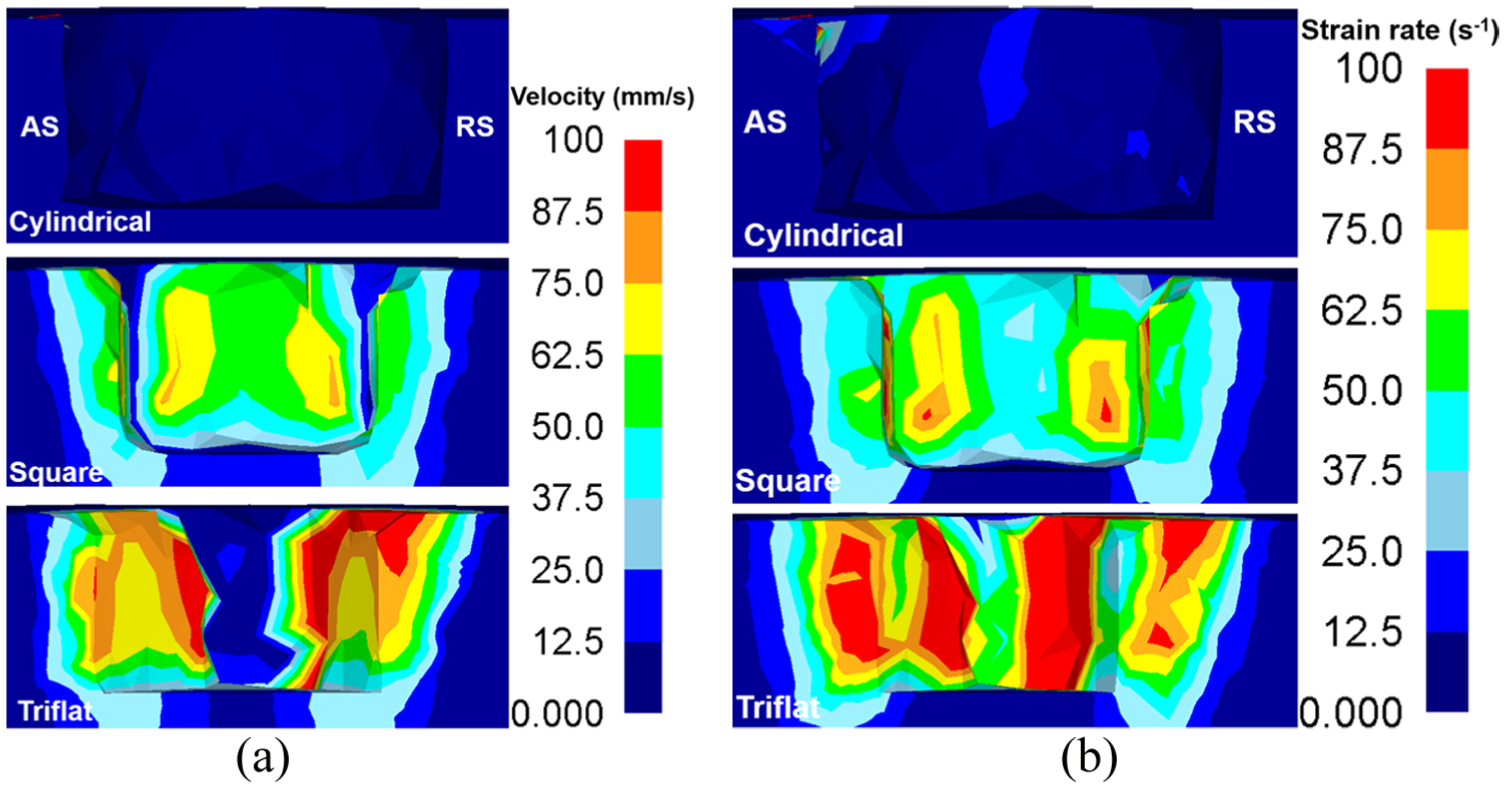
Influence of pin shape on (a) material velocity and (b) strain rate.
Strain rate determines the rate of deformation and along with temperature is an indicator of the extent of grain refinement. Higher strain rate will lead to finer grain size. Order of the strain rate is similar to the material velocity, that is, triflat pin produces the highest strain rate followed by square and cylindrical pins.
Conclusion
A coupled thermo-mechanical model is developed to study the influence of flat-surfaced pin on material flow, temperature, strain rate and material velocity. The developed model is validated with the experimentally measured temperature, axial force and spindle torque. The simulation predicted results show a good correlation with the experimental observation. Following conclusion can be drawn based on this study:
The material is extruded in the upward direction during the initial phase of plunging followed by the compression because of the tool shoulder.
The higher temperature is produced for the triflat pin followed by the cylindrical and square pin.
The material flow for the square pin stretched toward the AS, while a uniform distribution of the material points is observed for the triflat pin.
Bulk movement of the material is predominant for the square and triflat pins, while shearing is predominant for the cylindrical pin.
Material travels longer path for the triflat and square pins as compared with the cylindrical pin.
Triflat pin produces higher strain rate, strain and material velocity, followed by the square and cylindrical pins.
Footnotes
Declaration of conflicting interests
The author(s) declared no potential conflicts of interest with respect to the research, authorship and/or publication of this article.
Funding
The author(s) received no financial support for the research, authorship and/or publication of this article.