
Abstract
Laser drilling is a preferable method in drilling micro and slender holes because of its non-physical contact between the tool and the workpiece leading to elimination of the problems like chatter and vibration. In this article, an experimental investigation of the laser drilling process is carried out on thin sheet (0.5 mm) of titanium alloy (Ti6Al4V) using pulsed Nd:YAG laser. The study investigates the effect of laser parameters such as laser energy, pulse repetition rate, pulse width and gas pressure on hole quality characteristics, namely, circularity at entry and exit, taper and spatter area. Taguchi’s L27 orthogonal array is adopted for conducting the experiments to establish significance of control parameters on the performance measures with less number of experimental run. Analysis of variance shows that laser energy and pulse width significantly influence on circularity, taper and spatter area. Optimal parameter setting for all the performance measures is suggested. Statistically valid empirical models relating hole quality characteristics with laser parameters have been developed based on least square regression analysis. Backpropagation artificial neural network is used predict the output responses considering laser process parameters as inputs. A mean square error within 5% for both the training and testing data suggests the adequacy and robustness of the proposed artificial neural network model. Variation of performance measures with respect to process parameters is predicted through the well-trained artificial neural network model. The pattern of variation exhibits good agreement with the main effect plots obtained through Taguchi method. Artificial neural network model produces mean relative error of 0.001, 0.001, 0.0437 and 0.0234 for circularity at entry, circularity at exit, taper and spatter area, respectively, when compared with experimental values. Since small values of mean relative error are obtained, the proposed artificial neural network model can be satisfactorily used for prediction of quality characteristics of laser micro-drilled holes.
Introduction
Titanium alloys (Ti6Al4V) are widely used for high-end applications in automobile, chemical, aviation and bio-medical industries due to their favourable properties like high strength to weight ratio, hardness, heat resistance, wear resistance at elevated temperature and bio-compatibility.1–9 Titanium alloy sheet of thickness 0.5 mm is widely used for bio-medical applications.8,9 Through an extensive experimental study at various machining conditions, Arrazola et al. 10 have stated that titanium alloys exhibit poor machinability due to their low thermal conductivity generating extensive heat at tool and workpiece interface. Therefore, it is difficult to drill titanium alloys because rapid tool wear occurs at the cutting edges of tool.11,12 To overcome such type of problems, the use of laser may be a suitable alternative for drilling of Ti6Al4V alloy.13,14 The laser machining is the non-contact machining operation in which tool wear and vibration can be avoided but accuracy is maintained.15–17 The standard lasers used for the laser machining process are ruby, Nd:YAG (Neodymium Yttrium Aluminium Garnet) and carbon dioxide (CO2) gas laser.18–20 Lasers find wide spread application in various fields such as electrical, electronics, micro-electro-mechanical systems (MEMS), medical science, metal forming, aviation and automobile sectors.21–23 Also, lasers are widely used for various material processing techniques, namely, forming, bending, sintering, cutting, welding, drilling and additive manufacturing.24–26 As the laser machining is a non-contact process and capable of machining intricate shape, lasers are often used for various micro-machining processes such as micro-cutting, micro-welding and micro-drilling. 27
In laser drilling process, a high-energy infrared laser beam is focused on a spot of the workpiece (generally varies between 0.1 and 2.0 mm in diameter) and causes melting, vaporization and chemical degradation throughout the depth of the material.13,14,20 An assistant gas is used to flush the molten material from the surrounding near the drilled hole. Ng and Li 28 have investigated the effect of laser process parameters such as pulse width and laser peak power on material ejection and quality of hole in terms of circularity during in laser percussion drilling. The authors have stated that spatter deposition is more in case of long pulse width and low laser peak power. Low et al. 19 have studied the effect of laser processing parameters such as pulse width, pulse frequency and peak power on spatter deposition during laser machining of Nimonic 263 alloy using Nd:YAG laser. The study indicates that spatter is mostly deposited during initial laser pulses. Bandyopadhyay et al. 29 have investigated influence of pulse energy, pulse frequency and pulse width on defects like taper, spatter and recast layer during laser drilling of thick specimens (IN718 and Ti6Al4V). Hanon et al. 30 have studied the effect of process parameters such as peak power, pulse repetition and focal position during laser drilling process of thick ceramic sheets. Pandey and Dubey 31 have reported that gas pressure and pulse width are the significant factors in formation of taper of the kerf during laser cutting of titanium alloy. Bharatish et al. 32 have investigated the effect of process parameters such as frequency, power, scanning speed and hole diameter during laser drilling of 2-mm-thick alumina ceramic using 300 W CO2 pulsed laser. Results show that laser power and hole diameter significantly influence on taper of the hole. Ghoreishi et al. 11 have adopted design of experiment (DOE) approach to plan experimental layout for laser drilling of stainless steel using Nd:YAG laser. The authors have proposed empirical relations between laser process parameters and performance measures. Sharma and Yadava33,34 have proposed Taguchi and response surface methodology (RSM) approach to obtain mathematical relationship between the process parameters and performance measures during laser cutting of aluminium alloy sheet using Nd:YAG laser. The study also suggests that assistant gas has significant effect in formation of taper during laser cutting.
Artificial neural network (ANN) is widely used as a predictive technique for various advance machining processes.35–40 Akbari et al. 35 have proposed ANN approach for predicting the weld characteristics in laser welding of Ti6Al4V alloy. To estimate the surface roughness of steel and aluminium alloy during milling operation, Khorasani and Yazdi 36 have proposed ANN for predicting the responses. Arnaiz-González et al. 37 have used ANN along with DOE for predicting the dimensional accuracy of the inclined surface during end-milling process. Mondal et al. 38 have used backpropagation ANN to estimate the outputs in laser machining process. The literature40–43 suggests that ANN approach embedded with DOE method is an effective prediction technique. Since laser machining is a complex and costly process as compared to conventional machining processes, it is prudent to predict machining responses using ANN. Parandoush and Hossain 44 state that ANN is an efficient prediction method widely used for predicting the performance characteristics in laser beam machining processes.
With the increase in the development of miniaturized products, demand for producing micro-crack free, high-quality and high-aspect ratio micro-holes and micro-features is increasing for a number of applications such as in MEMS device packaging, optical fibre alignment, mini-vision systems and microelectronic packaging. 45 In order to achieve quality micro-holes through drilling of thin foils, application of laser is best suited.29,46 The aim of this work is to explore micro drilling operation with pulsed Nd:YAG laser on Ti6Al4V alloy. To understand the influence of process parameters such as pulse width, laser energy, pulse repetition rate and gas pressure on performance characteristics, namely, quality of holes in terms of circularity at entry and exit, taper of the hole and spatter formation, laser percussion drilling has been performed based on DOE approach (Taguchi’s L27 orthogonal array). Experiential planning through DOE helps to systematically analyse the process with relatively less number of experimental runs. In this study, analysis is focused on a large number of process parameters and performance measures unlike past studies on the limited number of process parameters and performance measures. ANN has been used to not only predict the performance measures but also analyse variation of performance measures with the change in process parameters beyond experimental domain once the network is converged.
Experimental details
Experiments on laser drilling of Ti6Al4V have been performed using Nd:YAG (neodymium-doped yttrium aluminium garnet) millisecond (ms) pulsed laser machine. The Nd:YAG ms pulsed laser machine is developed by Raja Ramanna Centre for Advanced Technology (RRCAT), Indore. The laser machine has wavelength of 1.06 µm, beam diameter of 200 µm, average output power of 250 W, pulse width between 1 and 20 ms and pulse repetition rate ranging between 1 and 200 Hz.47,48 The experiments have been performed on titanium alloy of grade-5 having dimension of 10 × 10 mm and 0.5 mm thickness. The metal has been supplied by Manohar Metals Corporation, Mumbai, India. Scanning electron microscopy with energy dispersive spectroscopy (SEM-EDS) has been performed to check the ingredients present in the work material. The data obtained from SEM-EDS analysed at 300 micron (µ) resolution shown in Figure 1 indicates that the work material has titanium (Ti) at its peak and other constituents present in the workpiece are vanadium (V) and aluminium (Al). The work material is having Ti of 91.60% atomic weight, V of 6.39% atomic weight and Al of 2.02% atomic weight.
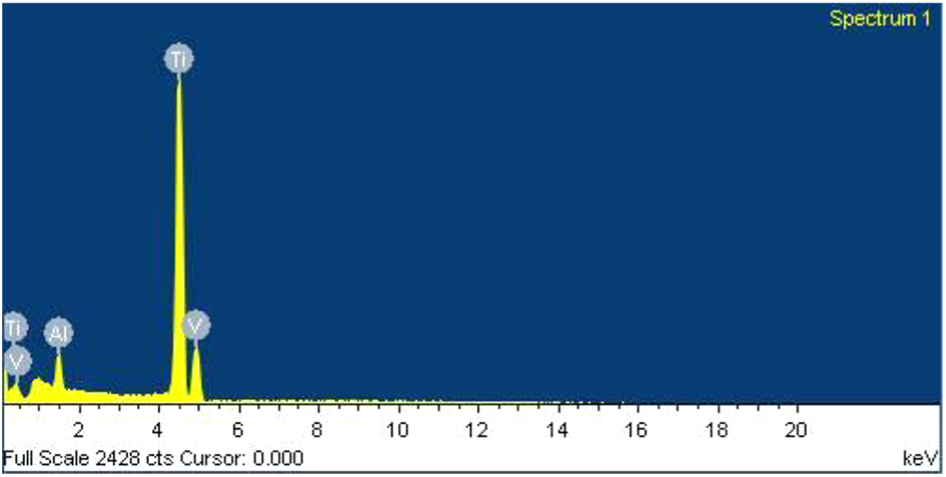
SEM EDS graph of titanium alloy.
In this study, Taguchi method has been employed to plan the experimental layout to study the effect of laser control parameters on various laser drilling performance characteristics with less number of experimental runs. The control parameters are selected on the basis of control parameters available with laser setup in RRCAT, Indore, and through an exhaustive literature survey.19,29,31 The control parameters considered are laser energy (A), pulse repetition rate (B), pulse width (C) and flushing pressure (assistant gas pressure using argon) (D), each at three levels (Table 1). Taguchi’s L27 orthogonal array is used to design the experimental layout (Table 2). In laser drilling operation, laser energy is an important parameter for achieving quality holes. Higher the laser energy, higher will be the heat input resulting in high quantity of material to be removed.13,14 In the present investigation, laser machine uses equations (1) and (2) for calculation of energy, where Ein is laser input energy, k0 is constant of the flash lamp value (the value is fixed at 18), I is laser current input, tp is pulse duration and Eout is laser output energy.47,48 From equation (1), it is observed that laser energy is a function of current and pulse duration. Equation (2) indicates the average power (Pavg) developed for the machine.47,48 Since input laser energy is related to power term of current, the input laser energy predominantly determined by the laser current. For all the experimental runs conducted in the work, laser energy is estimated as varying between 10 and 30 J by changing the levels of the laser current. The laser energy is divided into three different levels termed as low, medium and high. Although laser current is an important parameter that determines the laser energy but cannot be considered as an input parameter because two different lasers may provide different pulse energies depending upon their efficiency for a given current value


where Ein is the laser input energy, k0 is the constant of the flash lamp value (the value is fixed at 18), I is the laser current, tp is the pulse duration, Eout is the laser output energy, Pavg is the average power and f is the pulse repetition rate.
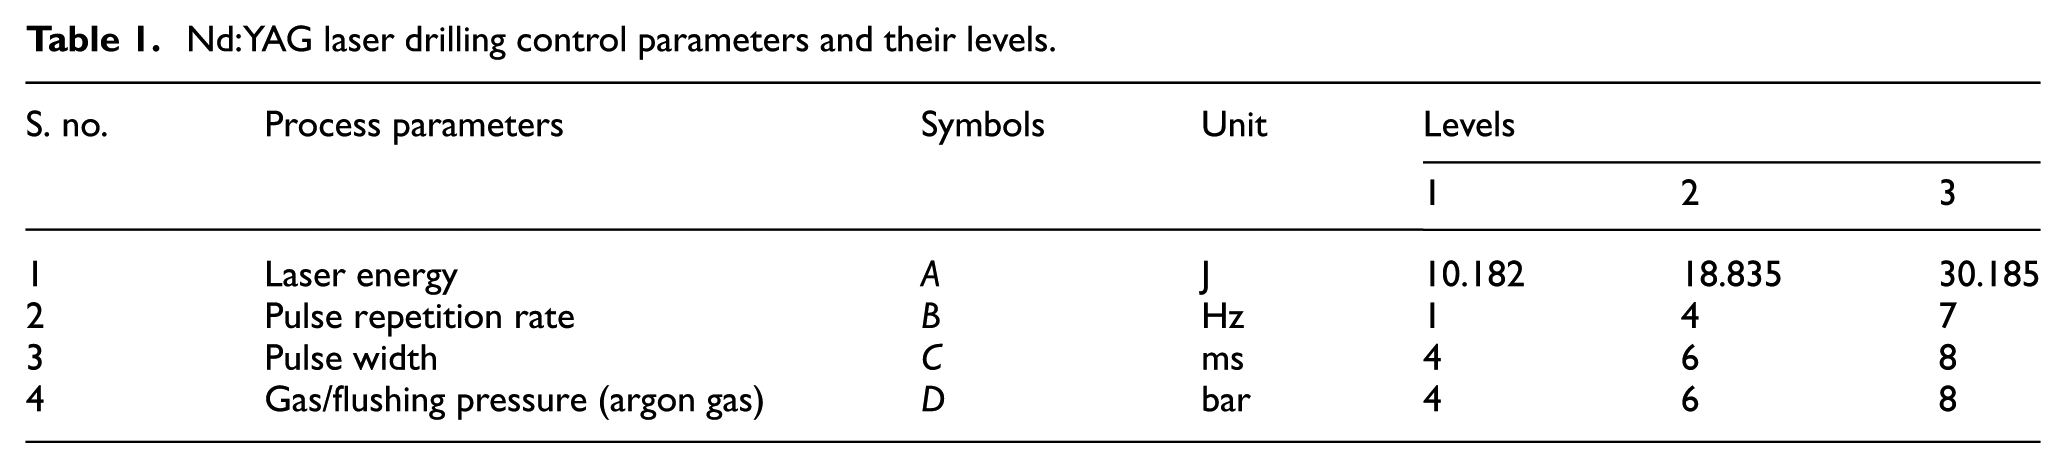
Nd:YAG laser drilling control parameters and their levels.
Experimental layout (coded form) and performance measures.
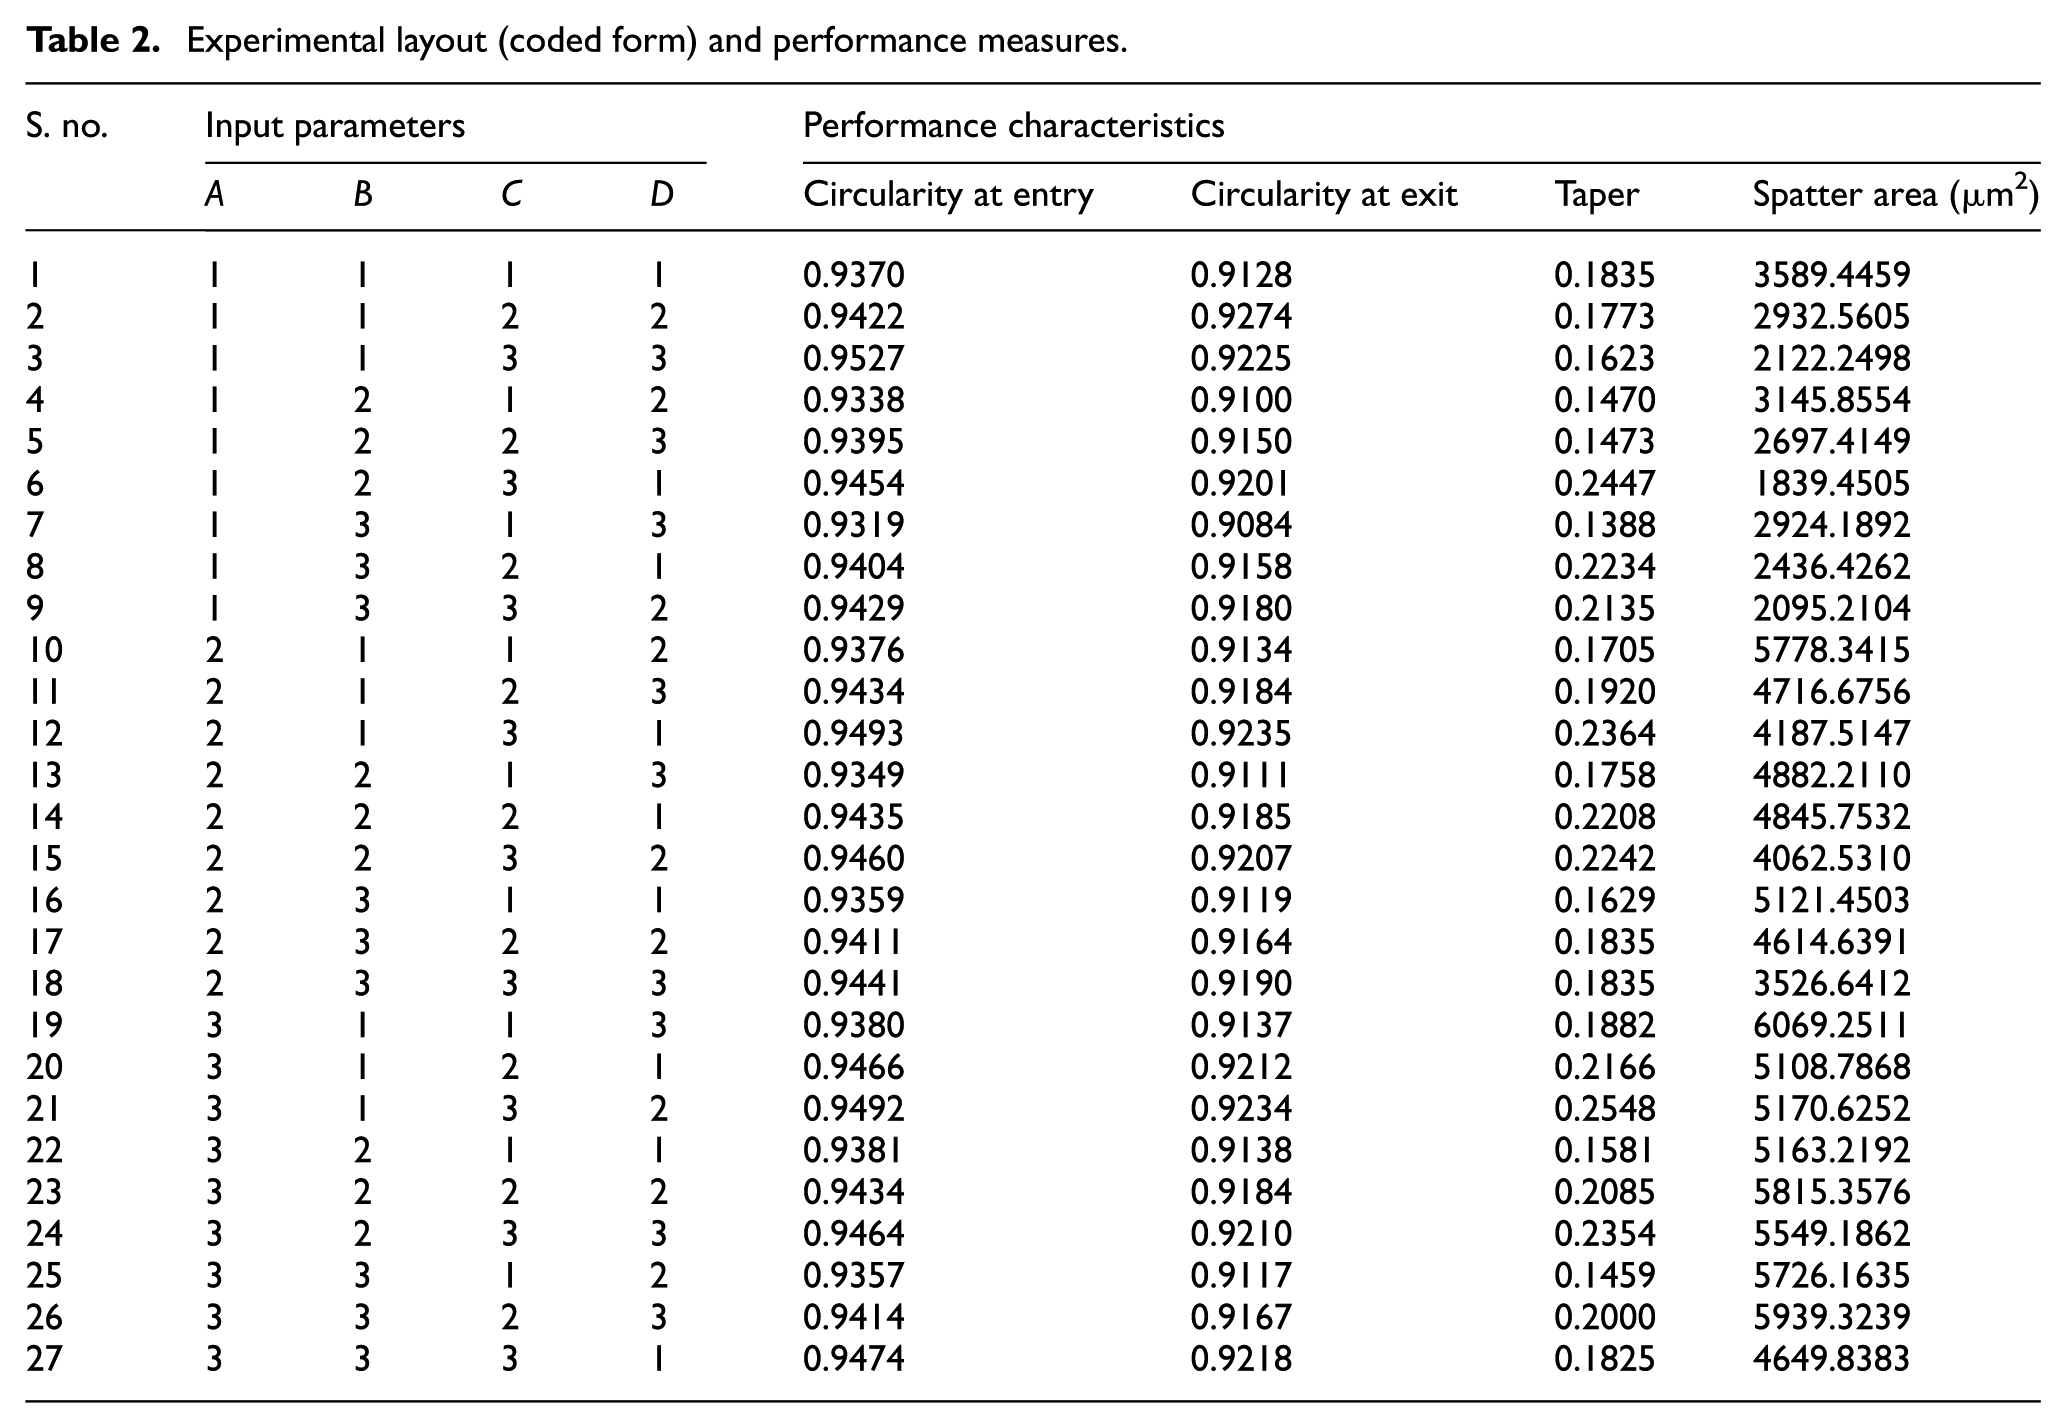
Laser drilling of micro-holes was carried out in a planned manner (according to experimental design) using controlled parameters such as laser energy, pulse repetition rate, pulse width and gas pressure (Argon gas). Standoff distance and spot diameter of 3 mm and 200 µm, respectively, are maintained in each experimental run. Each experiment has been repeated two times and the average value of performance measures is noted in Table 2.
Laser drilling is a thermal machining process in which laser energy is concentrated on the workpiece leading to rise in temperature of a concentrated area in the workpiece. Rise in temperature leads to melting of material in the machining zone. The molten material further evaporated and expelled on the surface of the drilled holes. The expelled material on the workpiece surface is termed as spatter. To remove the molten materials, flushing of molten material with the help of assistant gas is carried out in the machining zone. Improper flushing may cause adversely affect hole quality like taper and circularity. Due to insufficient gas pressure, molten materials get stuck and deposited on certain area of the surface of the hole. This is termed as spatter area. Image acquisition of the laser drilled holes is carried out using optical microscope (RADIAL INSTRUMENT with Samsung camera setup, 30-X magnification). Image processing toolbox of MATLAB 15 is used to analyse spatter area, taper, circularity at entry and circularity at exit. Figure 2 shows spatter deposition on the surface of the hole. The amount of spatter deposited on the surface is expressed by spatter area.
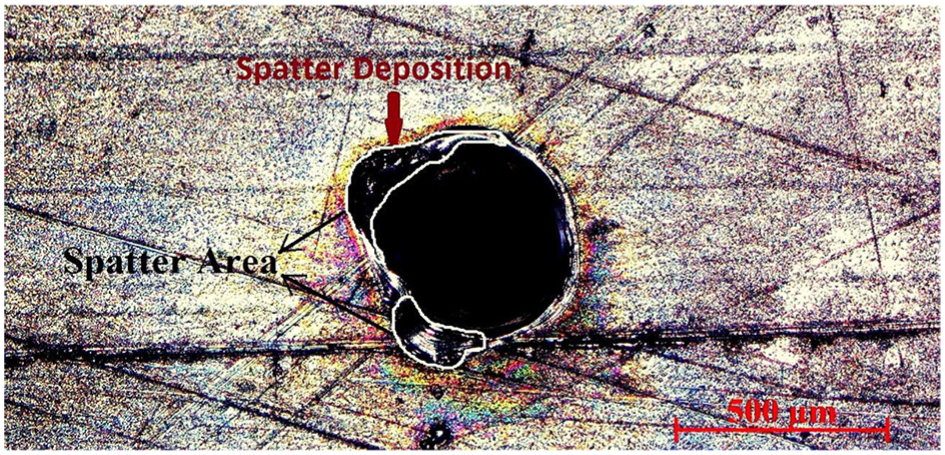
Spatter deposition near the laser drilled holes.
Taper of the laser drilled hole is calculated by equation (4),33,34 where Dent and Dexit are the diameters at entry and exit of the hole, respectively, and t is the thickness of the workpiece. In this study, it is observed that diameter at entry (Dent) is invariably greater than diameter at exit (Dexit) (Figure 3)
Schematic diagram of taper of laser drilled holes.
Quality of the hole can also be expressed in terms of circularity (both at entry and exit). To measure the circularity of the drilled hole, spatter is removed from drilled hole surface by polishing with polishing paper III grade 1/0 (Kohinoor Products, India). Image acquisition is made taking images under optical microscope with 20× magnification. The circularity (CIR) of the hole is expressed as the ratio of minimum diameter (D1) to maximum diameter (D2) Ferret’s diameters of the hole.11,49 Ferret’s diameter is defined by the distance between the two parallel tangents drawn at opposite ends (Figure 4). Circularity of hole for entry and exit is expressed in equation (5). 20 If CIR value is equal to 1, then it implies that the hole is a perfect circle
Ferret diameter of laser drilled hole.
ANN
Figure 5 shows the l-m-m-n (l input neurons, m hidden neurons and n output neurons) architecture of a backpropagation neural network model. Input layer receives information from the external sources and passes this information to the network for processing. Hidden layer receives information from the input layer and does all the information processing, output layer receives processed information from the network and sends the results out to an external receptor. The input signals are modified by interconnection weight, known as weight factor
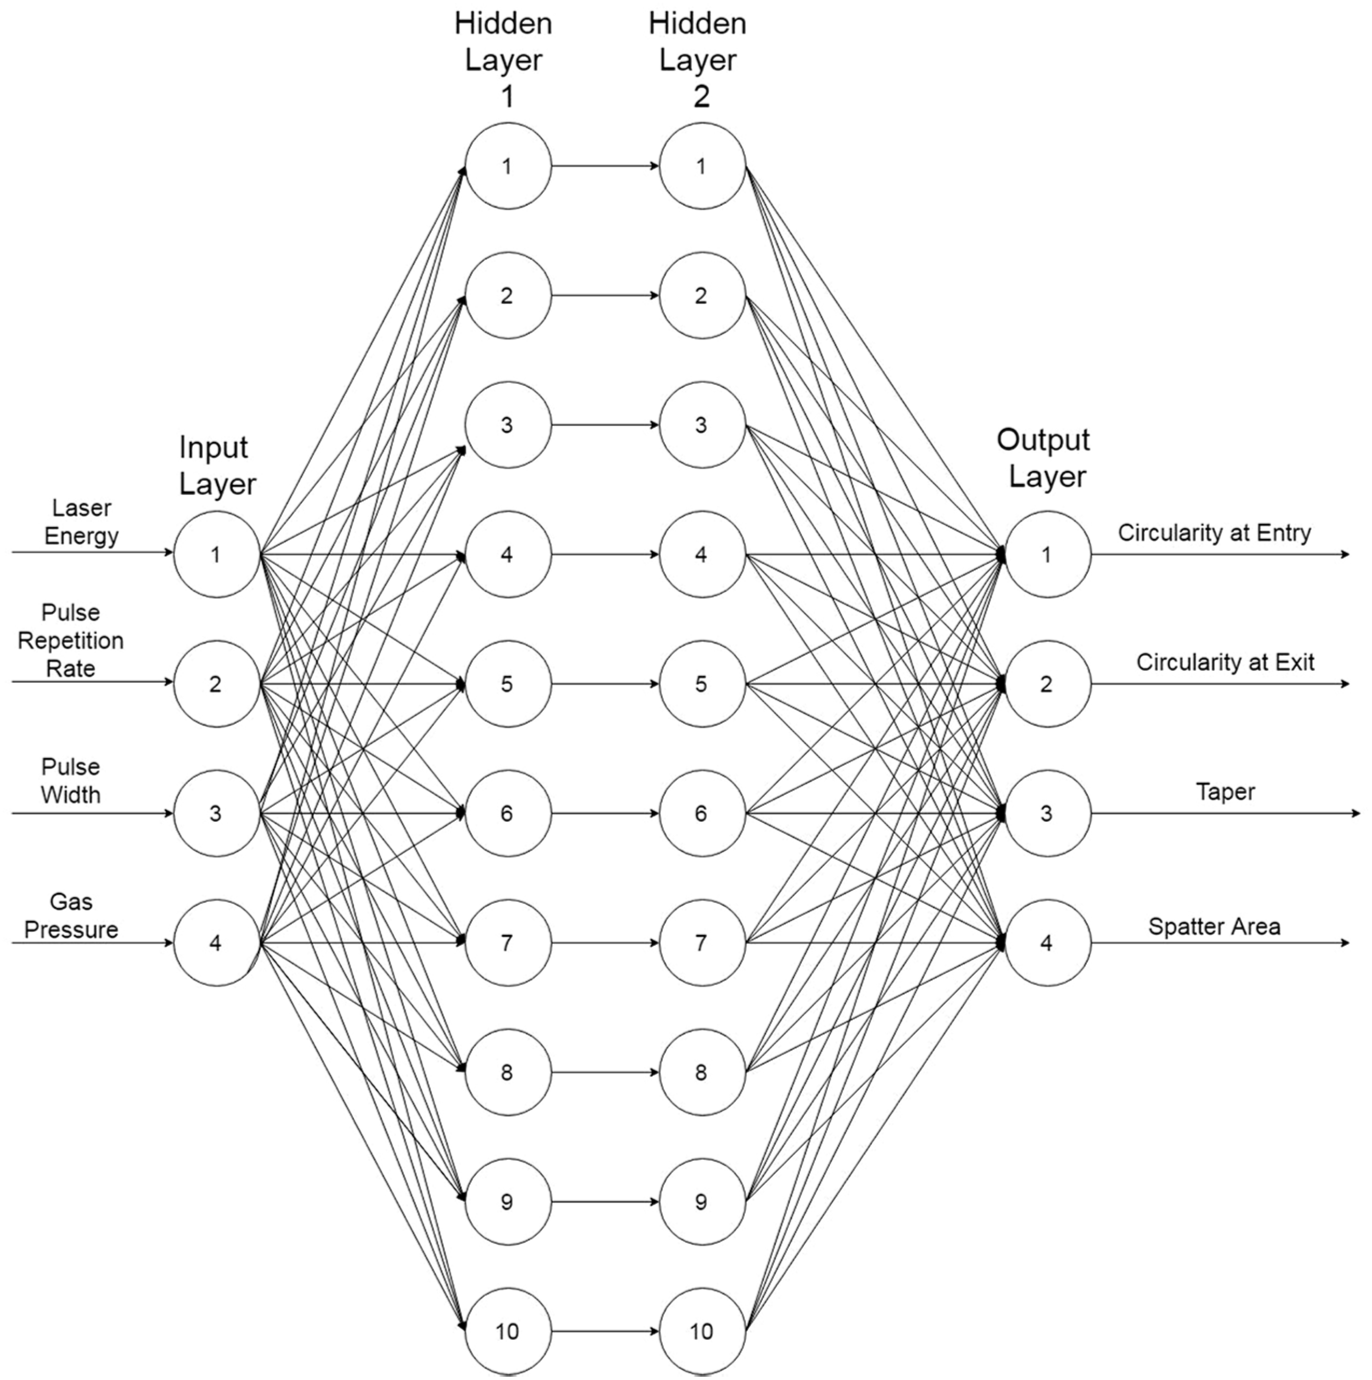
Architecture of ANN for laser drilling of Ti6Al4V.
Let
Output from a neuron in the input layer is as follows

Output from a neuron in the hidden layer is as follows
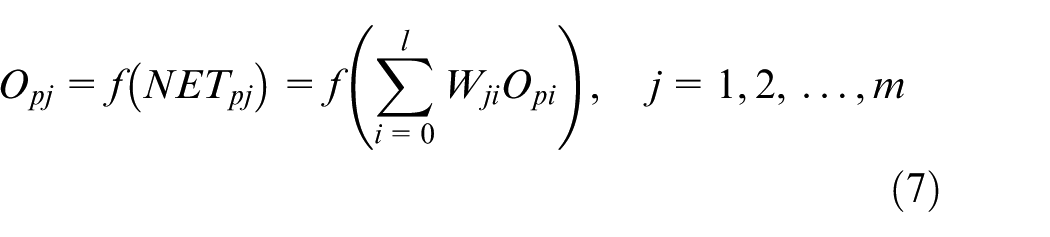
Output from a neuron in the output layer is as follows
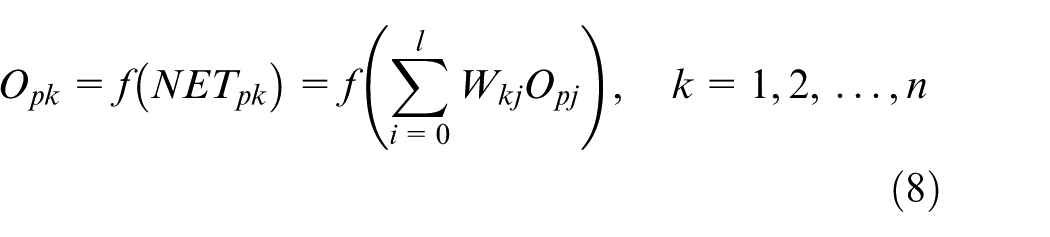
Sigmoid transfer function
A bounded, monotonic, non-decreasing, S-shaped function provides a graded non-linear response. It includes the logistic sigmoid function
where x is the input parameters taken as described above.
Learning or training in backpropagation neural network
Batch mode type of supervised learning has been used in the present case in which interconnection weights are adjusted using delta rule algorithm after sending the entire training sample to the network. During training, the predicted output is compared with the desired output, and the mean square error is calculated. If the mean square error is more than a prescribed limiting value, it is back propagated from output to input, and weights are further modified till the error or number of iterations is within a prescribed limit.
Mean square error, Ep, for pattern p is defined as follows
where Dpi is the target output and Opi is the computed output for the ith pattern.
Weight change at any time t is given by


Results and discussion
In this study, laser drilling on Ti6Al4V has been carried out to determine the performance characteristics such as circularity entry and exit, taper and spatter area summarized in Table 2. Analysis of variance (ANOVA) has been performed to understand the statistical significance of process parameters on each performance measure. ANOVA table shows that the terms A, B and C are significant terms for circularity at entry (Table 3). It was observed that parameter D (gas pressure) is a non-significant parameter but contributes 1.41% of variation (percentage contribution). Similarly, ANOVA table shown in Table 4 indicates that terms B and C are the significant parameters for circularity at exit and parameter D having percentage contribution of 2.41%. ANOVA table (Table 5) shows that A, B, C, D and A × D are statistical significant terms for taper in laser drilled holes. The ANOVA for spatter area (Table 6) shows that the terms A and C are the statistical significant terms. The terms B and D are non-significant terms because they exhibit percentage contributions of 0.86 and 0.71, respectively.
Analysis of variance for circularity at entry.
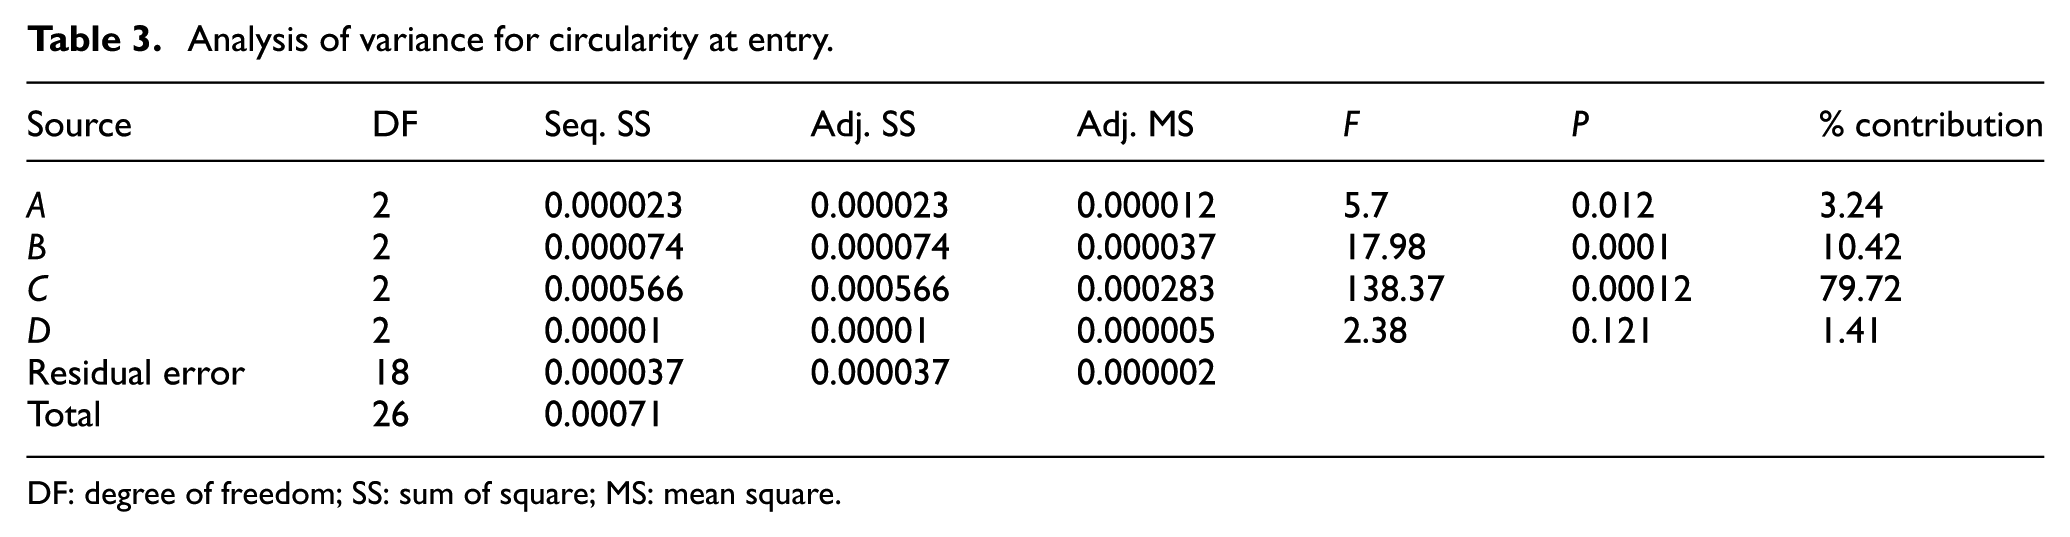
DF: degree of freedom; SS: sum of square; MS: mean square.
Analysis of variance for circularity at exit.
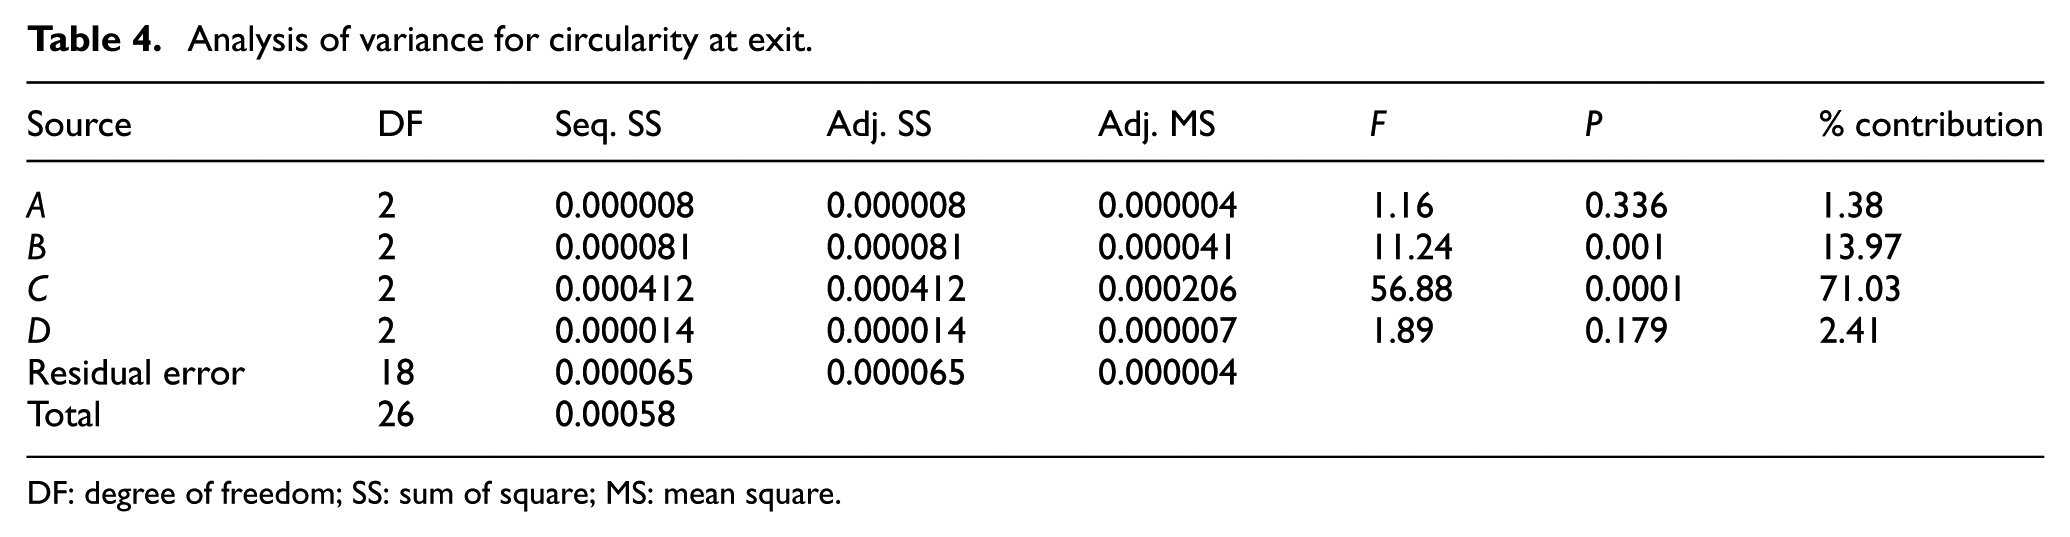
DF: degree of freedom; SS: sum of square; MS: mean square.
Analysis of variance for Taper.
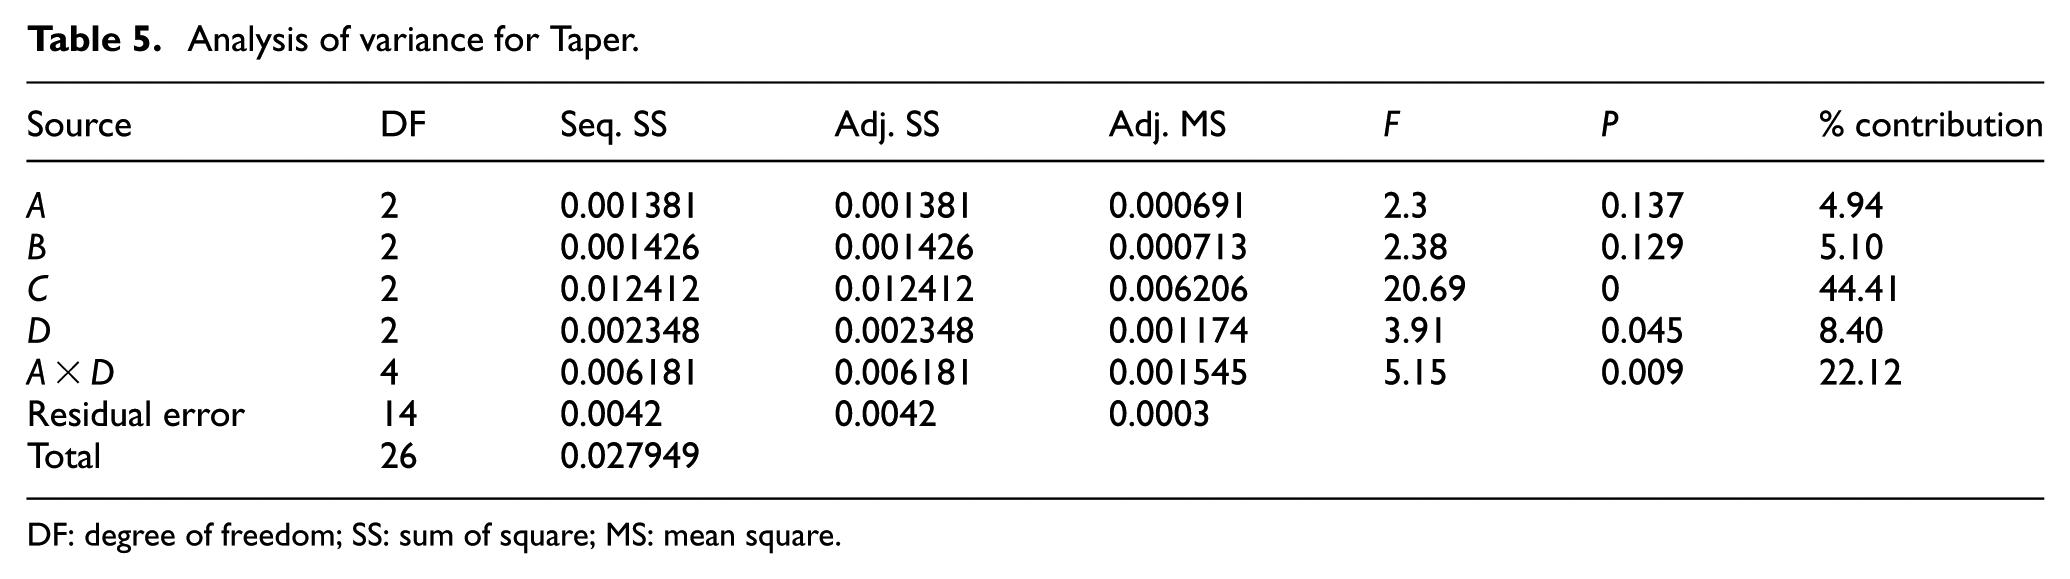
DF: degree of freedom; SS: sum of square; MS: mean square.
Analysis of variance for spatter area.
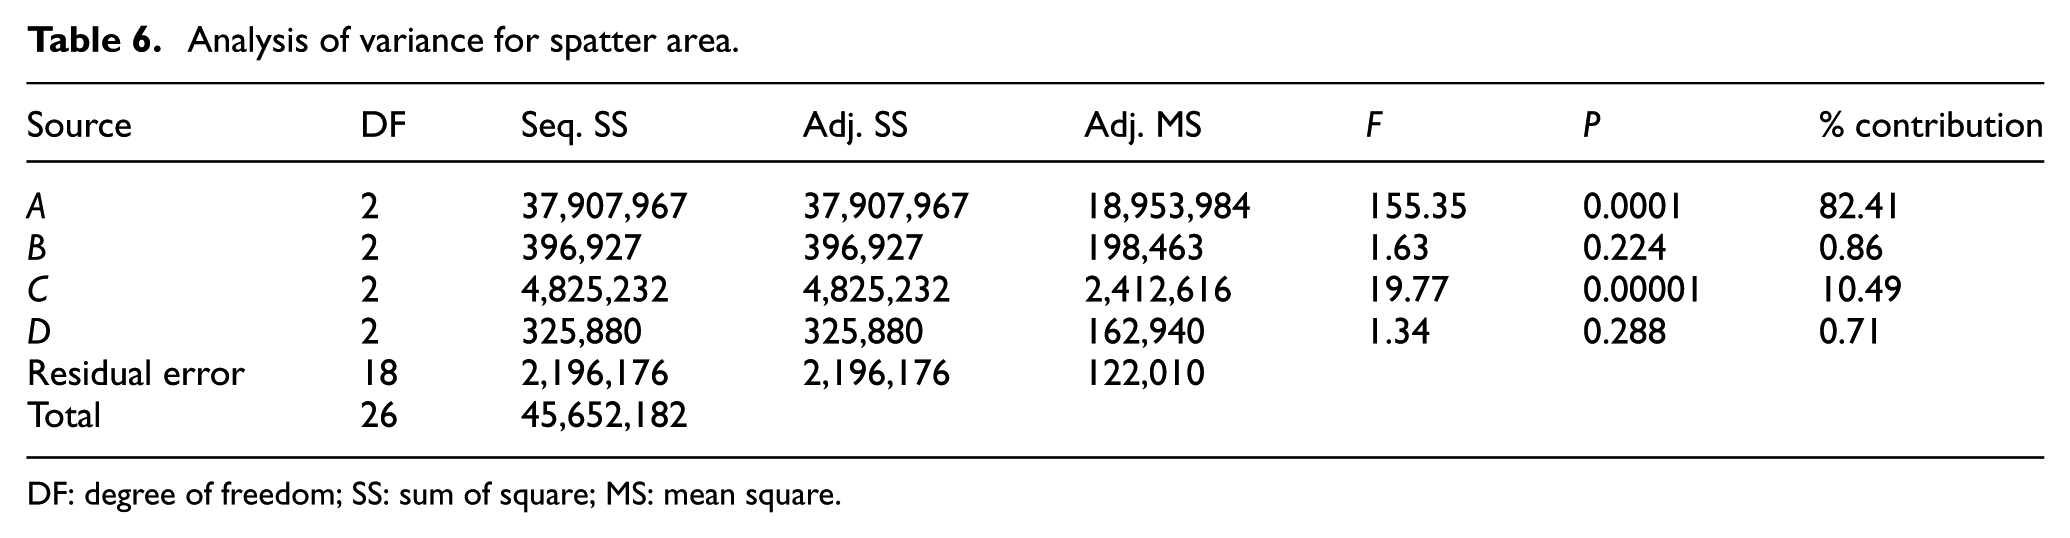
DF: degree of freedom; SS: sum of square; MS: mean square.
The empirical models developed through Taguchi analysis for the four performance measures are given in equations (12)–(15). Statistically valid empirical models relating performance measures with process parameters have been suggested through least square regression analysis. A significant two-factor interaction is found only for taper but not in any other performance measures. Mostly the models are linear models except for taper. Co-efficient of determination (R2) obtained are 94.8%, 88.8%, 85% and 95.2% for circularity at entry, circularity at exit, taper and spatter area, respectively
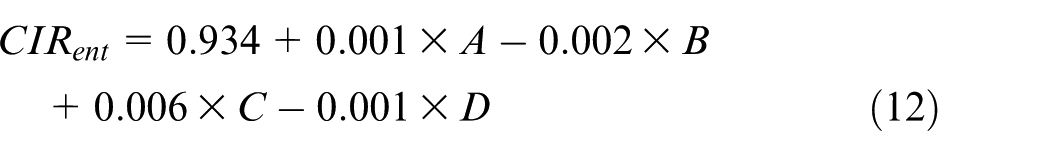
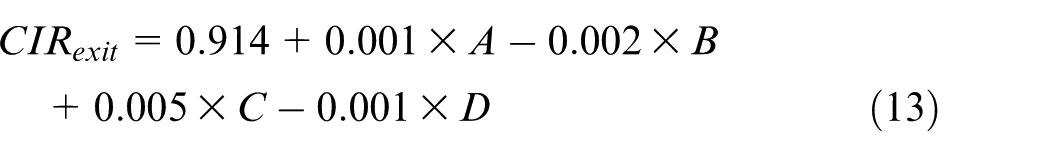
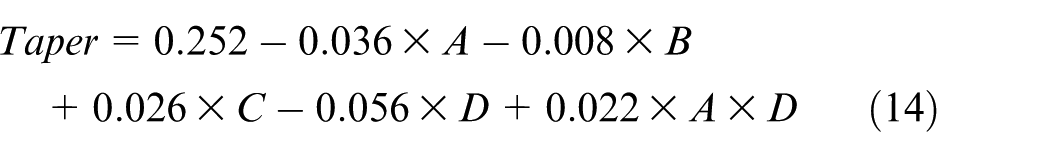
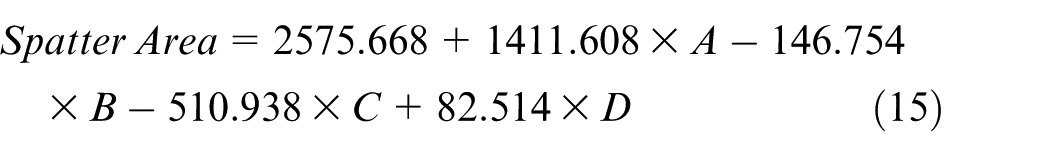
where CIRent is the circularity at entry, CIRexit is the circularity at exit, A is the laser energy, B is the pulse repetition rate, C is the pulse width and D is the flushing pressure.
To explore the effect of process parameters on the performance measures, main effect plots have been developed. Figures 6–9 show the main effect plots for circularity at entry, circularity at exit, taper and spatter area, respectively. The main effect plot (Figure 6) shows that circularity at entry increases with the increase in laser energy. Increase in laser energy leads to increase in the material removal rate from the assigned cross section of the job resulting in improving the circularity at entry. The main effect plot also suggests that increase in pulse repetition rate leads to decrease in circularity at entry. When the pulse repetition rate increases, pulse off time (time between two successive incidents of laser beam) becomes very short. During the short pulse off time, molten material does not get enough time to solidify resulting in molten material gets agitated and settle down near the drilled area in improper manner. This phenomenon causes lower circularity as the pulse repetition time increases. Figure 6 also shows that circularity at entry increases with increase in pulse width. Increase in pulse width leads to increase in circularity at entry because high laser power produced at high pulse width causes increase in rate of material ejection. Main effect plot (Figure 6) indicates that increase in flushing pressure leads to decrease in circularity at entry. When flushing gas pressure increases, increase in agitation of molten material occurs causing improper material ejection. Improper material ejection leads to minimize the circularity at entry. Optical images for all the experimental runs have been taken for calculating the values of circularity at entry. Figure 7 is a pictorial representation of experimental run numbers 1, 10 and 19 in which laser energy is varied from low, medium and high level, respectively. Figure 7 suggests that circularity at entry increases with the increase in laser energy.
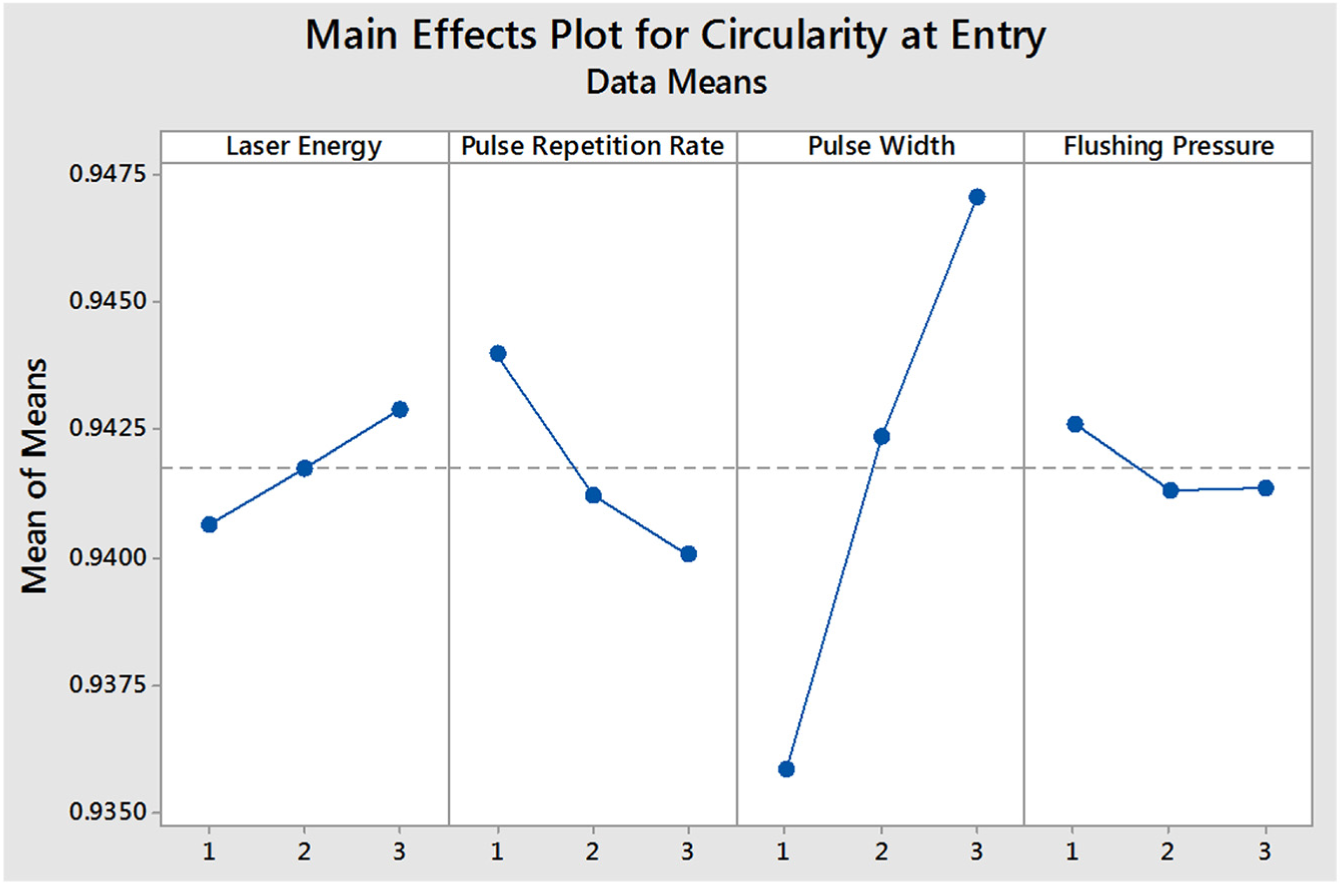
Main effect plot for circularity at entry during laser drilling.
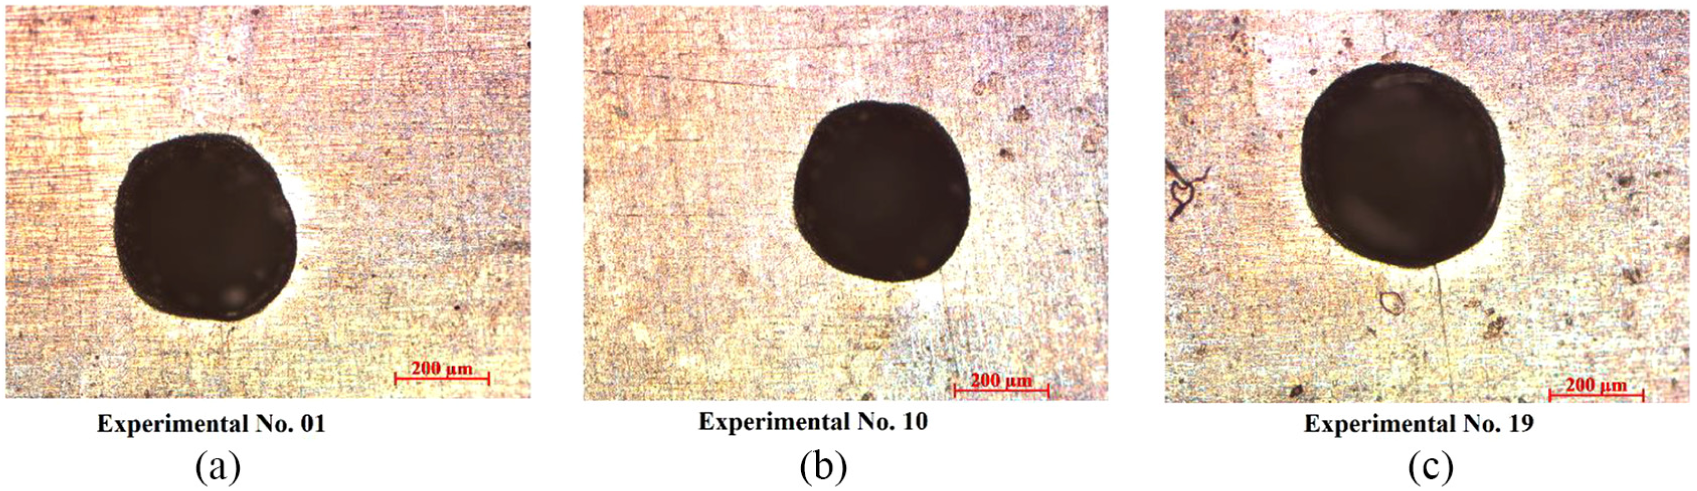
Pictorial representation of circularity at entry: (a) laser energy at low level (circularity at entry = 0.937), (b) laser energy at middle level (circularity at entry = 0.9376) and (c) laser energy at high level (circularity at entry = 0.9441).
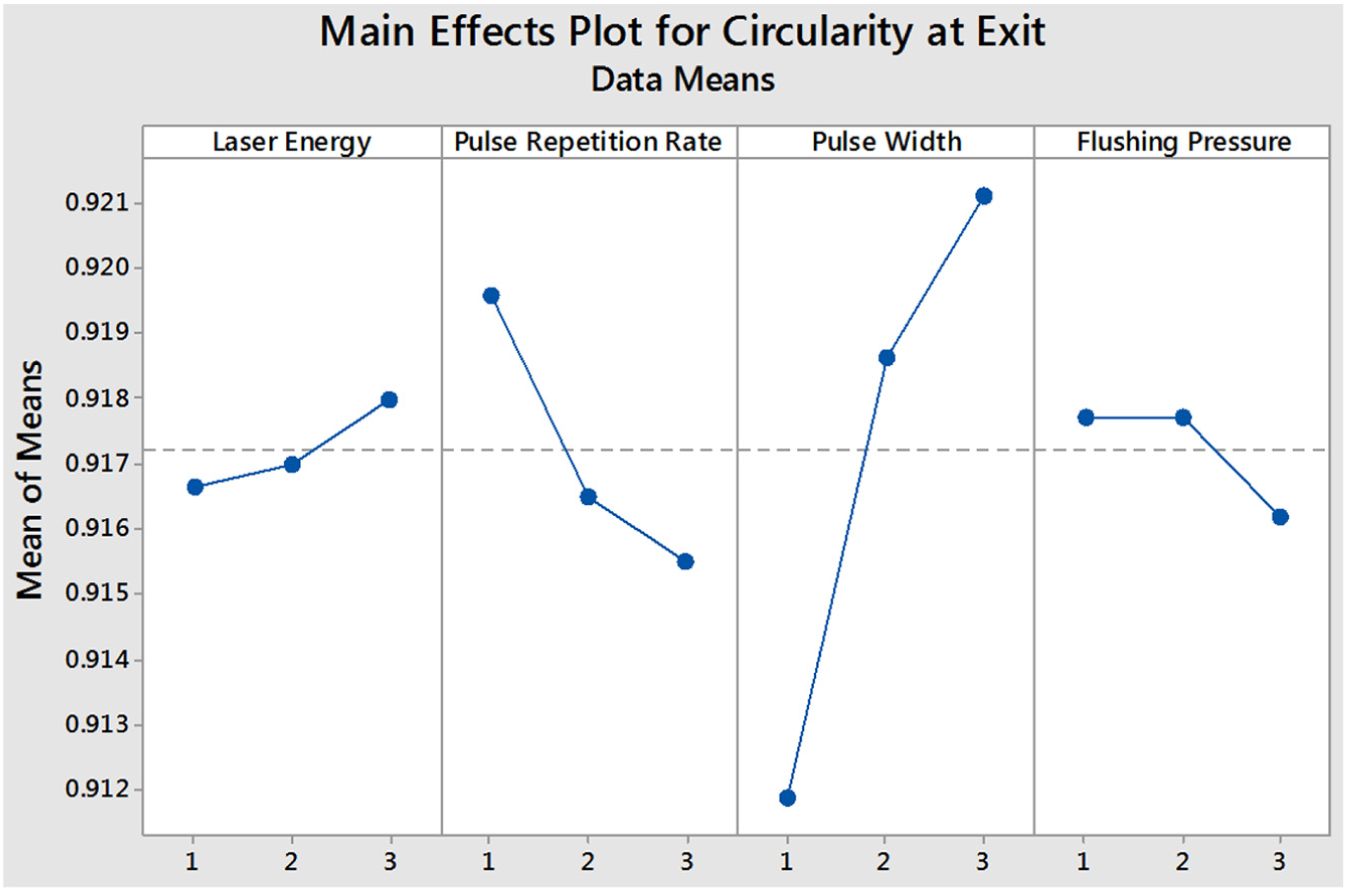
Main effect plot for circularity at exit during laser drilling.
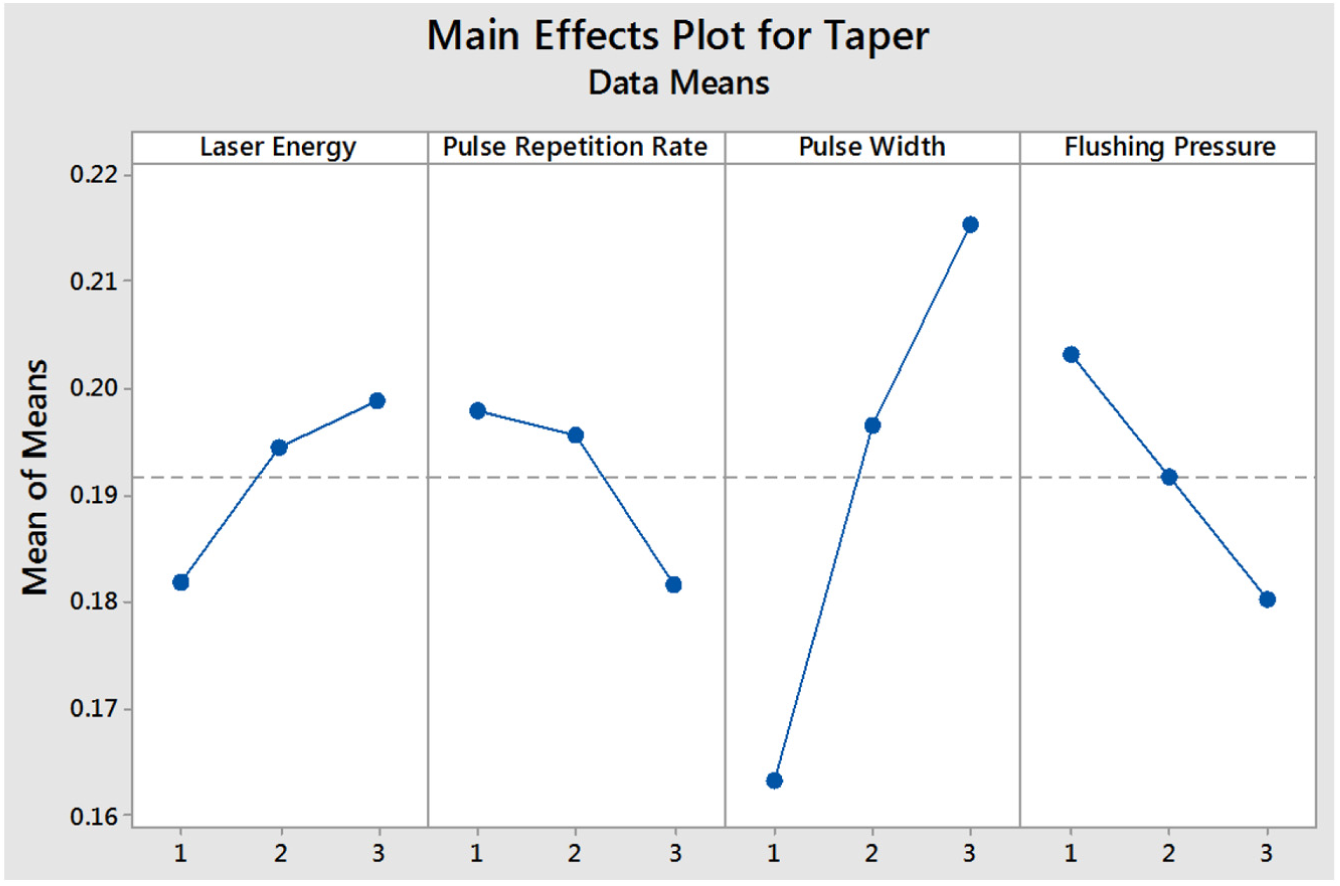
Main effect plot for taper during laser drilling.
Figure 8 shows the main effect plot for circularity at exit. The trend obtained in Figure 8 is similar to the trend obtained in Figure 6. The main effect plot (Figure 8) shows that circularity at exit increases with the increase in laser energy. Figure 8 indicates that increase in pulse repetition rate results in decrease in circularity at exit, whereas increase in pulse width leads to increase in circularity at exit. However, circularity at exit increases slightly with increase in flushing pressure but further increase in flushing pressure causes decrease in circularity at exit. Higher assistant gas pressure initially helps in ejecting the molten material rapidly from the drilled area but further increase in flushing pressure causes increased agitation of molten material and improper material ejection resulting in decrease in circularity at exit.
Figure 9 indicates the main effect plot for taper of laser drilled hole. Figure 9 shows that taper of the hole increases with the increase in laser energy level. This is due to the fact that material on the top surface gets melted and vaporized instantly when a high energy laser beam falls at the top surface of the workpiece. As the laser passes over the thickness, its strength decreases and reduces material removal resulting in high taper in the hole. From Figure 9, it was observed that taper monotonously decreases with the increase in pulse repetition rate. At high pulse repetition rate, the rate of material ejection increases due to high penetration producing low taper. Figure 9 shows that taper monotonously increases with pulse width. At low pulse width, high power concentrated laser beam is produced leading to increase in the penetration and results in low taper. Figure 9 also indicates that taper decreases with the increase in flushing pressure. At high flushing pressure, the molten material from the top surface gets properly flushed away. Increase in flushing pressure does not allow the molten material to settle down inside the hole periphery leading to reduction of taper with increase in pressure.
Figure 10 shows the main effect plot for spatter area during laser drilling operation. Figure 10 indicates that spatter area increases with the increase in laser energy level. As the laser energy increases, the vapour pressure within the drilling area increases causing increase in rate of material removal. As a result, spatter area increases. Figure 10 indicates that spatter area increases with the increase in pulse width. With the increase in pulse width, thermal energy input increases and it results in increase in material removal as well as spatter area. Figure 10 shows that spatter area reduces with the increase in pulse repetition rate (pulse frequency) because of development of laser supported absorption (LSA) wave. LSA may cause the blockage of input thermal energy which causes reduction of material ejection. As a result, spatter area decreases. Figure 10 also shows that spatter area increases initially with the increase in flushing pressure, but it decreases after a certain value of flushing pressure. At the initial machining level with the increase in flushing pressure helps in ejecting the molten material rapidly from the drilled area. As a result, the drilling depth and spatter area increase. Spatter area decreases after certain level with the increase in flushing pressure. This may be due to at after certain machining time material removal rate decreases, at low material ejection rate and with the increase in high flushing pressure results in decrement of spatter area.
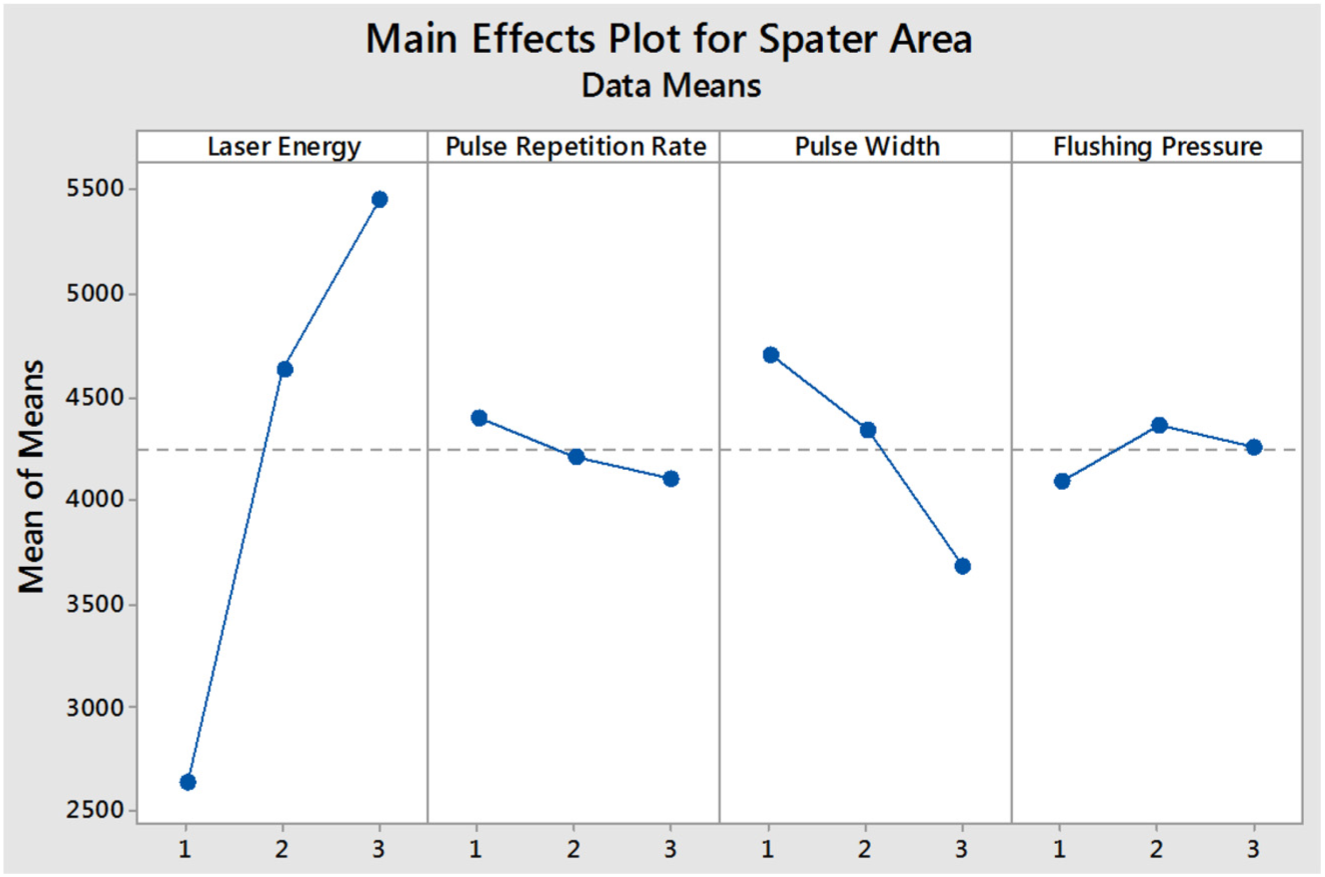
Main effect plot for spatter area during laser drilling.
Analysis of linear graphs obtained through Taguchi method provides the optimal parametric setting for the quality characteristics as listed in Table 7.
Optimal parametric setting for Ti6Al4V laser drilled hole from statistical analysis.
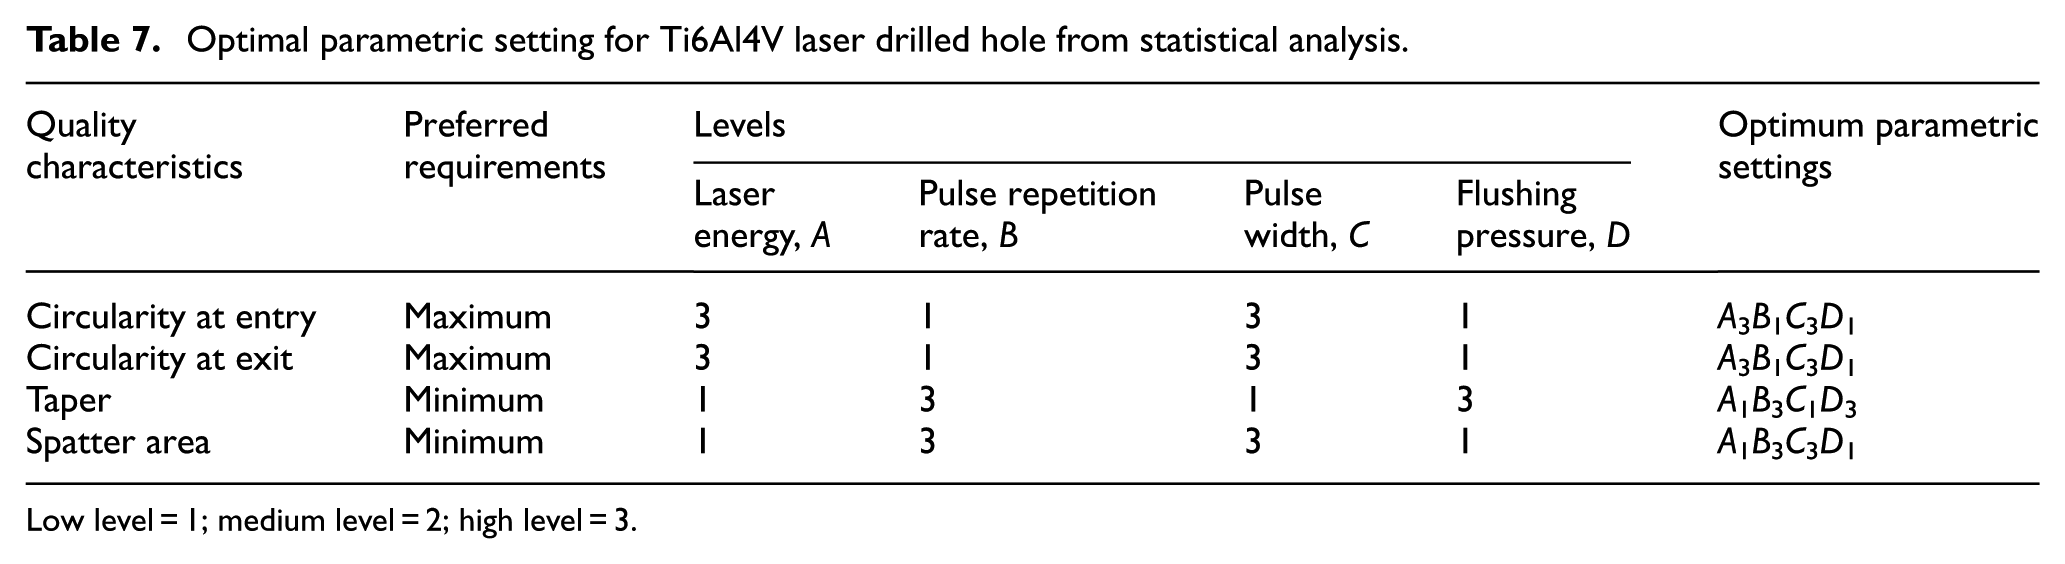
Low level = 1; medium level = 2; high level = 3.
ANN results
To predict the performance measures, ANN is used. A feed-forward backpropagation neural with the architecture (Figure 5) consisting of four layers–input layer, two hidden layers and output layer—is developed. Since ANN with single hidden layer produces large error, two hidden layer network is considered to predict the output with reasonable accuracy. The input layer is having four neurons to represent inputs like laser energy, pulse repetition rate, pulse width and gas pressure. The output layer is having four neurons denoting circularity at entry, circularity at exit, taper and spatter area. Neurons (10 neurons) present in the hidden layers are finalized after several trials based on error minimization. MATLAB 15 is used to design and run the network. Out of 27 experimental data (Table 2), 70% of data (19 experimental data) is used for training the network and 30% of data (eight experimental data) is considered for testing the network. The error on the training set is monitored during the training process. The error during the initial phase of training period decreases fast and then slows down gradually. When the error decreases to a threshold value, training is stopped and the weights at the minimum value of the error are stored. The network is getting converged after 2574 epochs and gradient (mean square error) reaches at 0.0024 as shown in Figure 11 for circularity at entry.
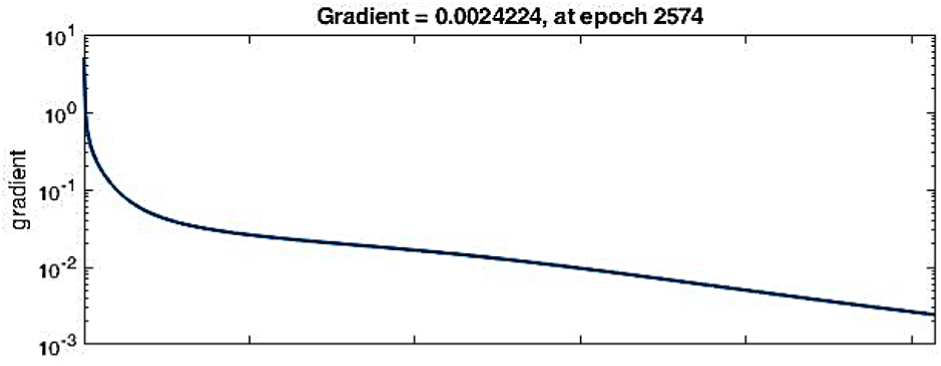
Convergence curve for circularity at entry.
A regression curve is plotted in Figure 12 between actual circularity at entry and predicted circularity at entry via ANN model. It can be observed that data are well fitted because a high degree of coefficient of determination (R2) as 0.9981 is obtained. Similar network training is made for all the performance measures keeping the mean square error within 5%. The testing data predicted from the network is also observed within a mean square error of 5%. This suggests the adequacy of the developed ANN model for further analysis. R2 values of ANN models are given as 99.81%, 99.98%, 99.95% and 99.96%, respectively, for circularity at entry, circularity at exit, taper and spatter area, respectively.
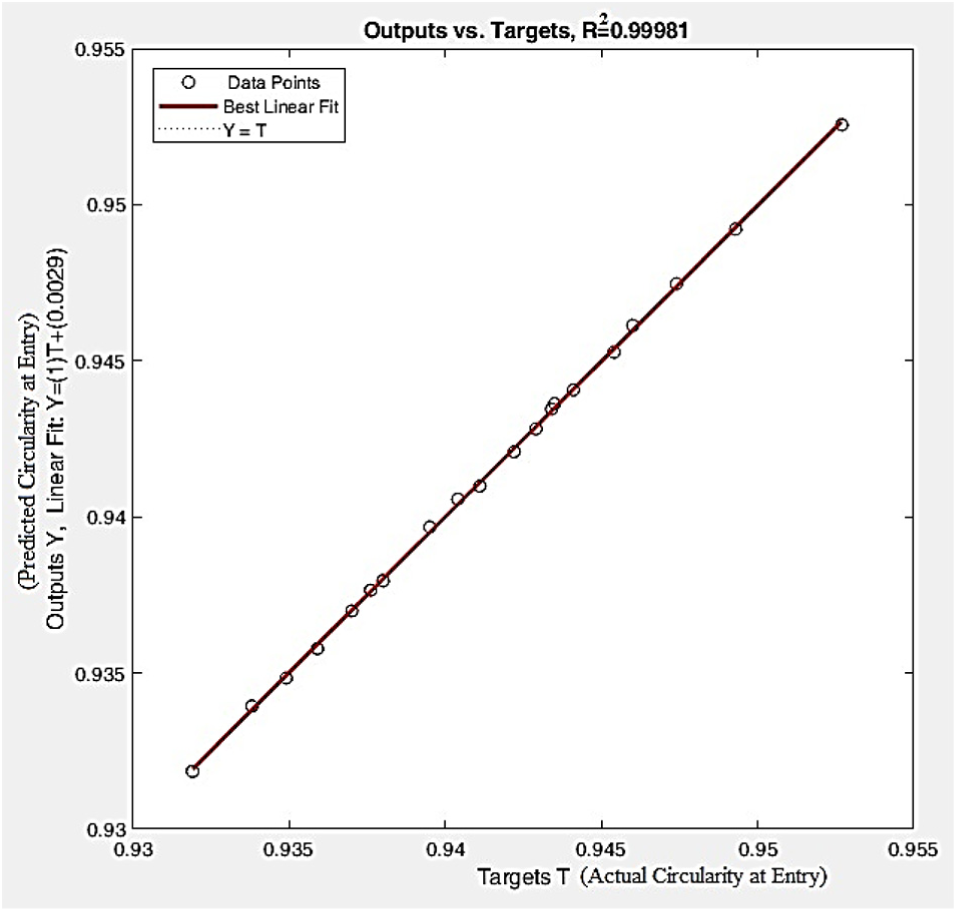
Correlation of actual circularity at entry and predicted circularity at entry (training data).
Figure 13(a) and (b) shows the comparative graph between experimental values and ANN predicted values for the testing data of circularity at entry and exit, respectively. Similarly Figure 14(a) and (b) exhibits the comparison of experimental and ANN predicted values for testing data of taper and spatter area, respectively.
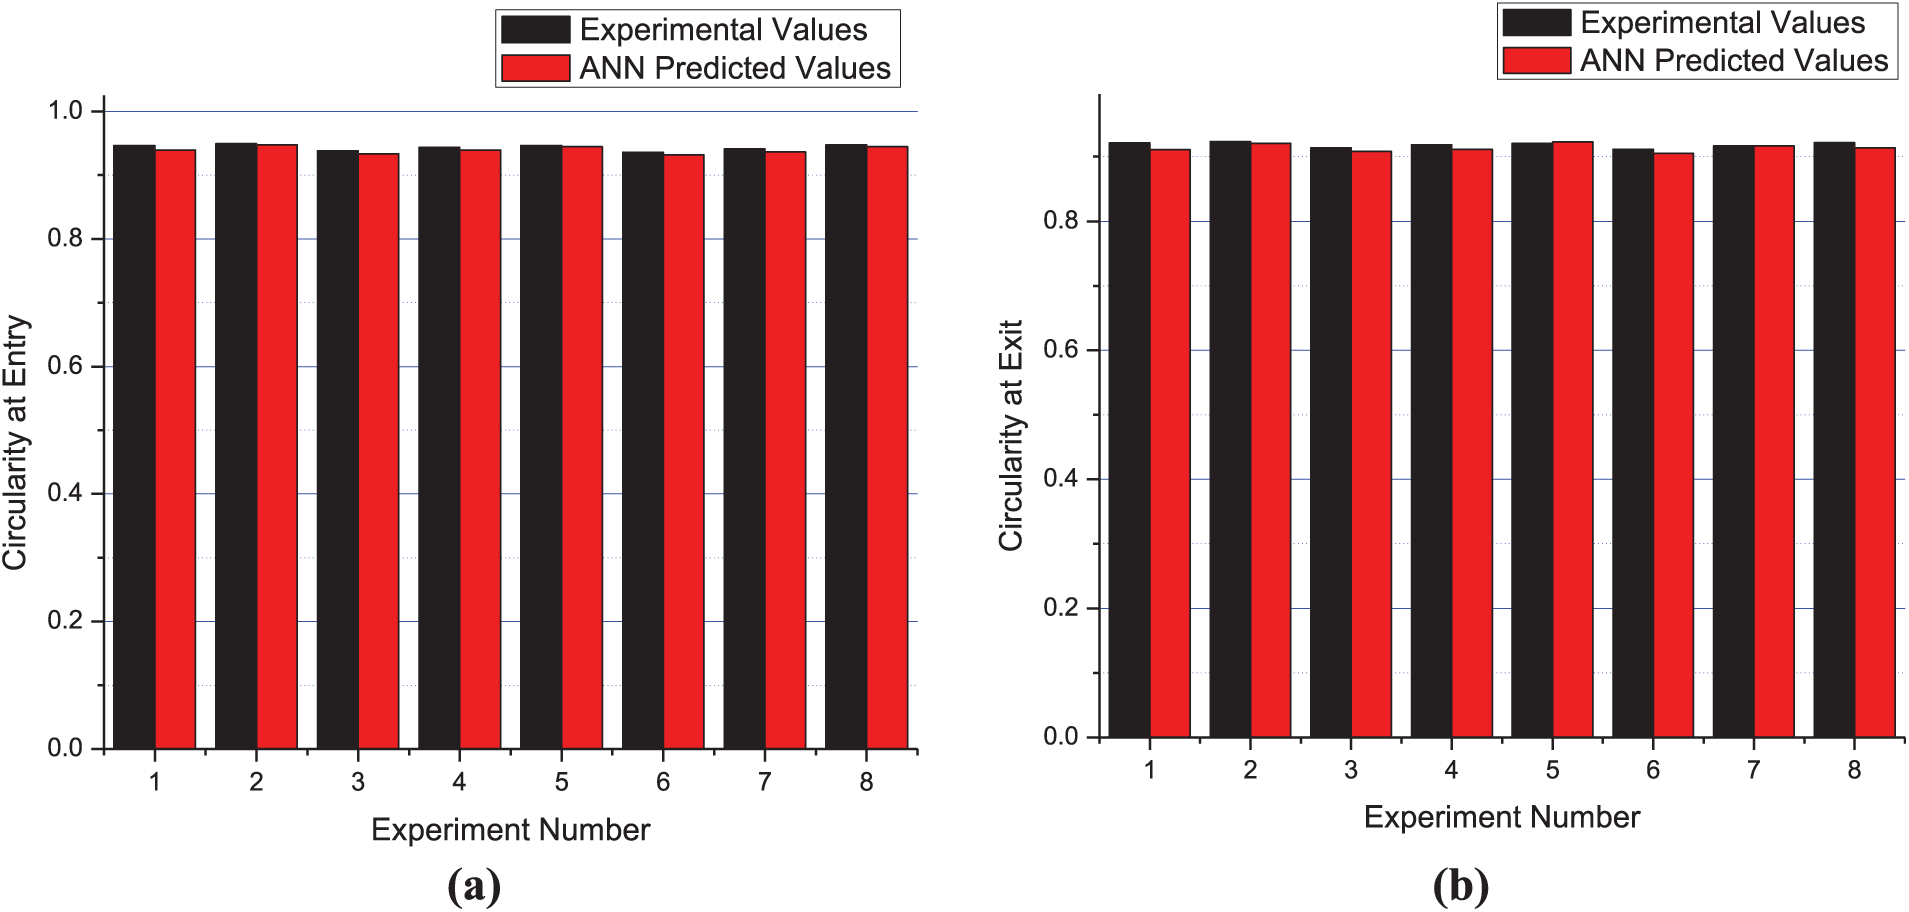
Comparative plot of experimental values and ANN predicted testing data for (a) circularity at entry and (b) circularity at exit.
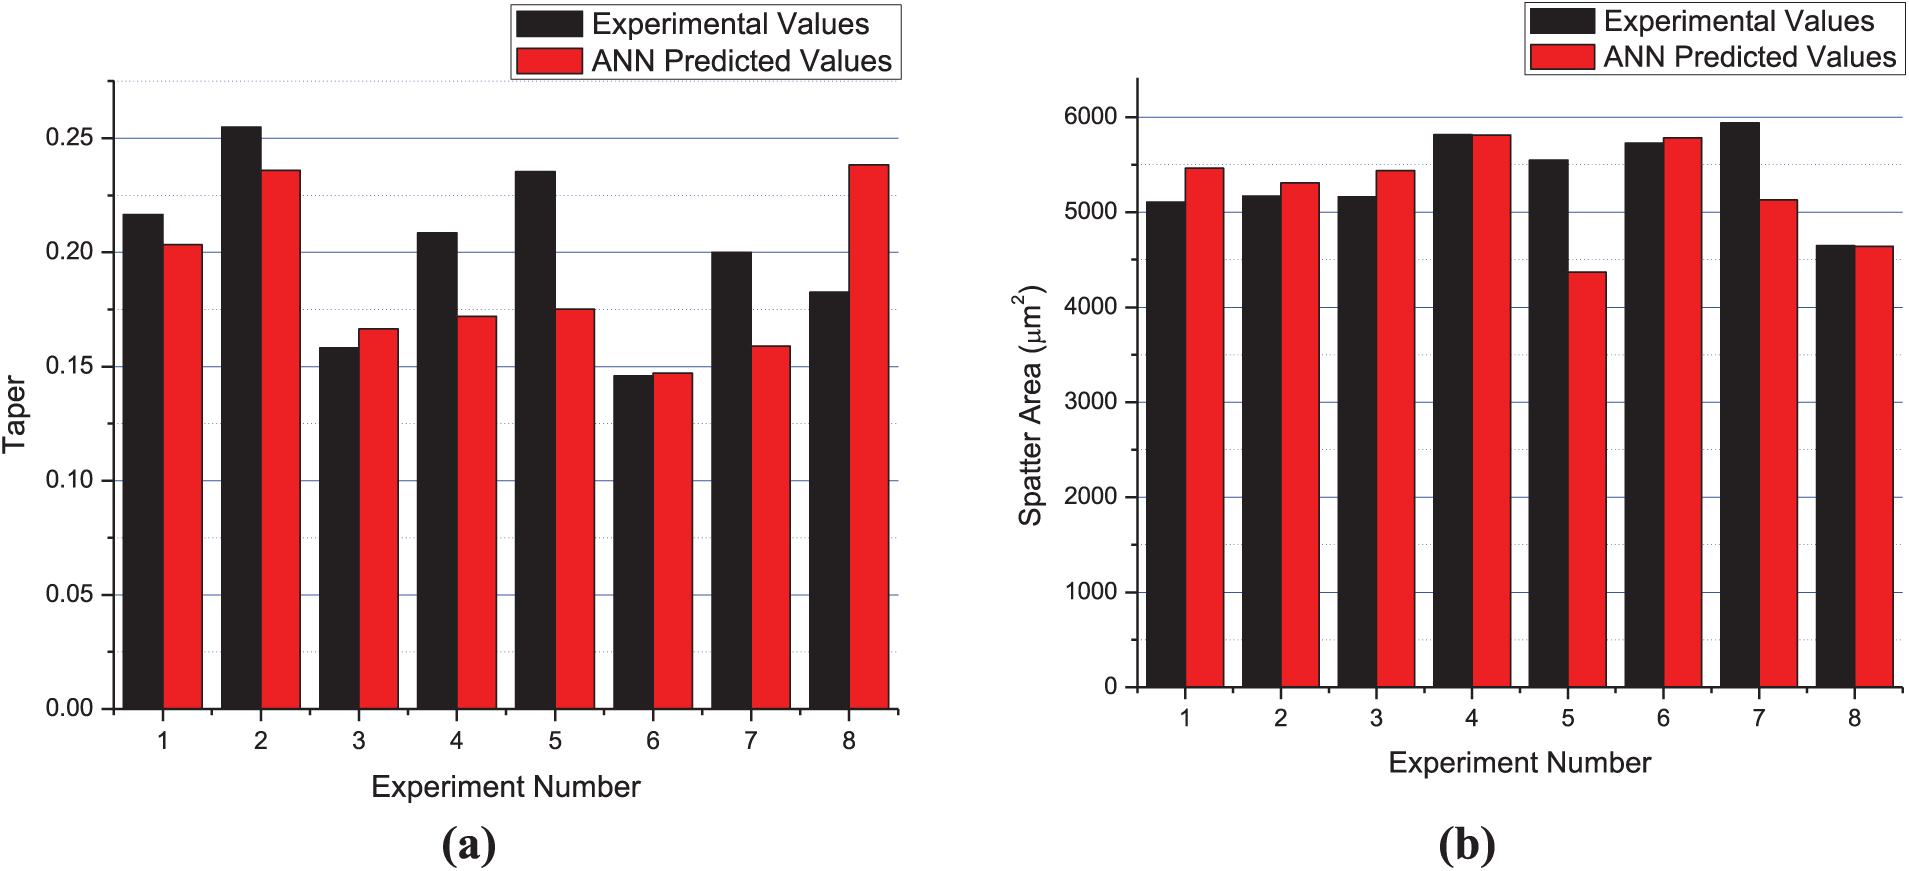
Comparative plot of experimental values and ANN predicted testing data for (a) taper and (b) spatter area.
Prediction of outputs from neural network
To check the adequacy and robustness of the adopted methodology (ANN), the experimental values are compared with predicted values from ANN and empirical models (Table 8). Mean relative error of 0.001, 0.001, 0.1741 and 0.0849 for circularity at entry, circularity at exit, taper and spatter area, respectively, is obtained when experimental values are compared with empirical models. ANN model produces mean relative error of 0.001, 0.001, 0.0437 and 0.0234, respectively, when compared with experimental values. Since small values of mean relative error is obtained, the proposed ANN model is robust and adequate to be used for prediction of quality characteristics of laser micro-drilled holes. In fact, both the models are quite effective in predicting the performance measures with reasonable accuracy. However, ANN model is superior to empirical model because mean relative error is less in case of ANN model for all the performance measures. ANN model can be recommended for prediction purpose because non-linear relation between process parameters with performance measures is effectively taken care of.
Comparison of experimental and predicted values.
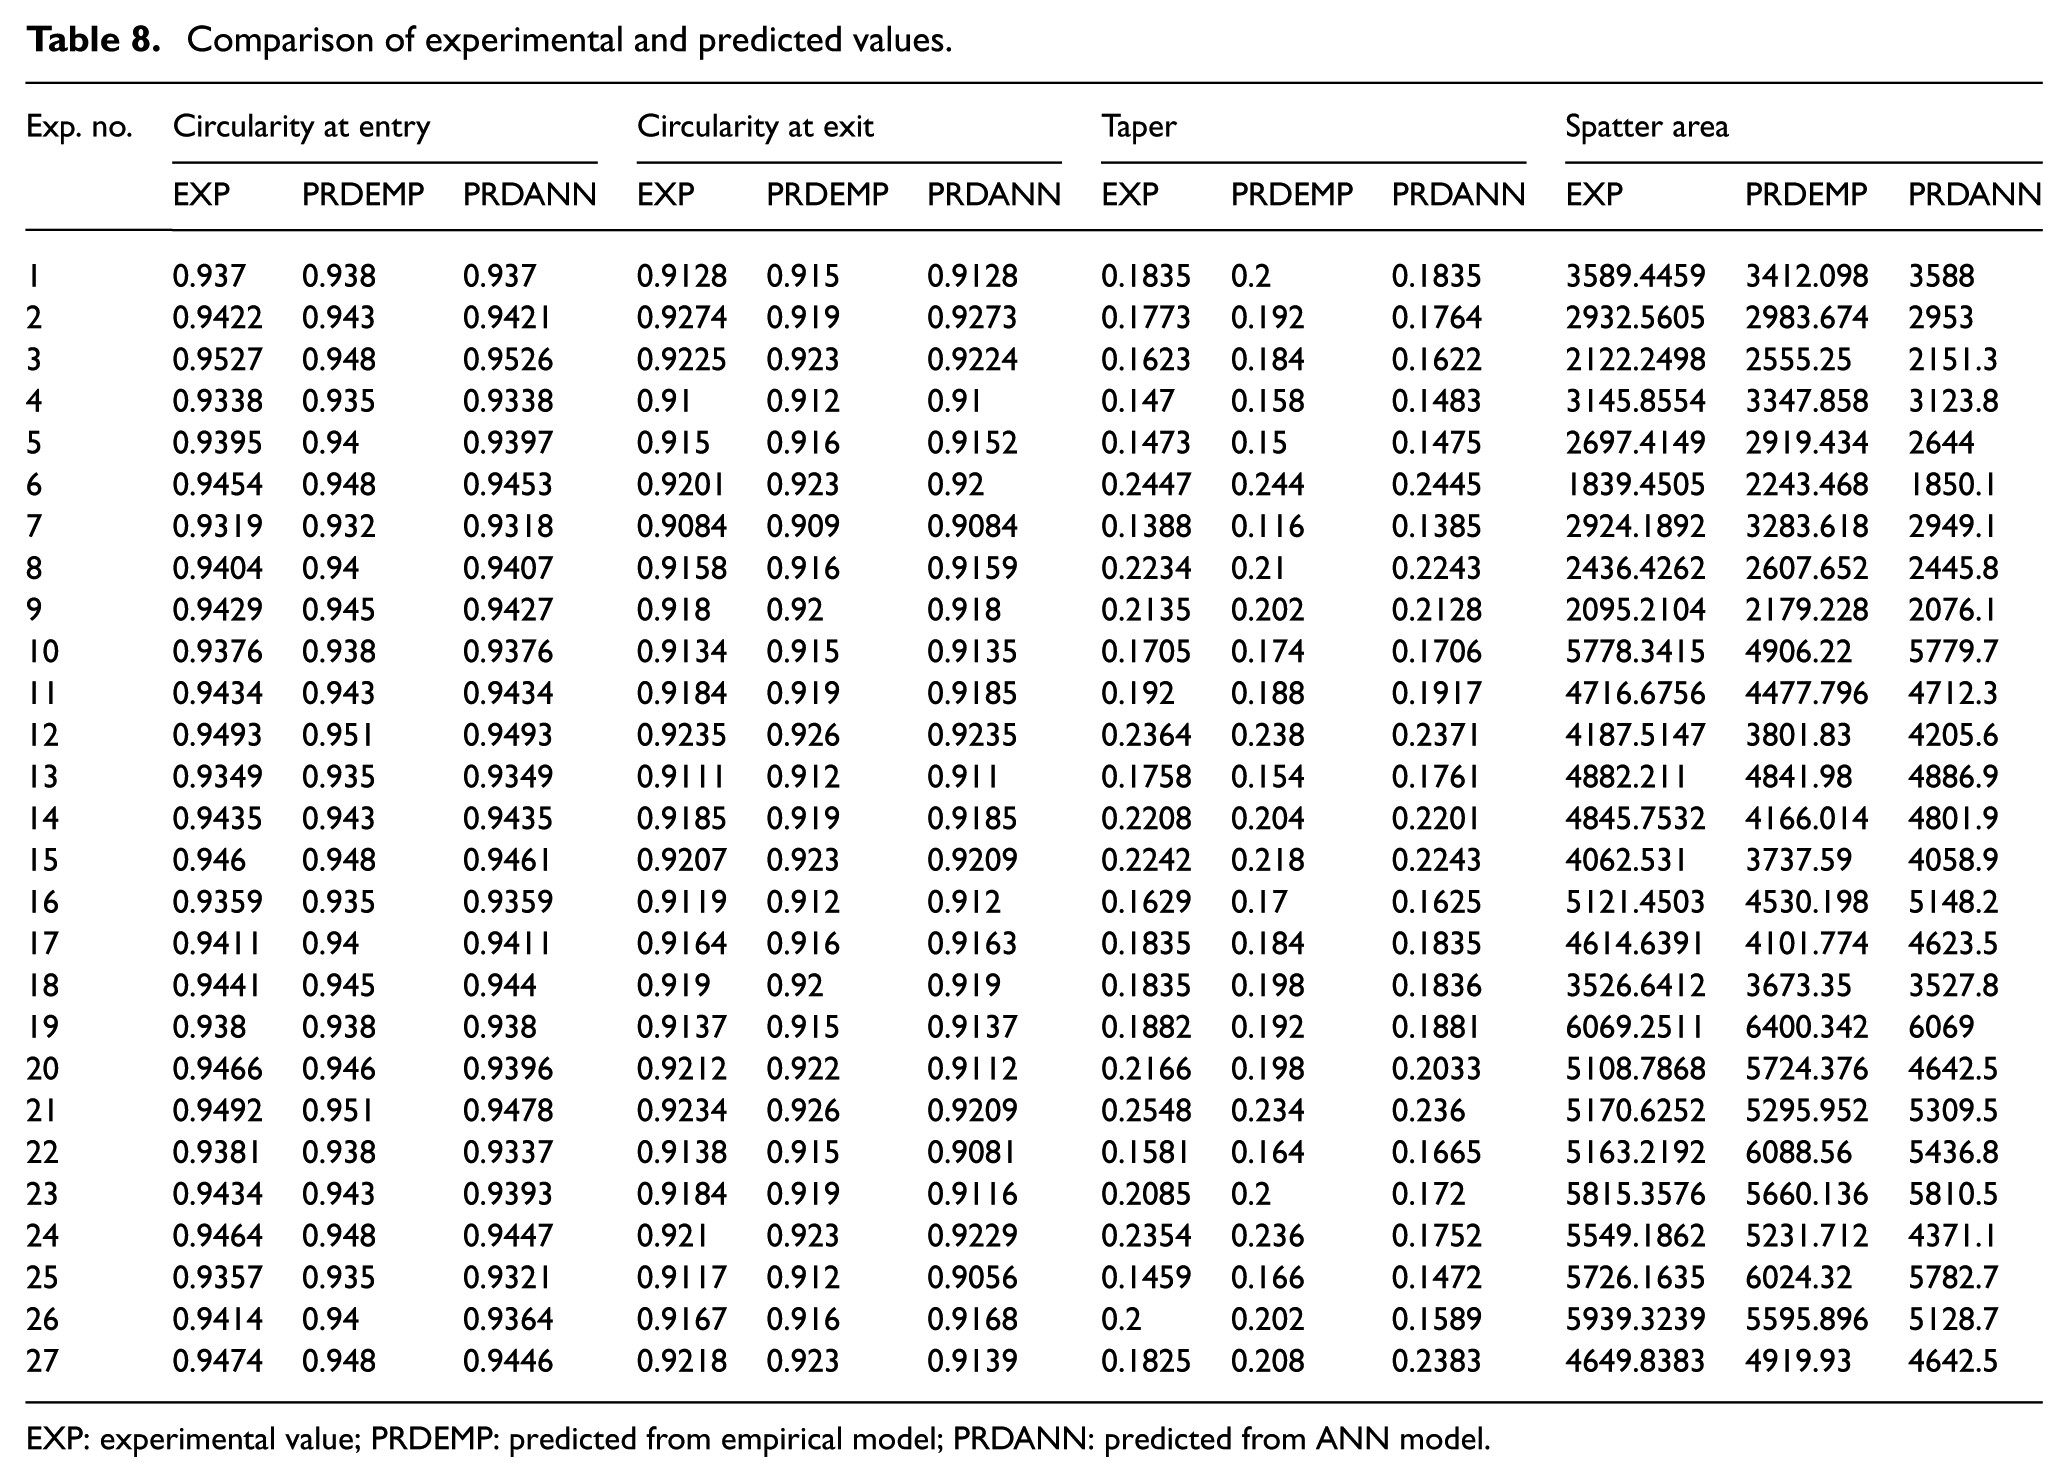
EXP: experimental value; PRDEMP: predicted from empirical model; PRDANN: predicted from ANN model.
To analyse robustness of the proposed experimental strategy, well-trained neural network is used to predict the trend of performance measures with variation in process parameters (Figures 15–18). Figure 15 shows the variation of circularity at entry with laser energy, pulse repletion rate, pulse width and gas pressure. Figure 15(a) and (c) show that circularity at entry increases with the increase in laser energy and pulse width, respectively. Figure 15(b) and (d) exhibits that circularity at entry monotonously decreases with the increase in pulse repetition rate and gas pressure, respectively. The curve for circularity at entry (Figure 15) has good agreement with main effect plot for circularity at entry (Figure 6).
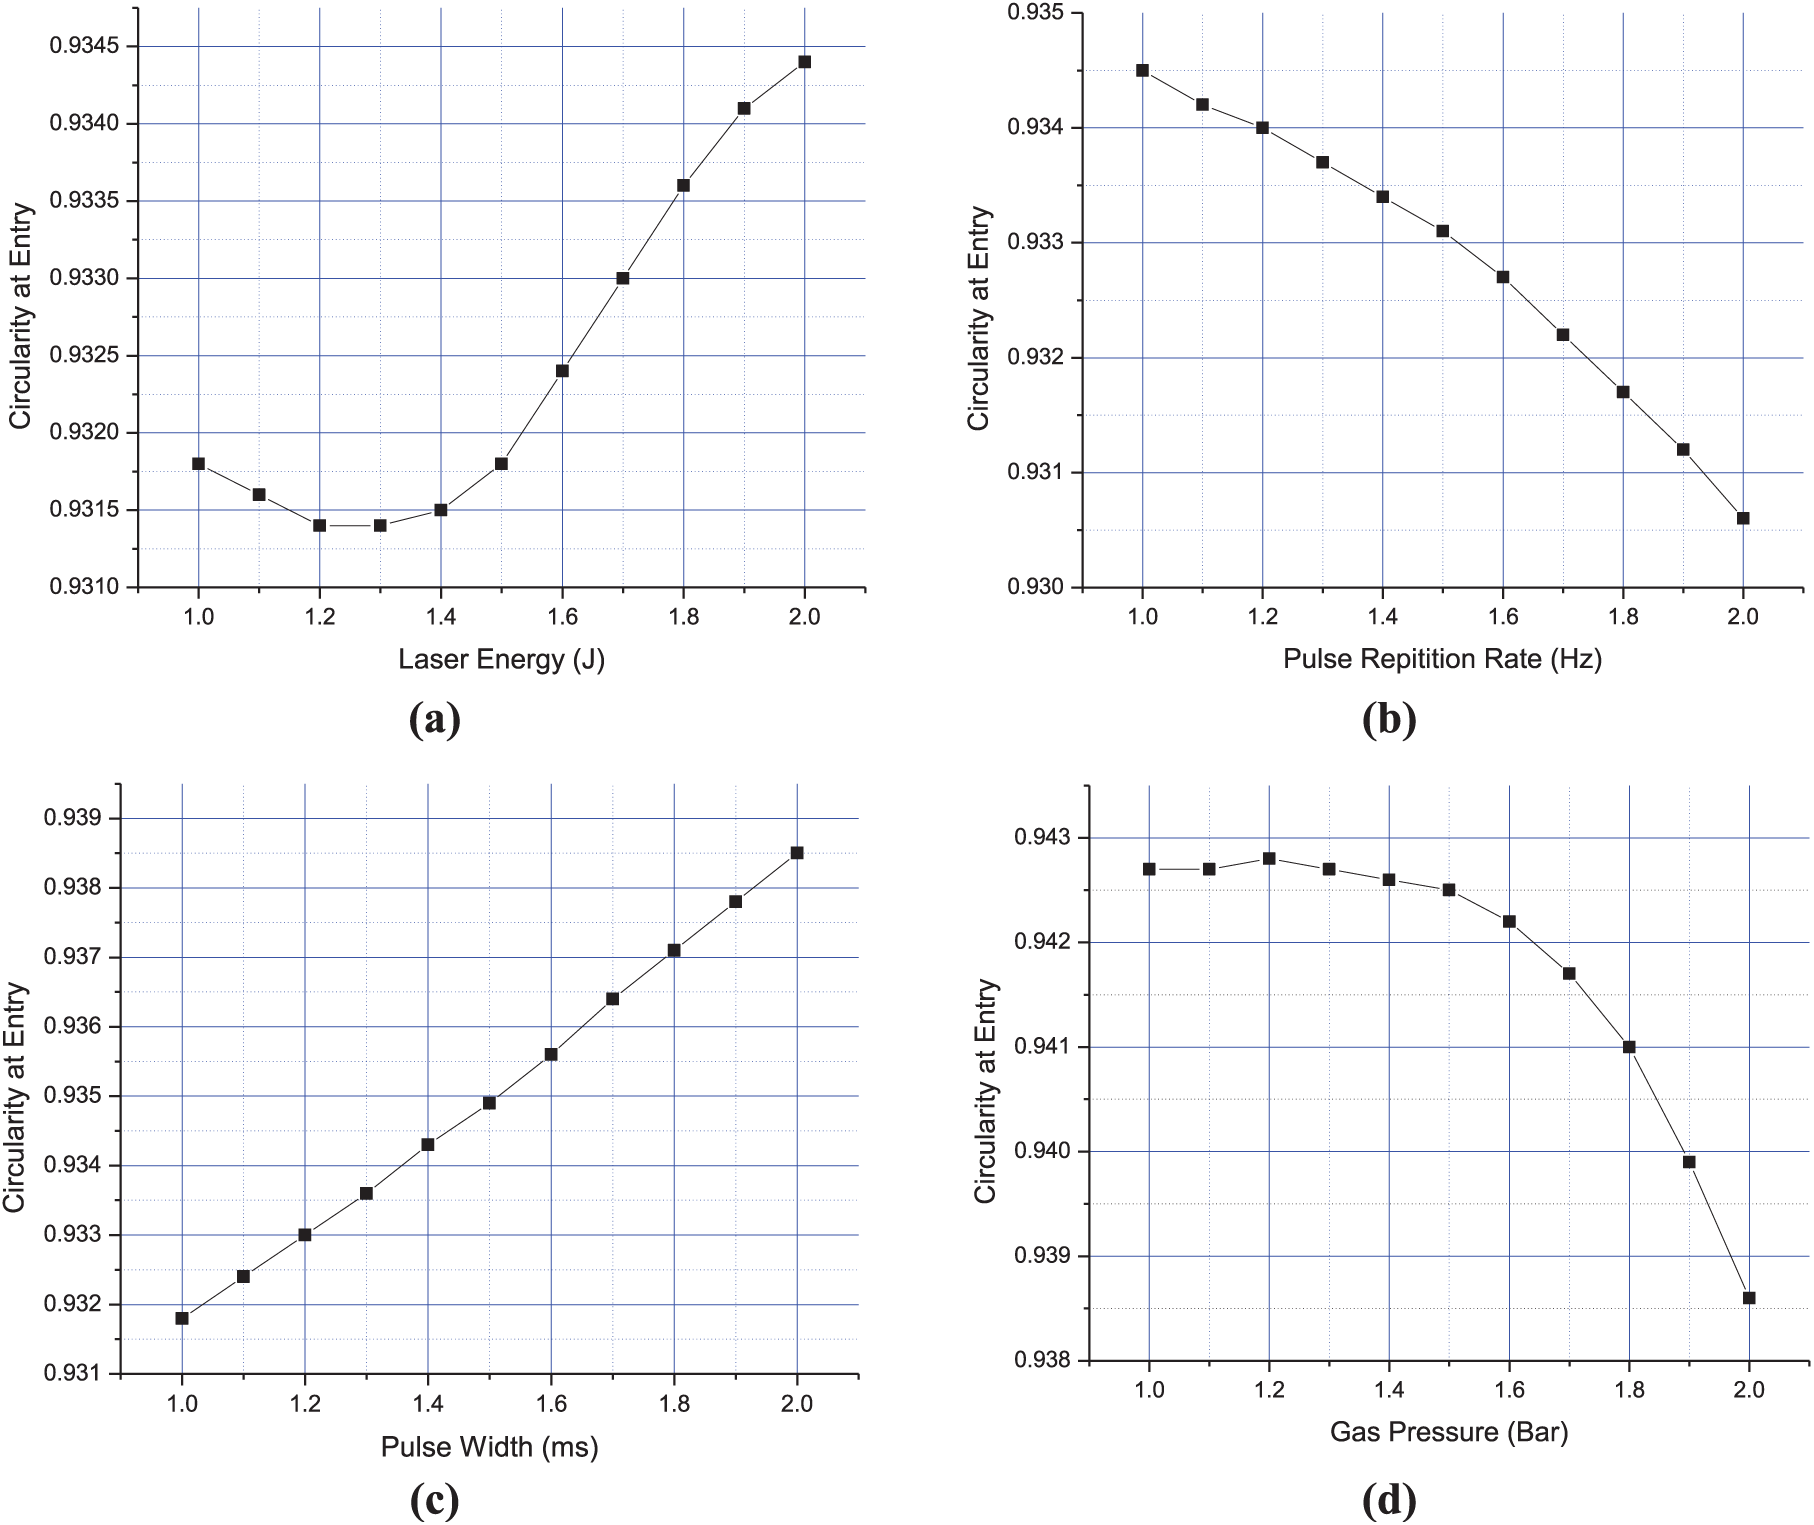
Sensitivity plot for circularity at entry with (a) laser energy, (b) pulse width, (c) pulse repetition rate and (d) gas pressure.
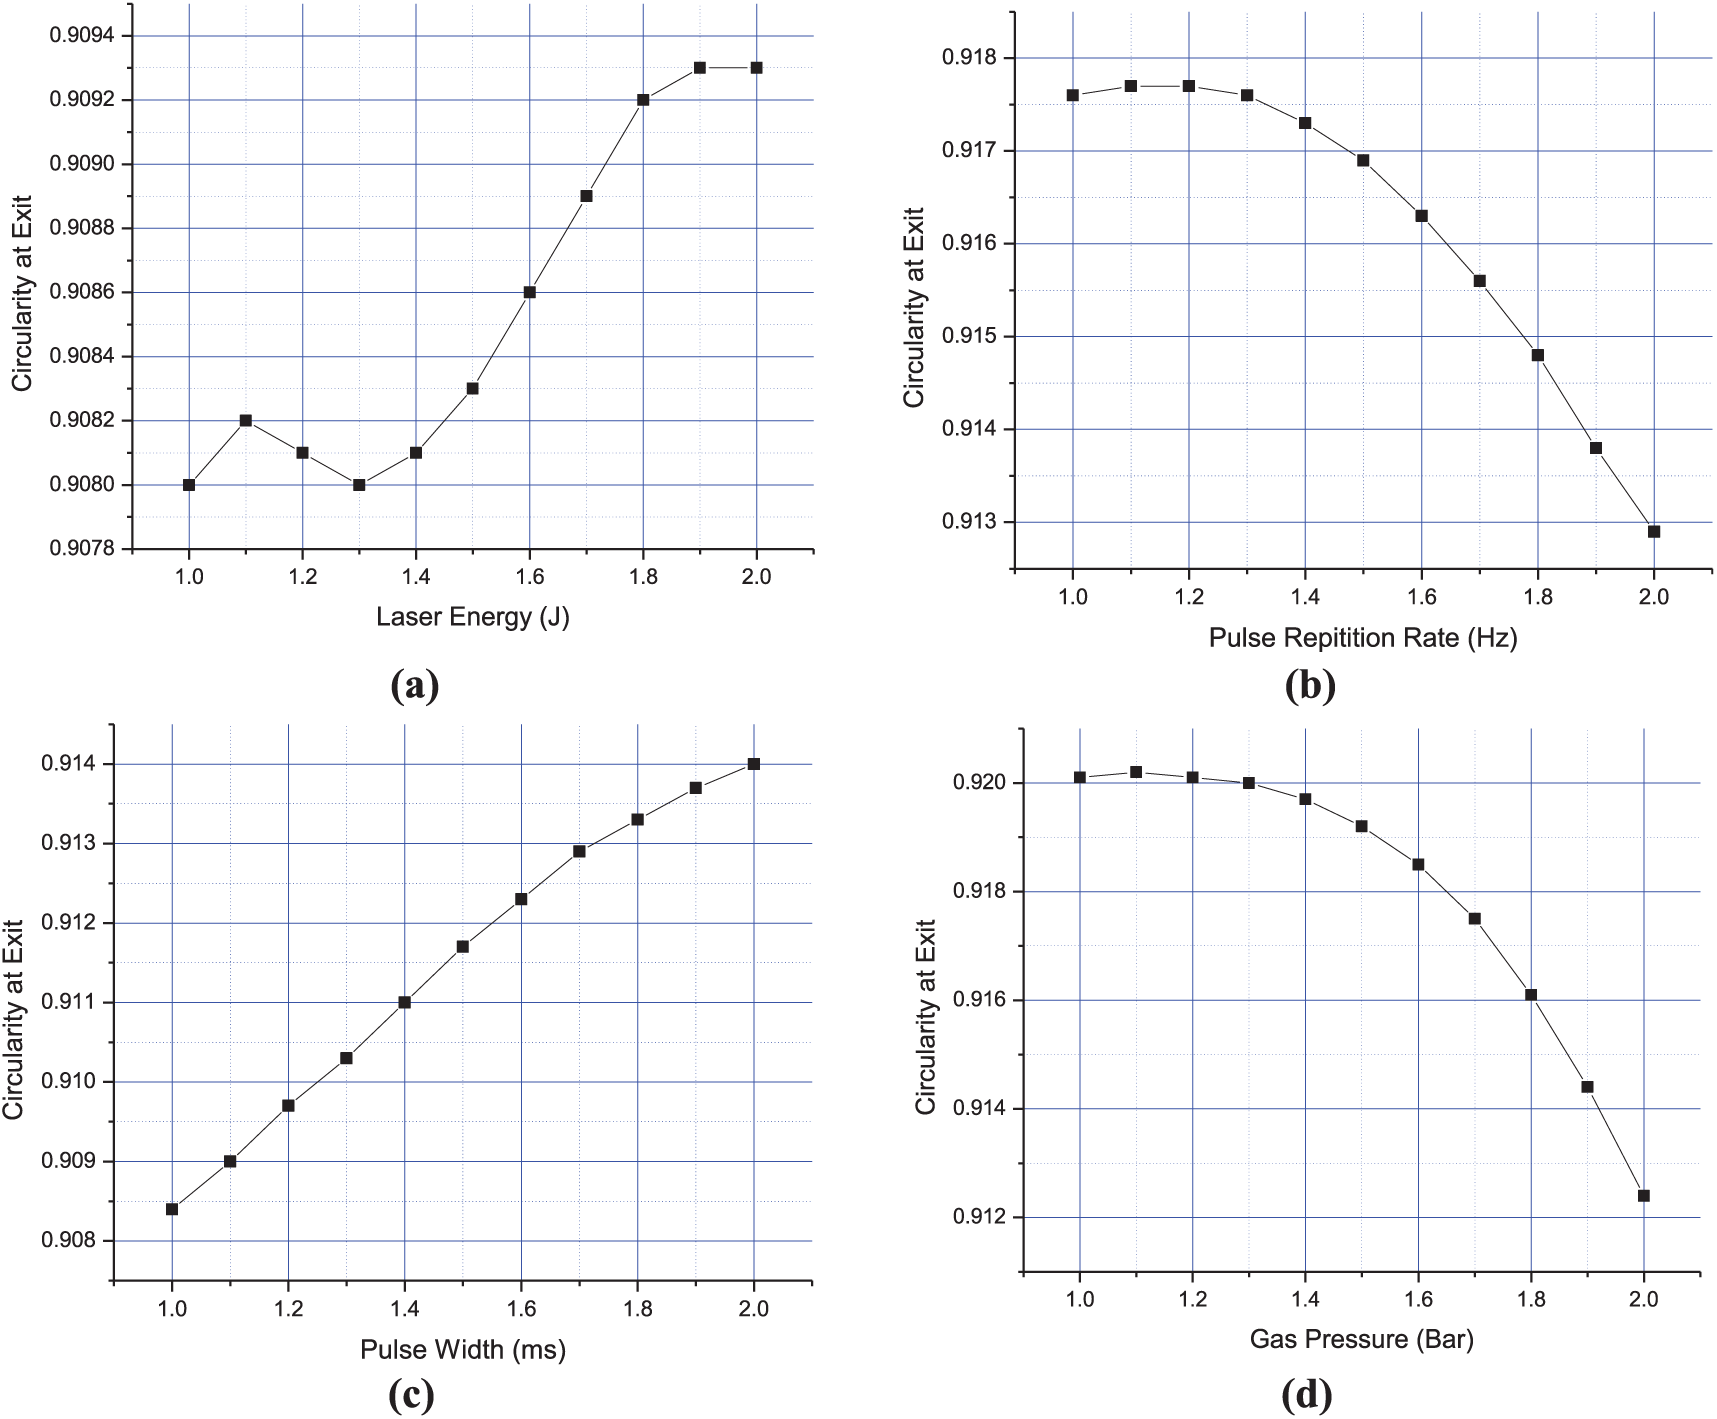
Sensitivity plot for circularity at exit with (a) laser energy, (b) pulse width, (c) pulse repetition rate and (d) gas pressure.
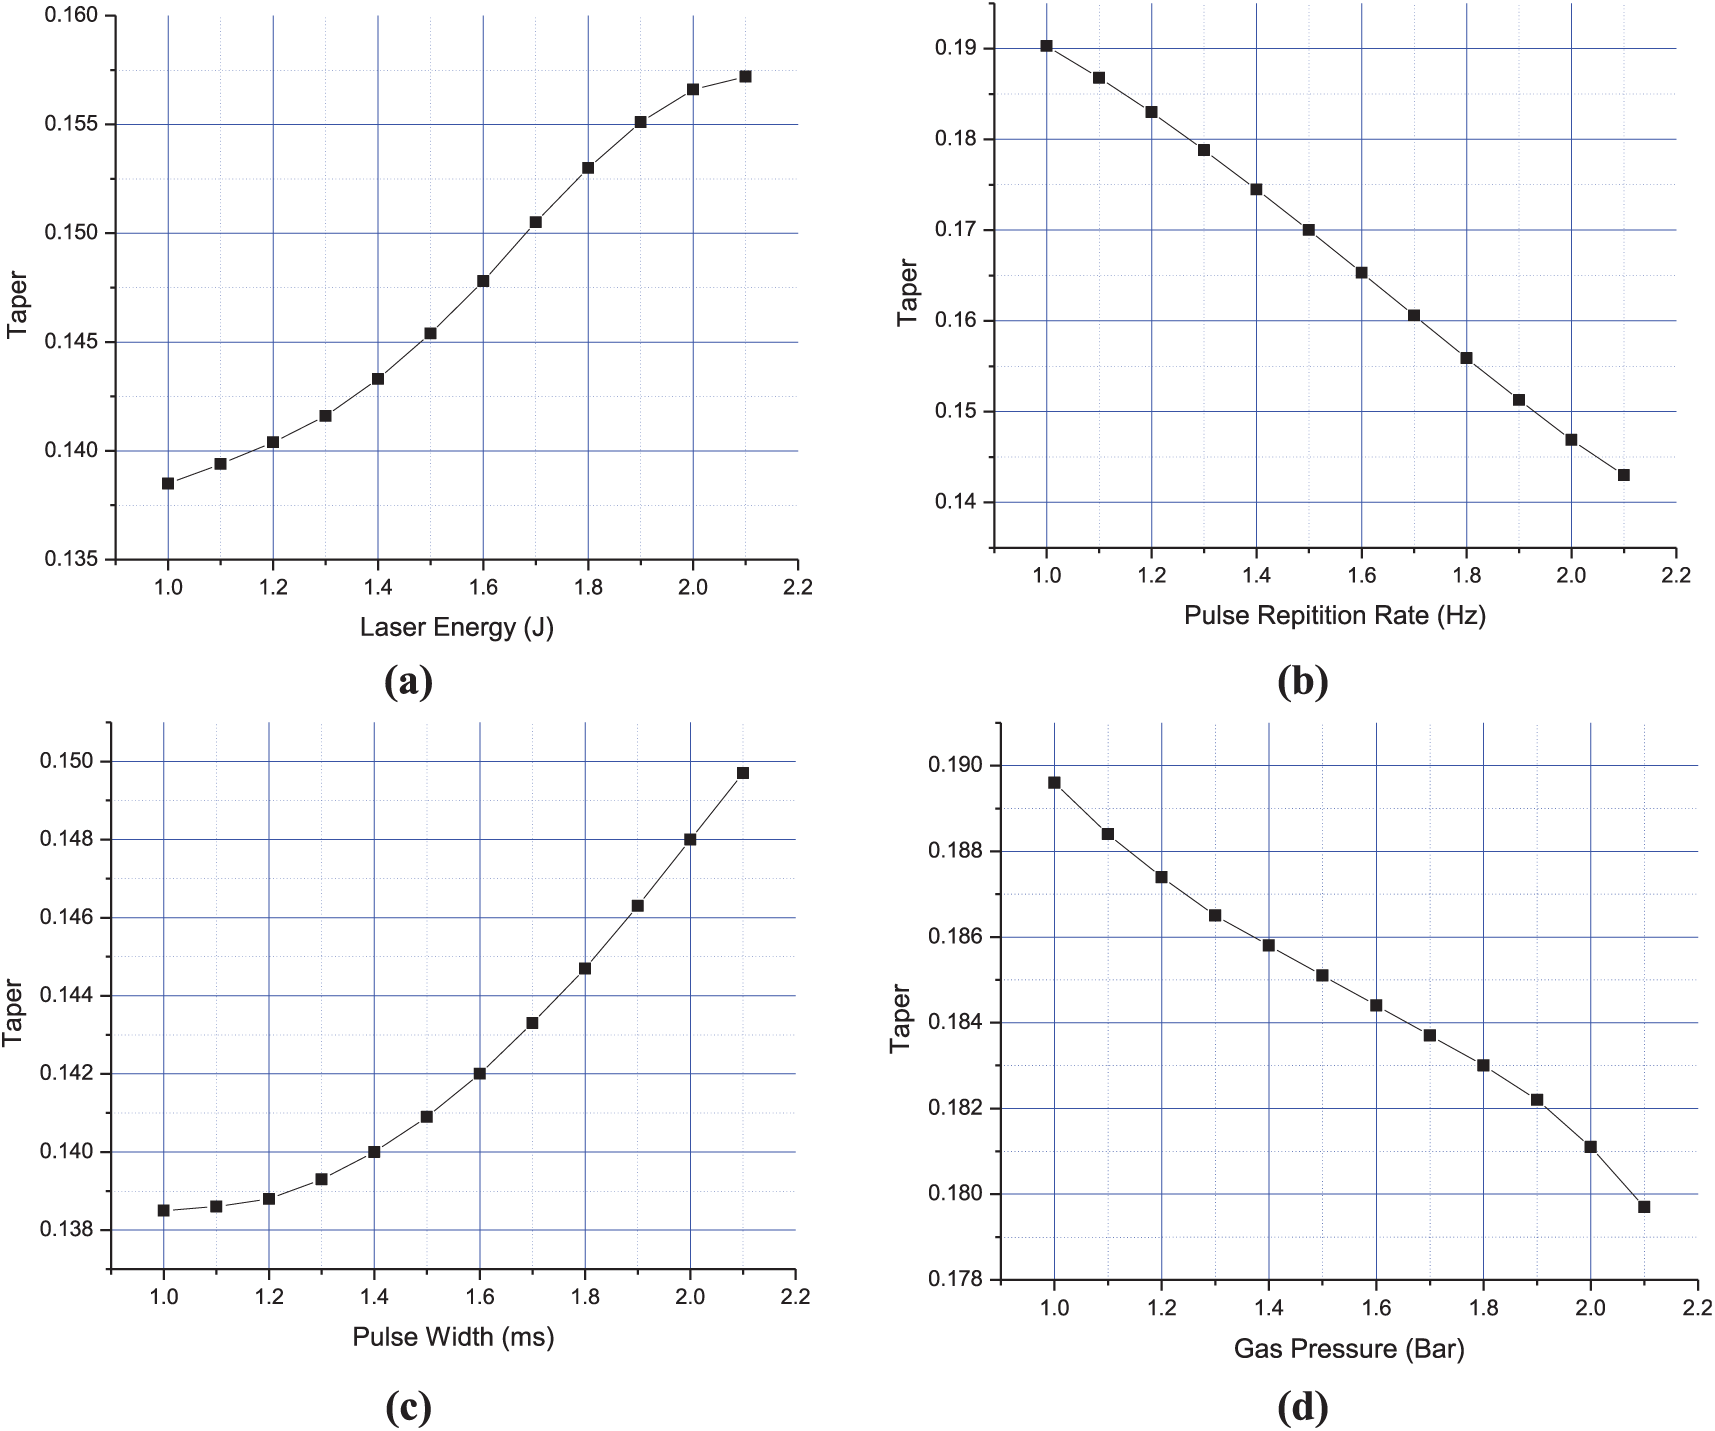
Sensitivity plot for taper with (a) laser energy, (b) pulse width, (c) pulse repetition rate and (d) gas pressure.
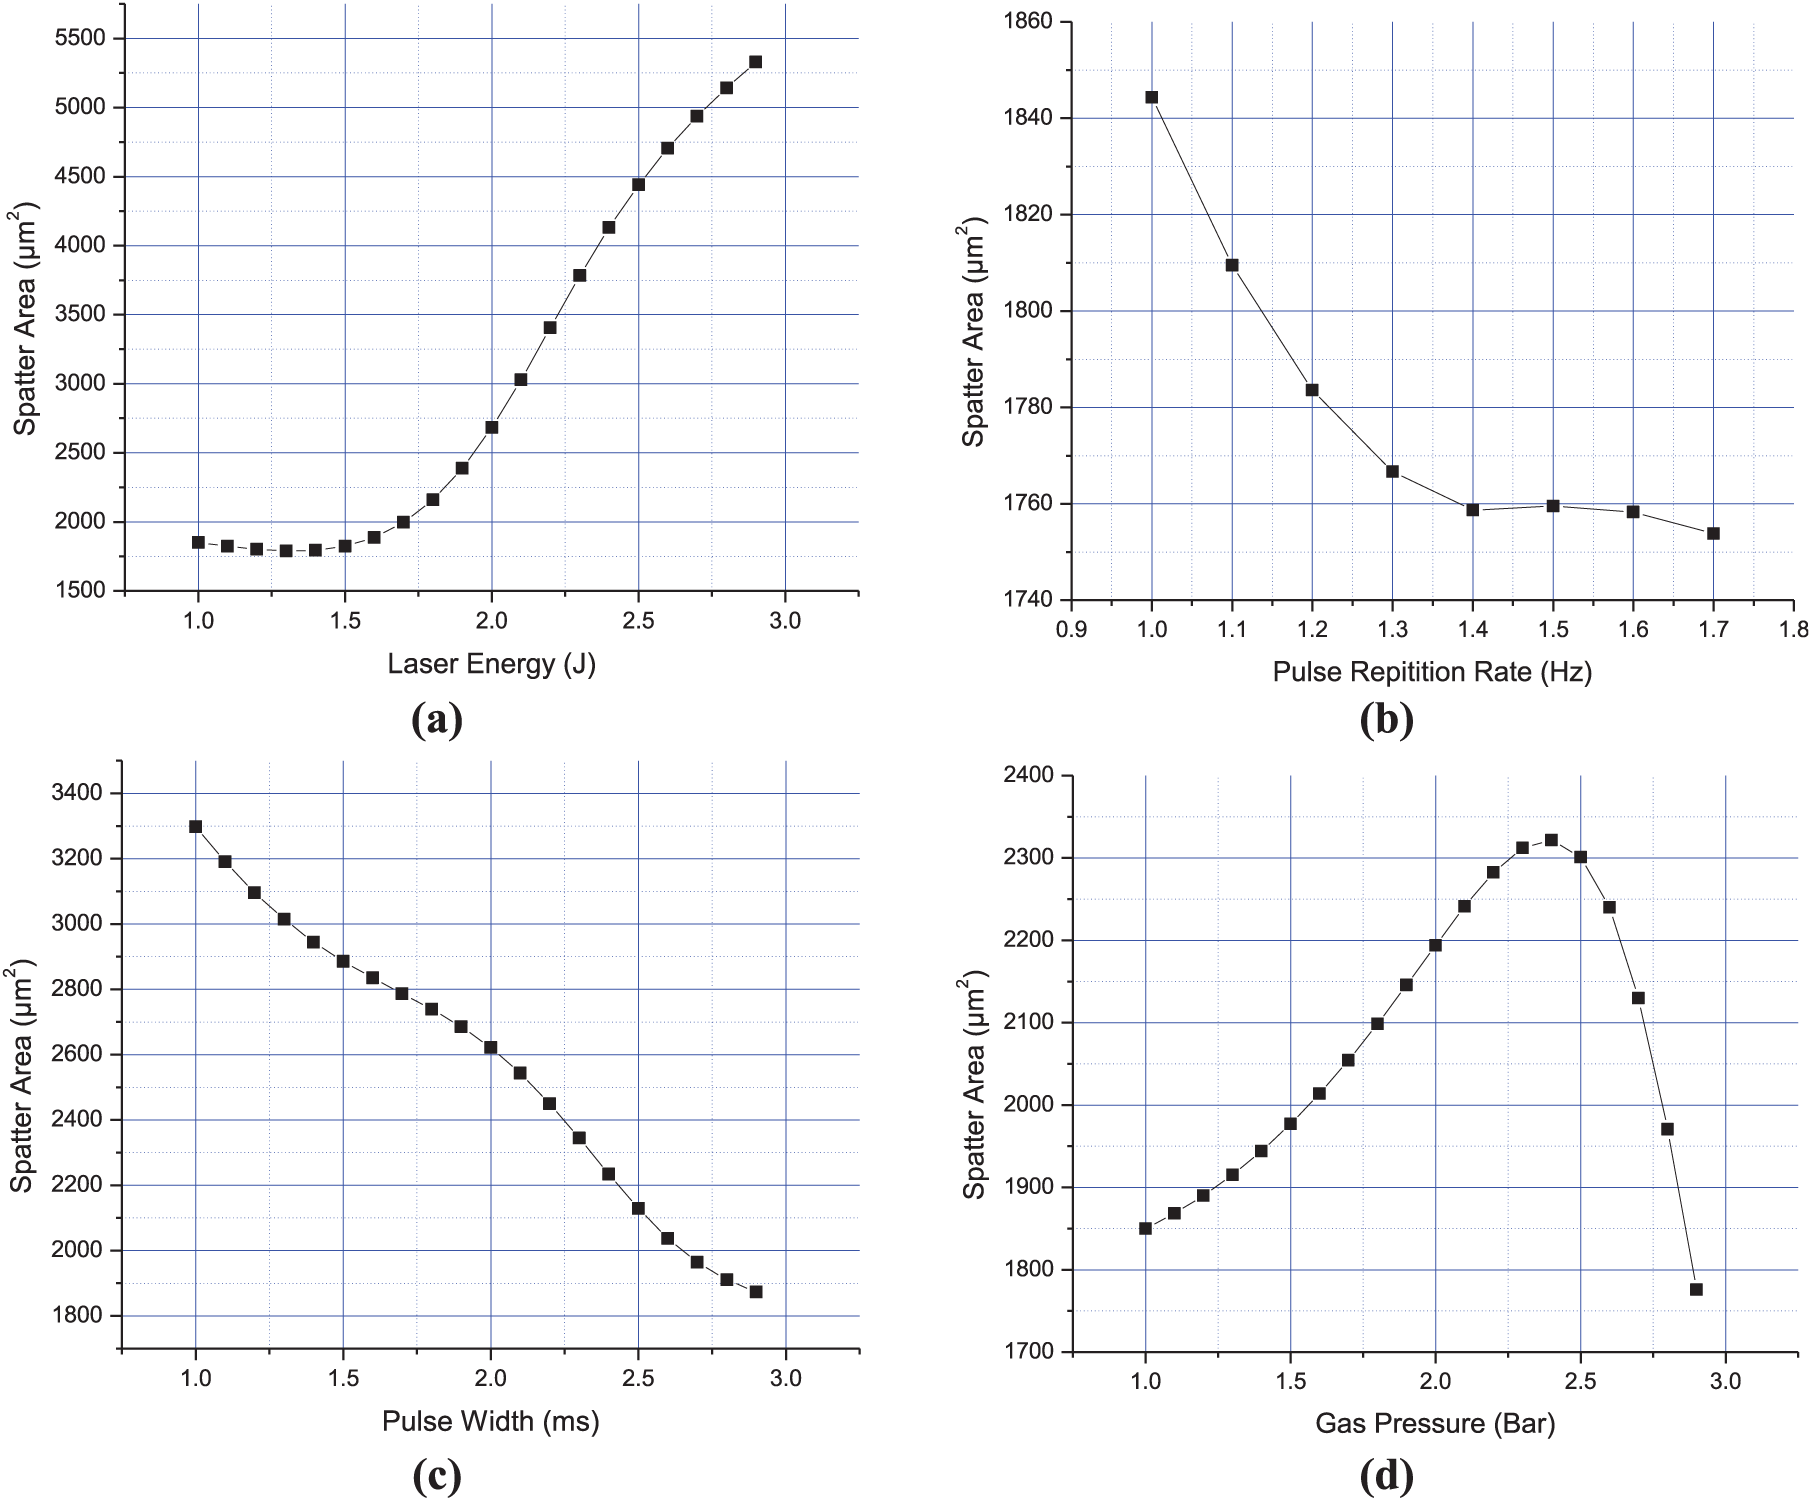
Sensitivity plot for spatter area with (a) laser energy, (b) pulse width, (c) pulse repetition rate and (d) gas pressure.
Figure 16 shows the variation of circularity at exit with laser energy, pulse repletion rate, pulse width and gas pressure. Figures 16(a) and (c) show that circularity at exit increases with the increase in laser energy and pulse width, respectively. Figure 16(b) and (d) shows that circularity at exit monotonously decreases with increase in pulse repetition rate and gas pressure, respectively. The curve for circularity at exit (Figure 16) shows a similar trend obtained in main effect plot for circularity at exit (Figure 8). This shows the robustness of the developed ANN for circularity at exit.
Figure 17 shows the variation of taper with laser energy, pulse repletion rate, pulse width and gas pressure. Figure 17(a) and (c) shows that taper increases with the increase in laser energy and pulse width, respectively. Figure 17(b) and (d) indicates that taper monotonously decreases with the increase in pulse repetition rate and gas pressure, respectively. The curve for taper (Figure 17) is in good agreement with main effect plot for taper (Figure 9).
Figure 18 shows the variation of spatter area with laser energy, pulse repletion rate, pulse width and gas pressure. Figure 18(a) shows that spatter area increases with the increase in laser energy. Figure 18(b) and (c) indicates that spatter area decreases with the increase in pulse repetition rate and pulse width, respectively. Figure 18(d) shows that spatter area increases with the increase in gas pressure. After certain value of gas pressure, spatter area decreases. The curve for spatter area (Figure 18) is in good agreement with main effect plot for spatter area (Figure 10).
Conclusion
This study illustrates the parametric effect of laser process parameters such as laser energy, pulse width, pulse repetition rate and gas pressure on performance measures, namely, circularity at entry and exit, tapper and spatter area individually during laser micro drilling of Ti6Al4V using millisecond pulse Nd:YAG laser. Taguchi’s L27 orthogonal array has been adopted to determine the parametric combination (treatment) for conducting the experiments and obtain maximum process related information with the least number of experimental runs. Analysis of the results leads to following conclusions:
ANOVA for all the performance measure has been made. The results suggest that pulse width is the most significant parameter for circularity (entry and exit) and taper, whereas laser energy is the most significant and contributing parameter for formation of spatter area during laser drilling of micro-holes. ANOVA also suggests that interaction of laser energy and flushing pressure significantly influences taper having percentage contribution of 22.12%. A significant two-factor interaction is found only for taper but not in any other performance measures. Statistically valid empirical models relating performance measures with process parameters have been suggested through least square regression analysis. Mostly the models are linear models except for taper.
Main effect plots show that performance measures such as circularity (entry and exit) and taper increase with the increase in pulse width, whereas increase in pulse width causes decrease in spatter area. The main effect plots also indicate that optimum parametric settings for the quality characteristics. Circularity at entry and exit can be maximized by the parametric setting of A3B1C3D1. Similarly, minimum taper and spatter area can be obtained at parametric settings of A1B3C1D3 and A1B3C3D1, respectively.
From the study, it is observed that spatter area increases initially with the increase in laser energy but decreases after certain value of laser energy. This may attributed to the formation of LSA wave when laser energy increases after a certain value leading to blockage of laser energy which causes reduction of material ejection and decrease of spatter formation.
ANN has been used for predicting the performance measures of the laser drilling. The trained and tested data are in good agreement with experimental data (mean square error within 5%) suggesting the adequacy of the developed model. Since small values of mean relative error are obtained, the proposed ANN model is robust and adequate to be used for prediction of quality characteristics of laser micro-drilled holes. In fact, both the empirical and ANN models are quite effective in predicting the performance measures with reasonable accuracy. However, ANN model is superior to empirical model because mean relative error is less in case of ANN model for all the performance measures. ANN model can be recommended for prediction purpose because non-linear relation between process parameters with performance measures is effectively taken care of.
Variation pattern of performance measures with respect to experimental parameters predicted from a well-trained ANN matches more or less with main effect plots. It demonstrates that ANN model predicts the pattern of the data distribution with adequate accuracy indicating robustness of the developed ANN model.
Footnotes
Appendix 1
Acknowledgements
The authors extend their hearty gratitude to the Editor-in-Chief and anonymous reviewer(s) of Part B: Journal of Engineering Manufacture for taking interest in their scholarly work and providing constructive suggestions that helped to improve the literal and technical content of the manuscript.
Declaration of conflicting interests
The author(s) declared no potential conflicts of interest with respect to the research, authorship and/or publication of this article.
Funding
The author(s) received no financial support for the research, authorship and/or publication of this article.