
Abstract
In micro-grinding, the depth of cut is smaller than the grain size of workpiece material. Since the micro-grinding wheel cuts through the grain boundaries, the crystallographic effects become more significant in the micro-grinding than that in macro-machining. To quantify the effect of crystallographic orientation on the flow stress of polycrystalline material, the Taylor factor model is developed by examining the number and type of the activated slip systems. Then, the shear force model is developed based on the flow stress model considering the effect of crystallographic orientation. Moreover, the plowing force is predicted based on the Vickers hardness of workpiece material and the plowing friction coefficient. A comprehensive model is then proposed to predict micro-grinding force by consolidating the mechanical, thermal, crystallographic, and size effect. Micro-grinding experiments adopting Taguchi’s method were conducted to verify the model, and the results indicated that the predictions agree well with the experimental data. Besides, single-factorial experiments were conducted with the only variable being Taylor factor and the results suggest that the Taylor factor model is capable of capturing the effect of crystallographic orientation on grinding force.
Introduction
In manufacturing process, the process behaviors have interactive effects on the material microstructure which includes grain size, crystallographic orientation (CO), and dislocation density. Choi et al. 1 experimentally investigated the effects of machining parameters on the surface integrity of hard machined surfaces. The experimental results demonstrate that the machining parameters significantly influence the residual stress and micro-hardness distribution of hard machined surfaces. Zeng et al. 2 investigated the effect of cutting depth on the microstructure of subsurface through an orthogonal-designed external grinding experiment. The results indicated that subsurface microstructure of the material deformed along the grinding direction with the degree depending on the depth of cut. A materials-affected manufacturing (MAM) method was later proposed to accurately predict process behaviors and material properties. 3 To verify and improve perfect the MAM method, Tabei et al. 4 investigated the effects of manufacturing process parameters on the material properties in the milling process. The authors applied the visco-plastic self-consistent (VPSC) technique to model the texture evolution in the thermo-mechanical processing and predicted grain recrystallization based on Avrami-type kinetic equations. Pan et al. 5 applied the MAM method to predict the machining forces and average grain size in the orthogonal turning of titanium alloys. This method improves the accuracy of predictions in the machining process.
In past decades, many researchers have been investigating the effect of material microstructure on process behaviors. Hall 6 and Petch 7 developed the Hall–Petch equation to quantify the effect of grain size on flow stress of the polycrystalline material. Hughes and Hansen 8 further modified the flow stress model by including the effect of dislocation density. Recently, Sokol et al. 9 investigated the relationship between grain size and several material properties including the hardness, flexural strength, and dynamic yield strength of materials, and verified the Hall–Petch model.
Besides grain size, CO of workpiece material has a significant effect on the process behaviors. Elkaseer et al.
10
concluded that important differences exist between micro- and macro-scale machining which have a significant influence on the material removal mechanisms. This is because the grain sizes of most commonly used engineering materials and the feature sizes of micro-machined components or the edge radius of the cutting tools can be comparable in scale. Ueda et al.
11
analyzed the chip formation mechanism for the cutting of single crystals
Micro-grinding process provides superior surface quality and accuracy. Therefore, predictive model and optimization method are generally of great significance. In micro-machining, CO has a more significant influence on process behaviors than that in macro-machining, because the average grain size of workpiece materials is larger than the depth of cut when the micro-scale tool works intra-crystal. In micro-grinding, Park and Liang 15 considered the effect of the material microstructure including CO in the modeling of flow stress of polycrystalline materials, which also incorporated the mechanical and thermal effects. The authors first proposed a micro-grinding force model of single-grit interactions; furthermore, the analytical model was extrapolated into a whole grinding wheel. Lee et al. 16 conducted the multi-objective optimization of a micro-grinding by introducing desirability functions, and the optimal combination of depth of cut and feed rate is obtained for minimum specific grinding forces and surface roughness and maximum specific material removal rate. However, the investigation did not consider the effect of material microstructure on the micro-grinding process.
The above investigations analyzed the effect of CO on the machining process qualitatively, whereas few quantitative models had been developed. For the single-crystal materials, Demir 17 developed a Taylor factor model based on the micro-plasticity theory to predict the cutting specific energy in micro-milling of single-crystal face-centered cubic (FCC) materials. The authors assumed that five independent slip systems to be activated in the plastic deformation. Zhao et al. 18 proposed a new Taylor factor model of monocrystalline materials which examined the variation of material flow stress resulting from the change of CO in micro-grinding. For polycrystalline materials, the averaged Taylor factor is taken as the well-known value of 3.06. 19
In this investigation, the Taylor factor model of polycrystalline materials was developed to quantify the effect of CO on the flow stress, based on the Taylor factor model of monocrystalline material and orientation distribution function (ODF). Thereby, a comprehensive micro-grinding force model was proposed which incorporated the chip formation force and plowing force, with the consideration of process parameters, the material microstructure of workpiece, and micro-grinding wheel properties.
Materials and methods
Material characterization
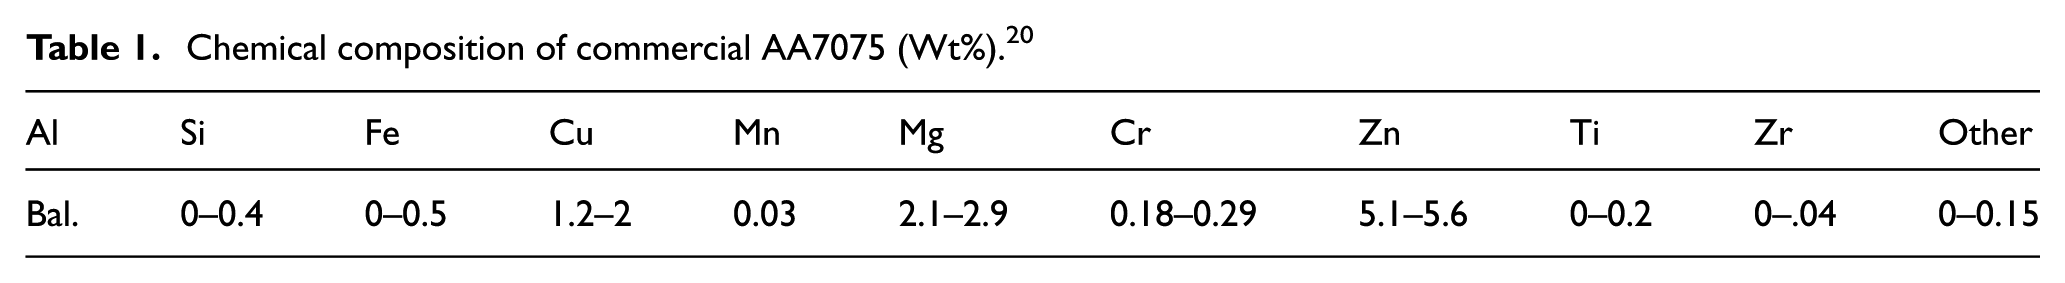
Aluminum alloy 7075 T6 (AA7075 T6) was chosen for the investigation, which was used extensively as aerospace components due to its high strength-to-density ratio. The chemical composition of commercial AA7075 T6 is listed in Table 1 in weight percent.
Chemical composition of commercial AA7075 (Wt%). 20
For Al-based alloys, the alloy system accommodates precipitation of new secondary phases due to alloying elements. AA7075 has zinc and magnesium as major alloying elements. Secondary precipitation of Guinier–Preston (GP) zones occur in a conventional T6 heat treatment at 177°C for the Al–Mg–Si–Cu alloy. It is believed that
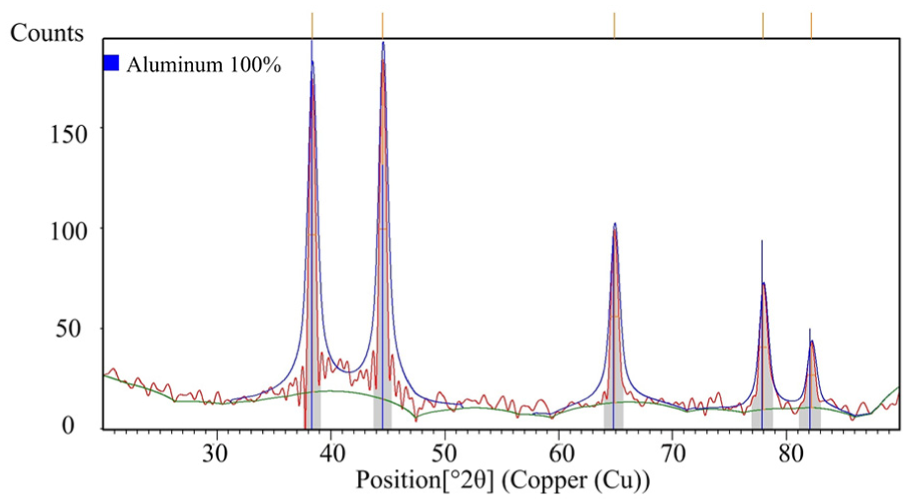
XRD patterns of the 7075 T6 samples.
Figure 1 shows that the XRD pattern is free of strong diffraction peaks, aside from those for aluminum, indicating the fraction of secondary precipitation is very small. AA7075 was therefore deemed as single-phase material in this investigation.
A total of 15 samples with the dimension of
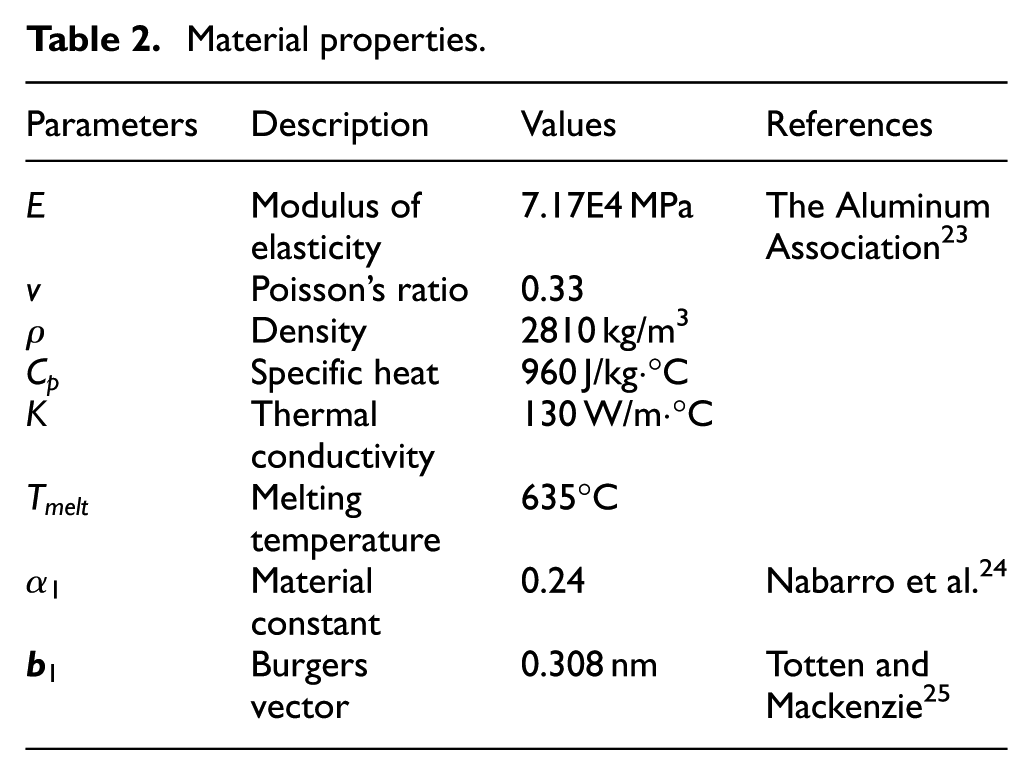
Material properties.
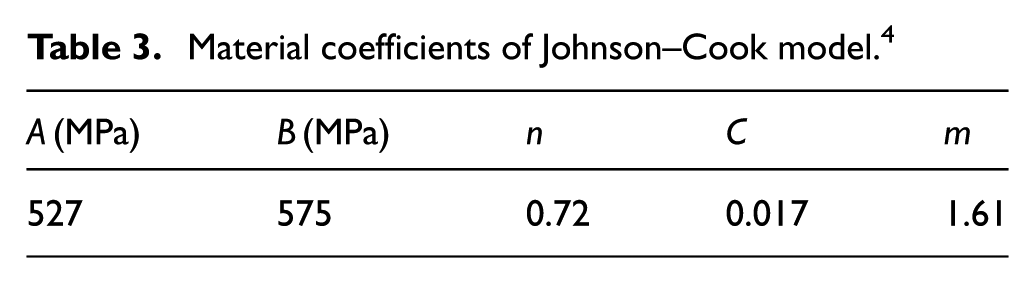
The material coefficients of the Johnson–Cook model for AA7075 T6 are listed in Table 3.
Material coefficients of Johnson–Cook model. 4
In this investigation, electron backscatter diffraction (EBSD) was used to observe the microstructure. The CO and the distributions of the four samples were analyzed by the TSL OIM Data Collection 5 software and depicted by the OIM micrographs, which are shown in Figure 2. Each color for the crystals in Figure 2 represents one specific CO.
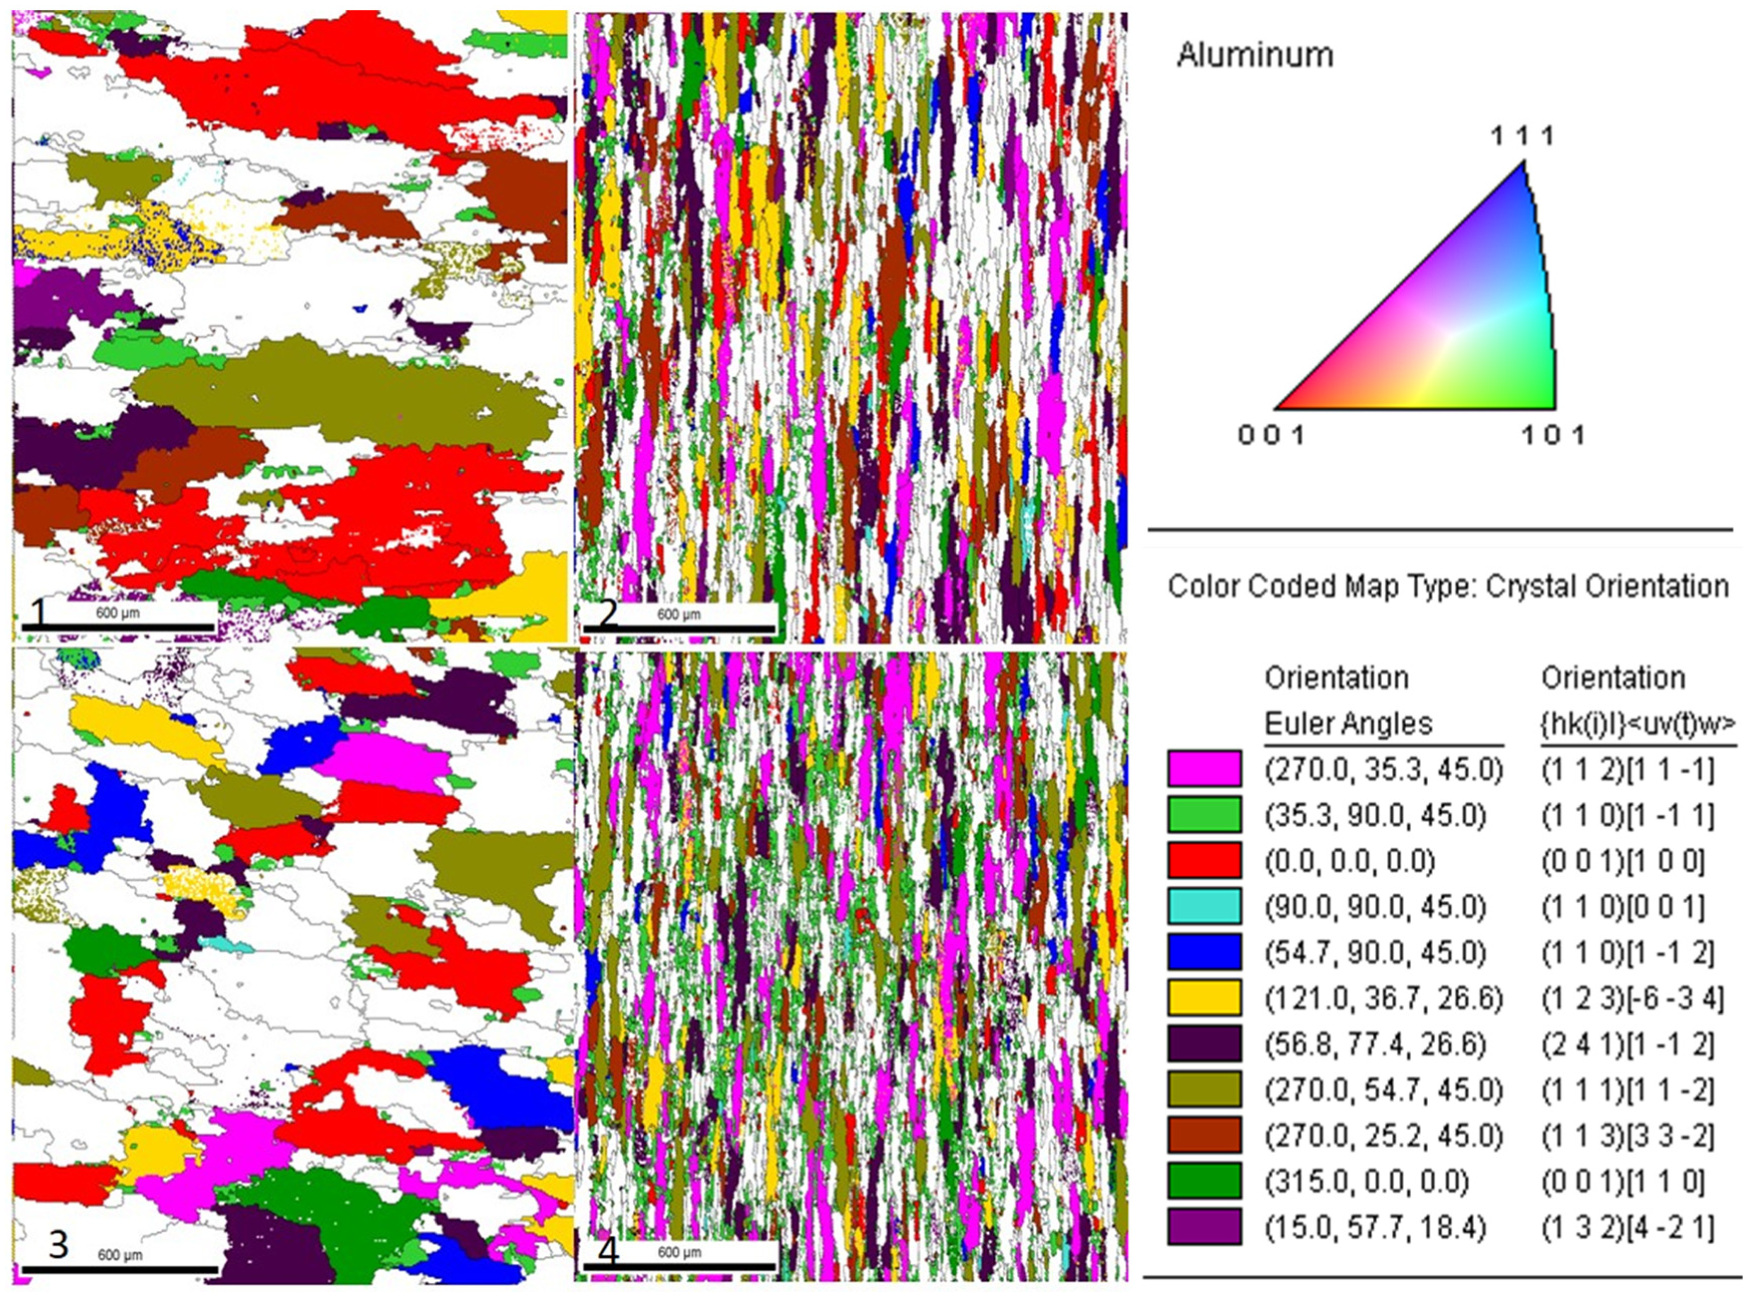
Texture of the four AA7075 T6 samples.
Miller indices
26
are used to depict CO in the paper, which form a notation system to specify directions and planes in crystal lattices:
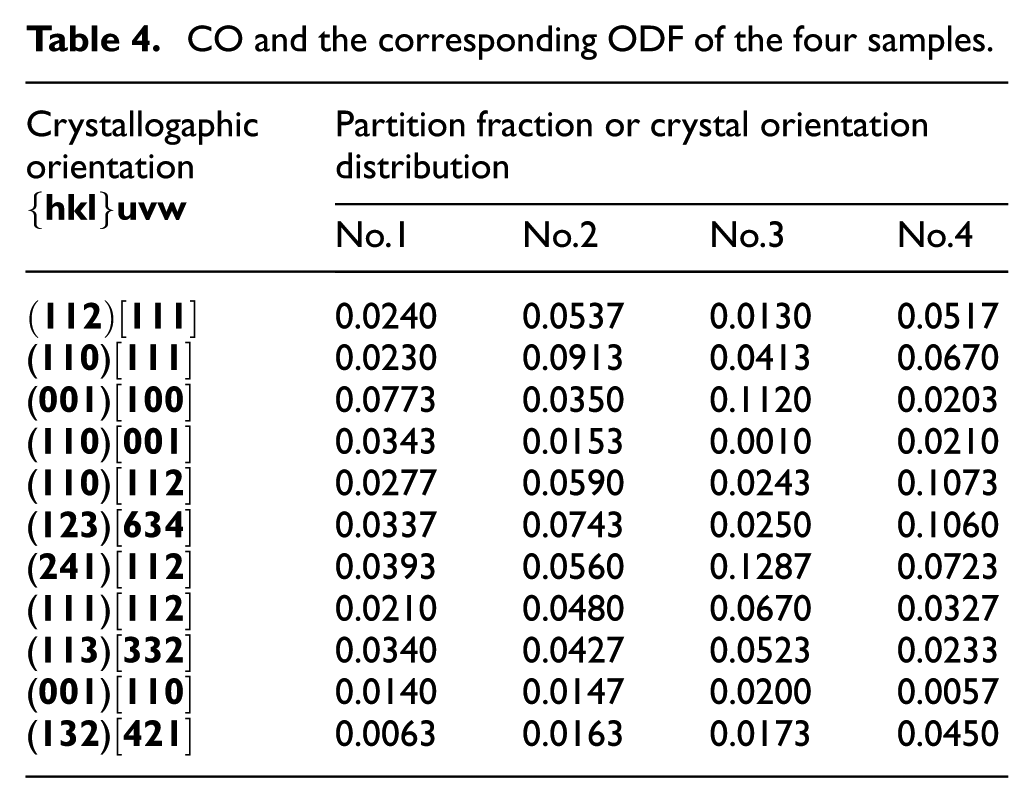
The ODF is a probability density function, which yields the probability of finding a certain orientation in a polycrystalline aggregate. Computation of ODF from experimental micro-texture data is straightforward since volume (or equivalent area on two-dimensional (2D) images) of each crystallite and its orientation are known. In the investigation about the effect of polycrystalline material CO on the micro-grinding force, the ODF is necessary to be considered in the calculation of Taylor factor. The CO and the corresponding ODF of samples are listed in Table 4.
CO and the corresponding ODF of the four samples.
The misorientation angle refers to the minimum angle between two crystals. EBSD test has been widely used to observe misorientation and the distribution over the years. Figure 3 shows the values and distributions of misorientation angle of the four samples. The x-axis represents the value of misorientation angle and the y-axis represents the distribution of misorientation angle.
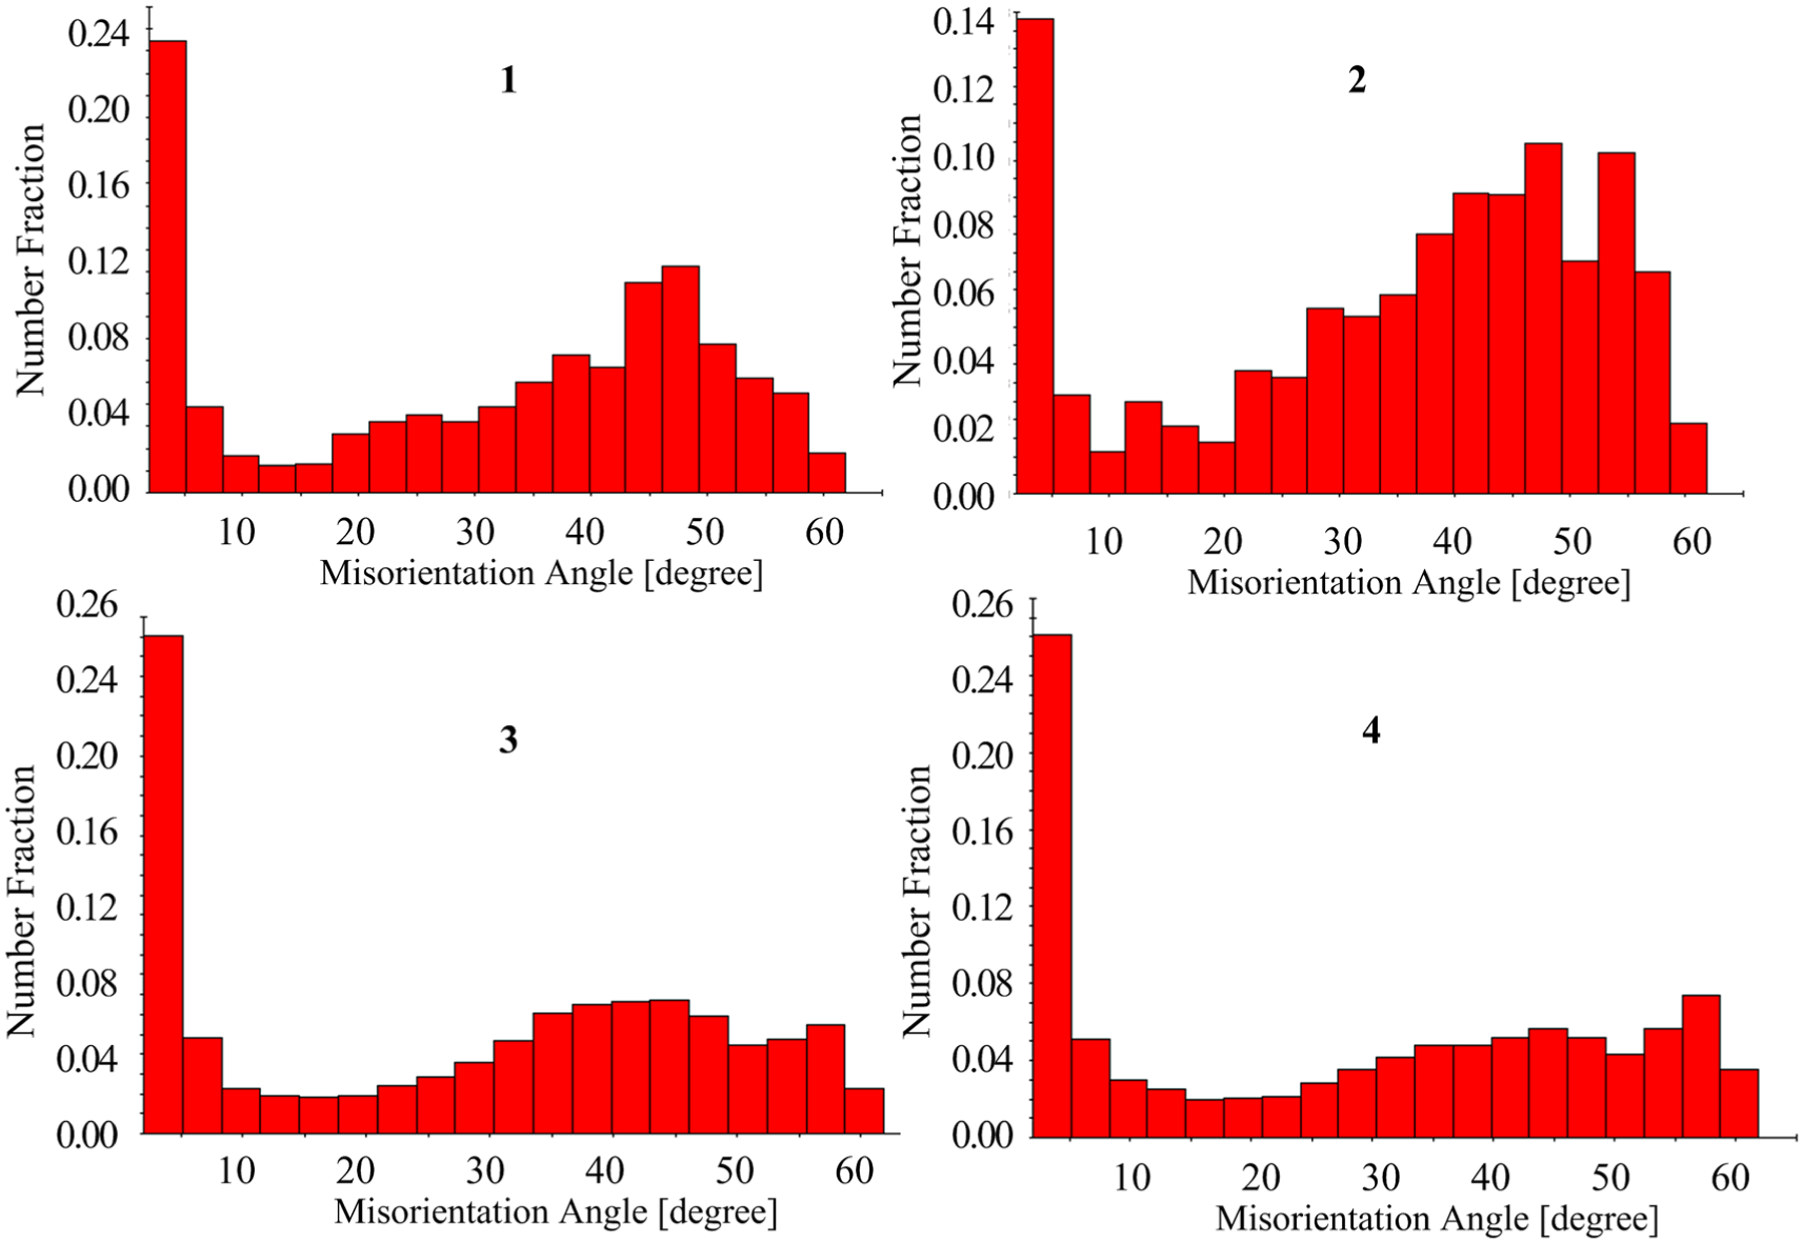
Values and distribution of misorientation angle for the four samples.
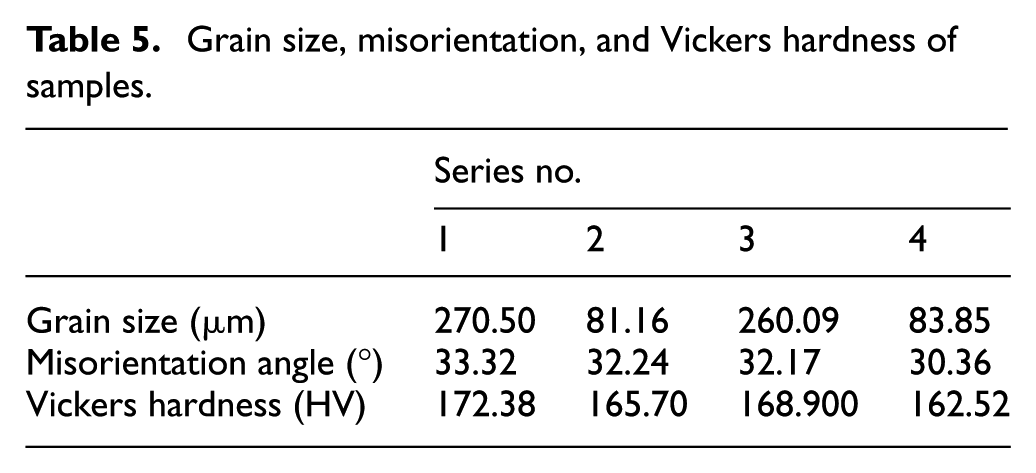
Meanwhile, the value and the distribution of grain size were also extracted by the EBSD test. As an important mechanical property, Vickers hardness was measured by the digital Vickers hardness tester HVS-1000Z. The mean values of the grain size, misorientation angles, and Vickers hardness of the four samples are listed in Table 5.
Grain size, misorientation, and Vickers hardness of samples.
Modeling methodology
The analytical modeling of micro-grinding starts from the individual grit interaction and is then extrapolated into a whole grinding wheel surface. The mechanical mechanism of individual grit interaction is similar to that of micro-cutting, which involves two phenomena of micro-cutting and plowing. 27 In the analysis of micro-cutting as presented in Figure 4(a), the incremental force of each of the infinitesimal small area is calculated by applying Merchant model and are then summed up over the region of contact between the individual grit and workpiece. Merchant’s circle diagram is constructed to ease the analysis of cutting forces acting during orthogonal cutting of workpiece as shown in Figure 4(b).
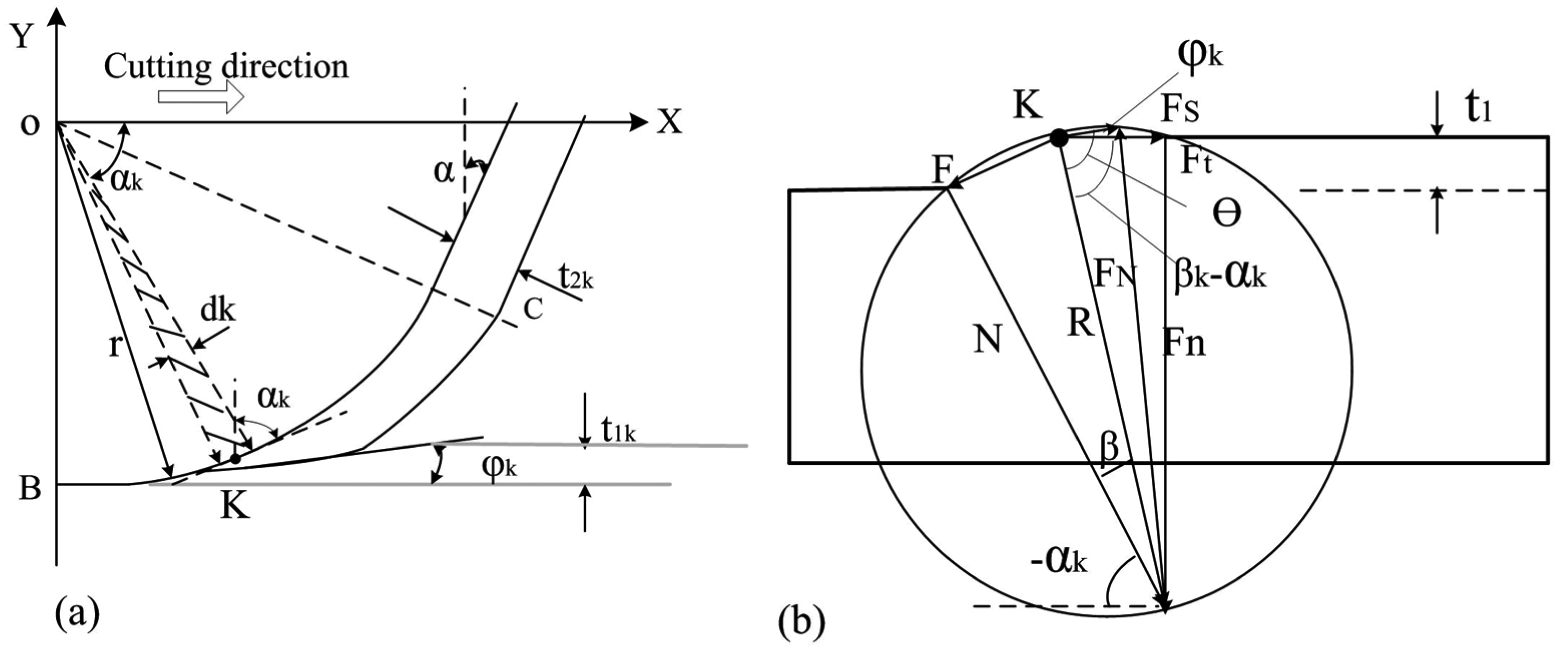
(a) Schematic diagram of individual grit interaction and (b) Merchant’s circle diagram.
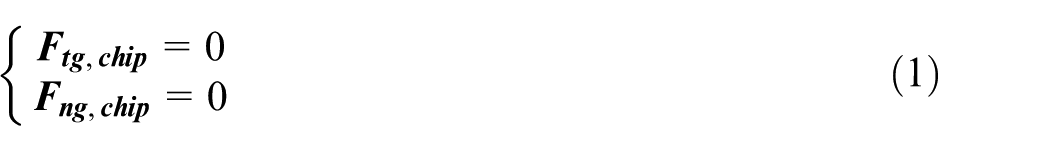
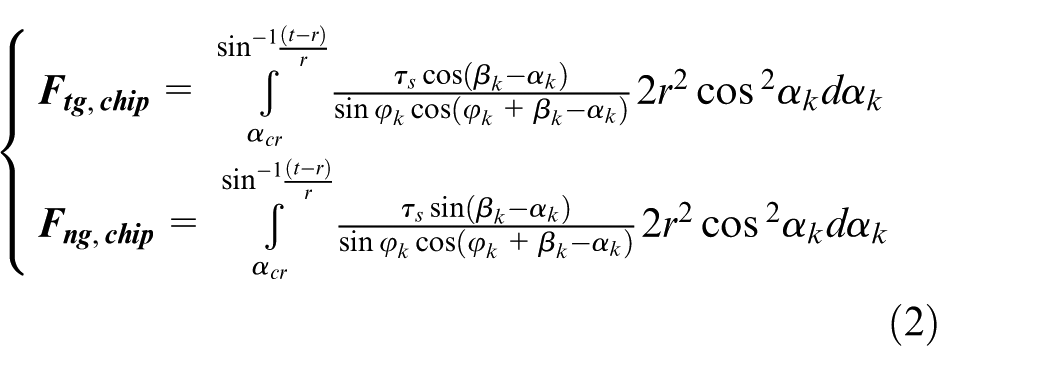
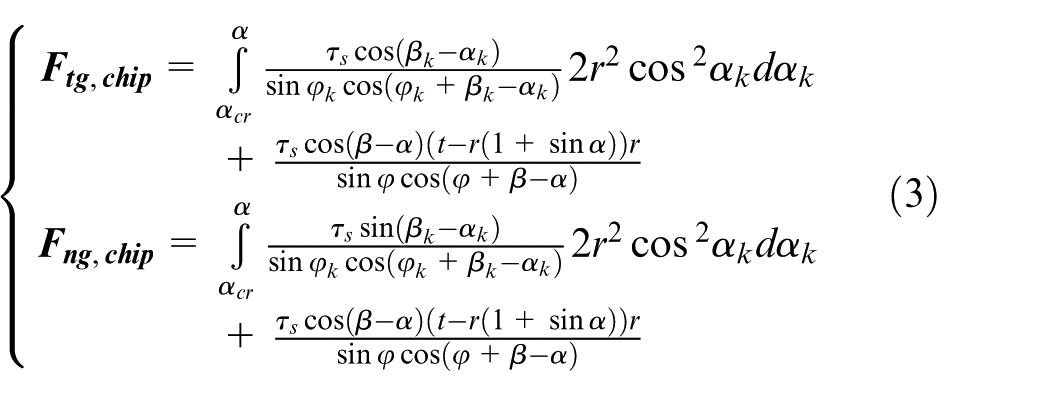
In chip formation region, seven forces are involved.
The overall forces of individual grit in tangential and normal directions are expressed as
When
When
When
where
Shear flow stress is calculated as follows
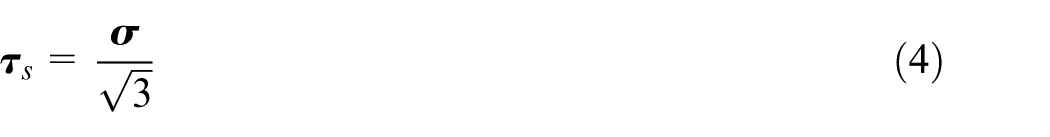
where
The flow stress model takes into account two parts including thermal effect and athermal effect. 29 Thermal effect is related to stain, strain rate, and temperature; athermal effect is related to material microstructure including grain size, CO, and dislocation density. The flow stress model is expressed as follows
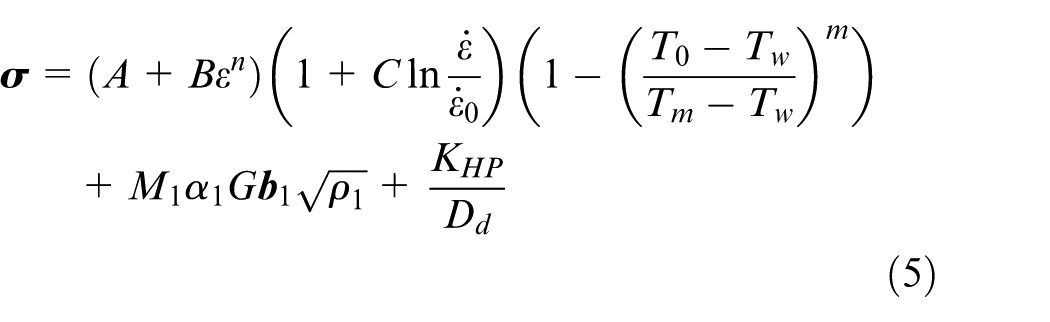
where
The Burgers vector
“Slip” is the movement of dislocations on certain crystallographic planes along certain crystallographic direction (i.e. the Burgers vector of the dislocation). Crystals with a FCC structure are inherently anisotropic and have a number of independent slip systems, which results in the activated deformation textures. Each crystal system is marked with different number and type of slip systems. In the FCC crystals, the slip planes belong to the family
The 12 slip systems of FCC crystal.
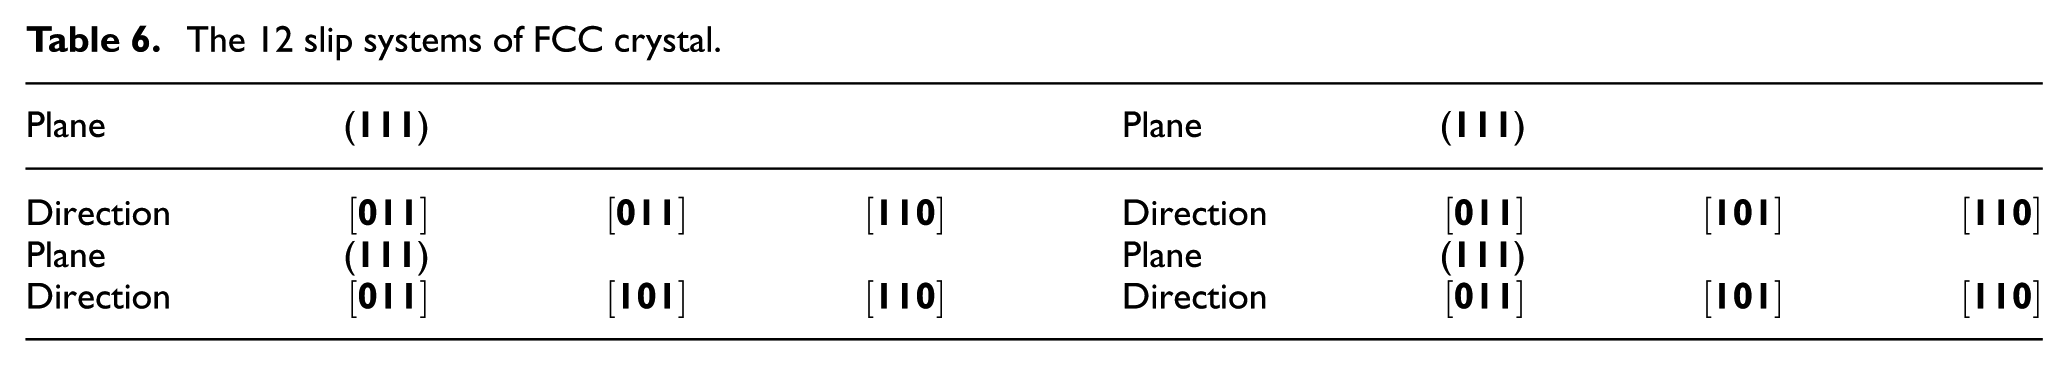
With the variation of CO of grains, the activated slip system will change, followed by the varying direction of Burgers vector of dislocations.
The reason of changing the CO of grains in deformation by slip is explained by Schmidt’s law. 33 The condition of the activated slip systems plays a significant role in describing the variations of the plastic deformation zone, the plastic shears, and the dislocation density.
In this article, Taylor factor which was proposed for the tensile test with low strain rate around
The Taylor factor is related to the number and style of the activated slip system and determined by the CO of the workpiece material as well as the cutting direction. The Taylor factor model of single FCC material was proposed by Zhao et al., 18 which is given by
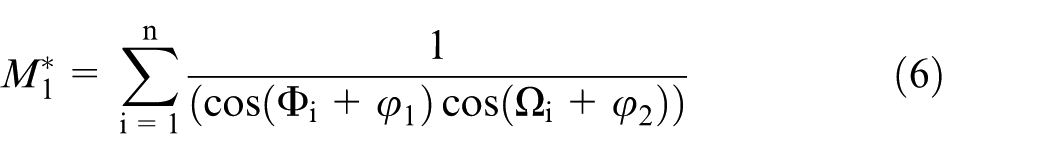
where
The Taylor factor model of polycrystalline material is given by
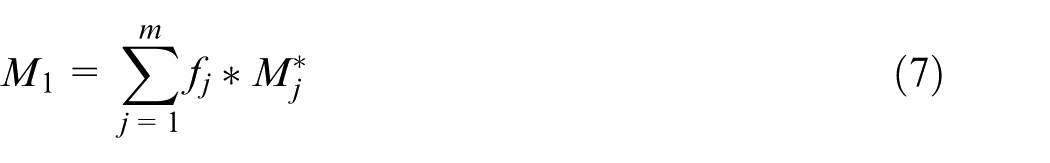
where
The plastic behavior of plowing phenomena resembles the material deformation beneath a Brinell ball. Therefore, the plowing force is derived from the indentation force acting in the direction of
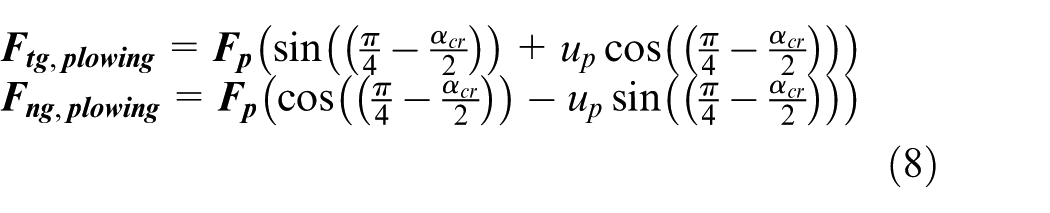
where
The overall micro-grinding forces are calculated depending on the shape of the grit edges and the wheel topography. It is crucial to understand the micro-grinding wheel topography in the modeling of micro-grinding force. Hecker 35 presented the static cutting edge density model, which is given by

where
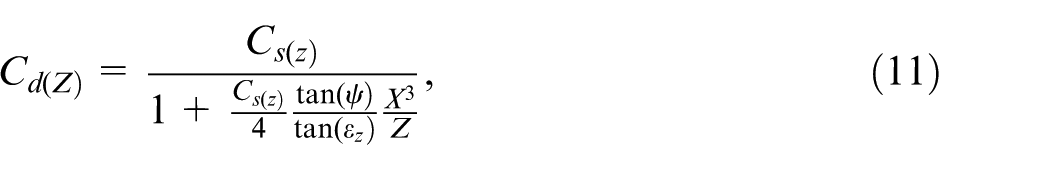
where
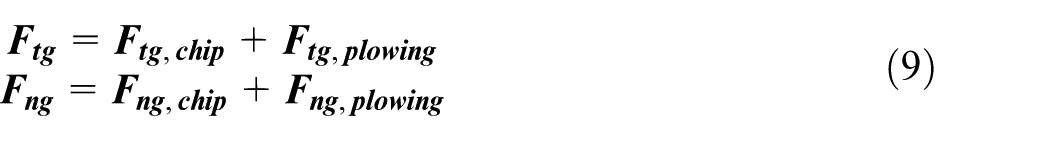
Then, the total grinding forces are calculated as
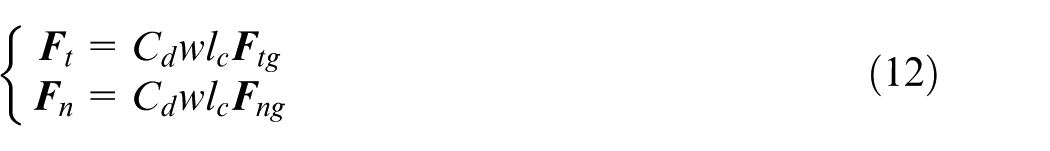
where
where
Experimental methods
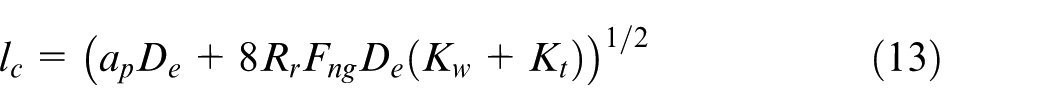
In this article, micro-grinding experiments were conducted on a miniaturized machine tool without coolants as shown in Figure 5(a). Two orthogonal micro-grinding force components were measured with a Kistler 9256 C2 MiniDyn dynamometer with a noise threshold less than 2 mN. The configuration of the micro-grinding experiment is shown in Figure 5(b). The experiments were carried out using a CBN grinding wheel 85412-BM with a diameter of 3 mm. Figure 5(c) shows the magnified imagine of the micro-grinding wheel surface.
Schematic diagram of (a) a miniaturized machine tool, (b) an illustrated experimental configuration, and (c) the magnified image of the micro-grinding wheel surface.
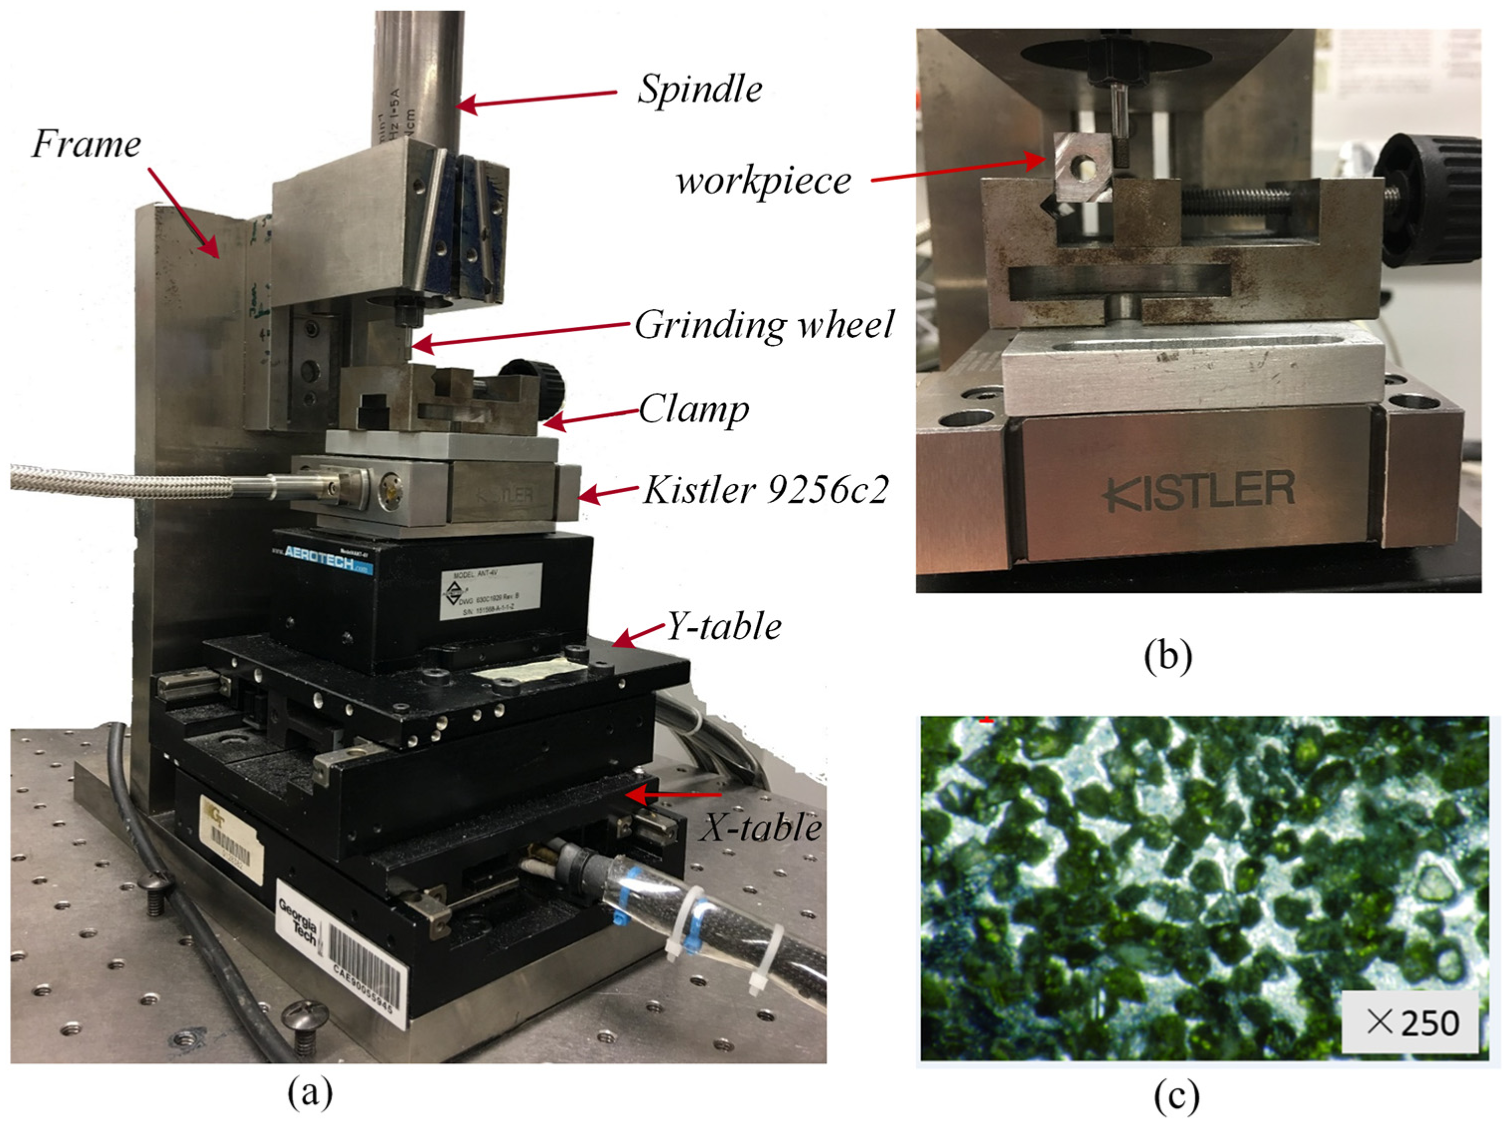
An orthogonal-designed micro-grinding experiment was conducted to verify the predictive model. Taguchi’s method was employed to identify the level of influence of several process variables on the forces. The model inputs including wheel speed, federate, depth of cut, and Taylor factor were chosen as factors. A four-factor, four-level orthogonal arrays
Layout of
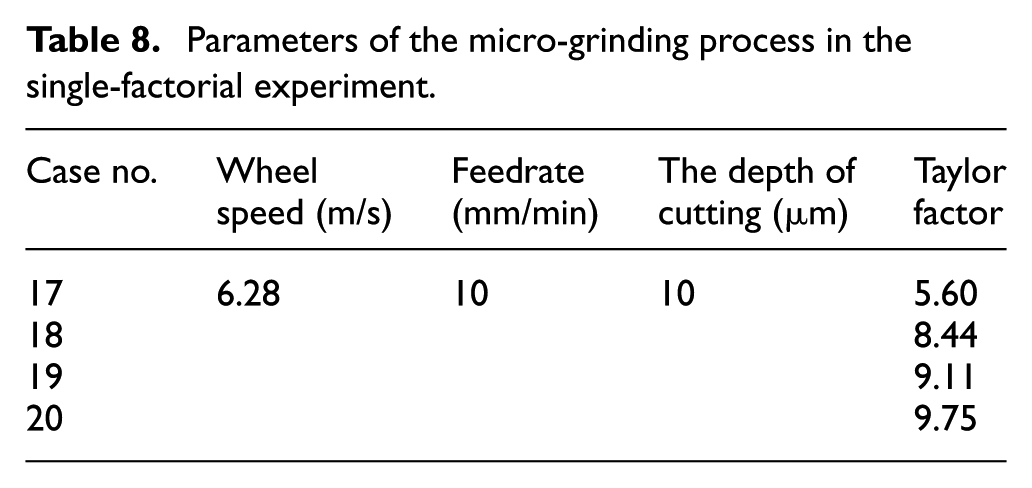
In addition, the single-factorial micro-grinding experiment was designed to further investigate the influence of CO on the force with the Taylor factor as the variable. The parameters of the single-factorial experiments are listed in Table 8.
Parameters of the micro-grinding process in the single-factorial experiment.
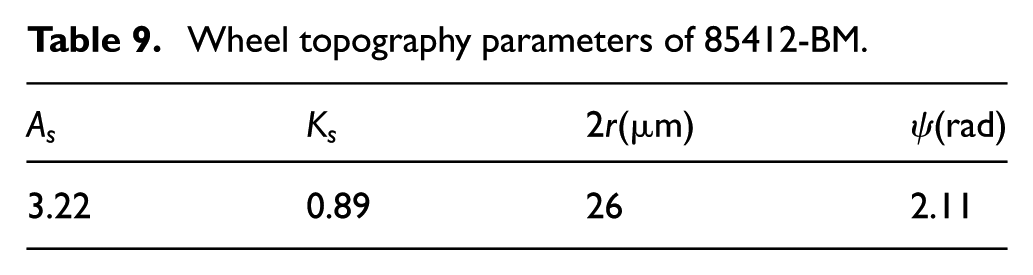
The wheel topography of 85412-BM with
Wheel topography parameters of 85412-BM.
Results and discussion
Taylor factor prediction
The Taylor factor is calculated using equation (7) with the CO and ODFs of samples provided in Table 1. Figure 6 shows the comparison of the CO and ODFs between the four samples.
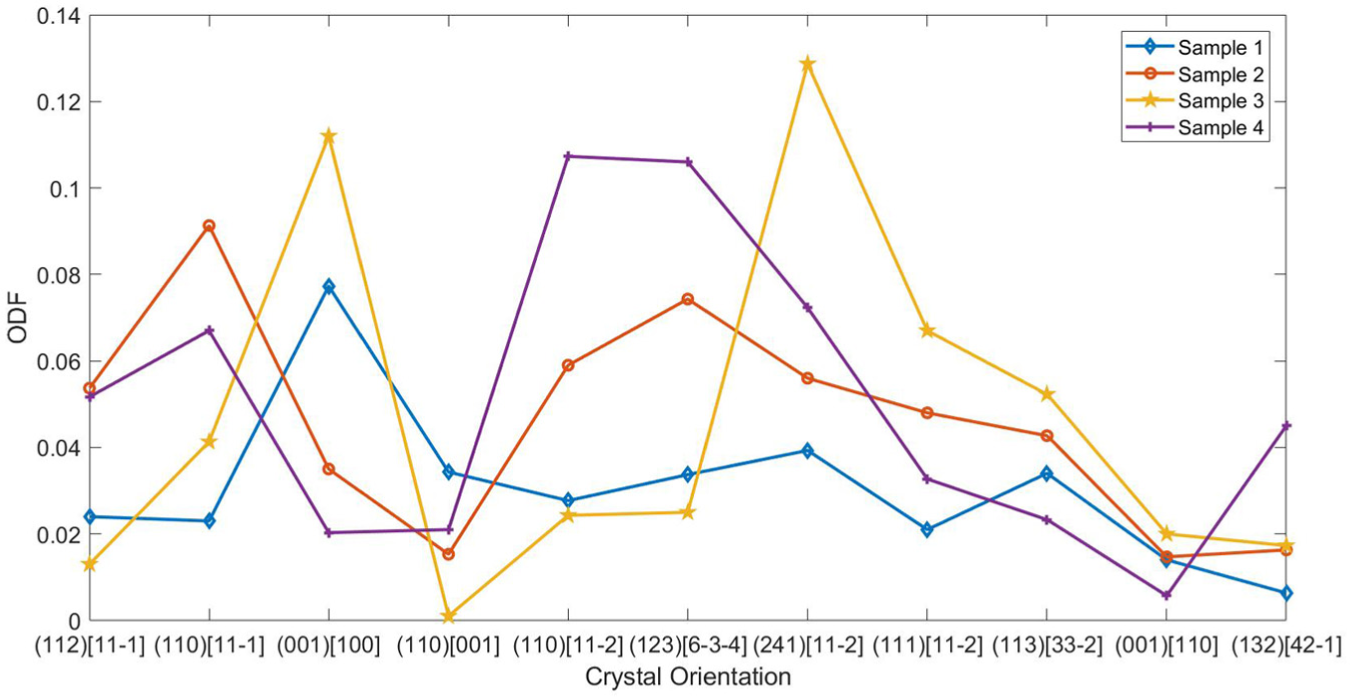
Comparison of the CO and ODFs between the four samples.
The Taylor factors of the four samples are 5.60, 8.44, 9.11, and 9.75, respectively. The comparison of the CO and the ODFs between the four samples shows that the Taylor factor increases with increasing ODFs and is different with COs.
Flow stress prediction
Flow stress is computed using equation (5) with the constants of Johnson–Cook and Hall–Petch equation provided by Tables 1 and 2. Strain and strain rate are calculated based on the methodology presented by Oxley. 28
The predictions of flow stress and the intermediate quantities of the procedure in the calculation of flow stress are listed in Table 10.
Taylor factor, undeformed depth of chip, contact length, and flow stress.
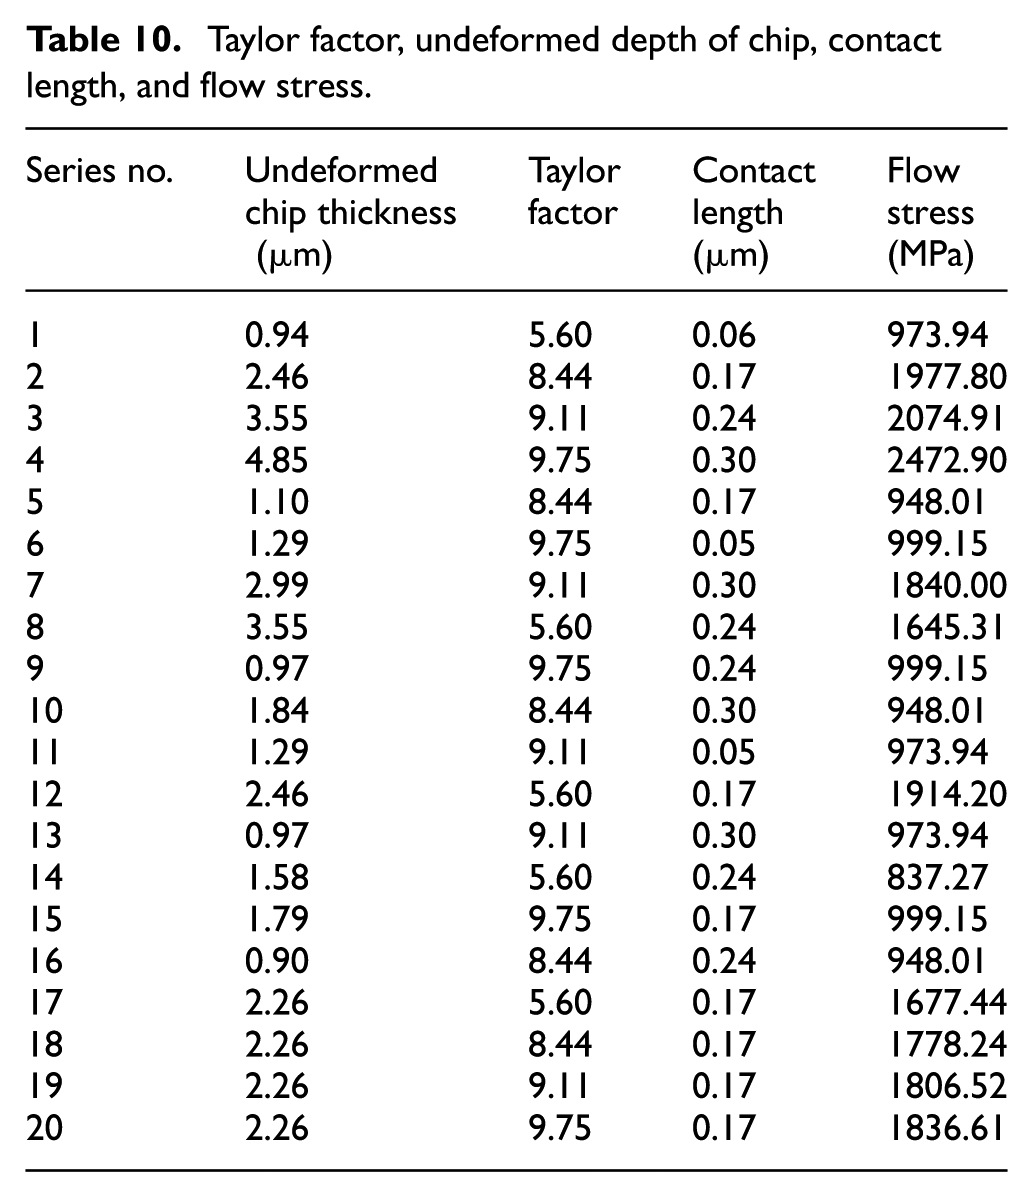
Figure 7 depicts the relationship between the Taylor factor and the flow stress resulted from single-factorial experiment, which suggests that the Taylor factor has a significant positive correlation with the flow stress.
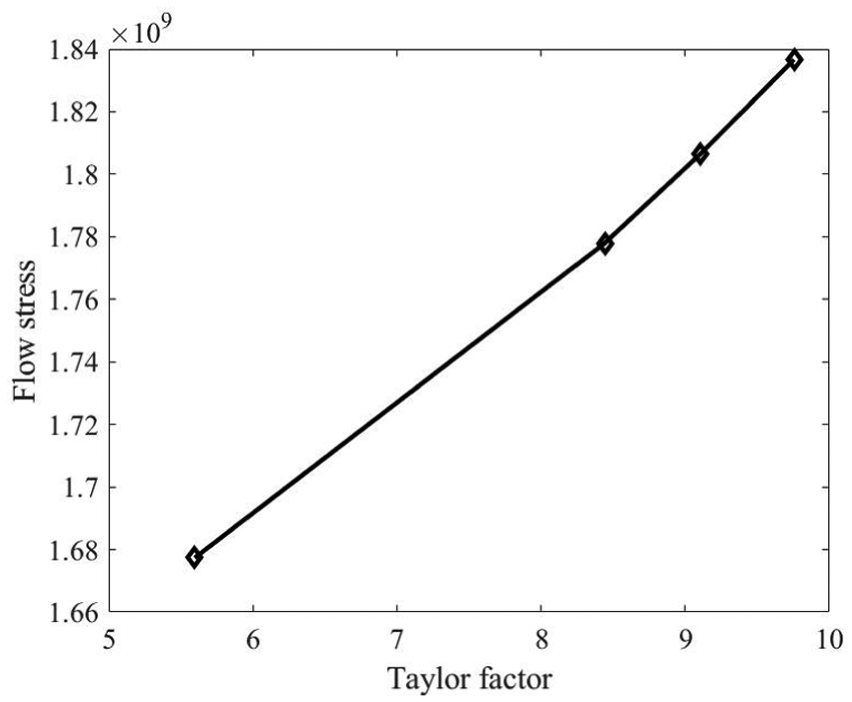
Relationship between the Taylor factor and flow stress.
Validation of the force model
The tangential and normal forces are predicted using the procedure mentioned in section “Modeling methodology.” Experimental data were collected from the 20 cases. Because the vibration of spindle rotating with high RPM generated noise in the force signals, a fast Fourier transform (FFT) analysis was performed for the output signals of the non-micro-grinding region and the micro-grinding region to identify the frequency range of the force signals, as displayed in Figure 8. Case 10 is taken as an example with the input parameters as follows: 6.28 m/s wheel speed, 5 mm/s feedrate, 30 µm depth of cut, and the Taylor factor of 8.44. The results show that the vibration of the spindle rotating with 10,000 r/min is 1000 Hz, and the frequency of the micro-grinding force signals is below 200 Hz. To block the noise of the rotational spindle, all measurement signals were filtered with a low-pass filter, as shown in Figure 9. Then, the mean value and standard deviation of the tangential and normal forces are calculated.
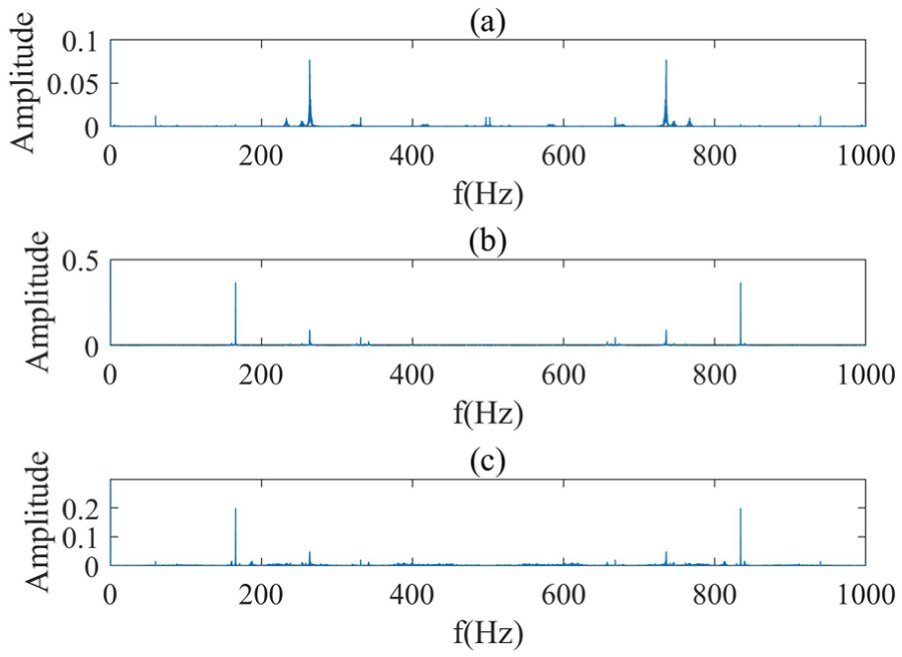
FFT analysis for the output signal of (a) no micro-grinding region, (b) micro-grinding region in the tangential direction, and (c) micro-grinding region in the normal direction.
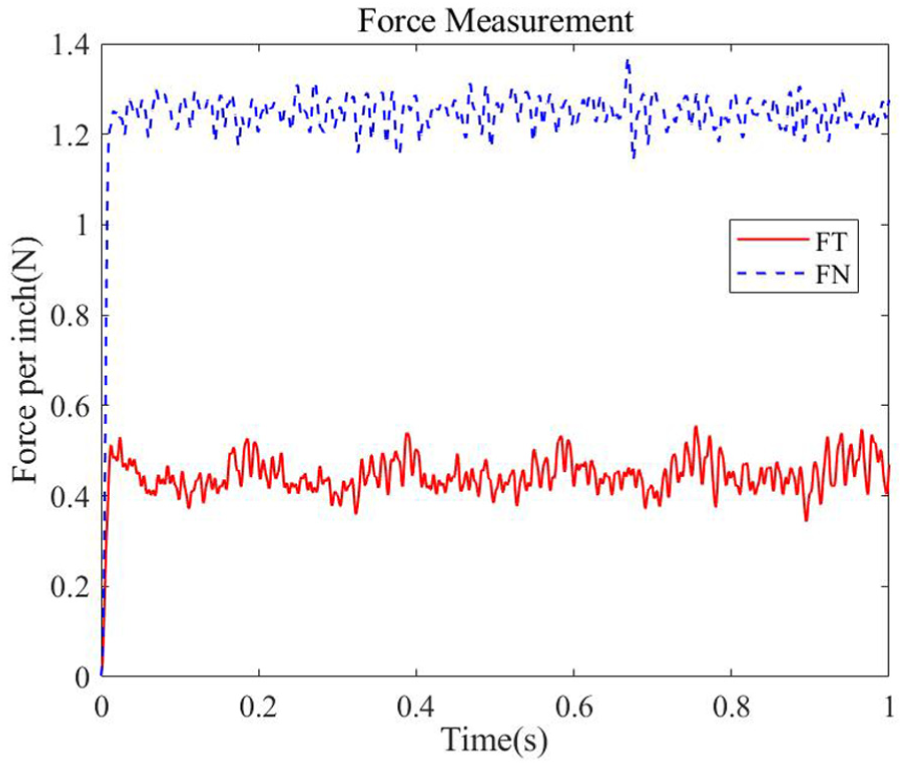
Experimental data of micro-grinding after filtering.
For the orthogonal-designed experiments, the comparisons between predictions and measured data in tangential and normal directions are shown in Figure 10.
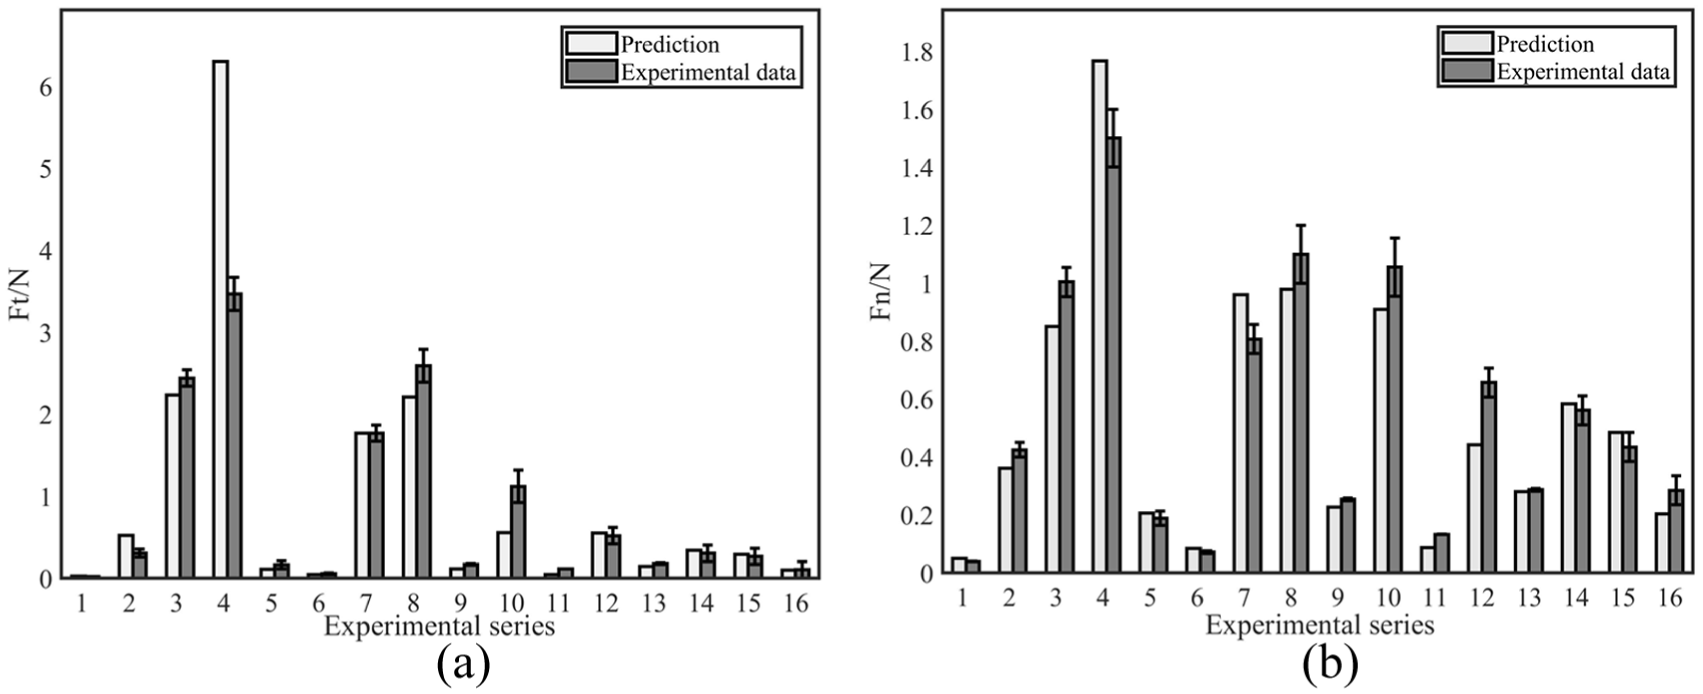
Comparisons of forces between the predictions and measured data in (a) tangential direction and (b) normal direction.
The results in Figure 10 indicate that the predictive and measured forces agree well within the range of the undeformed chip thickness less than 3 µm, suggesting that the proposed model is accurate in this region. This error is ascribed to the determination of material constants in the model of flow stress, the change of the tool edge radius due to the tool wear, and the variation of dislocation density. Furthermore, the result suggests that the Taylor factor model accurately predicts the effect of CO on forces in the micro-grinding process when only plastic deformation occurs. The error between predictive and measured forces of case 4 exceeds 50%, which indicates that the forces for undeformed chip thickness more than 3 µm cannot be predicted using this model. Because the material model was developed based on the assumption of tangible plastic flow, while the nature of the deformation in case 4 was dominated by brittle fracture. Therefore, the prediction was overestimated compared to measured data due to higher energy being required to remove materials by plastic deformation than by brittle fracture.
Sensitivity analysis
A sensitivity analysis of model parameters on micro-grinding forces is conducted to study the relationship between the forces and the process parameters including wheel speed, feed rate, and depth of cut with the exact range listed in Table 5. The plots of the main effects on micro-grinding forces are shown in Figure 11.
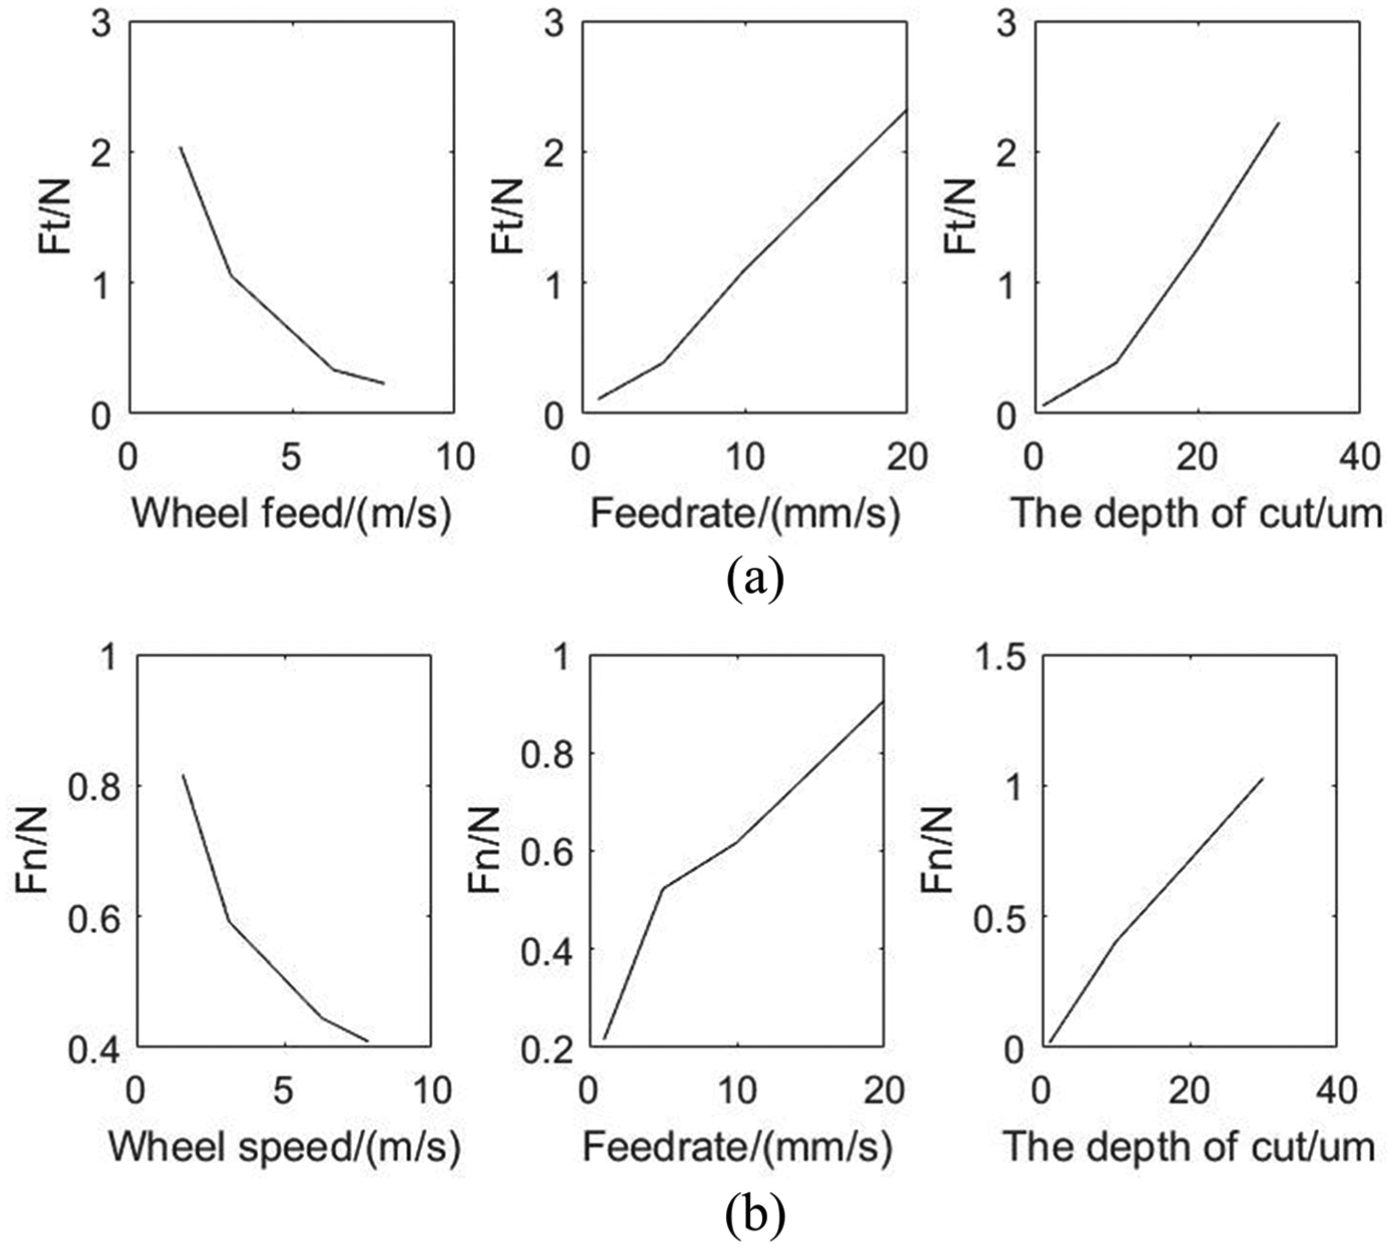
Sensitivity analysis of the main effects on (a) tangential force and (b) normal force.
The results demonstrate that the process parameters strongly influence the micro-grinding force within the explored experimental range. The spindle RPM has a negative correlation with tangential and normal force, while the feed rate and depth of cut reveal positive effects on the forces.
Effect of CO on the forces
For the single-factorial experiment with the variable of Taylor factor, the experimental data were compared to predictions, as shown in Figure 12. The force model using the presented Taylor factor model performs well in terms of capturing the trend and magnitude of experimental data, with errors of approximately 5% in the tangential direction and 8% in the normal direction. The forces predicted by the model considering the Taylor factor as the fixed value of 3.06 does not capture the trend of the experimental data with the varying CO. The maximum error between the measured data and the predictions exceeds 30% in the tangential direction and 25% in the normal direction. The prediction results from the model that does not take account of grain size also agree well with that using the proposed Taylor factor model, with a maximum error of 0.03 N on the tangential force and 0.025 N on the normal force. The results indicate that CO has more significant influence than grain size on the micro-grinding forces when considering the effect of the texture of workpiece material. The results also indicate that the Taylor factor model is accurate to quantify the effect of CO on micro-grinding forces.
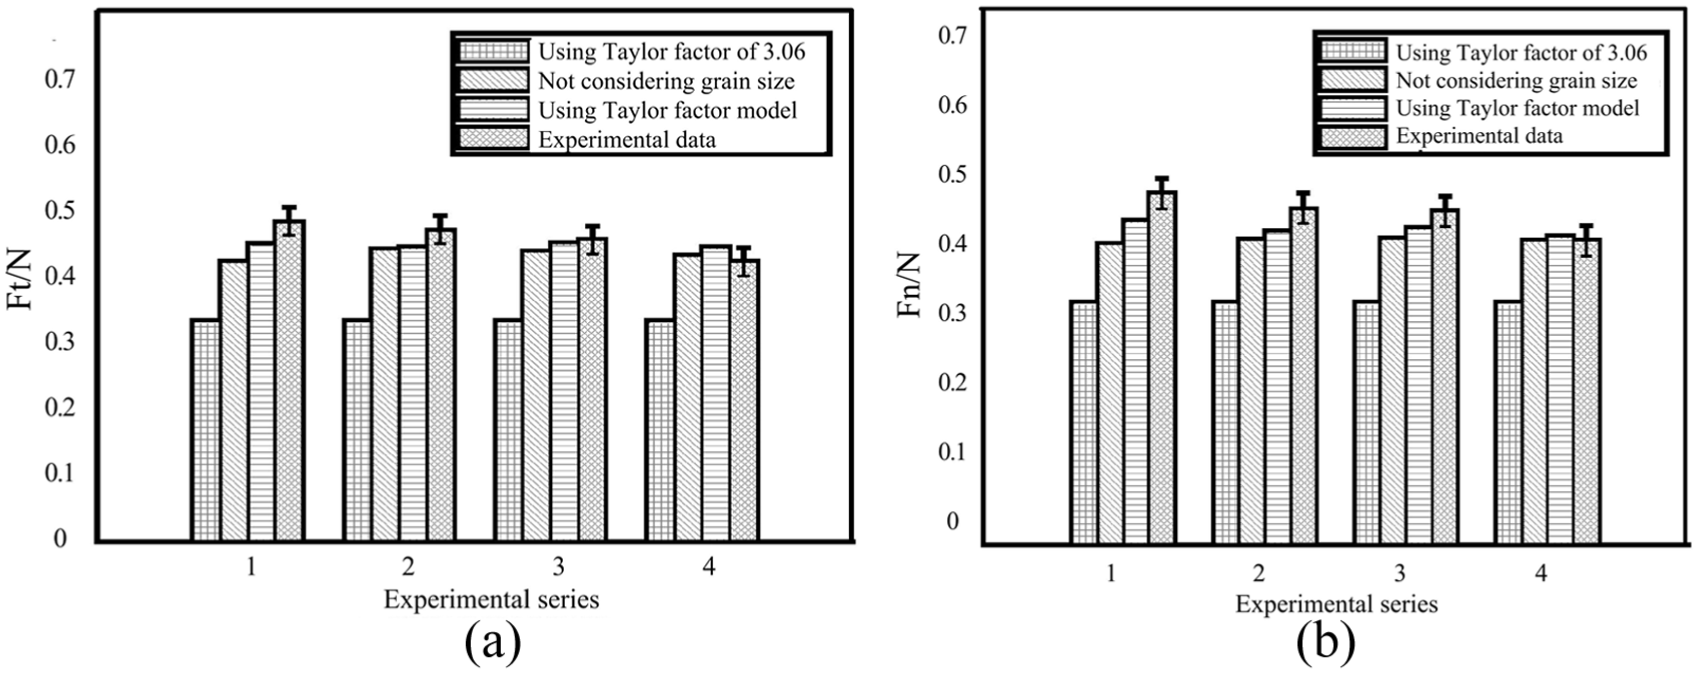
Comparisons of forces between predictions and experimental data in (a) tangential direction and (b) normal direction.
Conclusion
This investigation presents a comprehensive model of micro-grinding force, which considers three main factors: process parameters, material microstructure, and the topography of the micro-grinding wheel. The Taylor factor model is developed to quantify the effect of CO on the flow stress of the polycrystalline material. Then, the force model of the single-grit interaction is constructed, based on which the total grinding force of the whole wheel is obtained by multiplying the contact length and width.
The proposed model is verified by conducting a set of micro-grinding experiments. The comparisons between them show that predictions driven by the proposed model capture the trend and magnitude of the measured data, which prove that the proposed model is accurate. The sensitivity analysis of the experimental results demonstrates that the process parameters have significant effects on micro-grinding forces. Meanwhile, the comparison between the prediction and the experimental data of the single-factorial experiment indicates that the Taylor factor model is capable of predicting the influence of CO on micro-grinding forces, and the maximum error caused by CO is less than 5% in the tangential orientation and 8% in the normal orientation. The above analysis demonstrates that the proposed Taylor factor model is feasible to capture the effect of CO on flow stress.
Moreover, the machining mechanism of the micro-grinding process is drawn from this study. In the micro-grinding of polycrystalline materials, plastic deformation occurs due to dislocation movement, and the slip system is activated when the shear stress is larger than the critical value. The resistance of the grain boundary on dislocation slide is affected by the micro-texture. The grinding forces are affected significantly by the angles between the CO of workpiece material and cutting direction in the micro-grinding process. As the angle between the cutting direction and the slip direction decreases, the value of the Taylor factor drops. As the Taylor factor has a positive correlation with both forces, the shear force reaches its minimum when the CO of cutting is parallel to one of the slip directions. In the FCC crystal, the slide planes belong to the
However, it is difficult to control the CO of the material and the cutting direction, which will be a primary focus of our future work. Moreover, judging by the sensitivity analysis, the low micro-grinding forces and high material removal rate are obtained simultaneously through the increase in the spindle RPM and feed rate.
Footnotes
Appendix 1
Acknowledgements
The authors would like to gratefully acknowledge the equipment and support from the Precision Machining Research Center (PMRC), which is part of the Georgia Tech Manufacturing Institute (GTMI) at the Georgia Institute of Technology.
Declaration of conflicting interests
The author(s) declared no potential conflicts of interest with respect to the research, authorship, and/or publication of this article.
Funding
The author(s) disclosed receipt of the following financial support for the research, authorship, and/or publication of this article: This study was supported by the National Natural Science Foundation of China (Grant No. 51705073) and the Fundamental Research Funds for Central Universities of China (CUSF-DH-D-2017060 and No. 2232018D3-23).