
Abstract
In order to better understand transition zones with a variety of structural features that affect thin varying thickness strips, 6061 aluminium alloy thin strips were flexibly rolled into different thickness ratios and transition zone lengths, using an innovative micro rolling mill. The microstructure and mechanical properties of the thin varying thickness strips produced by micro flexible rolling were systematically investigated and the mechanisms were analysed. The results indicate that a thin varying thickness strip with either a larger thickness ratio or a shorter transition zone length will present a relatively high slope of the transition zone during micro flexible rolling. After tensile tests, a thin varying thickness strip with the highest thickness ratio achieved the largest yield strength and ultimate tensile strength. In comparison, transition zone length can have a greater influence on the strain of the transition zone than on the thickness ratio because of the variation in β. The measured hardness is greater in the thinner zone than in the thicker zone. Values in the thinner zone are about 7%–21% greater than those in the thicker zone for strips with different thickness ratios due to the increased strain level which causes different degrees of work hardening.
Keywords
Introduction
Lately, flexibly rolled strip of 6061 aluminium alloy – which has low density and medium strength, good formability, ease of recycling and high corrosion resistance1–3– has attracted increasing attention4,5 as a structural material because of the increasing demand for lightweight design. 6 It not only allows for a reduction in mass weight but can also cut costs for both the aerospace and automotive industries. 7 Depending on manufacturing methods, dimensions and applications, flexibly rolled strip can be divided into three categories, as shown in Table 1. These include longitudinal profile plate, produced by hot rolling and widely used in bridge and shipbuilding,8,9 and tailor rolled blanks, which are usually used in load-optimised lightweight structural parts for automotive applications10,11 such as hang-on parts, including doors, hoods and roof panels. 12 By comparison, thin varying thickness strip is used mainly for microscale products in many industrial applications and, in particular, for electronic components in micro-system technologies13,14 and micro-electromechanical systems. 15
Detailed comparison among various categories of flexibly rolled strips.
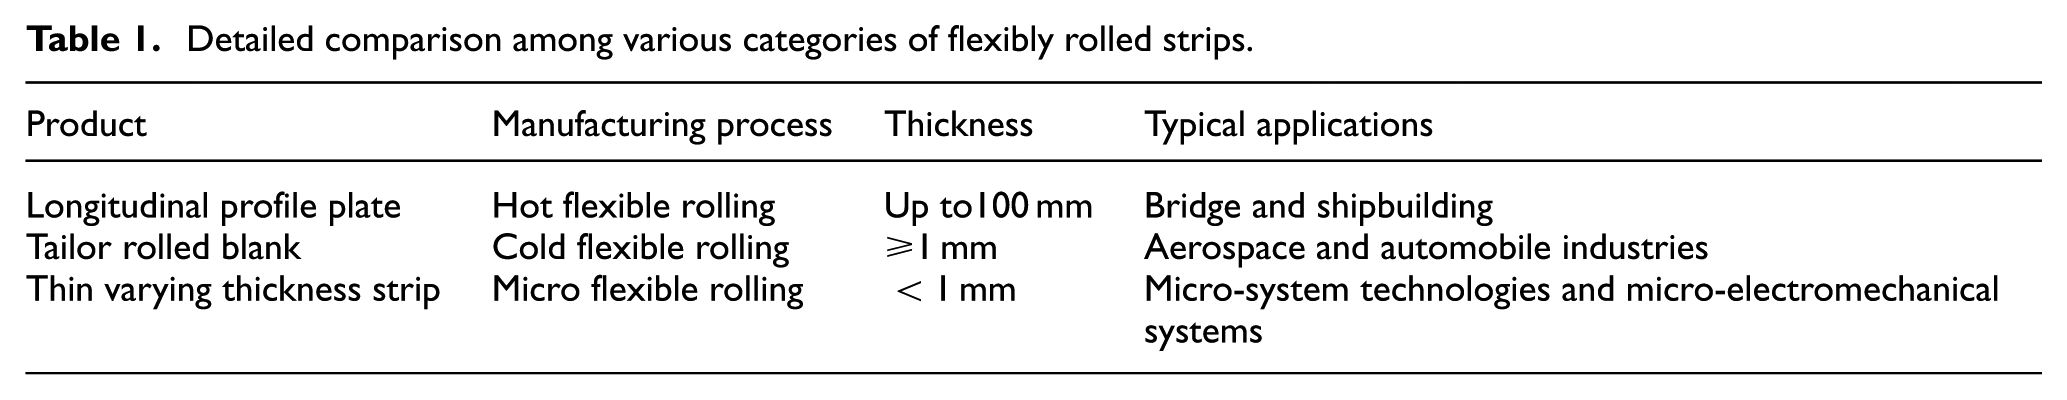
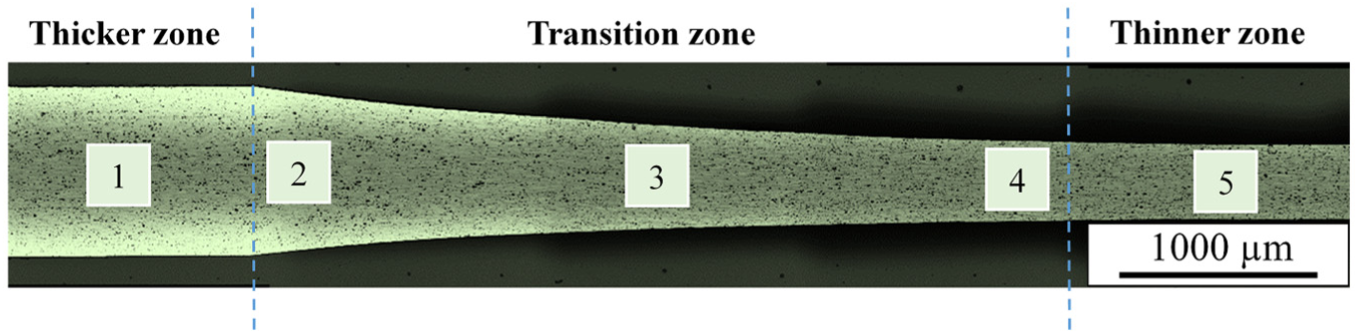
Figure 1 schematically shows the complete procedure of flexible rolling. The raw materials are flexibly rolled by a micro rolling mill with a closed-loop online adjustment control of the roll gap in order to achieve arbitrary thickness distributions in the rolling direction, followed by proper heat treatment to eliminate work hardening and residual stress. Then, the strips are levelled, cut and packed to specific requirements in terms of dimension, thickness ratio (the ratio of thickness at the thicker zone to that of the thinner zone) and transition zone shape. Figure 2 shows a macroscopic cross section of a thin varying thickness strip, from which the thicker, transition and thinner zones can be clearly distinguished. The thickness in the transition zone can be seen to change continuously as reduction progresses. As a result, a smooth thickness distribution, without stress peaks in the transition zone, will lead to improved formability. 16
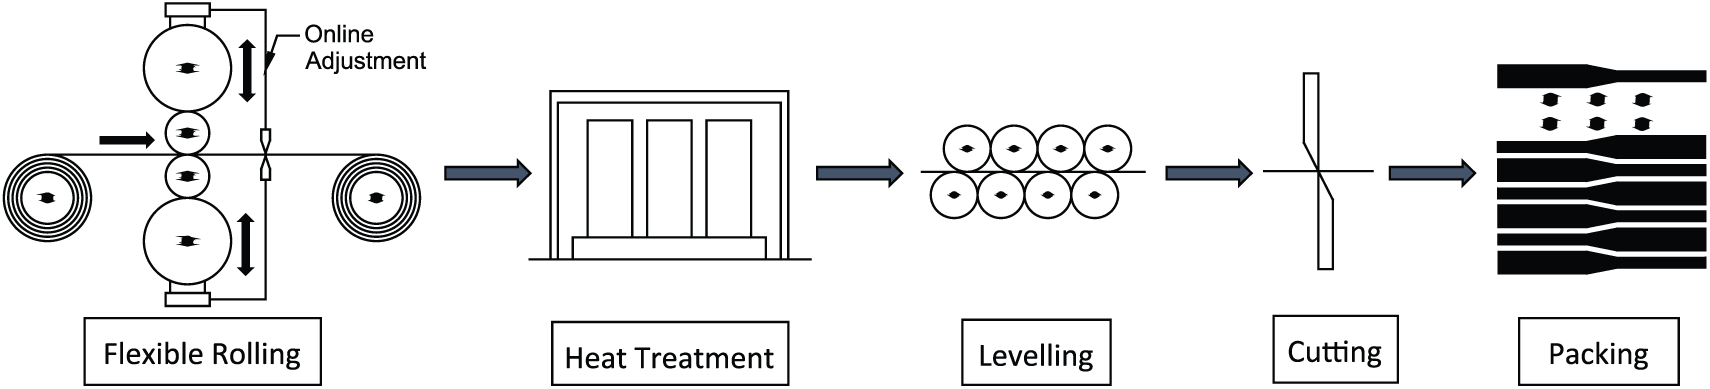
Schematic illustration of the procedure of flexible rolling.
An assembled image of thin varying thickness strip by the three-dimensional (3D) laser scanning microscopy.
Due to the special features in each deformation zone, local inhomogeneity of material properties will be caused by strain hardening. This means that the mechanism of flexible rolling is more complicated than the conventional flat rolling process, which urgently drives the need for an innovative rolling technology to substantiate this technological improvement. 17 As a consequence, a large number of investigations have been conducted in order to understand the mechanisms involved in the flexible rolling process. Kopp et al. 18 evaluated the forming behaviour of flexibly rolled strip produced by DC04 steel using deep drawing tests. They found that a shorter transition zone length would result in localised high wrinkling due to a number of loose contacts between blank and blank holder. Flexibly rolled strip with a longer transition zone length, on the other hand, leads to better surface quality with fewer wrinkles. Kleiner et al. 19 concluded that the manufactured crash structures of flexibly rolled strip for the automotive industry not only achieved a 13% lighter weight than that achieved using a constant raw material but also displayed profoundly improved structural behaviour in static and dynamic load trials. A study of residual stress in flexibly rolled strip was performed by Kim et al. 20 with Al5J32-T4 sheets using X-ray stress analysis. They showed that the residual stresses and distortion of the flexibly rolled strip increased when the rolling speed increased from 1.35 to 3 m per minute. However, samples with a rolling speed of 5 m per minute exhibited a non-increasing trend since insufficient deformation with a lower stored energy cannot support a large enough driving force for recrystallisation.
With the ongoing trend towards miniaturisation of systems and devices, 21 micro flexible rolling technology has been developed and applied to produce ultrathin strips with varying longitudinal thickness in microscale 22 but when the thickness of the workpiece to be flexibly rolled is scaled down to the submillimetre range, the so-called size effects that characterise the micro world will have a significant influence on the forming process.23,24 Qu et al. 25 developed a 3D Voronoi tessellation model to analyse the springback behaviour in relation to material heterogeneity and found that springback is expanded in the thickness direction, owing to the decrease in grain quantity with the decrease in initial specimen thickness.
Although extensive research has been devoted to investigating formability and springback behaviour, and so on, few studies accounted for the transition zone which plays a key role in evaluating the mechanical behaviour of thin varying thickness strip produced by micro flexible rolling. This work aims to systematically explore the deformation characteristics in the transition zone in micro flexible rolling process and investigate their effect on the microstructure and mechanical properties of 6061 aluminium alloy thin varying thickness strips with varying thickness ratios and transition zone lengths.
Experiment
Materials and rolling procedure
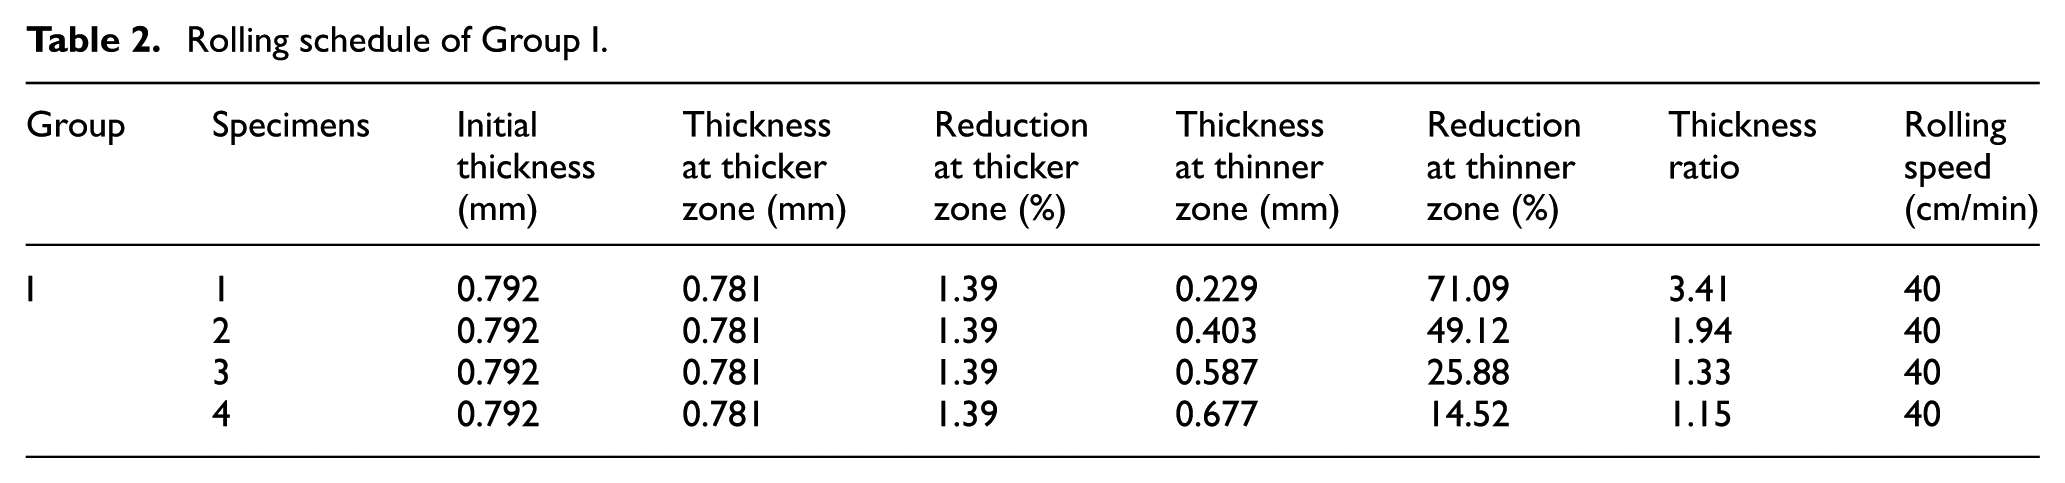
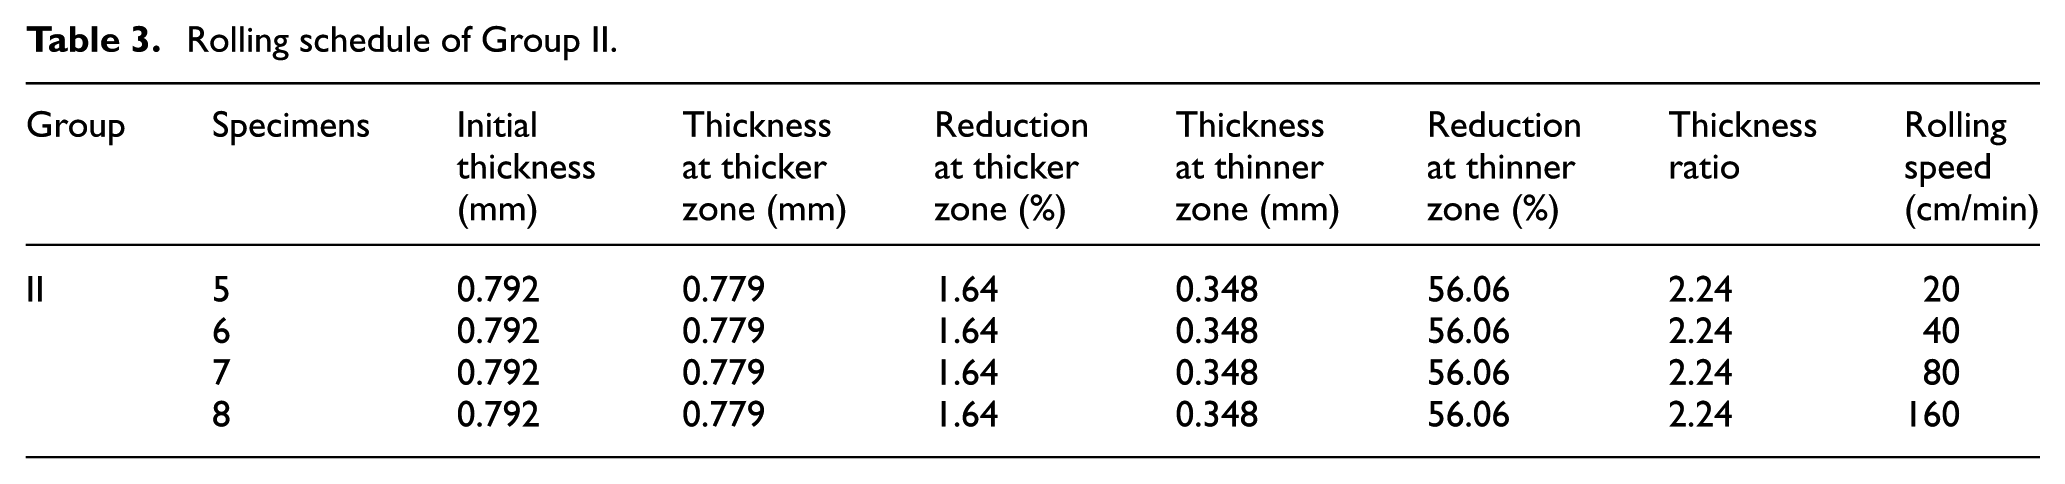
In this study, 6061 aluminium alloy thin strips with a thickness of 0.792 mm, a length of 150 mm and a width of 15 mm were used as the raw materials. The chemical compositions of the material were Al-0.85Mg-0.6Si-0.22Cu-0.15Mn-0.7Fe-0.15Ti-0.17Cr-0.25Zn (wt%). Figure 3 shows the newly designed micro flexible rolling mill. The rolling procedure started once the workpiece was detected by the laser apparatus set prior to the roll bite. With the ongoing process of micro flexible rolling, the roll gap was automatically adjusted with a lifting velocity accompanied by its rotation (rolling speed). The value of lifting velocity from the electric cylinder is commanded by a PLC programme depending on the pre-set parameters. Then, all the rolling data, including the actual rolling force and roll gap, were acquired and recorded using the SIMATIC STEP7 system. Thin strips were flexibly rolled into different thickness ratios and transition zone lengths through the change of rolling parameters. Accordingly, the specimens were divided into two groups based on the different rolling procedures and the specific rolling schedules of Groups I and II are presented in Tables 2 and 3, respectively. The specimens of Group I varied with the different thickness ratios, which were calculated by the ratio of thickness at the thicker zone to that of the thinner zone, and Group II differed in the transition zone lengths obtained from the diversity of the rolling speeds. Rolling tests were conducted on a flexible rolling mill at room temperature. The diameter and roll barrel length of the work roll were 25 and 40 mm, respectively.
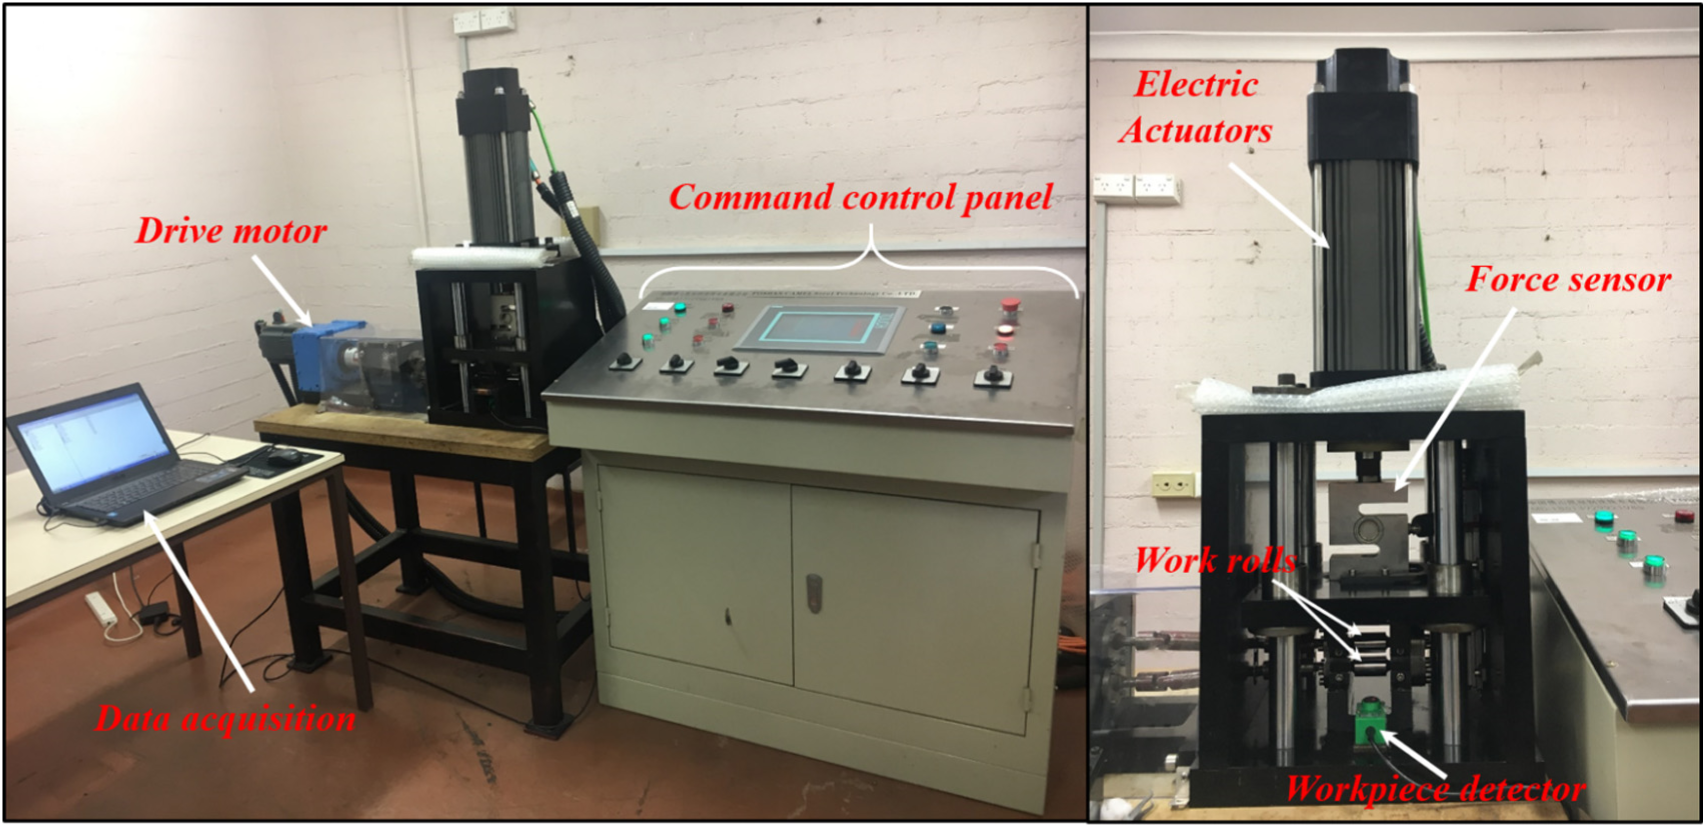
Illustration of the developed micro flexible rolling mill.
Rolling schedule of Group I.
Rolling schedule of Group II.
Metallography
Specimens for metallographic observation were cut from thin varying thickness strip along both the rolling and normal directions, then mechanically ground and polished by 0.25 μ alumina (<40 nm). Subsequently, the specimens were electrolytically etched with Barker’s etchant (5 mL HBF4 in 200 mL distilled water) at 24 V for 1.5 min using stainless steel cathode according to ASTM E407 for grain structure observation. The assembled microstructure along the rolling direction was examined by KEYENCE VK-X100 3D laser scanning microscope. False-colour optical micrographs with polarised light were carried out using a Leica DMRM microscope.
Tensile tests
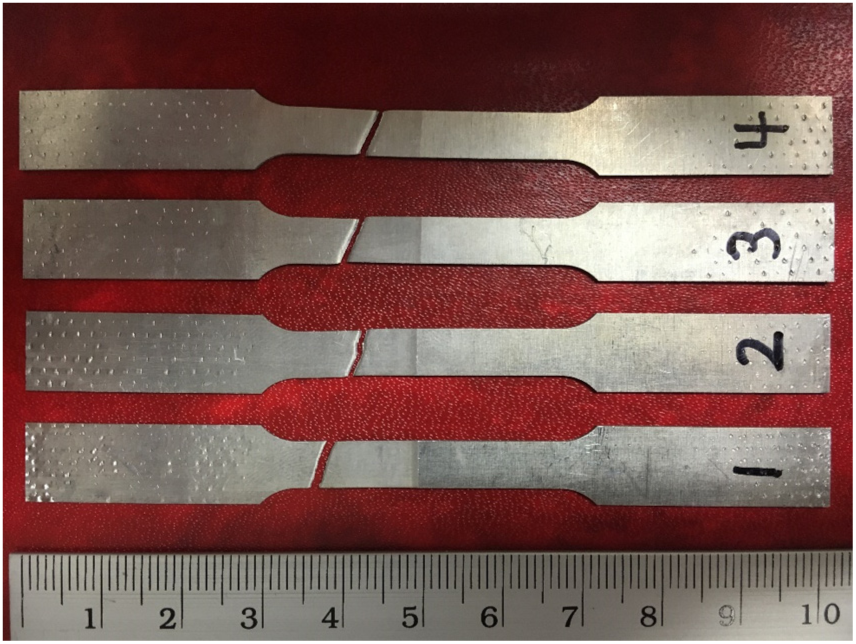
Tensile tests were conducted on an INSTRON 4206-006 universal testing machine, with a strain rate of 8×10⁻⁴ s−1 at ambient temperature, to evaluate the tensile properties of the rolled aluminium thin varying thickness strip produced under a variety of rolling schedules. The tensile specimens were machined along the rolling direction with the rolled transition zone oriented in the middle of the gauge section perpendicular to the tensile axis, as shown in Figure 4. The dimensions of the specimens were determined according to ASTM standards (E8M, 2015). This method has been widely used to evaluate the tensile properties of metal strips with varying thicknesses.26–28 For each kind of flexibly rolled strip, three specimens were prepared for the tensile tests.
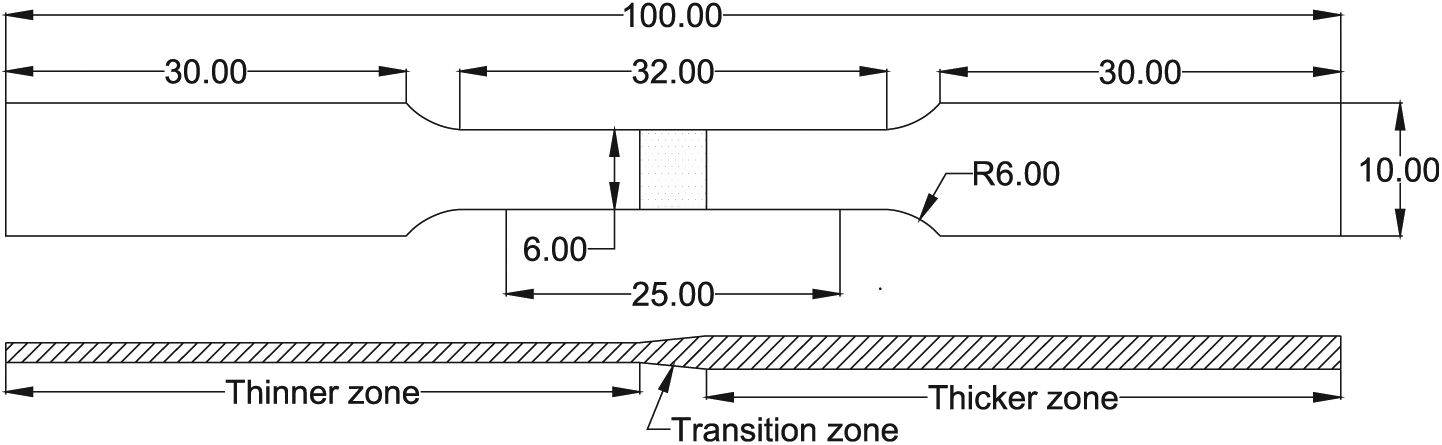
Geometry and dimensions of tensile test specimens with a transition zone.
A parameter β was used to evaluate the quality and strength of thin varying thickness strip by reflecting the propensity of the specimens to experience strain localisation in the transition zone and fail during formation 29
where
Hardness test
A Vickers hardness testing machine was employed in order to determine the hardness differences of all the thin varying thickness strip specimens in the thicker, thinner and transition zones by applying a load of 1 kgf with a dwelling time of 12 s. Hardness measurements were performed on the cross-sectional surfaces of the rolled strips along the rolling direction. Five measured positions with three duplicate tests were made for each specimen, as indicated in Figure 2.
Fractography
The fracture surfaces of the specimens after tensile tests were observed on a QUANTA 600 scanning electron microscope (SEM) operated at 20 kV to determine the fracture features and failure modes.
Results and discussion
Microstructural evolution
The initial microstructure of the 6061 alloy strip is shown in Figure 5. The typical rolled structure, with elongated grains, can be clearly observed. The black particles are mainly Fe-bearing constituent phases that are likely combined with some large strengthening secondary phase particles Mg2Si. 30
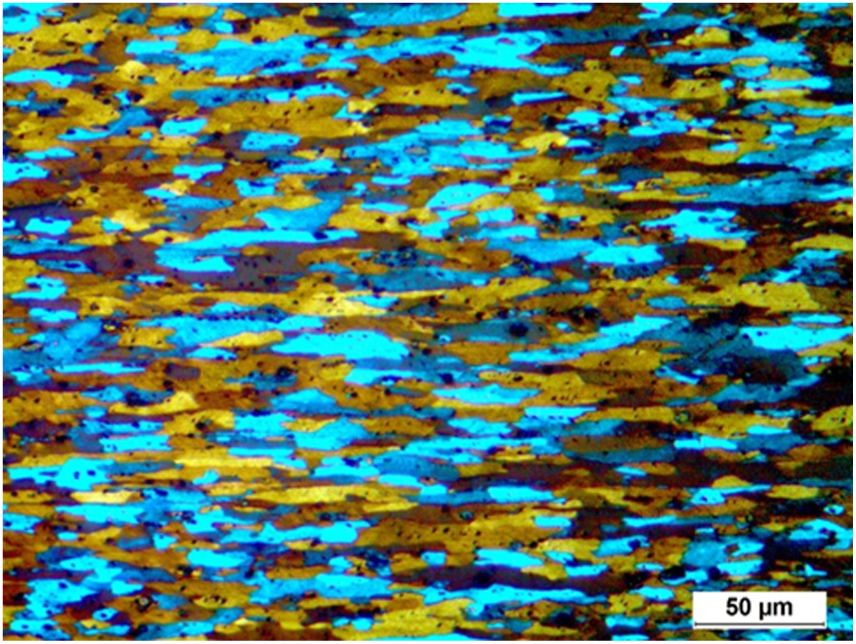
Initial microstructure of the 6061 alloy strip.
After flexible rolling, when compared to the initial microstructure, there is no apparent change in Group I in the thicker zone due to small thickness reduction, as shown in Figure 6. Nevertheless, it is significantly distinct from the transition zone to the thinner zone (Figures 7 and 8). To examine the features of microstructural evolution in the transition zones, each specimen was observed at position 2, as shown in Figure 2. By contrast, the lamellar spacing of the elongated bands decreases gradually in the transition zones of specimens 1, 2, 3 and 4 because of the different thickness ratios with various amounts of strain on these sections (Figure 7). As indicated in Figure 7(a), it can be seen that specimen 1, with the biggest thickness ratio of 3.41, induces the highest trend line slope of deformed grains in the surface layer. The slope of Group I shows a downwards trend with the decrease in the thickness ratio, as shown in Figure 7(b)–(d). The microstructural evolution of the thinner zone (Figure 8) also shows a trend that the aspect ratio of the flexibly rolled specimens was clearly aggravated from specimens 4 to 1 gradually. This is also in accordance with the corresponding rolling schedule (Table 2) that a higher reduction always leads to a higher level of deformation.
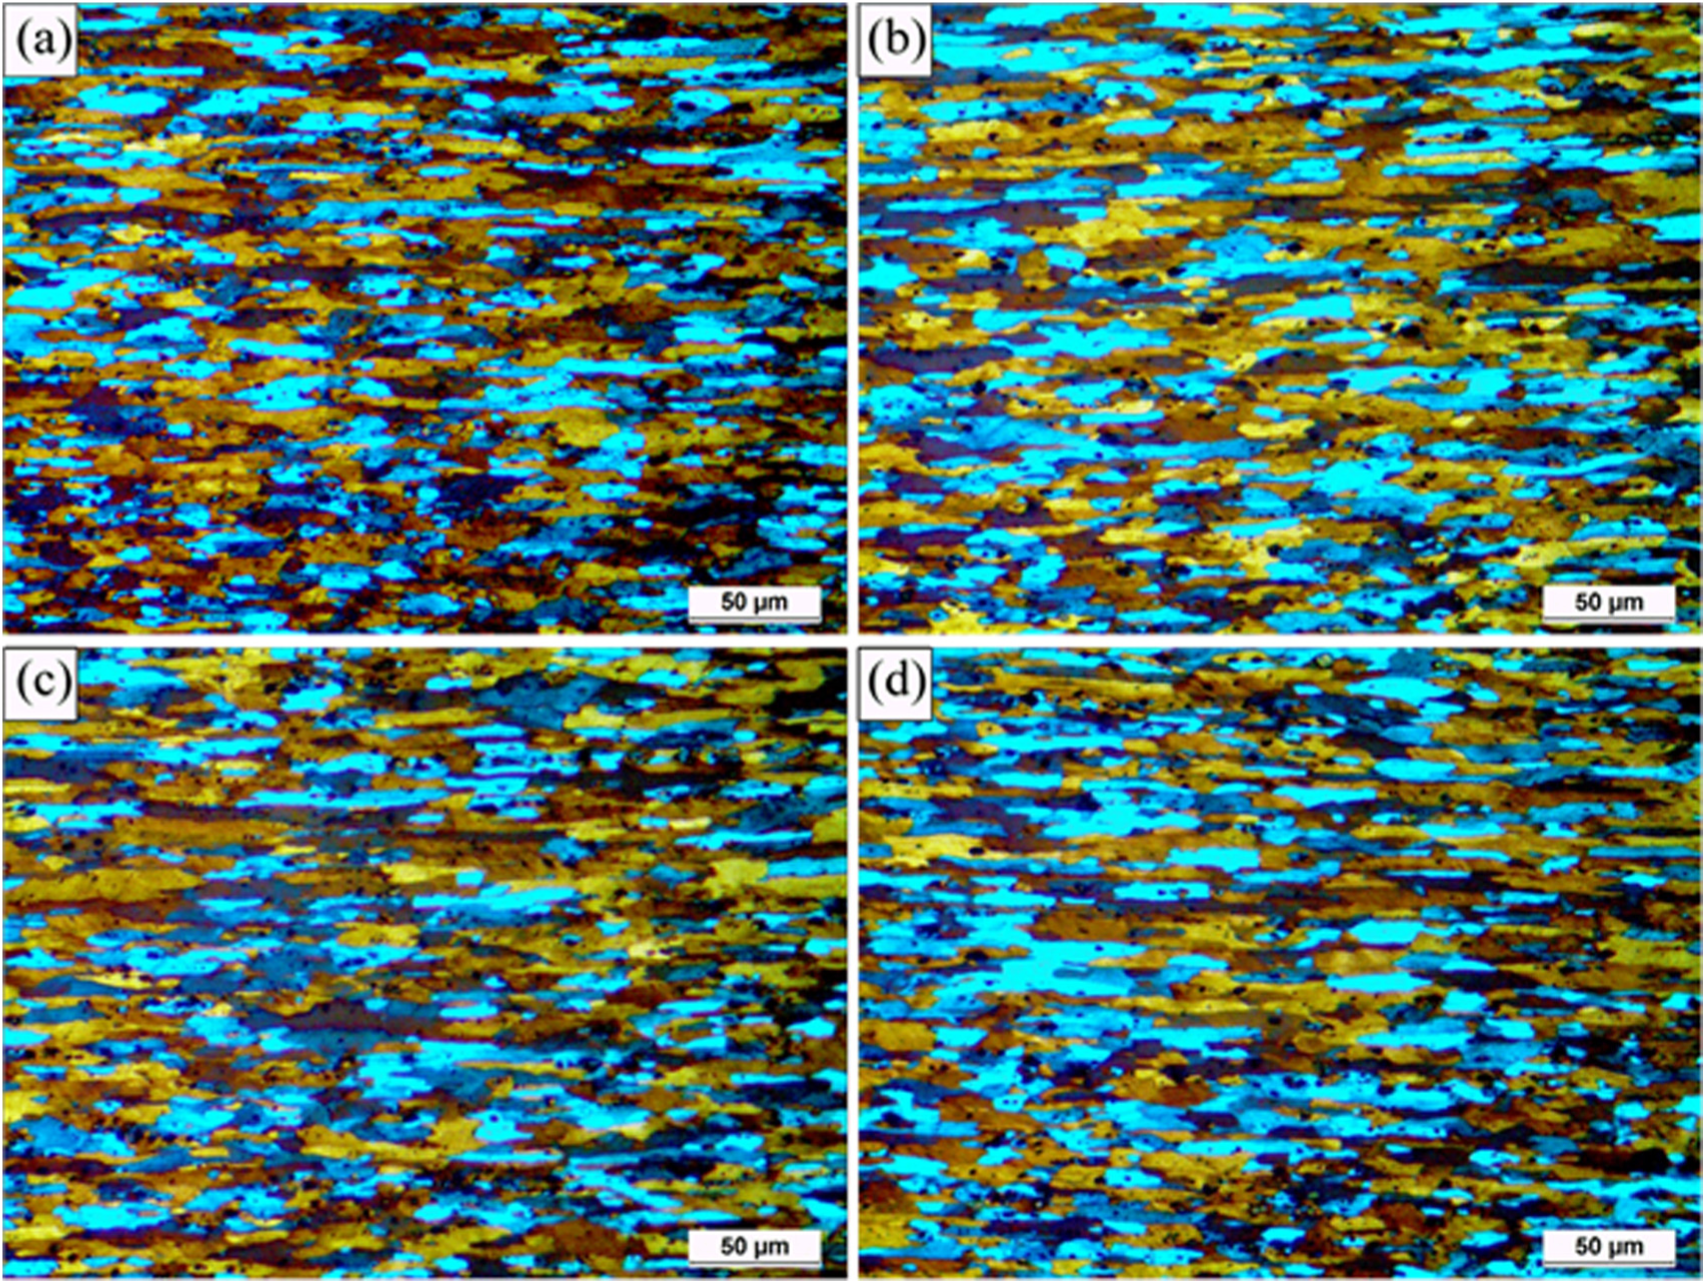
Microstructure of the (a) specimen 1, (b) specimen 2, (c) specimen 3 and (d) specimen 4 in the thicker zones.
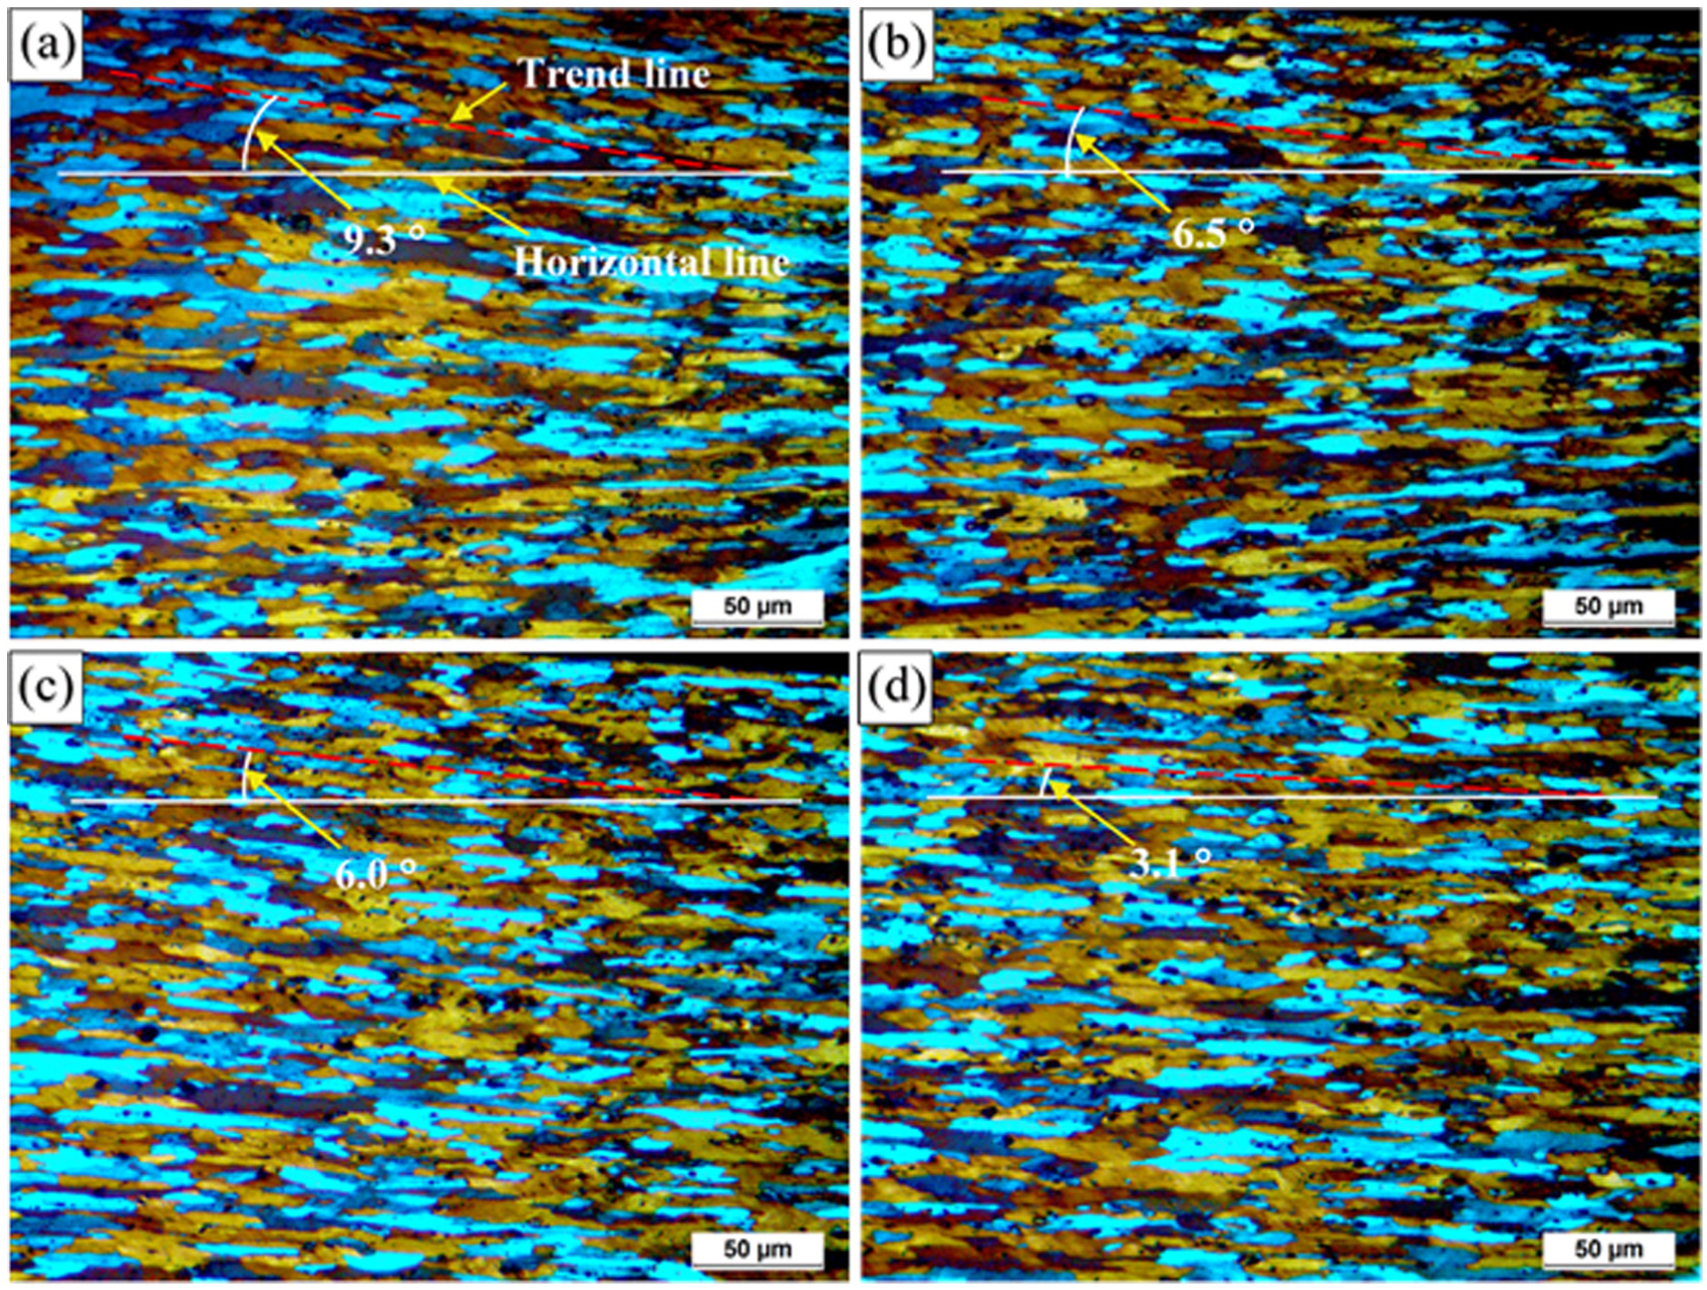
Microstructure of the (a) specimen 1, (b) specimen 2, (c) specimen 3 and (d) specimen 4 in the transition zones.
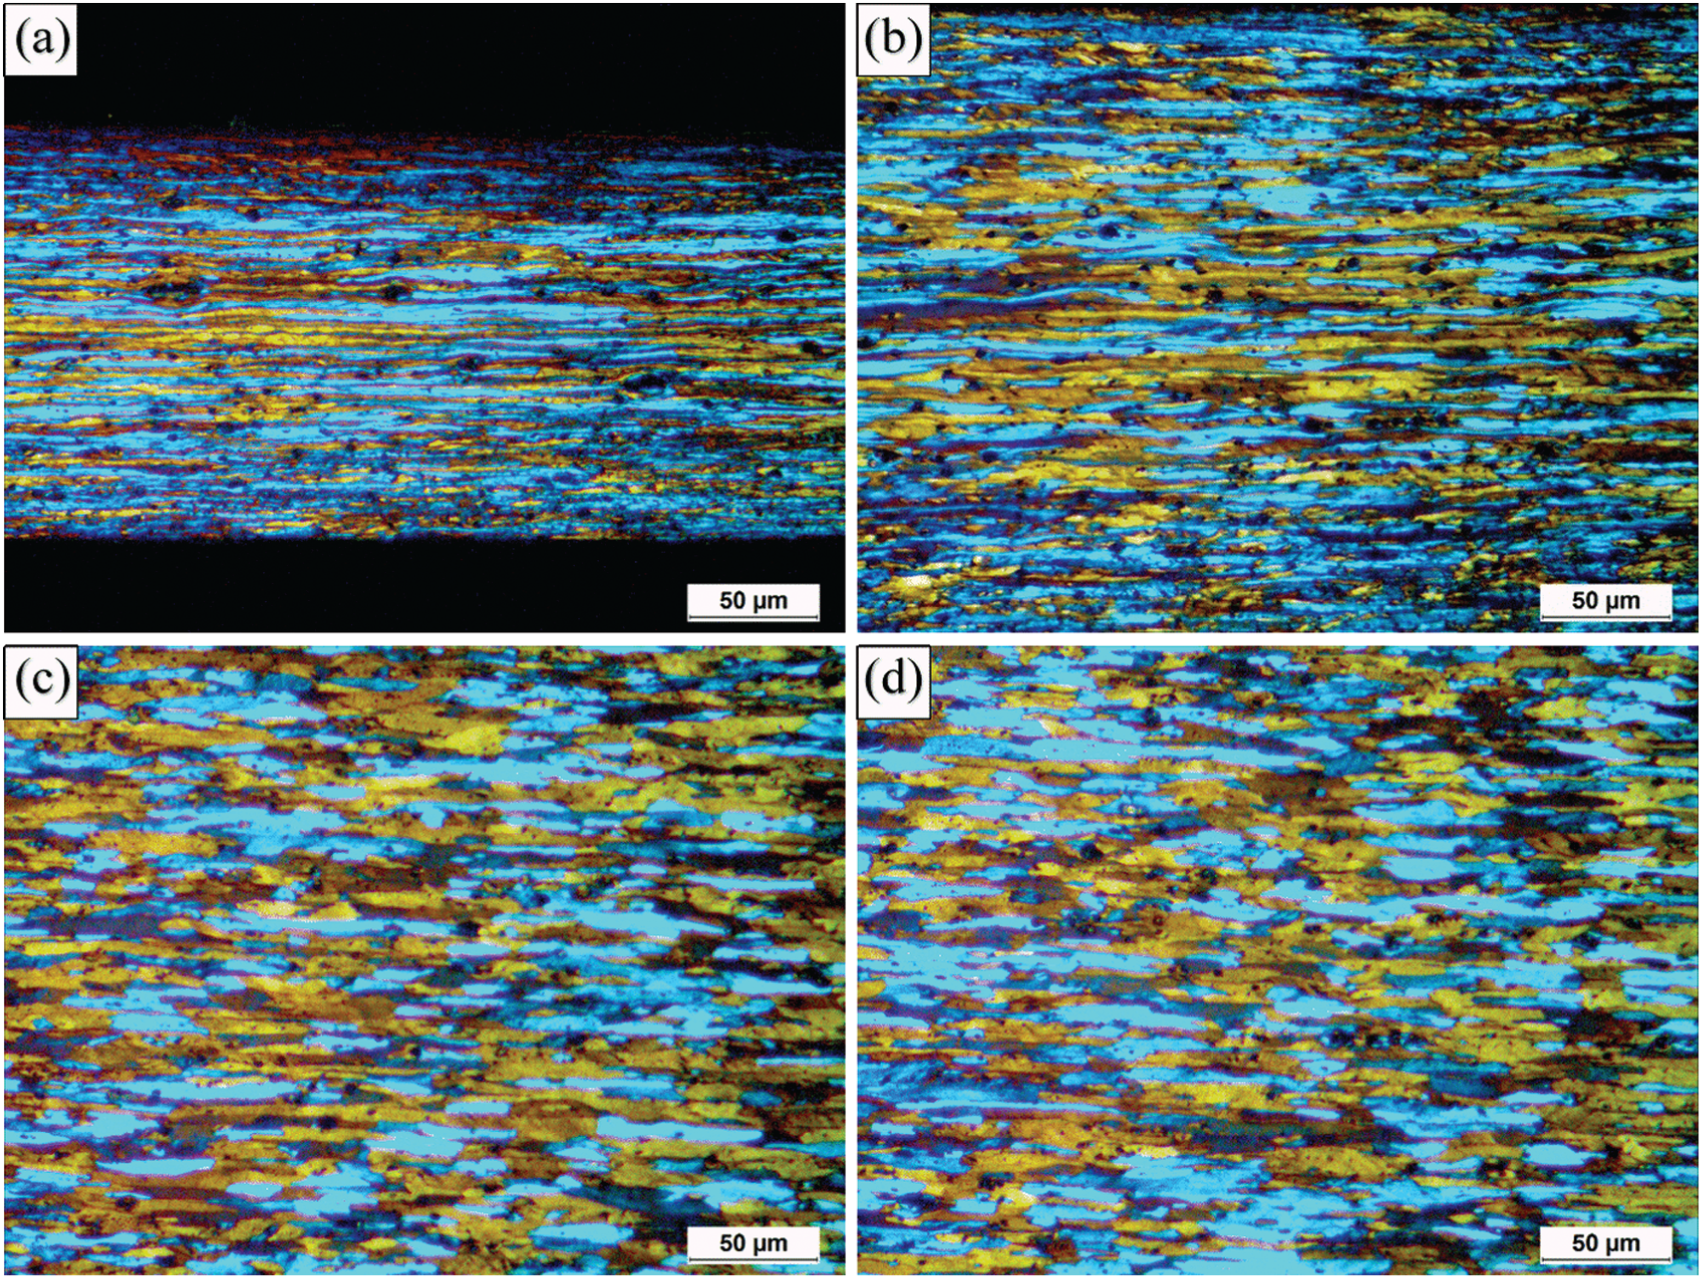
Microstructure of the (a) specimen 1, (b) specimen 2, (c) specimen 3 and (d) specimen 4 in the thinner zones.
For Group II, the transition zone lengths have quite similar effects on the microstructure to those of Group I. Higher lamellar spacing density also occurs on the right side of each microstructure shown in Figure 9, and the angle between the trend line and the horizontal line reduces from 6.5° for specimen 5 to nearly 2.9° for specimen 8. This occurs because a longer transition zone length will lead to less aspect ratio evolution of the deformed grains. The behaviour of the deformed microstructures mentioned above can also be found to have corresponding relationships to the mechanical properties of tensile tests, hardness tests and fractographs and will be discussed in the following sections.
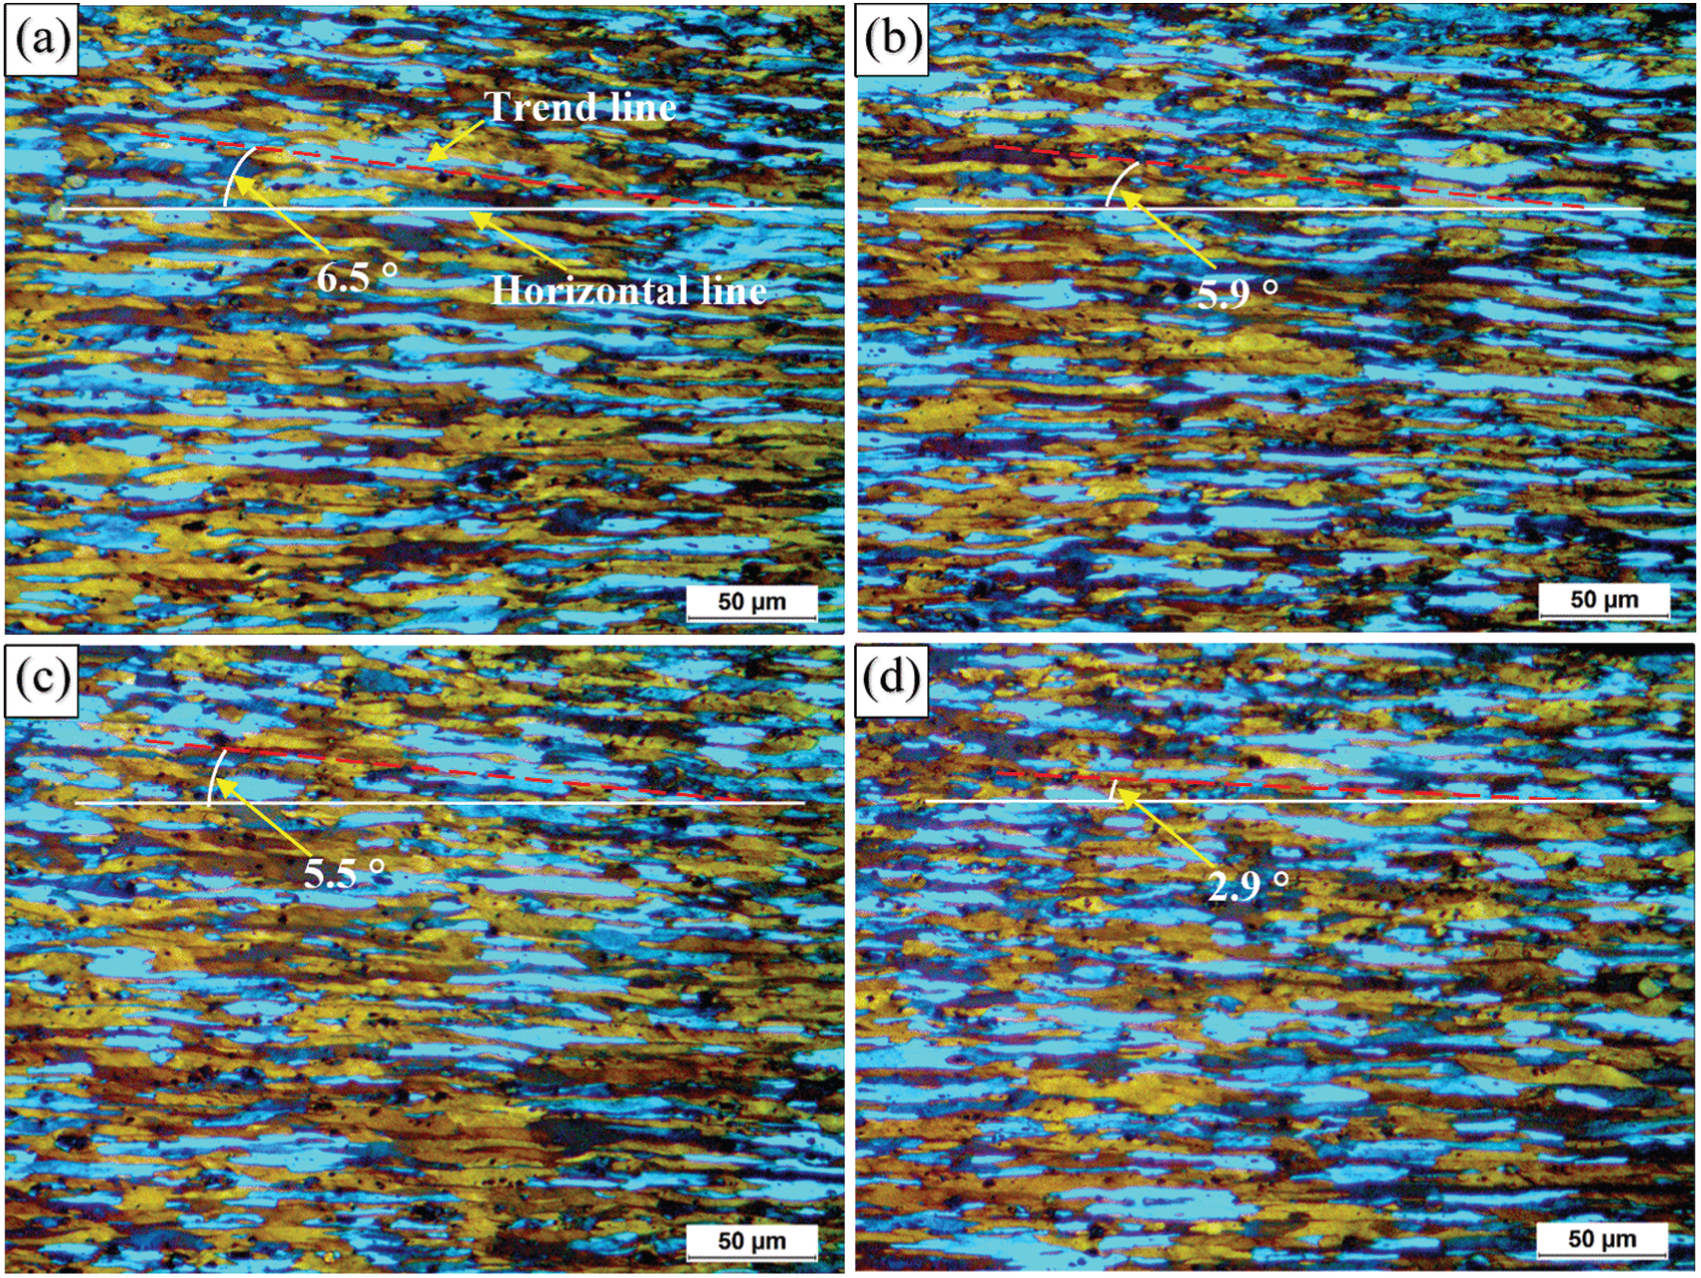
Microstructure of the (a) specimen 5, (b) specimen 6, (c) specimen 7 and (d) specimen 8 in the transition zones.
Tensile properties
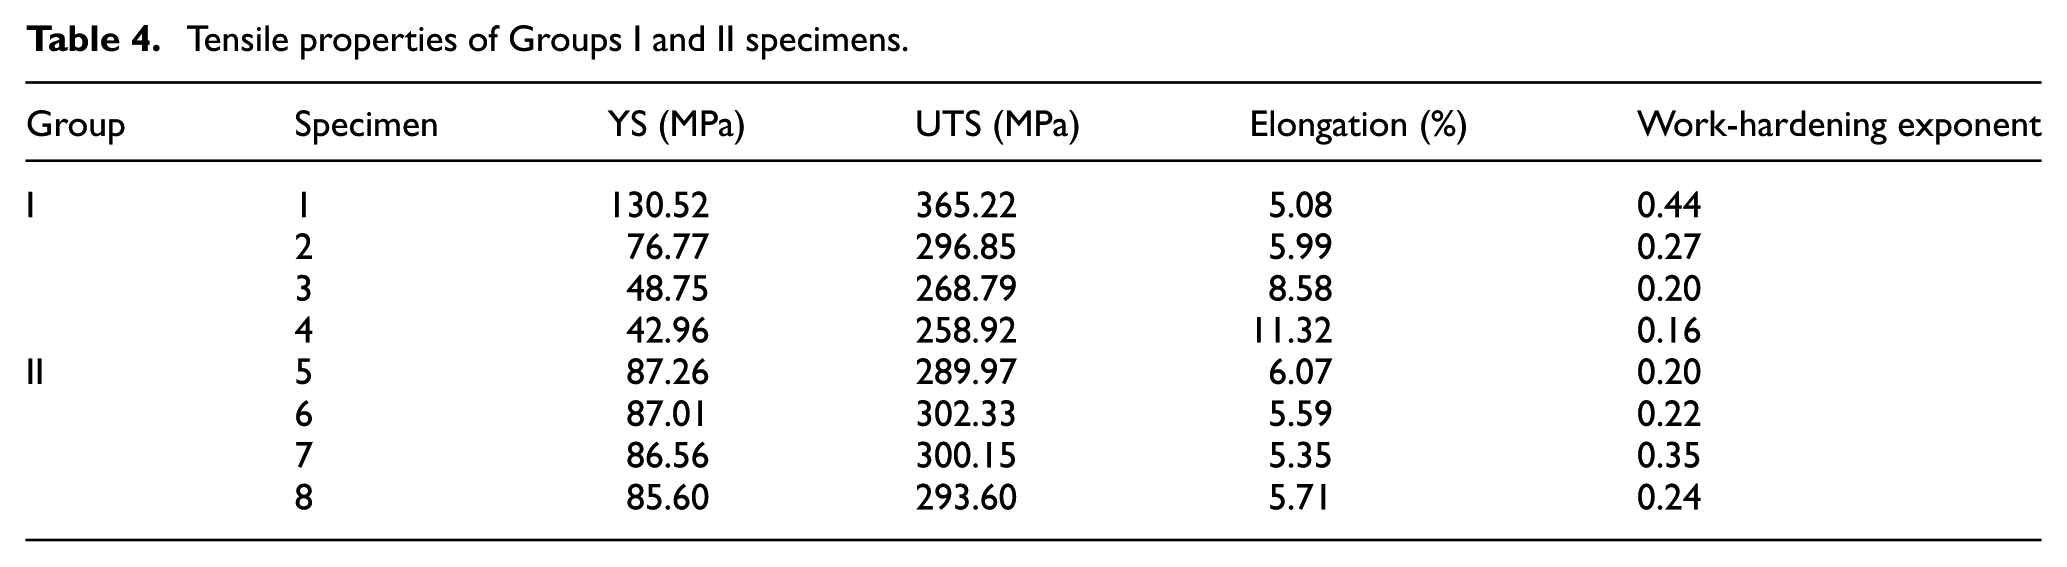
Figures 10 and 11 show the engineering stress–strain curves of Groups I and II, respectively. Since all the fracture sites happened at the thinner zones, the tensile properties, including yield strength (YS), ultimate tensile strength (UTS) and elongation, were calculated based on the cross section of the thinner zones and presented in Table 4. The variations in tensile strength and elongation in the Group I are related to the total reductions applied during flexible rolling. It can be seen that both the YS and UTS of the specimen 1 are the highest in the Group I, and these decrease gradually in specimens 1, 2, 3 and 4. Elongation, instead, shows the opposite trend to that of tensile strength. This means that the strain-hardening phenomenon appears since slips of deformed microstructure, dislocation tangle 31 which elongates the grains into high aspect ratio (Figure 8) or crush during flexible cold rolling with plastic deformation below the recrystallisation temperature. 32 In this case, strength and hardness of specimen 1 will be enhanced to some extent, while the ductility presents a relatively downwards trend. For Group II, as shown in Figure 11 and Table 4, all of the tensile properties fluctuated around a specific value except for a slight drop in YS from 87.26 to 85.60 MPa. This is reasonable, however, as transition zone lengths vary only slightly among the Group II specimens because of distinct rolling speeds.
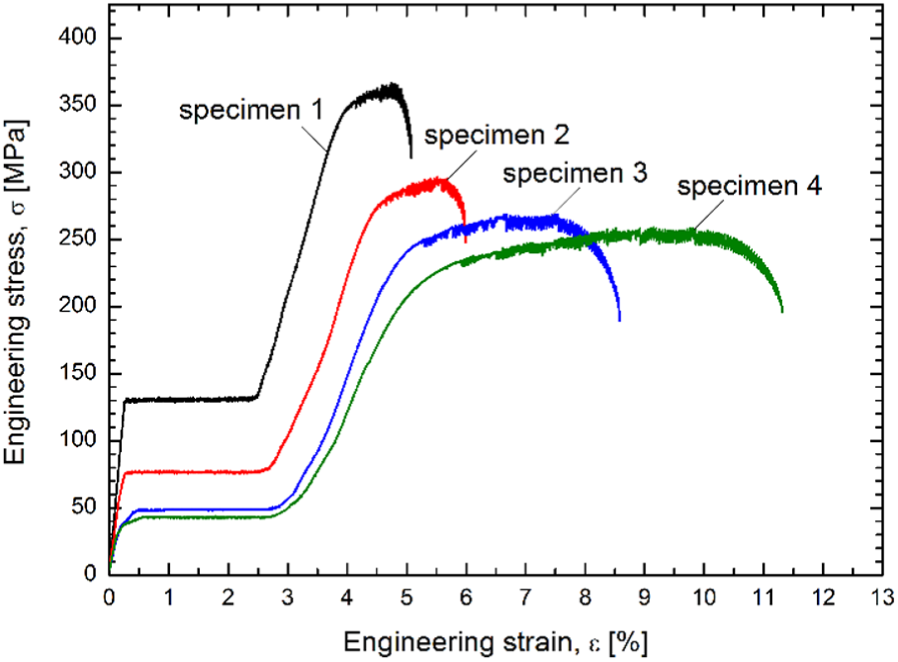
Engineering stress–strain curves of specimens 1, 2, 3 and 4.
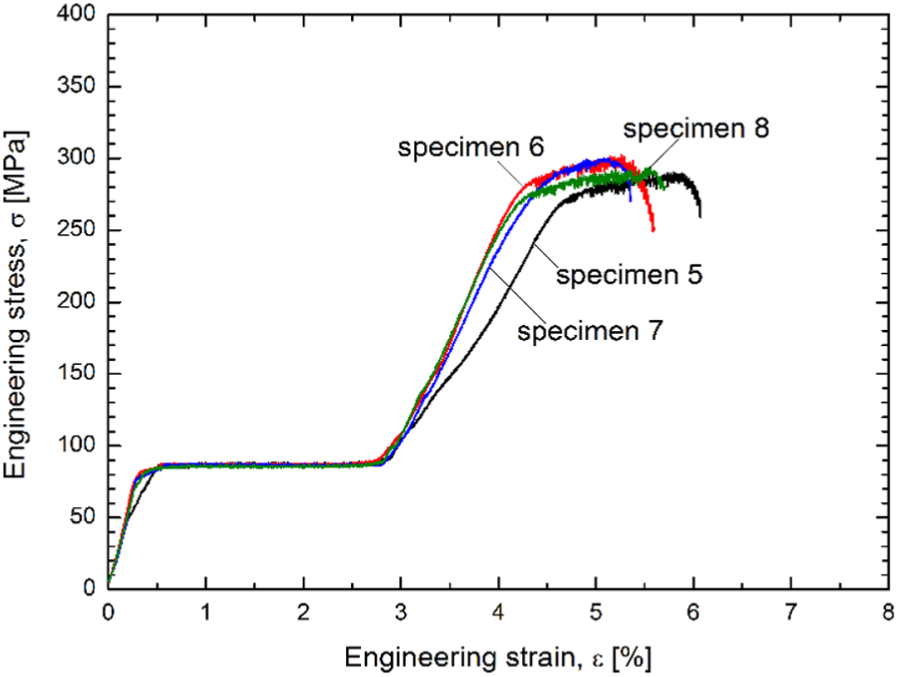
Engineering stress–strain curves of specimens 5, 6, 7 and 8.
Tensile properties of Groups I and II specimens.
In order to better understand the work-hardening behaviour in micro flexible rolling, Hollomon’s equation is used to analyse the relationship between the true stress and strain which is shown as follows

where
The fitting was conducted using MATLAB software, and the results are presented in Table 4. It can be seen that specimen 1, which has the highest thickness ratio, owns the biggest work-hardening exponent, which is in accordance with the preceding discussion.
It is worth mentioning that all the tensile curves exhibit discontinuous yielding behaviour. This phenomenon can occur when the stress maintains an almost stable condition that is accompanied by an increase in strain. The dislocation interactions pinned or restrained movement during the subsequent tensile deformation play a strong role in this phenomenon. 33
Figures 12 and 13 illustrate the mechanisms under different tensile testing conditions. Specimens 1–8 show their corresponding deformation behaviour with different rolling schedules. Once a tensile force is applied to both sides of a specimen, such as specimen 1 (Figure 12), it is a conventional deformation procedure that the slope of specimen 1 (T1) will gradually experience the trend lines from T2 to T4, which fortunately agrees with the evolution of specimens 2 to 4. Similarly, as shown in Figure 13, the slope of S5 will bring the same process from specimens 6 to 8 in an inherent sequence. This means that specimens 1 and 5, which possess the biggest thickness ratio in Group II or shortest transition zone length in Group II, respectively, need to overcome the highest tensile force and deformation resistance to realise the same metal flow during this tensile process – hence the higher YSs and lower ductility. This is very similar to the results of mechanical behaviour. A similar phenomenon was found and reported by Kopp et al. 18 in that a longer transition zone will give a rise to less wrinkling. In addition, higher deformed grains with larger angles (Figures 7(a) and 9(a)) gathered in these two specimens have a greater likelihood of generating a higher dislocation density, and stress concentrations also contribute to this phenomenon. Consequently, specimens 1 and 5 get the highest YS but specimens 4 and 8 obtain the lowest ones in their own groups (Table 4). It can be seen, however, that the thickness ratio has a greater effect on the mechanical properties of flexibly rolled thin strips compared with the transition zone length.
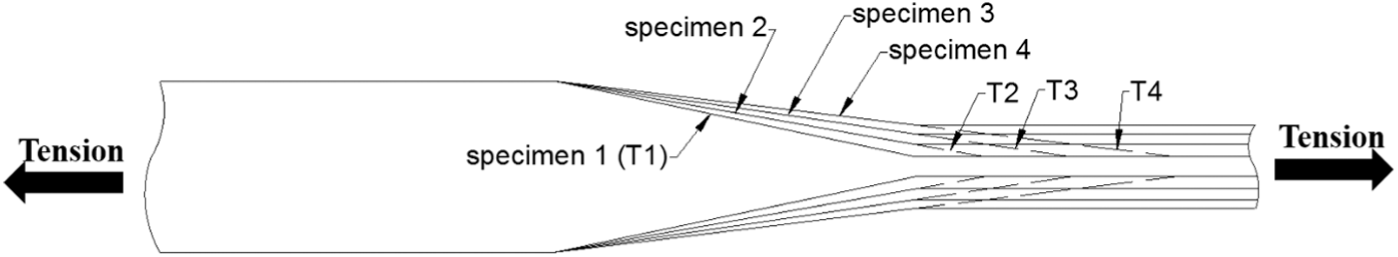
Deformation mechanisms of thin varying thickness strip with different thickness ratios in tensile tests.
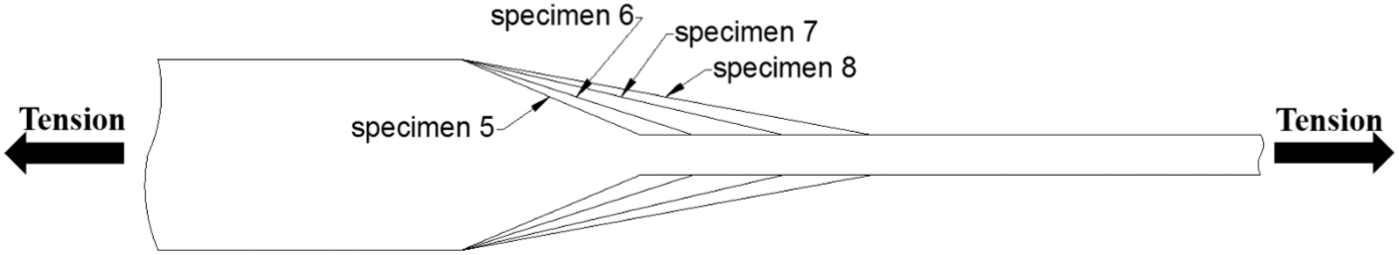
Deformation mechanisms of thin varying thickness strip with different transition zone lengths in tensile tests.
Although all the necking sites occur in the thinner zones, transition zones still make a contribution to the tensile deformations. This can be shown by the variations in transition zone lengths before and after tensile tests, as shown in Table 5. Clearly, the transition zone length after flexible rolling decreases as the thickness ratio is reduced for Group I, but it increases as the rolling speed for Group II increases. After tensile tests, all the transition zone lengths of each specimen display the same changing trend compared to the flexibly rolled ones but strain in the transition zone
Variation of transition zone lengths and corresponding strains.
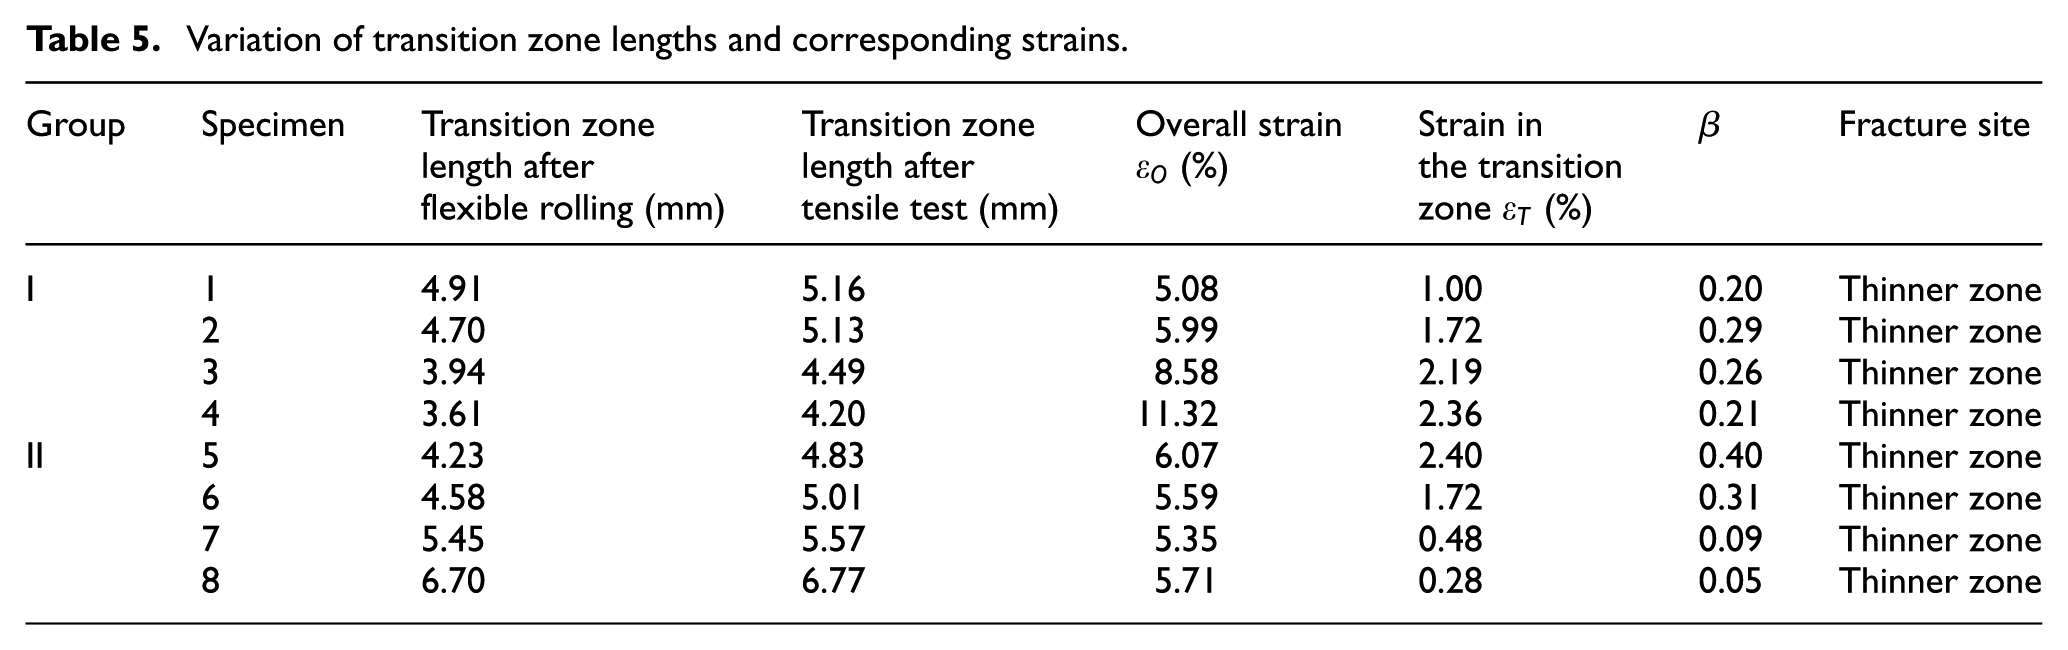
The tensile test results of the two groups imply that a smaller obliquity happened between the transition zone bevel and the tensile force direction, a higher tensile stress will occur in the transition zone, which results in better ductility and less strain in this zone. This is in agreement with the discussion and analysis of Figures 12 and 13.
Hardness
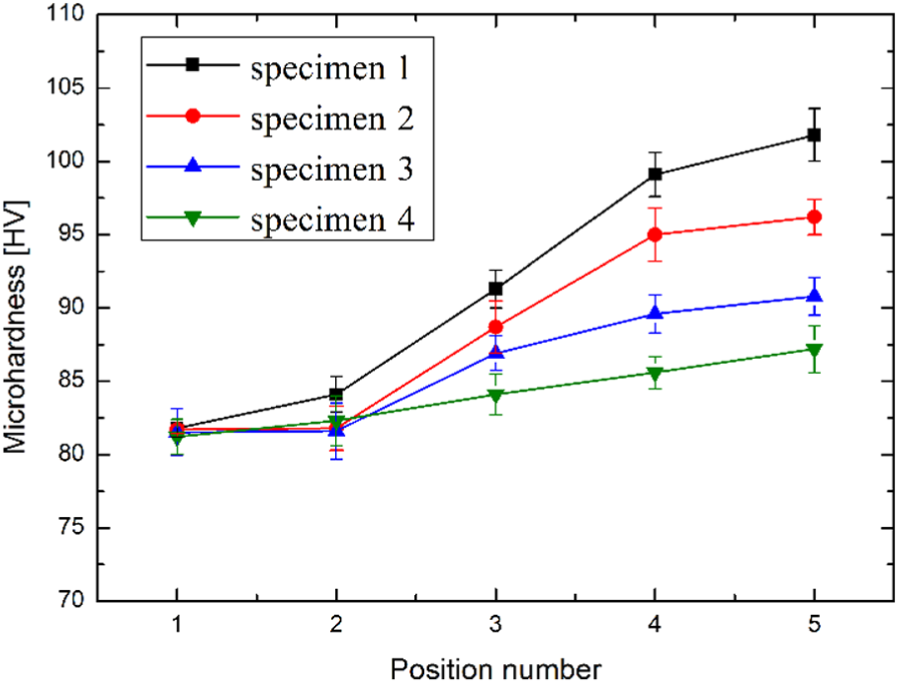
The results of hardness tests of the two groups, which were carried out from the thicker zone to the thinner zone and across the transition zone of the cross section of each specimen, are shown in Figures 14 and 15. It can be seen that the hardness of the Group I specimens presents an increasing trend from the thicker zone (Position 1) to the thinner zone (Position 5). This is because of the thickness difference, resulting in work hardening derived from the corresponding thickness ratio. A relatively strong work hardening occurs due to the high dislocation density which is induced by the highest reduction in the thinner zone.34,35 Then, the interaction of dislocations is strengthened due to the decreased average distance between dislocations, which hinders the movement of dislocations. 36 The degree of work hardening that occurred in the thinner zones of specimens 1 and 2 is higher than that of specimens 3 and 4. Hence, the hardness values in the thinner zone with different thickness ratios 3.41 (specimen 1), 1.94 (specimen 2), 1.33 (specimen 3) and 1.15 (specimen 4) display about 7%–21% greater hardness than that of the thicker zone (shown in Figure 14). A regular phenomenon, as depicted in Figure 15, is that all the hardness values exhibit an almost congruent upwards trend, despite the fact that each specimen (specimens 5–8) varies in transition zone length. There is hardly any change among these specimens because all the corresponding measured positions have quite similar thicknesses.
Changes in Vickers hardness of Group I specimens along the thickness direction in five measured positions.
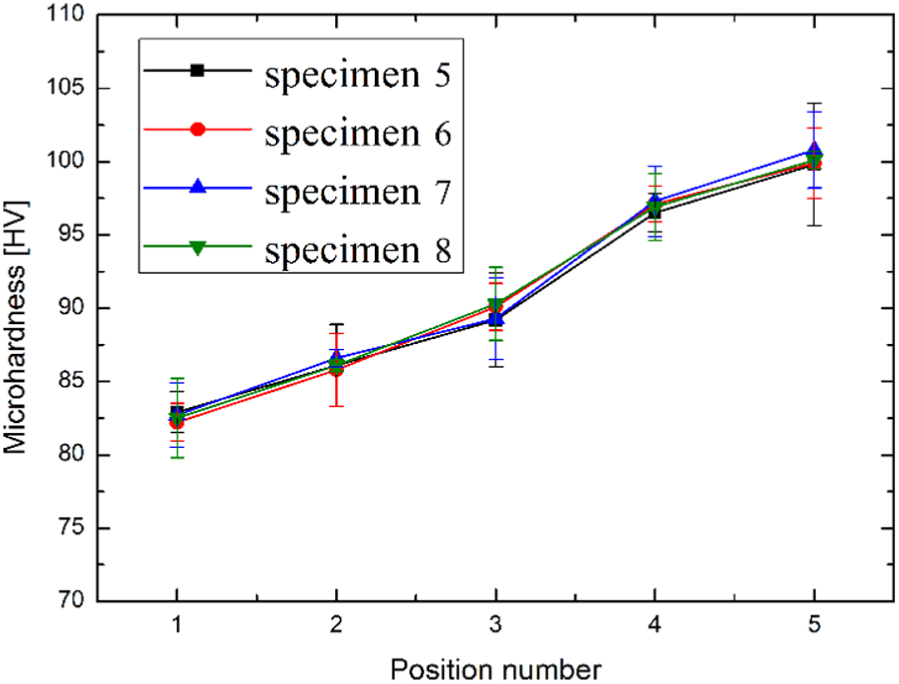
Changes in Vickers hardness of Group II specimens along the thickness direction in five measured positions.
Based on the hardness variation of Group I, an empirical relationship between UTS and hardness is developed as follows

The coefficient of determination is

A comparitive analysis of the experimental results, empirical relationship and calculated results from equation (4) is shown in Figure 16. From this, the empirical factors are closer to the experimental results. In comparison, the calculated data dominated the highest magnification besides the specimen with the biggest thickness ratio. This is because that the strain of the thinner zone in this speicmen has exceeded 0.7, which is the order of large strain. The work-hardneing behaviour in this aspect is relatively more complicated and needs to further consider other factors involving the crystallographic properties. 38
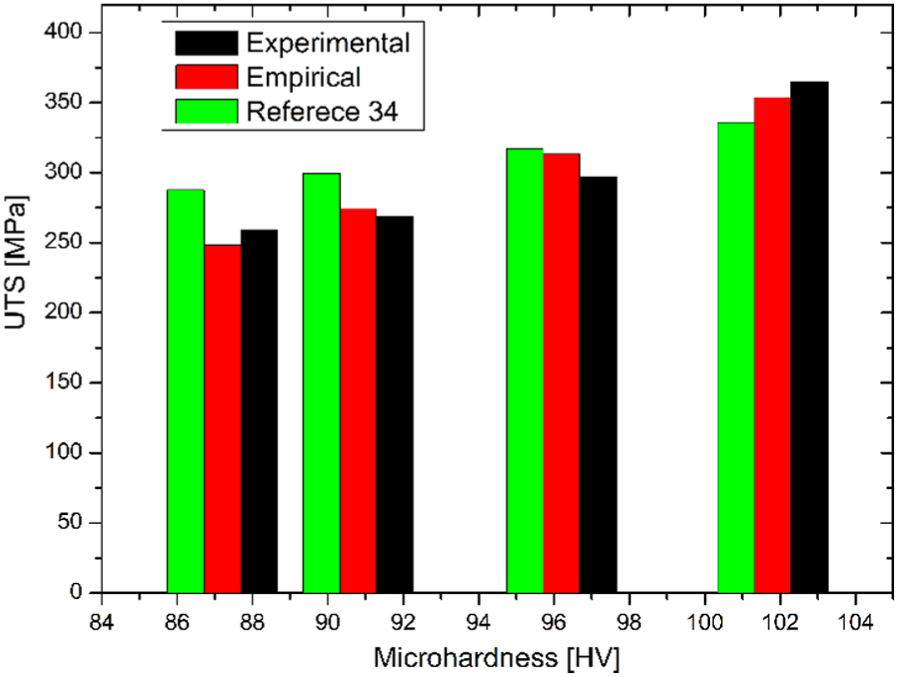
Comparison among experimental results, empirical relationship and the theoretical expression of the correlation between UTS and Vickers hardness of Group I specimens.
Fractography
The fracture surfaces of all the flexibly rolled specimens are shown in Figures 17 and 18. It can be clearly seen that the fracture morphologies of all the Group I specimens with round or elliptical ductile dimples display the typical ductile fracture surfaces, 39 as shown in Figure 17. By contrast, the fractural photographs of Group II samples show similar characteristics, with similar sized voids, as indicated in Figure 18. It should be noted that the volume fraction of the micro-voids can directly affect the ductile fracture properties. 40 Generally, ductile dimples with higher depth and more uniform distribution contribute to greater plasticity with a better fracture resistance. Simultaneously, second phase particles or inclusions are the major factors in forming ductile dimples. 41 They will always be found at the bottom of the ductile dimples, which are related to nucleation, growth and coalescence of voids at hard particles. 42 In fact, the voids will emerge by particle cracking (consisting of radius, shape and volume fraction), decohesion surrounding the constituent particles or pre-existing in the initial materials.40,43,44 For all fractographs in this study, the fracture morphology of specimen 4 shows deeper and more uniform ductile dimples, gradually followed by specimens 3, 2 and 1, indicating that it has absorbed more stored energy during the plastic deformation of flexible rolling due to the smaller grain aspect ratio 30 and then achieved relatively better ductility. On the contrary, the fracture surface of specimen 1 is full of heterogeneous size and depth voids and hence it obtained the lowest elongation. This also verifies the results in Figure 10 and Table 4 that ductility (elongation to failure) increases gradually from 5.08% (specimen 3) to 11.32% (specimen 4).
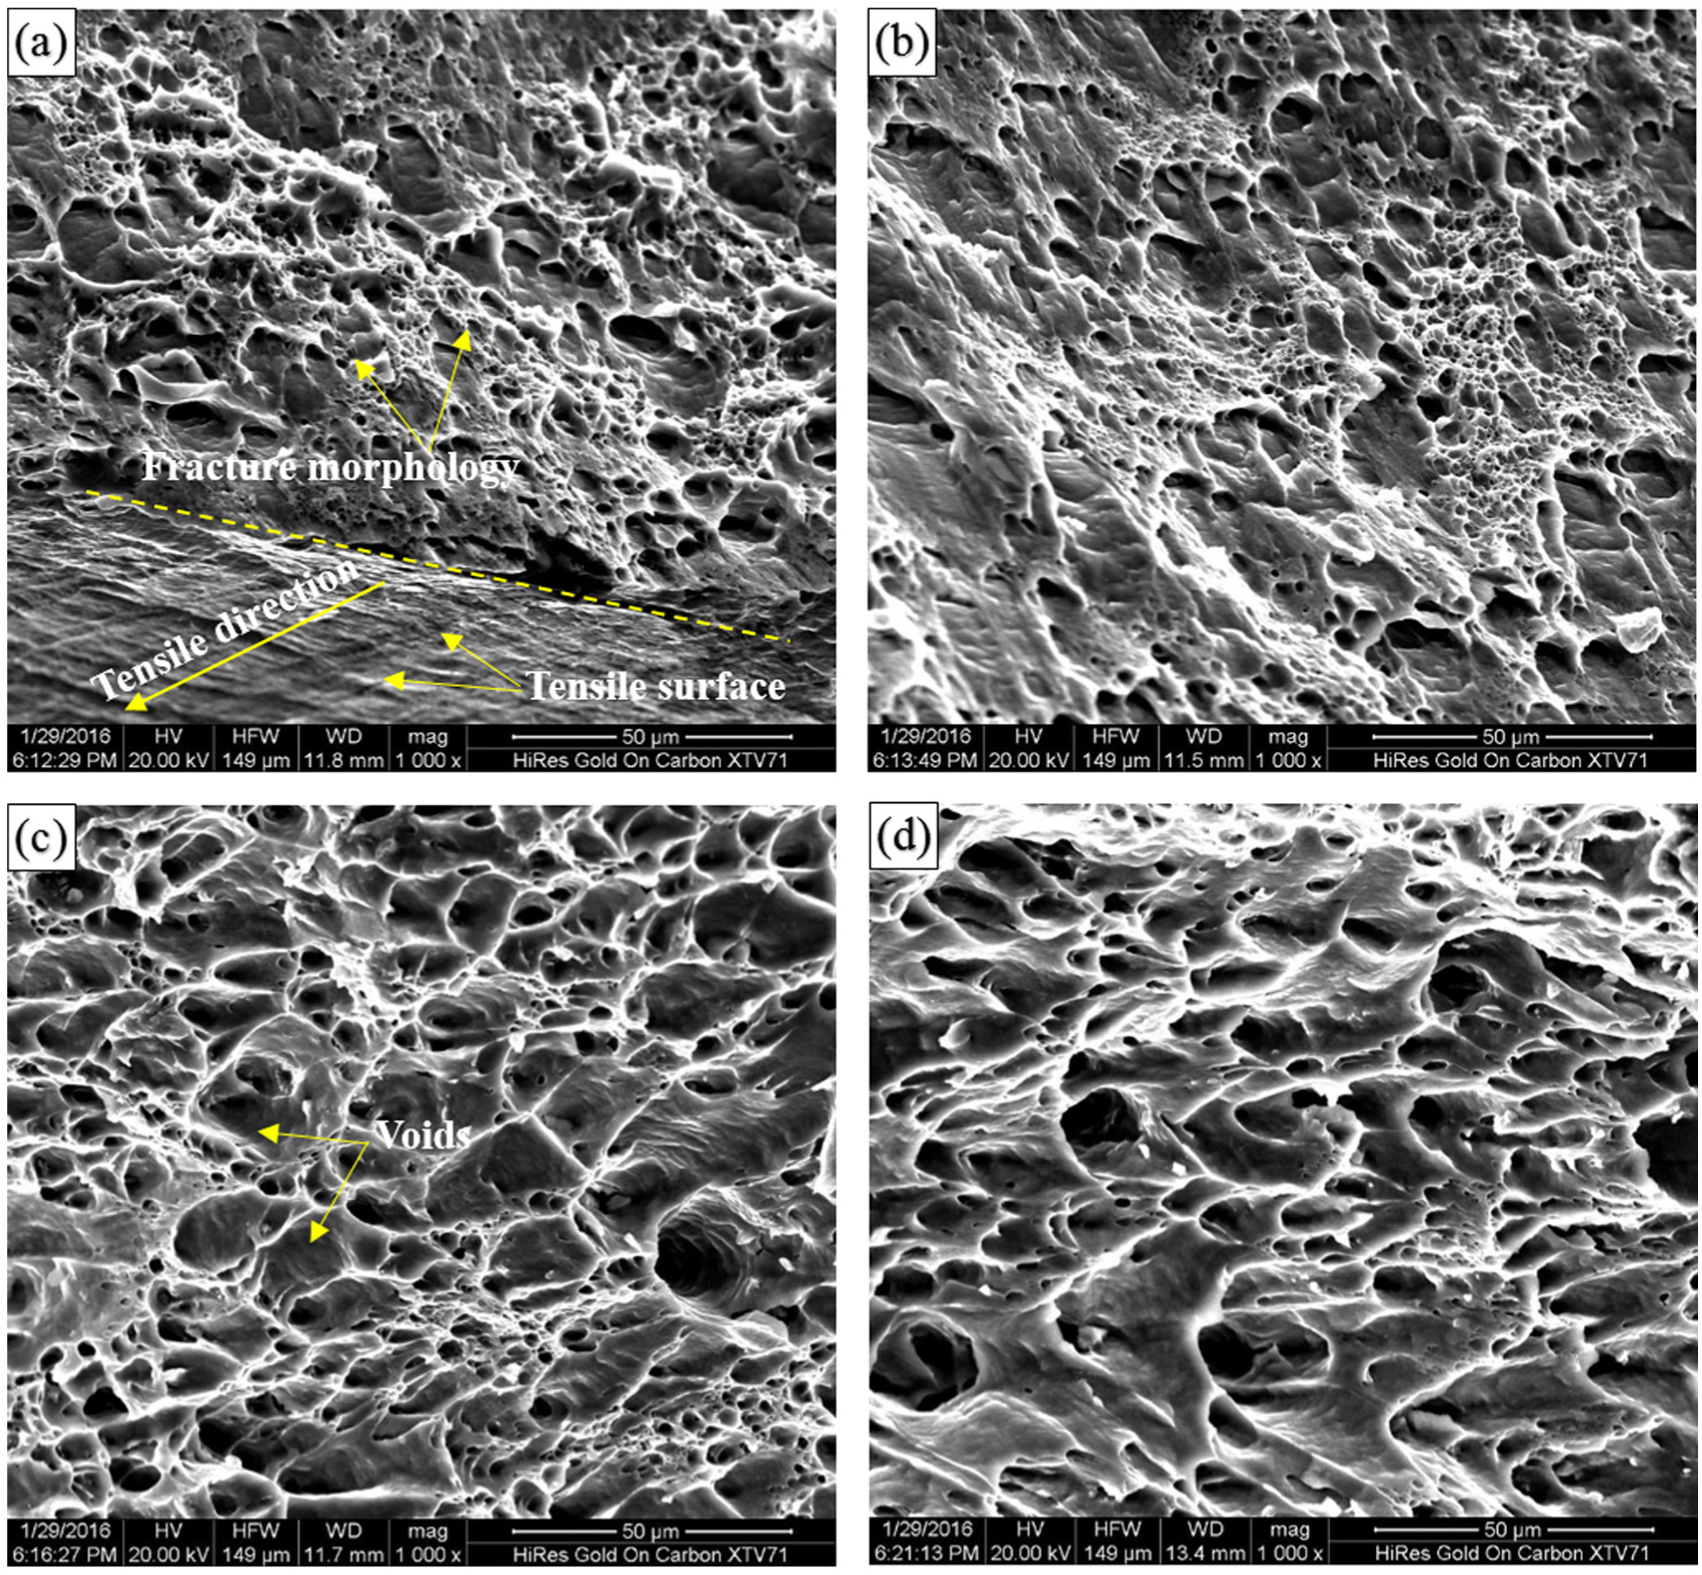
Fracture morphology comparisons of (a) specimen 1, (b) specimen 2, (c) specimen 3 and (d) specimen 4 by SEM.
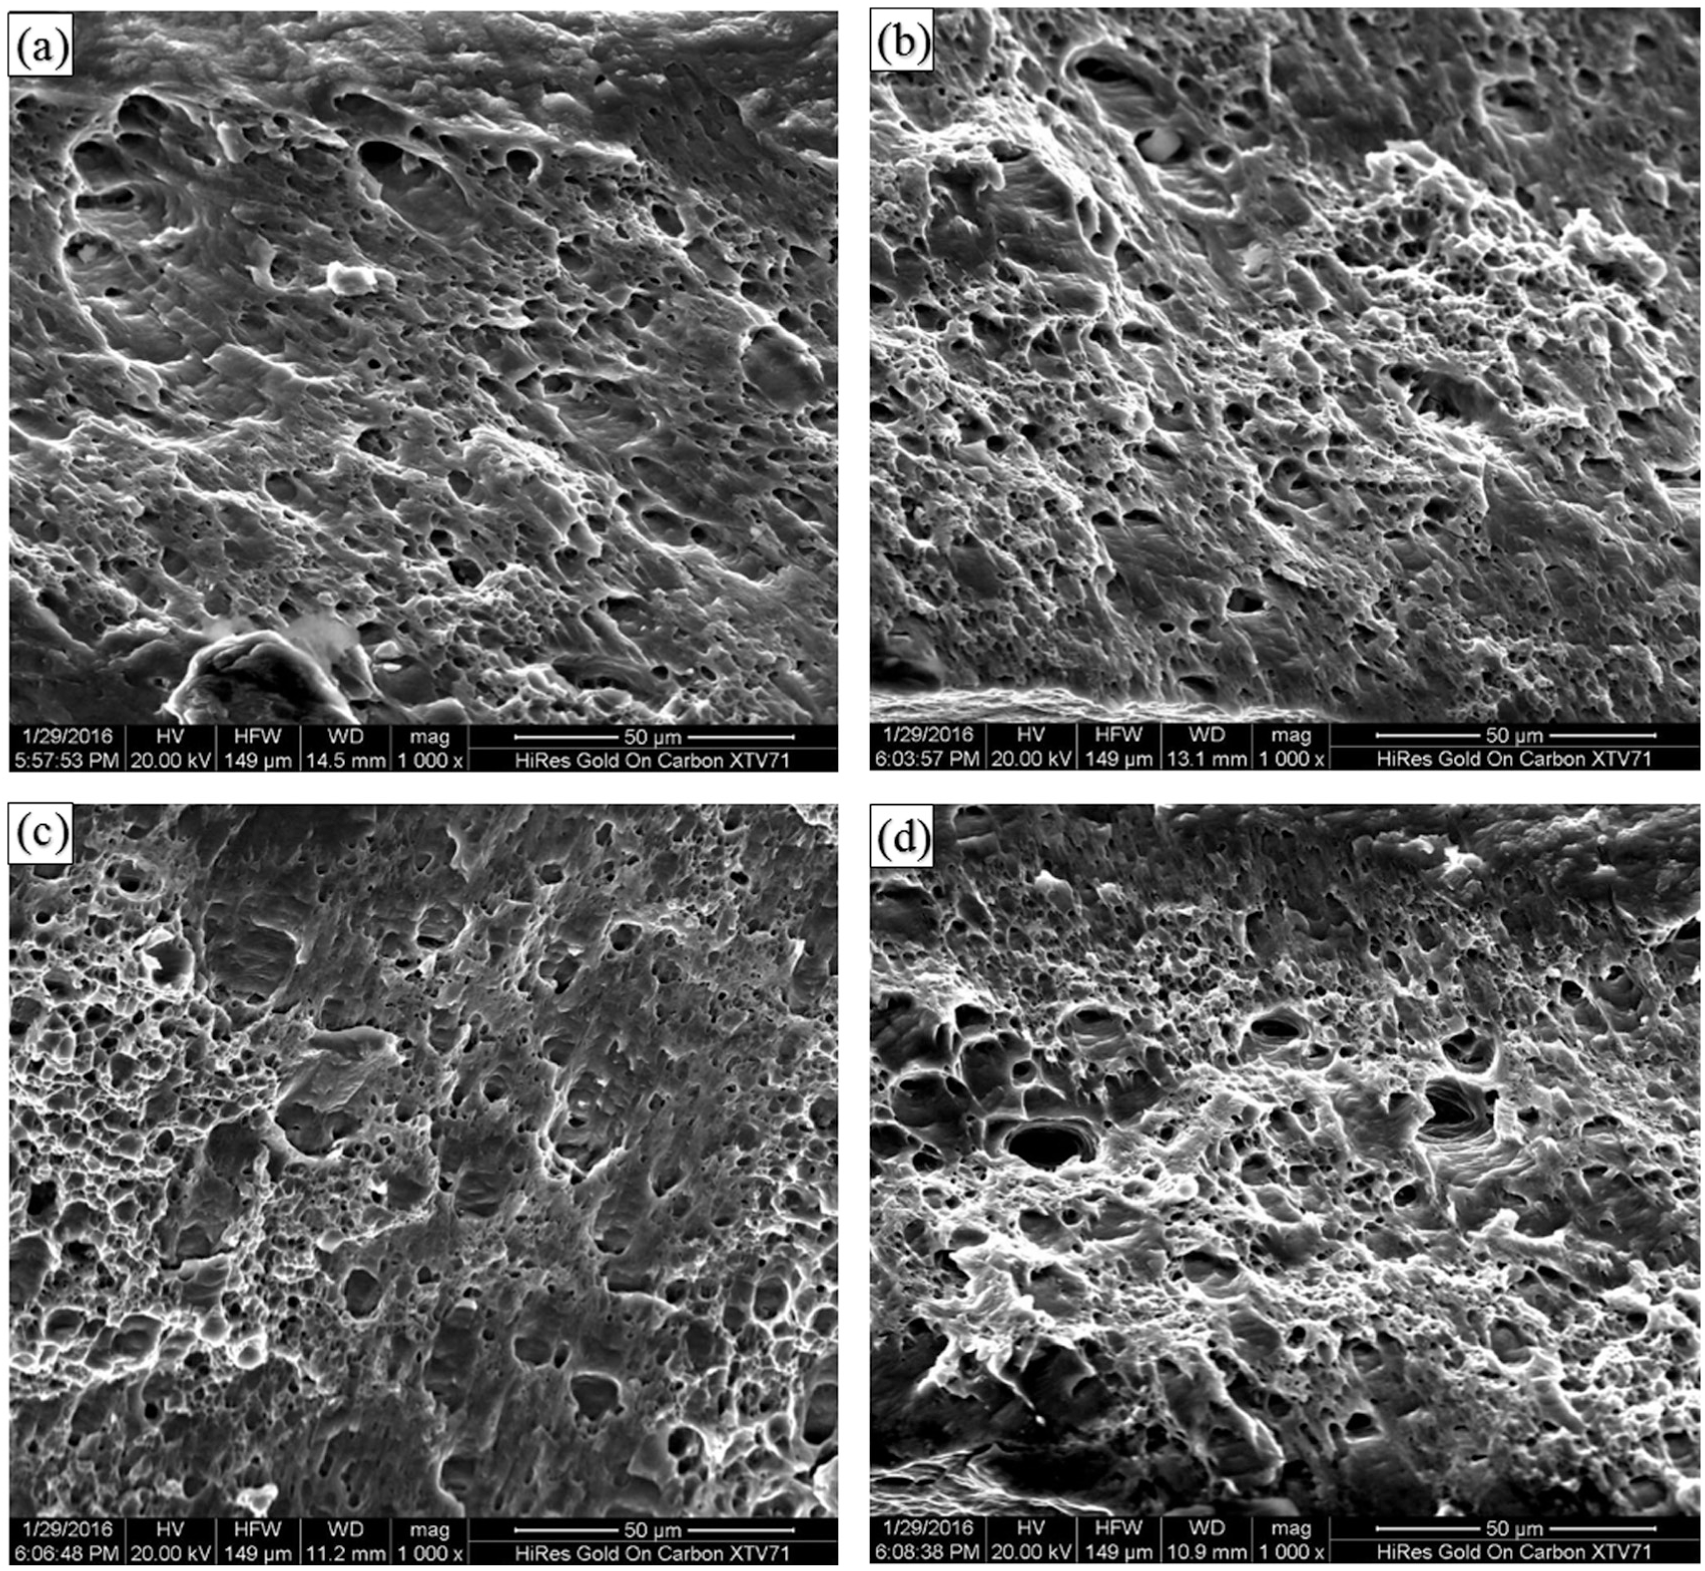
Fracture morphology comparisons of (a) specimen 5, (b) specimen 6, (c) specimen 7 and (d) specimen 8 by SEM.
With the feasible amount of hardening degree, a pure shear deformation mode with the axisymmetric stress–strain state could be prolonged or quite short. 41 Localised deformation will then occur once the metal flow of the tensile specimen becomes unstable. For the same small necking area, the macro flow sequentially maintains the axisymmetric deformation, while a micro localisation could occur inside a thin planar layer composed of massive micro-shear bands. Generally, shear fracture angle (the angle of the fracture line with respect to the tensile direction) with 45°or 90° is most common in a typical uniaxial tensile test for face-centred cubic metals and alloys.45–49 In this study, however, as shown in Figure 19, all the Group I specimens show the same fracture angle of approximately 65°, irrespective of the thickness ratio. This phenomenon was also found by Wang and Shan. 32 It is suggested that the fracture mechanism of the present materials can be shifted from necking fracture to shear fracture mode with various fracture angles. 50
Shear fracture angle comparisons for Group II specimens.
Conclusion
Smooth thickness distribution with perfect microstructural evolution along the transition zones of thin 6061 aluminium strips is obtained after micro flexible rolling under different rolling schedules. This is sensitive to rolling reductions and beneficial for the improvement of mechanical properties.
The flexibly rolled thin strip with the biggest thickness ratio displays the highest YS and UTS, along with the lowest elongation, due to the strongest work hardening. A specimen with a bigger thickness ratio or shorter transition zone length should bear higher deformation energy to achieve the identical metal flow in the tensile testing process, hence resulting in a higher YS.
The variation in β shows that a better connection condition with excellent mechanical behaviour occurs in the transition zones for flexibly rolled thin strips. Thickness ratio has a more significant influence on the change of
The hardness of both Groups I and II presents an upwards trend from the thicker zone to the thinner zone, and the hardness values in the thinner zone are about 7%–21% greater than that of the thicker zone for Group I since different reductions lead to corresponding degrees of work hardening.
Although all the specimens displayed ductile fracture, specimen 4 exhibited the largest, deepest and most homogeneous fractures, which bring out the greatest ductility, gradually followed by specimens 3, 2 and 1.
Footnotes
Acknowledgements
The authors wish to gratefully acknowledge the help of Dr Madeleine Strong Cincotta in the final language editing of this paper.
Declaration of conflicting interests
The author(s) declared no potential conflicts of interest with respect to the research, authorship and/or publication of this article.
Funding
The author(s) disclosed receipt of the following financial support for the research, authorship, and/or publication of this article: The first author (M Huo) gratefully appreciates UOW for PhD scholarship, the grant from Australian Research Council (ARC, Grant No. FT120100432) and National Natural Science Foundation of China under Grant No. 51474127 for their supports to the current research.