
Abstract
This article provides an improved lubrication system for minimum quantity lubrication machining wherein oil is locally supplied and individually controlled at different heating zones during machining operation. The proposed lubrication method, that is, a multi-point minimum quantity lubrication system, is aimed at improving energy efficiency and environmental friendliness of cutting process. An experimental system is devised in which process parameters, such as air pressure, stroke volume (i.e. amount of oil in one stroke of pump), stroke frequency, and oil distribution factor (i.e. proportion of oil at rake and flank face), are individually controlled for each supply system. The devised system is demonstrated through machining of Ti-6Al-4V. The results of the experimental study on effects of oil quantity and supply method on specific cutting energy, tool wear, and machined surface quality are presented and discussed and corroborated with scientific evidence. The study suggests that distributing oil at the rake face and the flank face in unequal proportions can be more beneficial than injecting it solely at a single location. The investigation also provides mechanism of multi-point minimum quantity lubrication machining through analysis of adiabatic shear zones, observed in scanning electron microscope images of chips.
Keywords
Introduction
The minimum quantity lubrication (MQL) technique has shown promise as an environmentally friendly machining process. Investigations have shown that MQL can be a more sustainable metal working fluid system. 1 In MQL, a small quantity of oil, mixed with pressurized air, is injected at the cutting zone. The quantity of oil consumption varies from 5 to 600 mL/h. 2 Since the quantity of cutting fluid is very low, it should be sprayed judiciously at proper locations so that maximum benefits can be obtained. In a single-point metal cutting operation, there are three main heat-affected zones, namely, the primary and secondary shear zones and the place where the tool is in contact with the machined surface, as shown in Figure 1.
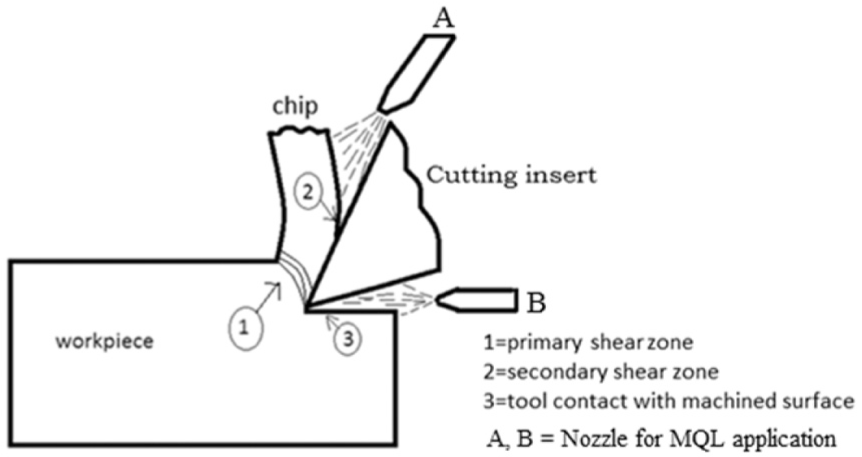
Schematic representation of chip formation and oil injection nozzle positions.
If the oil–air mixture in MQL is specifically focused at the rake and flank faces of the tool, rather than an unfocused spray, two issues can be handled: first, the temperature generation at the secondary deformation zone can be controlled, which can further reduce crater wear formation; and second, flank wear can be reduced, which helps to improve the surface finish of the machined component. In this way, the efficiency of this process can be maximized; however, limiting the consumption of cutting fluid can make the machining of difficult-to-machine materials, like titanium alloys and nickel-based alloys, more challenging. In titanium alloys, the generated heat is mostly concentrated at the cutting zone. Chips formed during its machining are incapable of taking away the heat generated because of their low thermal conductivity. Hence, it is a challenging task to apply the MQL technique to machining titanium alloys.
Several researchers in the past have shown the effectiveness of MQL by applying it individually at the rake face of the tool. Tasdelen et al. 3 studied the effect of MQL, compressed air cooling, and emulsion cooling on tool–chip contact length (rake face). Although, compared to dry cutting, tool–chip contact length was reduced for both MQL and compressed air, emulsion cooling provided the least tool–chip contact length. Some researchers also investigated the effect of injecting cutting fluid at the flank face of a single-point cutting tool. Li and Liang 4 developed a predictive model for cutting forces for near-dry machining by injecting cutting fluid at the flank face. It was suggested that lubrication plays a more important role in deciding cutting forces rather than cooling effects. Obikawa et al. 5 studied the effectiveness of spraying cutting fluid at the oblique position of the flank face in terms of reduction in tool wear and surface roughness; their data revealed that nozzle position and nozzle type can play important roles in terms of the effectiveness of the micro-liter lubrication system. Obikawa et al. 6 showed the effectiveness of different nozzle distances from the cutting zone.
Some researchers also investigated the effect of applying cutting fluids simultaneously or individually at the rake and the flank faces of a single-point cutting tool. Attanasio et al. 7 studied the effect on tool wear when cutting fluid was injected individually at the rake and flank faces of the tool. Lower tool wear was observed when oil was injected at the flank face of the tool, suggesting the superiority of injecting oil at this location. Kamata and Obikawa 8 investigated the effects of simultaneous injection of cutting fluid at the rake and flank faces on tool life and surface finish. They reported that simultaneous injection could improve the tool life and surface finish. It was also understood that proper air–oil mixture is essential to increase the efficiency of the MQL process. Leppert 9 investigated the effect of MQL by injecting the cutting fluid in the rake and flank faces of the cutting tool for turning C45 steel. Dry cutting and emulsion cooling (flood cooling) was conducted to compare effectiveness. MQL cooling at the rake and flank faces provided satisfactory results in terms of reduction in cutting force, accompanied by better surface quality.
Few researchers have tried to understand the effects of varying MQL parameters on machining performance. Banerjee and Sharma 10 presented a friction model as a function of the cutting speed and tool feed rate when machining with MQL, in order to understand the effects of machining conditions, temperature, and contact length of the tool–chip interface. Liu et al. 11 investigated the effect of MQL parameters, that is, oil quantity, air pressure, and nozzle position, on the cutting force, and the temperature generated during the end-milling operation of Ti-6Al-4V alloy. Investigation suggested that oil quantity and the air pressure should be chosen within a certain range to get the maximum benefit from this technique. Mulyadi and Mativenga 12 studied the effect of nozzle position and fluid delivery pressure on flank wear during the high-speed milling of H13 tool steel. Although the nozzle position influenced the tool wear, the effect of the oil injection pressure was minimal. Banerjee and Sharma 13 showed that localized oil injection at rake and flank face can be a better alternative to conventional wet machining of Ti-Al-4V alloy because of lower cutting force and surface roughness.
Previous investigations suggest that the two faces of the tool undergo different types of interactions between tool and workpiece materials. The tribological and thermo-fluidic phenomena occurring at these two places are quite different. The rake face generates more heat and the resulting tool wear is responsible for catastrophic failure of the tool. However, wear at the flank face is more responsible for the surface finish. There is limited understanding about the proper quantity of oil and the pressure at which it should be injected at both places so that specific cutting energy, surface roughness, residual stress generation, and tool wear can be minimized. The effect of the metered distribution of oil on chip morphology is also unknown. Hence, it is a meaningful proposition to determine the amount of oil required at each location using a multi-point injection system. This distribution of oil can be in equal or unequal proportions. Such an arrangement in the MQL system, termed multi-point minimum quantity lubrication (MMQL), is investigated in this study. The objective of this study is to investigate the effect of a distributed oil supply and other parameters like air pressure and total oil quantity in MMQL of Ti-6Al-4V alloy in order to maximize the process efficiency by reducing specific cutting energy, surface roughness, residual stress generation, and tool wear with the minimum possible oil consumption. The following section gives experimental details.
Experimental work
Experiments were conducted on cylindrical rods of Ti-6Al-4V alloy. The workpieces were machined from its raw material stage up to 28.5 mm diameter. Experiments were conducted on a high-precision lathe (NH22, HMT). The coated carbide inserts were ISO standard S-grade, and TiAlN + TiN coating was used. The tool and the workpiece specifications, along with the experimental conditions, are shown in Table 1. The workpiece was machined 20 mm length for each experiment. The MQL system (Dropsa) used for conducting the experiments consisted of an oil tank, a reciprocating piston pump (pneumatic type), an electronic controller, and a pressure regulator (Figure 2(a) and (b)). The reciprocating pump was used to supply a metered quantity of oil in a pressurized air supply line. In this system, the stroke volume of the reciprocating pump could be adjusted manually and stroke frequency was controlled with the help of an electronic controller. Two nozzles (inlet diameter = 6.7 mm; outlet diameter = 1 mm; nozzle length = 26 mm) were placed at the rake and flank faces of the tool to supply metered quantities of oil under a given air pressure. Two independently controlled MQL systems were used for this purpose. Since the main aim of this work was to understand the effect of MMQL on machining performance, air pressure (bar), stroke frequency (Hz), stroke volume (cm3), and the oil distribution factor, Qd, were varied at five levels at each individual MQL pump. Qd represents the fraction of oil which was provided to the rake face and rest was at the flank face, for example, Qd = 0.75 means that 75% was injected at the rake face and 25% was injected at the flank face. The tool holder was mounted on a piezoelectric-based dynamometer which was used to obtain cutting forces during experiments. The cutting force obtained was used for calculating specific cutting energy using equation (1)

Specifications of the machine, tools, and workpiece.
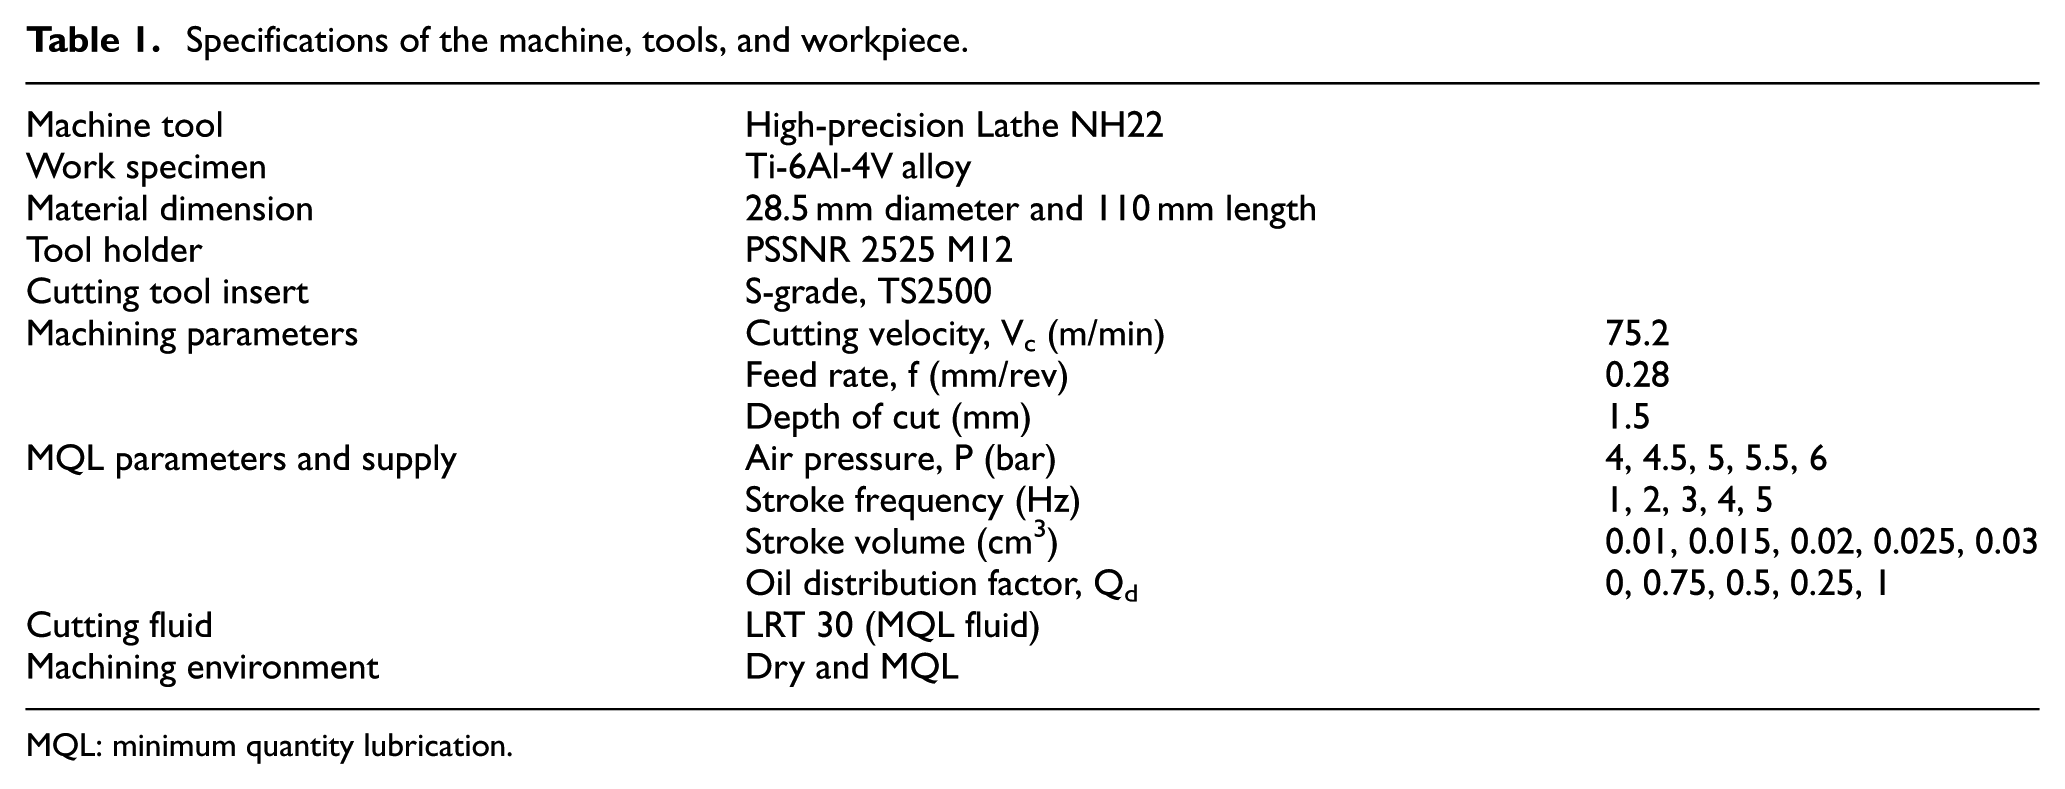
MQL: minimum quantity lubrication.
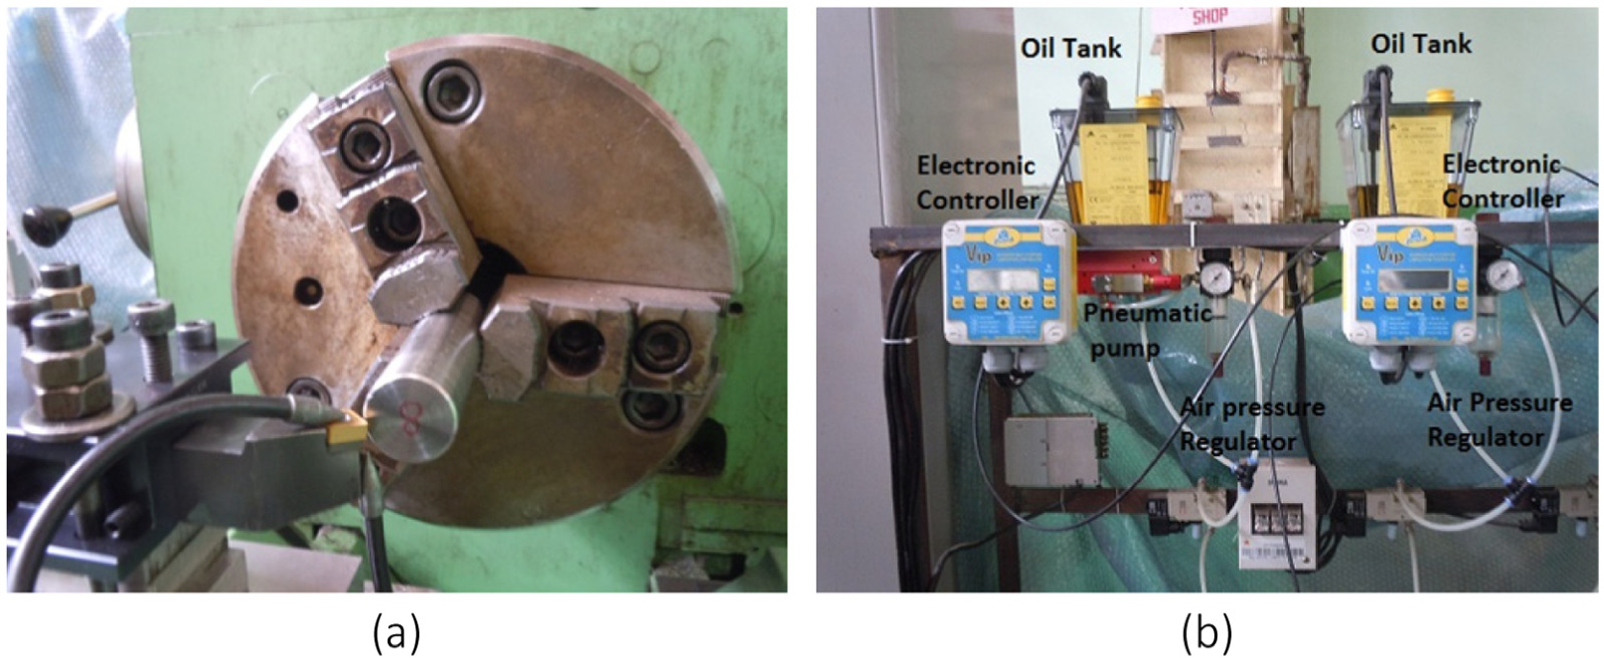
Experimental setup: (a) nozzles are positioned at the rake and flank faces of the tool and (b) Dropsa MQL system.
Each experiment was repeated thrice and the average values of the output parameters were used to plot the graphs. After machining, surface roughness (Ra) and surface topography were measured using a MarSurf XT20 surface profiler. An optical microscope was used to measure and analyze tool wear and the machined surface quality. Scanning electron microscope (SEM) images of the cut section of the machined workpiece were taken to examine the surface quality. SEM images of the front and backsides of the chips were taken to analyze the effect on adiabatic shear band formation and dust particle generation that occurred during the cutting process. Residual stress measurement for each sample was conducted using the PROTO residual stress analyzer, which works by the X-ray diffraction (XRD) technique. Cu-K-Alpha (wavelength = 0.1542 nm, 25 kV, 4 mA) radiation was used for measurement. The normal stress in the cutting direction (Hoop stress) and the feed directions (Axial stress) of the machined surface were measured. The chip samples for each experiment were collected and their hardness at the back of the chip was measured to understand the effectiveness of lubrication. The machining parameters, that is, cutting speed, feed rate, and depth of cut, were kept constant. The constant machining parameters used for experimentation were recommended by cutting insert manufacturer (Seco, Sandvik).
Results and discussion
Achieving lower cutting energy for any machining operation can be beneficial, since it will reduce the cost of production and make the process more energy efficient. It may further help in improving tool life by reducing the stresses generated in the tool. Lower surface roughness and tool wear are some of the most desirable conditions for evaluating the efficiency of a specific machining operation. The effect of MQL parameters and oil distribution on specific cutting energy, chip thickness, surface roughness, flank wear, and surface residual stress are presented in this section.
Effect of air pressure
The effect of air pressure on specific cutting energy, surface quality, tool wear, and chip compression ratio is displayed in Figure 3. It can be seen from Figure 3(a) that the specific cutting energy was increased by increasing the air pressure. A simultaneous increase in chip compression ratio can be observed from Figure 3(b).
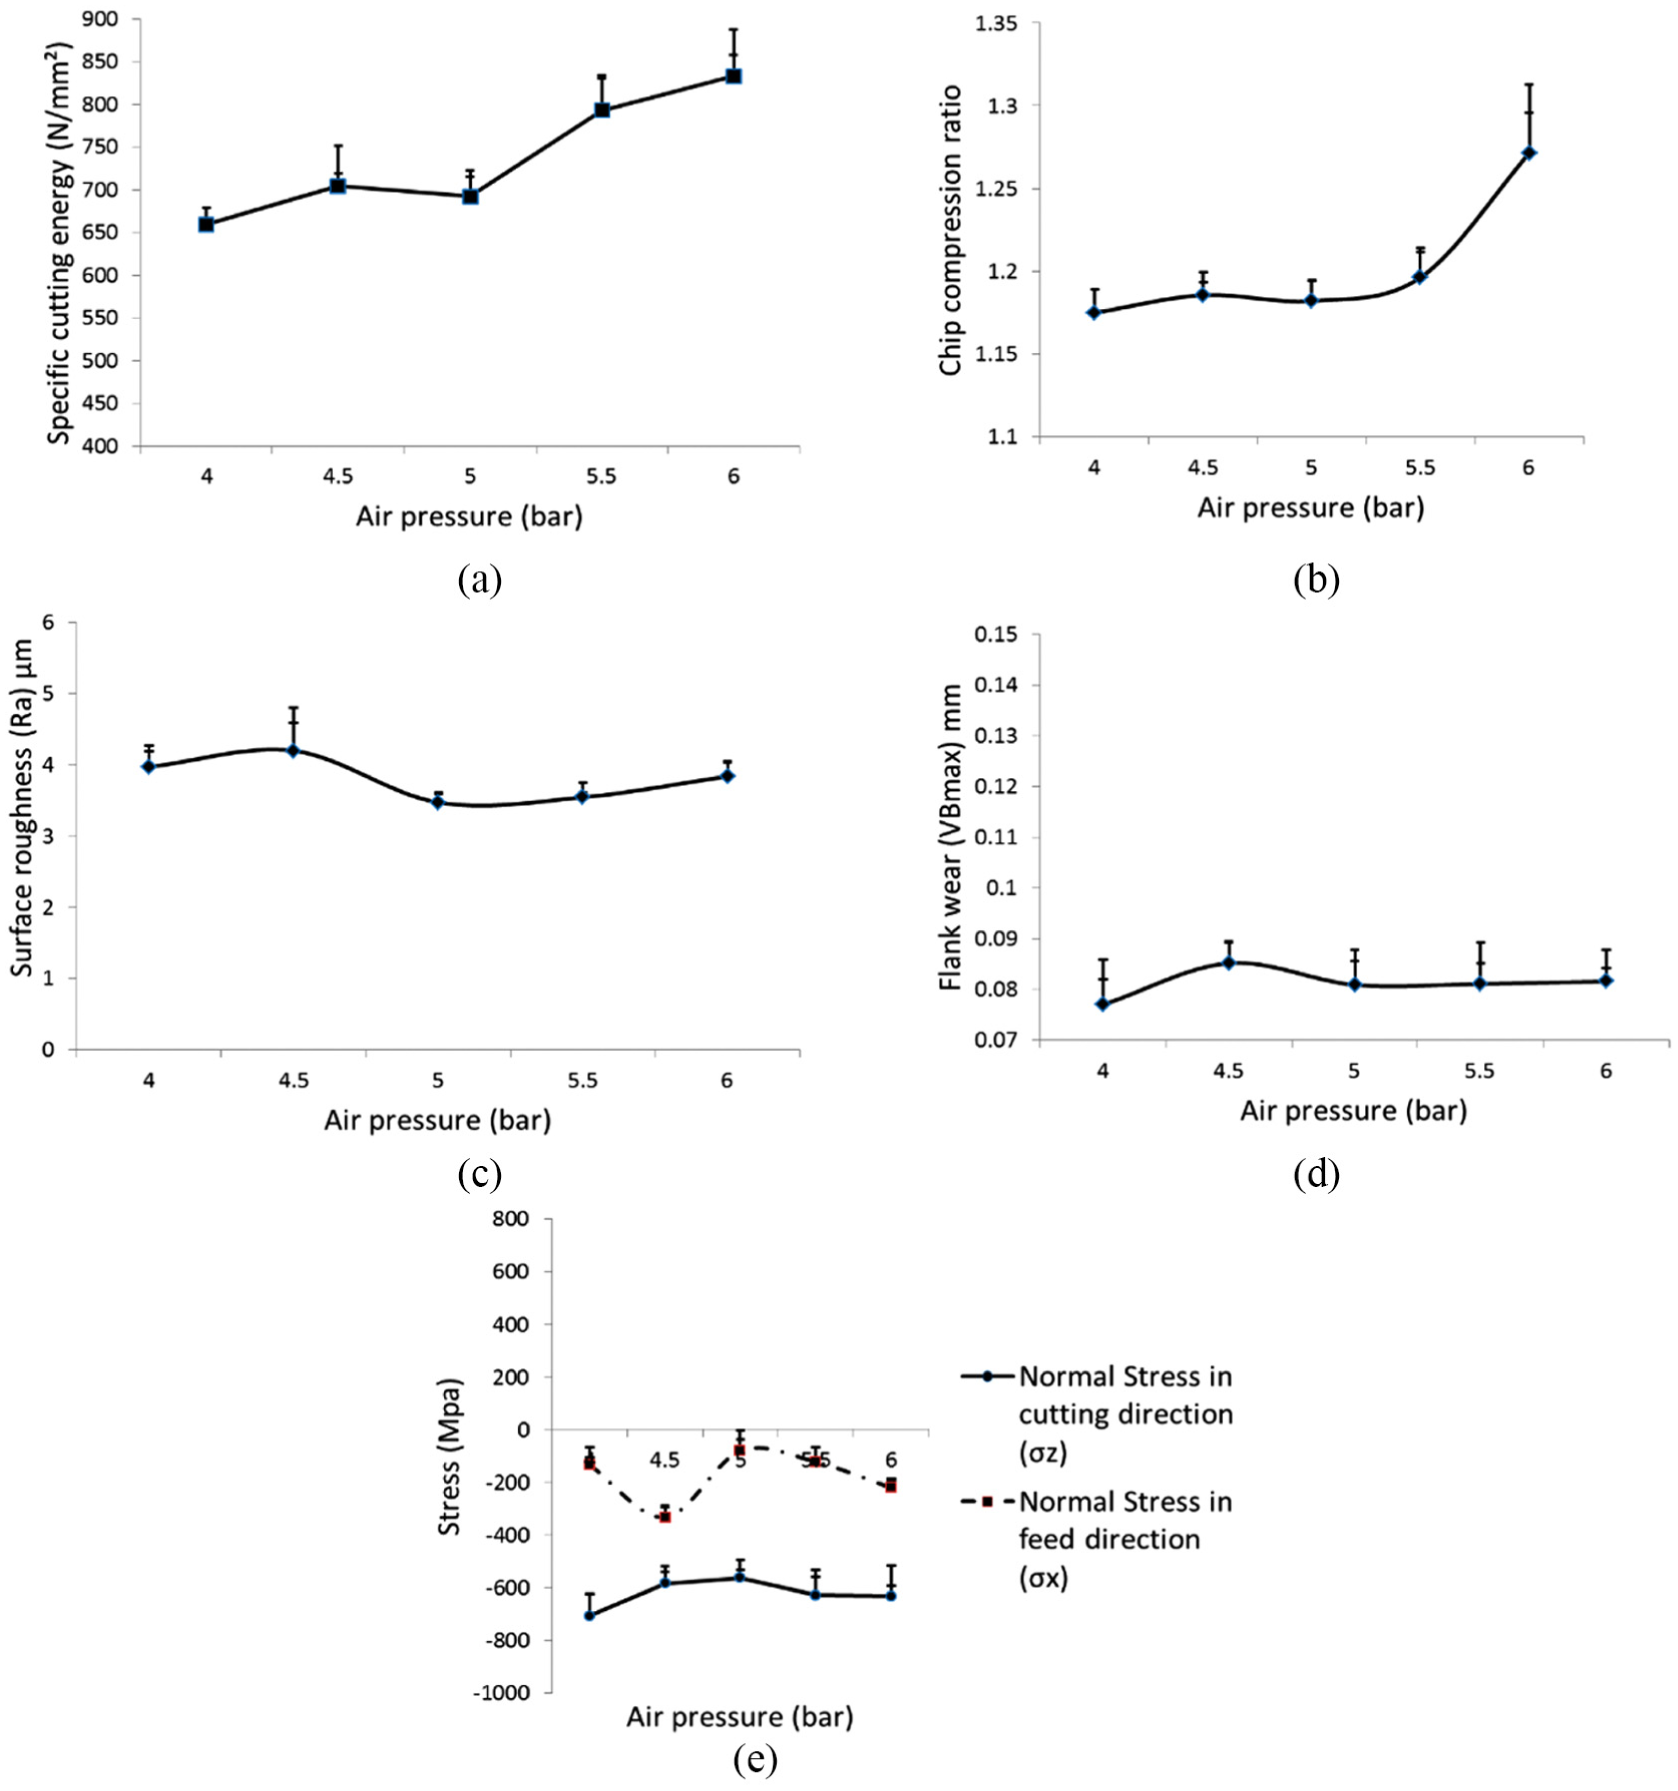
Effect of air pressure on (a) specific cutting energy, (b) chip compression ratio, (c) surface roughness, (d) flank wear, and (e) residual stress (stroke frequency = 3, stroke volume = 0.02, oil distribution factor = 0.5).
It can be seen from Figure 3(c) that surface roughness was reduced when the air pressure was increased from 4 to 5 bar, but further increases in pressure lead to surface finish deterioration. In the case of flank wear (Figure 3(d)), when the pressure was increased from 4 to 5 bar, a rise in wear was observed, but from 5 to 6 bar, minimal change can be seen. As the flank face of the tool remains in direct contact with the surface of the freshly machined workpiece, any variations in flank wear pattern can directly affect the surface finish. At the pressure of 5 bar, the lowest surface roughness with lower specific cutting energy was achieved. Figure 3(e) shows the variation in compressive residual stress generated in the cutting and feed directions on the surface of the workpiece with changes in air pressure. Compressive residual stress was higher in the cutting direction and lower in the feed direction. Since additional plastic deformation takes place in the cutting direction, the material on the workpiece surface will be more strained in this direction compared to the feed direction.
The aerosols produced at the higher pressure were unable to provide a proper lubricating effect, since it creates finer droplets and moves with higher velocity. This may create insufficient lubrication, because finer droplets will not condense and coalesce at the rake face, and will not facilitate formation of a proper lubricating film. Too finer droplets with high velocity can also bounce back after striking the tool or workpiece surface without residing at the interface and wetting it, thus hindering the formation of a beneficial lubricating layer.11,12 However, at lower pressure, the larger droplets can coalescence and form a beneficial lubricating film, responsible for providing proper lubrication and cooling effect.
The effect of pressure on the above-mentioned observations can be corroborated with optical images of chip, tool, and workpiece, as shown in Figure 4. Examining the chip morphology, along with their respective micro-hardness, Figure 4(a)–(c) shows that chip with smaller curl radius was obtained at lower pressure and curl radius increased at higher pressure. Larger chip curl radius can increase the contact length at the rake face that, in turn, is responsible for the rise in the cutting energy. Larger chip curl is also associated with harder chips (as shown in Figure 4(a)) which can be attributed to plastic deformation taking place because of insufficient lubrication at the tool–chip contact area. From the optical images of flank and rake faces, it can be seen that more wear took place at higher air pressure. At the lower pressure of 4 bar, a comparatively cleaner surface is visible, indicating more effective lubricating actions. This corresponds to a lower specific cutting energy (Figure 3(a)) that can be attributed to the more effective lubricating action. It can be seen from the SEM images of the machined surface that, at both the lower and higher air pressure of 4 and 6 bar, respectively, the surface consisted of both wear particles and the feed marks. Surface topography images also suggest the similar observation where feed marks at higher pressure of 6 bar are more intense as compared to lower air pressure of 5 bar. This tends to increase surface roughness and specific cutting energy compared to the medium pressure of 5 bar, wherein there are fewer feed marks. This suggests that the lubricating film produced at the flank face of 5 bar air pressure is protecting the machined surface compared to the higher and the lower pressures which also lower the energy requirements.
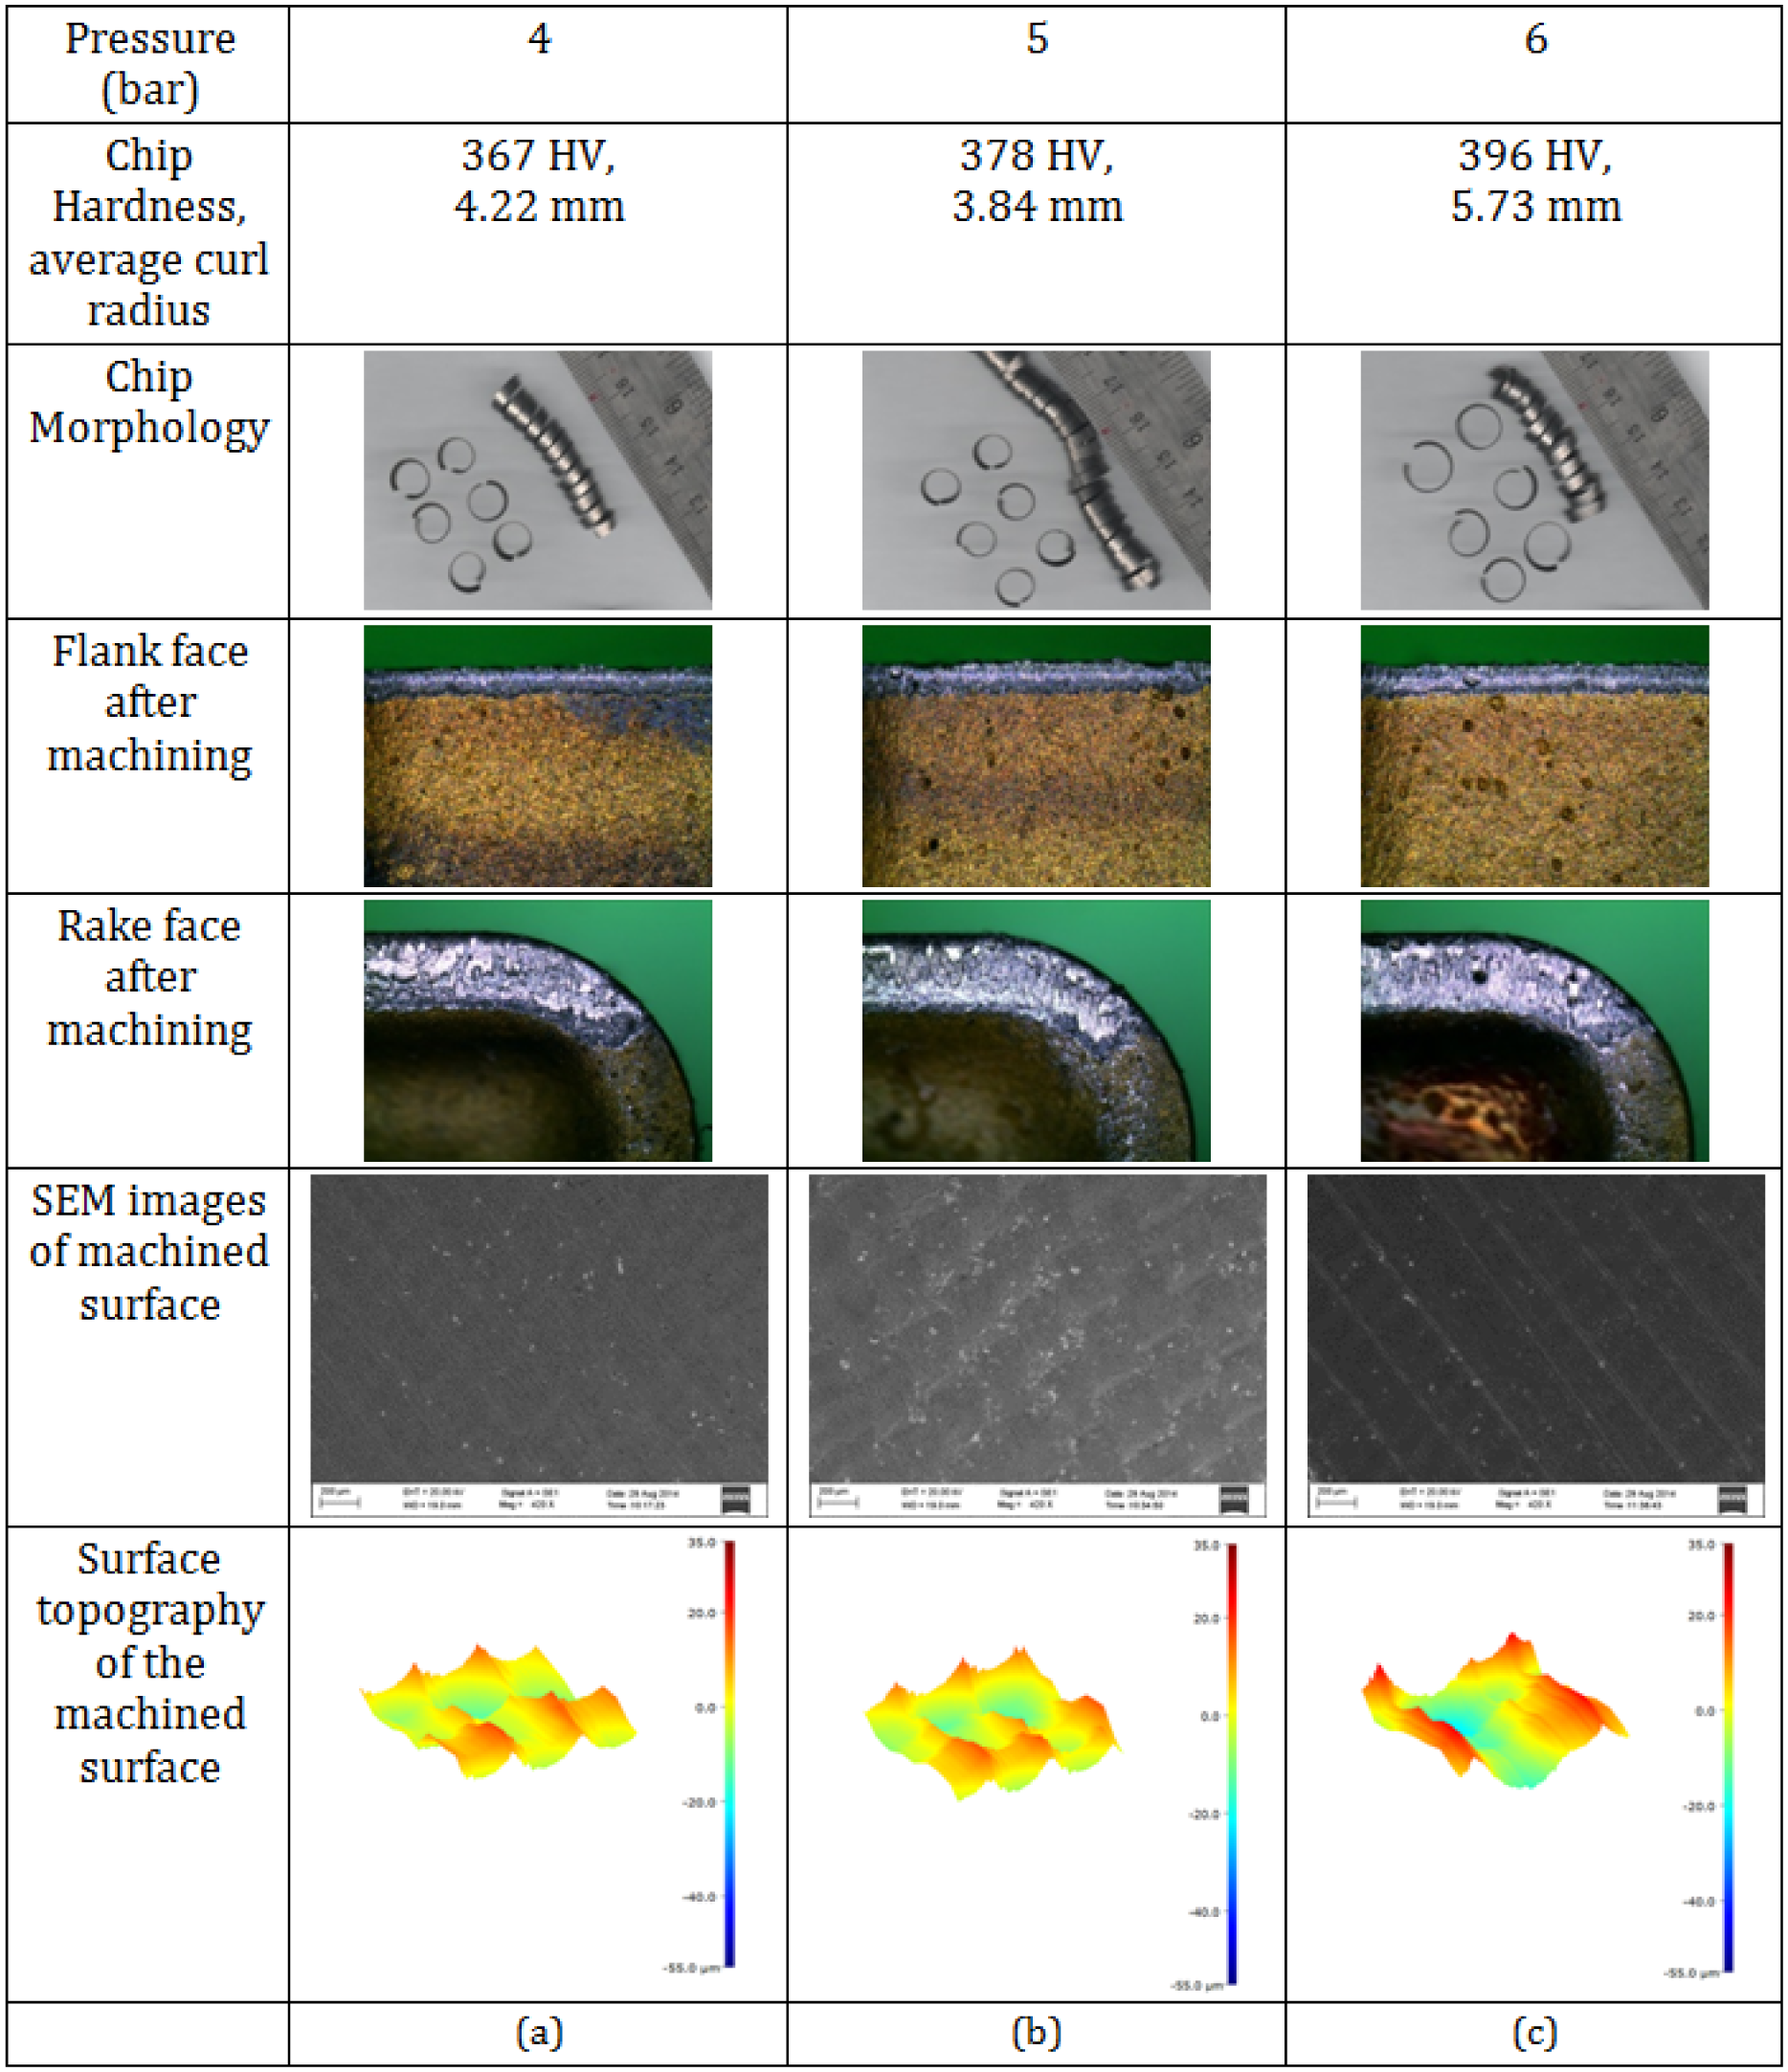
Effect of changes in air pressure on chip, tool, and workpiece (a) 4 bar, (b) 5 bar, and (c) 6 bar.
Effect of oil quantity
The oil quantity was varied by separately varying the stroke frequency and the stroke volume of the pump. Investigating the stroke frequency can be useful in understanding the effect of intermittent spray lubrication mode on the machining process. Investigating stroke volume can give insight about the effect of oil injected at each stroke of the machining process.
Effect of stroke frequency
Figure 5(a) shows the effect of stroke frequency on specific cutting energy; specific cutting energy decreased when stroke frequency was increased from 1 to 3 Hz, but further increases in stroke frequency increased the specific cutting energy. This suggests that there is a proper air–oil mixture that is responsible for providing a beneficial lubricating film, which can further lower the energy consumption. Although increased stroke frequency means more oil supplied per unit time, the results suggest that increased frequency is not always beneficial for providing proper lubrication.
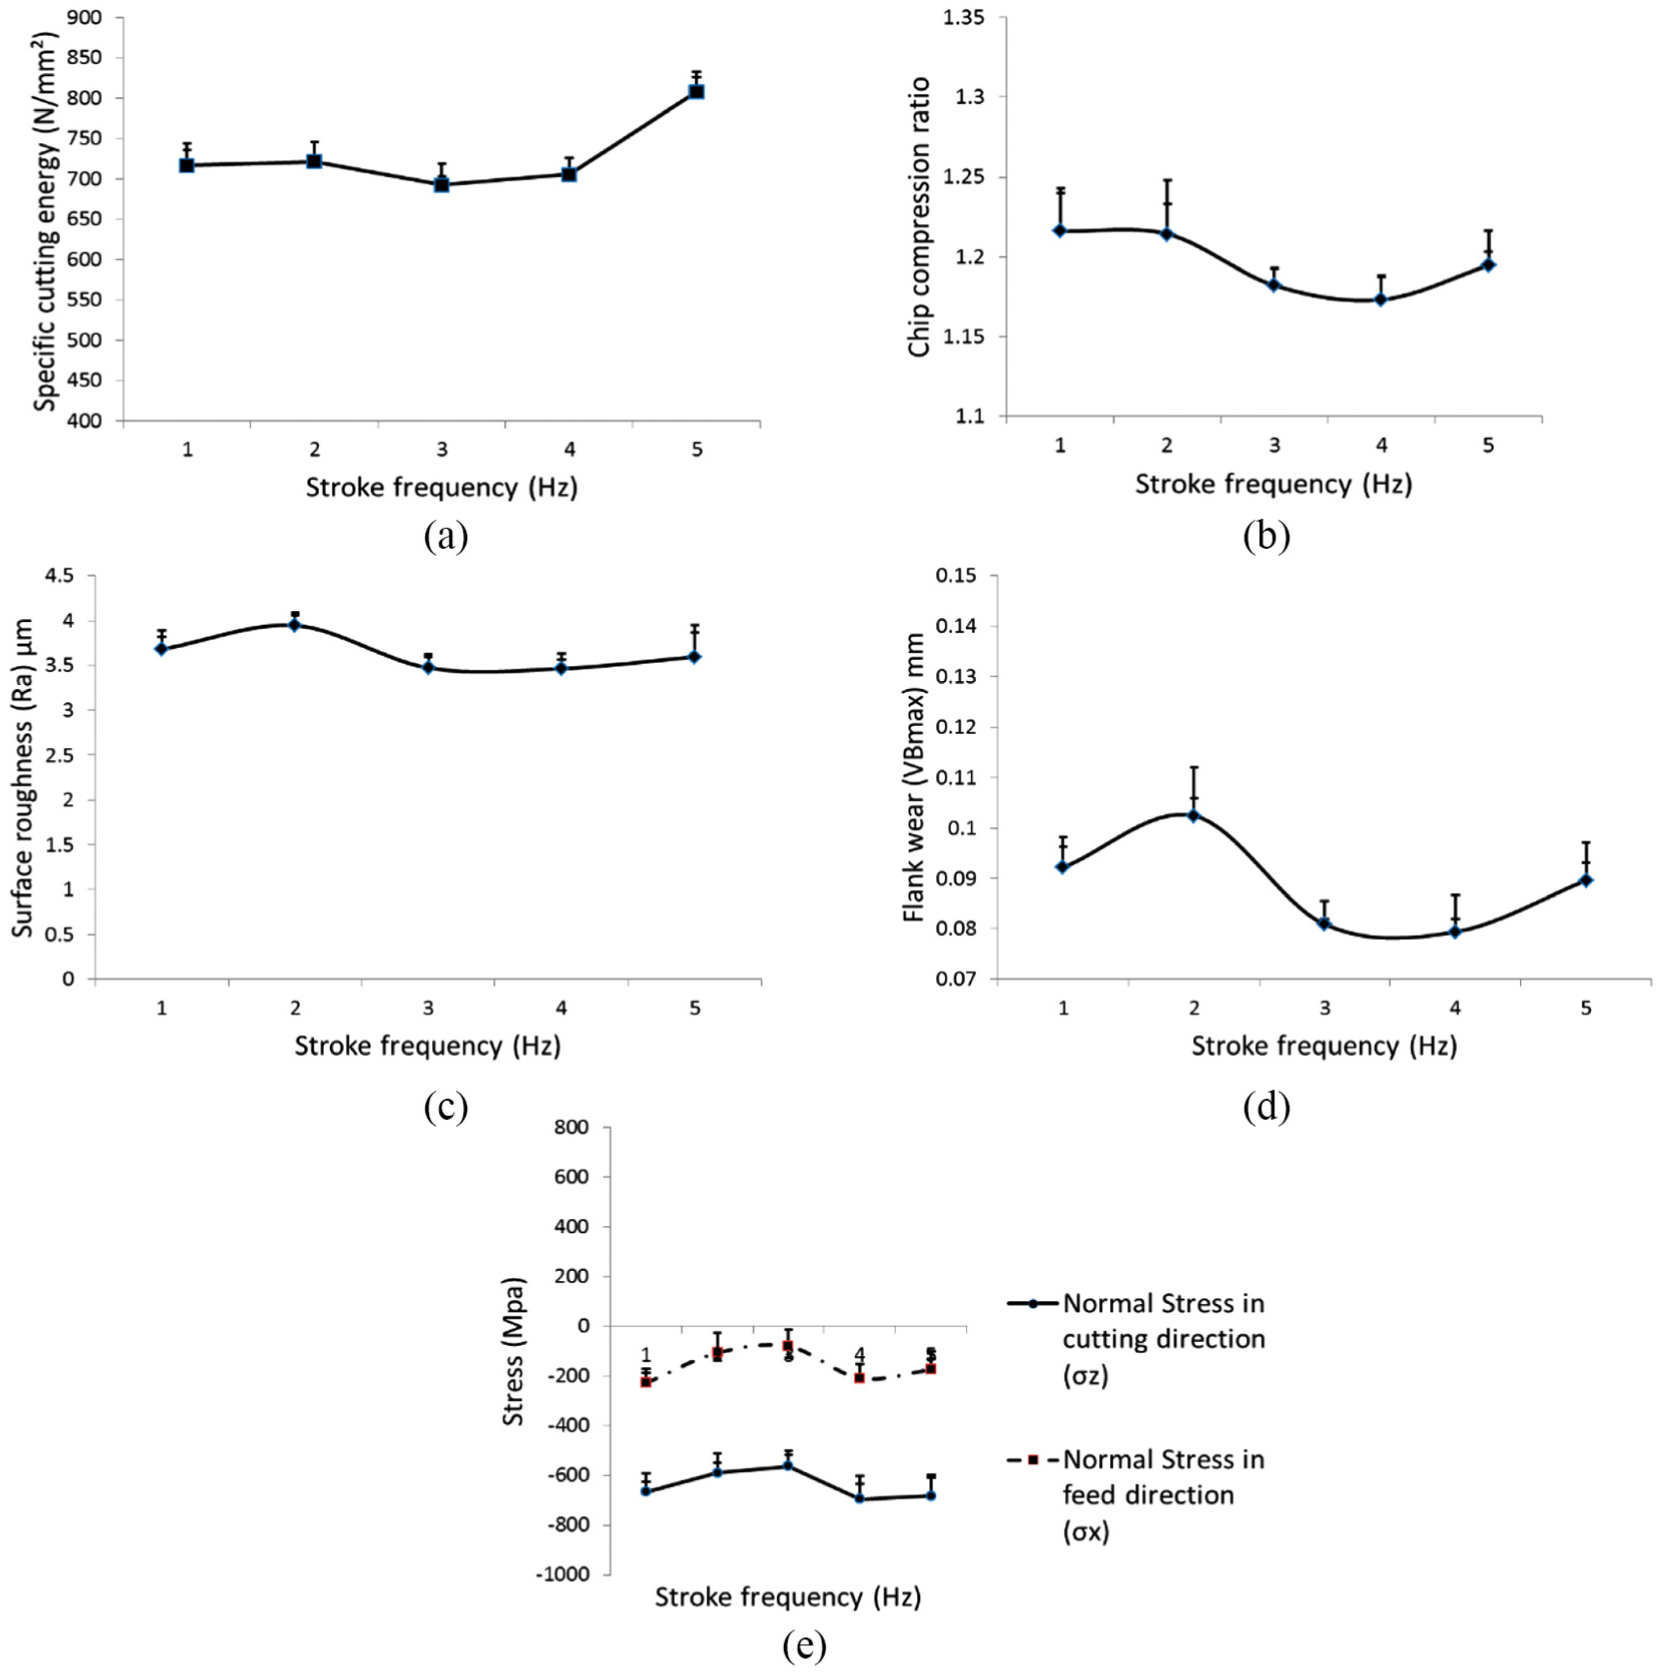
Effect of stroke frequency on (a) specific cutting energy, (b) chip compression ratio, (c) surface roughness, (d) flank wear, and (e) residual stress (air pressure = 5, stroke volume = 0.02, oil distribution factor = 0.5).
Figure 5(b) shows that the effect of stroke frequency on the chip compression ratio was minimal up to 3 Hz. The lowest chip compression ratio was achieved at 4 Hz and, with further increases in stroke frequency, the chip compression ratio increased. Figure 5(c) shows the change in variation of surface roughness with respect to stroke frequency. The stroke frequency of 3 Hz provided minimum surface roughness. With further increases or decreases in stroke frequency, deterioration of the surface finish was observed. Lower flank wear was observed with 3–4 Hz stroke frequency (Figure 5(d)), similar to the trend of surface roughness. Figure 5(e) shows the variation in residual stress formation with respect to stroke frequency. Higher compressive residual stresses were formed in the lowest and highest stroke frequencies. Moderate stroke frequency is beneficial in terms of providing a smooth surface with less specific cutting energy. Increases in stroke frequency may bring greater accumulation of oil droplets per unit time, which can hinder the lubrication process by overheating the interface. This, in turn, may result in the formation of slurry with unused lubricant and metal debris instead of facilitating the formation of an effective lubricating film; slurry formed this way will increase the friction at the tool–workpiece interface, which will increase the energy requirement for material removal and can increase the interface temperature. This can further influence the surface quality of the workpiece, because the slurry will clog the chip–tool and the tool–workpiece interface, resulting in the formation of an irregular surface, and lowering the surface finish, 14 though the higher temperature generated at the interface seems helpful in generating more compressive residual stresses.
At lower stroke frequency, a slightly higher chip curl radius was observed, whereas with increases in stroke frequency, a curlier chip with lower chip radius can be seen (Figure 6(a)–(c)). Higher chip curl radius may result from insufficient amount of lubrication at the rake face of the tool. Although chip curl and chip compression ratio can give insight about how easily a chip generation process is taking place, it may not be the only criterion that can influence the force generation and energy consumption. Insufficient lubrication at the flank face of the tool can also contribute to increased energy consumption. Lower stroke frequency also seems to be ineffective, which can be seen from the workpiece surface images, where feed marks are clearly visible (Figure 6(a)). At lower stroke frequency of 1 Hz, because of insufficient lubrication, feed marks are more pronounced as compared to 3 Hz. At highest stroke frequency of 5 Hz, feed marks are also accompanied with surface damage that can be seen from the surface topography images (Figure 6(c)), which might have resulted from the friction developed from the slurry between flank face of the tool and the machined surface.
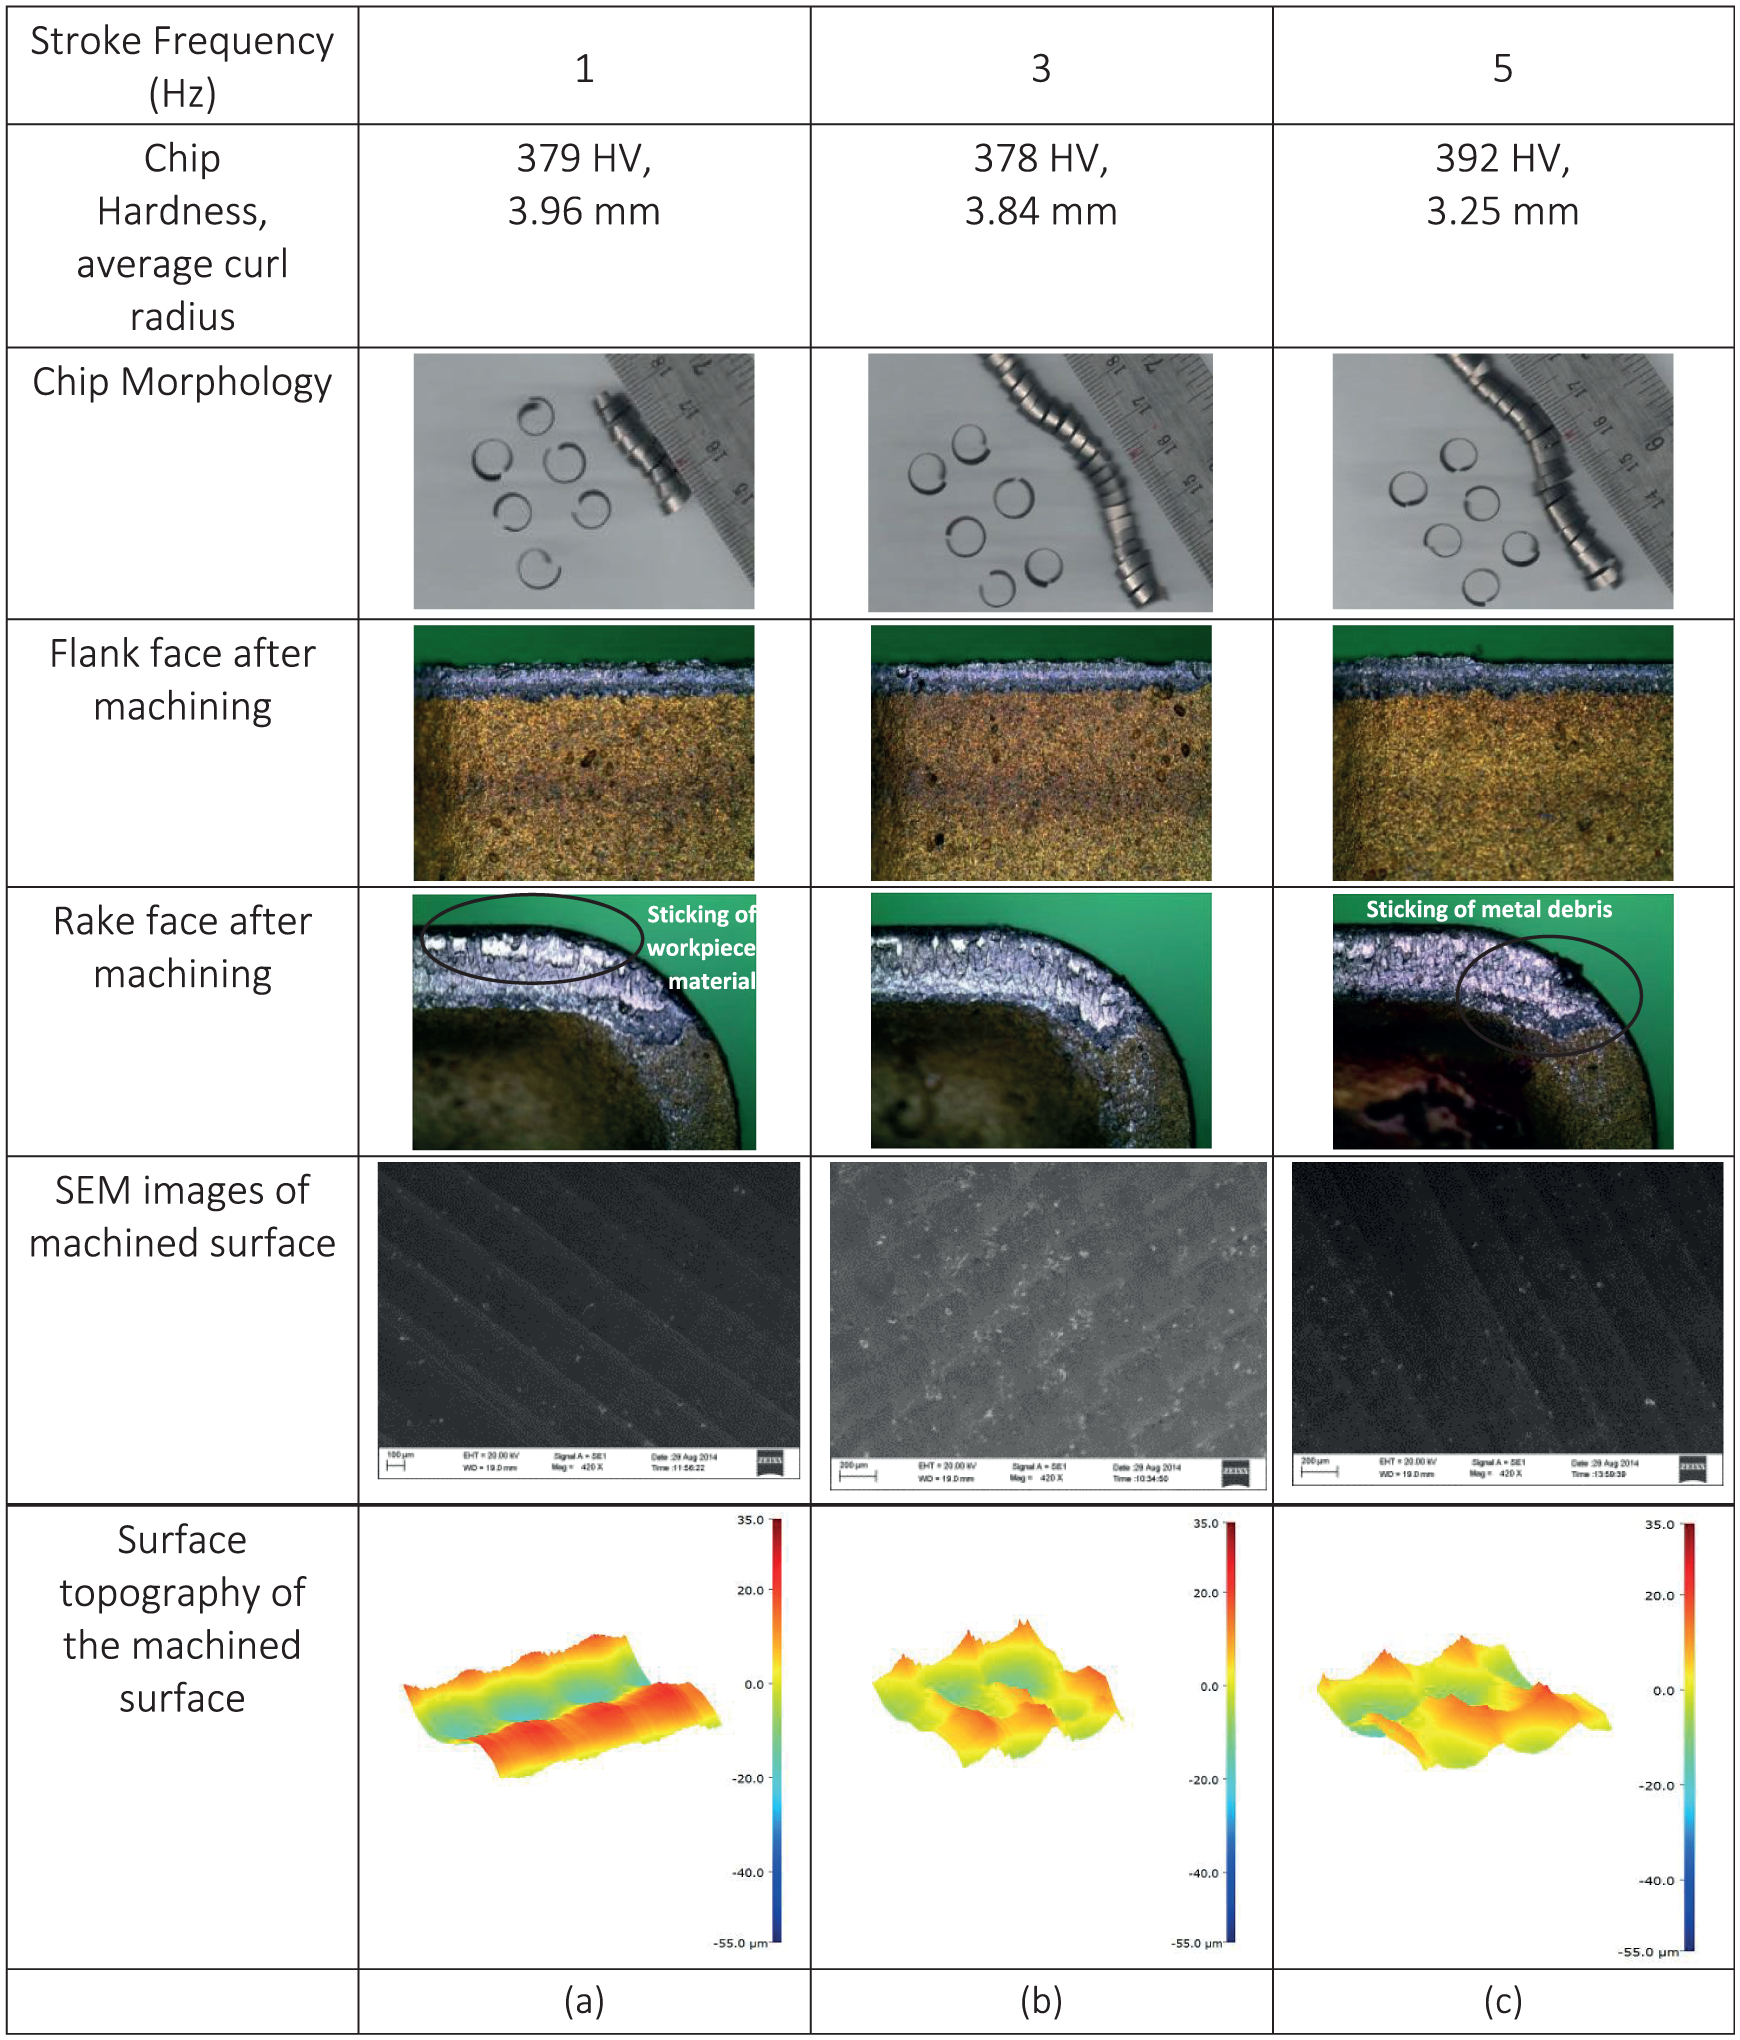
Effect of changes in stroke frequency on chip, tool, and workpiece (a) 1 Hz, (b) 3 Hz, and (c) 5 Hz.
Images of the rake and flank faces of the cutting inserts show that more workpiece material is sticking on the insert surface at the lower frequency of 1 Hz (Figure 6(a)), and at the higher frequency of 5 Hz, more sticking of material debris is visible (Figure 6(c)). At the medium stroke frequency of 3 Hz, relatively less surface damage and material sticking can be seen at the insert surface (Figure 6(b)). This investigation suggests that, when MQL is applied in the form of an intermittent spray, an optimal stroke frequency is enough to provide a better machining surface quality and lower energy consumption.
Effect of stroke volume
Understanding the effect of stroke volume (cm3) will help to decide the correct quantity of oil to provide a proper lubricating environment and reduce oil consumption, which will result in optimum resource utilization and reduce the cost of machining. The influence of stroke volume on specific cutting energy, chip thickness, surface roughness, flank wear, and residual stress is shown in Figure 7. The lowest cutting energy was observed at 0.02 cm3, and further decreases in stroke volume increased energy consumption (Figure 7(a)). Although the lower stroke volumes of 0.01 and 0.015 cm3 were more detrimental, compared to the higher stroke volumes of 0.025 and 0.03 cm3, chip compression ratio also decreased with increases in stroke volume, shown in Figure 7(b).
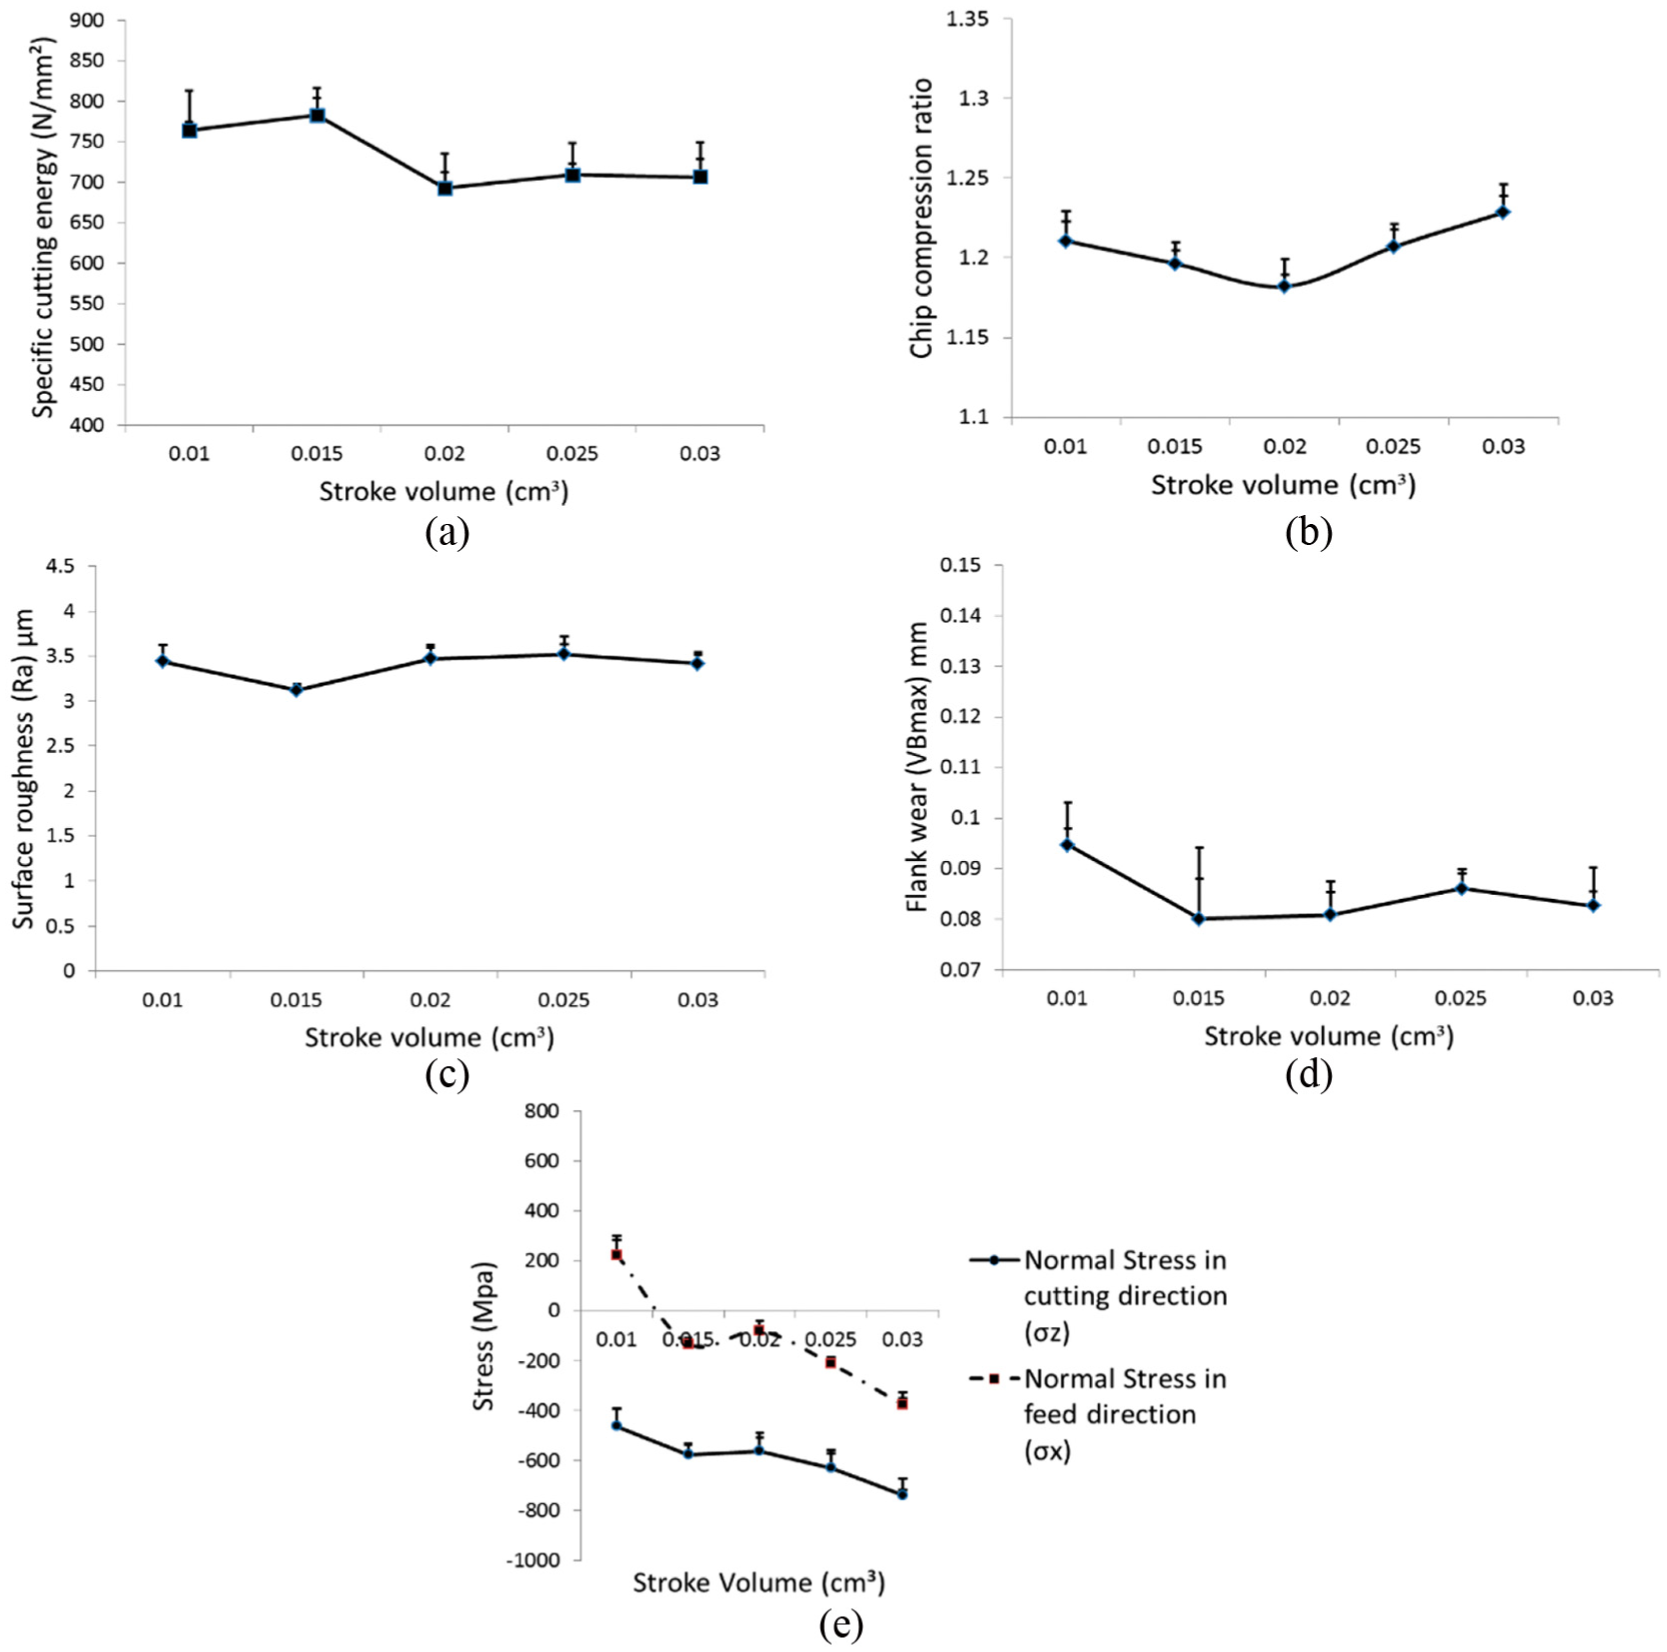
Effect of stroke volume on (a) specific cutting energy, (b) chip compression ratio, (c) surface roughness, (d) flank wear, and (e) residual stress (air pressure = 5, stroke frequency = 3, oil distribution factor = 0.5).
Figure 7(c) shows the variation in surface roughness with respect to stroke volume; better surface finish was achieved at 0.015 cm3 and decreasing or increasing the oil quantity did not provide any favorable results. The effect on flank wear is also visible in Figure 7(d), where the lowest wear can be seen for the case of the 0.015 cm3 stroke volume. Flank wear followed the same trend as the surface roughness, which was expected, since both occur at the same interface. Figure 7(e) shows that increases in stroke volume increase compressive residual stress. Lower stroke volume provided a lower supply of oil at the tool–workpiece interface, which was inadequate to decrease the temperature, resulting in generation of lower compressive residual stresses. Increasing stroke volume from 0.015 cm3 resulted in more compressive residual stresses; it seems that by increasing the quantity of oil in the air–oil mixture, a denser aerosol is formed. The smaller oil droplets can coalescence and form larger droplets, which may fall down before reaching the tool–workpiece interface, resulting in inadequate cooling and lubrication. There is also the possibility of overheating of the contact zone because of the accumulation of these heavier oil droplets,15,16 which, without reaching the proper contact zone, do not facilitate formation of lubricating film but create a reverse effect by jamming the interface, resulting in the increase in the forces required for chip formation. 14
Lower stroke volume also resulted in a large chip curl radius (Figure 8(a)), which may be responsible for the increased cutting energy. By increasing the stroke volume, more curly chips were obtained (Figure 8(b) and (c)) that reduced the contact length, which may be attributed to more lubrication and the cooling effect generated at the chip–tool interface.17,18 At higher stroke volumes, accumulation and sticking of material was observed at the tool rake face (Figure 8(c)), which can be attributed to the softening of workpiece material at the contact region, resulting in additional material flow. This further deteriorated the tool performance, which increased the flank wear. Contrary to higher stroke volume, lower stroke volumes of 0.01 and 0.02 cm3 showed less damage of the flank surface and material accumulation at the rake surface. The effect of it was observed in SEM images of the machined surface (Figure 8(a)–(c)). At the higher stroke volumes of 0.02 and 0.03 cm3, increased surface roughness can be attributed to accumulation of metal debris and side flow of the material resulting in the generation of feed marks. Surface topography images at higher stroke volume of 0.03 cm3 show more irregular material flow and accumulation which might have resulted in the formation of irregular surface. Although at the lower stroke volume feed marks are visible, they occur in a more regular manner which might have occurred because of sufficient lubrication condition prevailing at the tool and workpiece surface. Hence, it can be seen that more oil can produce harmful results in the machining process, and proper synchronization of the air–oil mixture is essential to get the best output from the MQL process.
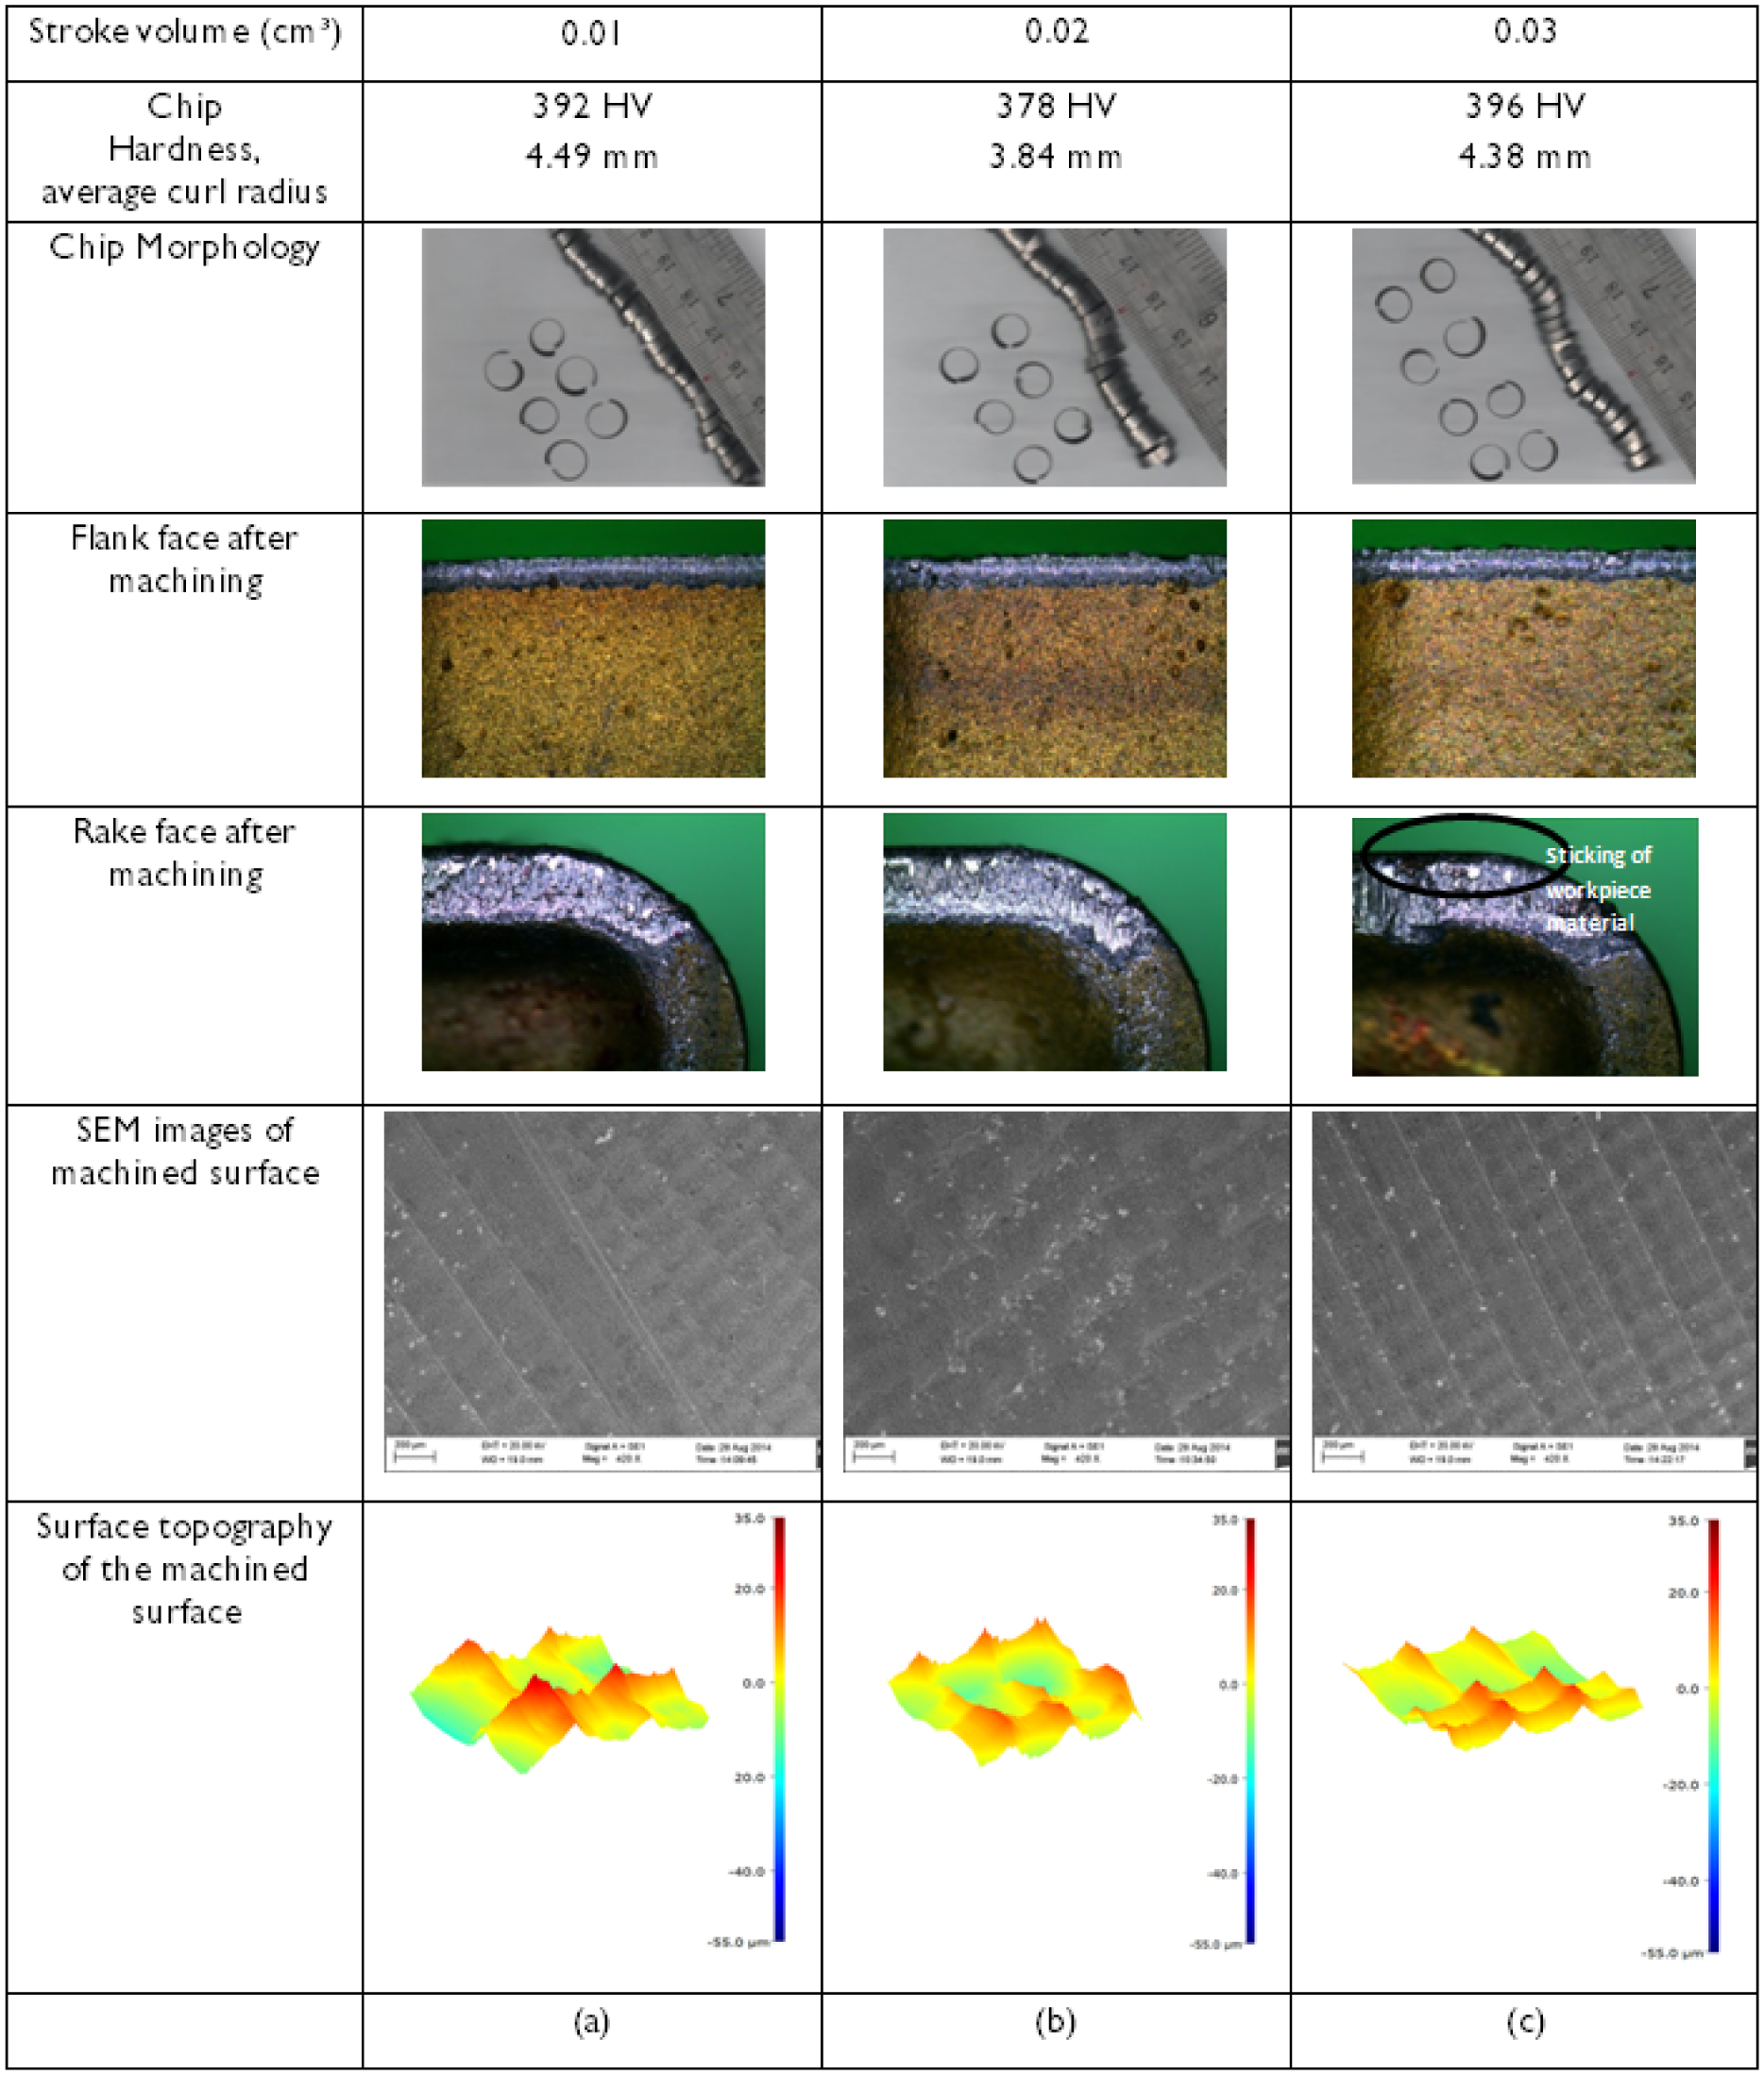
Effect of change in stroke volume on chip, tool, and workpiece (a) 0.01 cm3, (b) 0.02 cm3, and (c) 0.03 cm3.
Although the result suggested that increases in oil quantity could reduce the chip curl radius, it is not always beneficial for reducing the cutting energy and surface roughness. Previous work suggests that the effect of contact length due to chip curl is not always beneficial in reducing the cutting force and temperature generated at the cutting zone.19,20 Investigation of oil quantity showed that increases in oil consumption, either by stroke volume or by stroke frequency, are not always beneficial in achieving a better machining performance. It actually depends on how precisely the air–oil mixture, responsible for providing proper lubrication, can be formed and delivered at both rake and flank faces.
Effect of oil distribution, Qd
The oil distribution factor is a very important element in this investigation, able to give insight about the amount of oil that should be injected at the rake and flank faces of the tool to increase machining performance. Different patterns of surface roughness and specific cutting energy, as discussed above, suggest that there might be different lubrication needs at the rake and flank faces of the tool. At the flank face, mostly, heat is generated because of the rubbing of flank of the tool with the freshly formed machined surface. At the rake face, the temperature rises because of the sliding of freshly formed chips and any decrease or increase in contact length can significantly influence the generated cutting force.3,21 The effect of the oil distribution factor on cutting force, chip thickness, surface roughness, flank wear, and residual stress generation is shown in Figure 9.
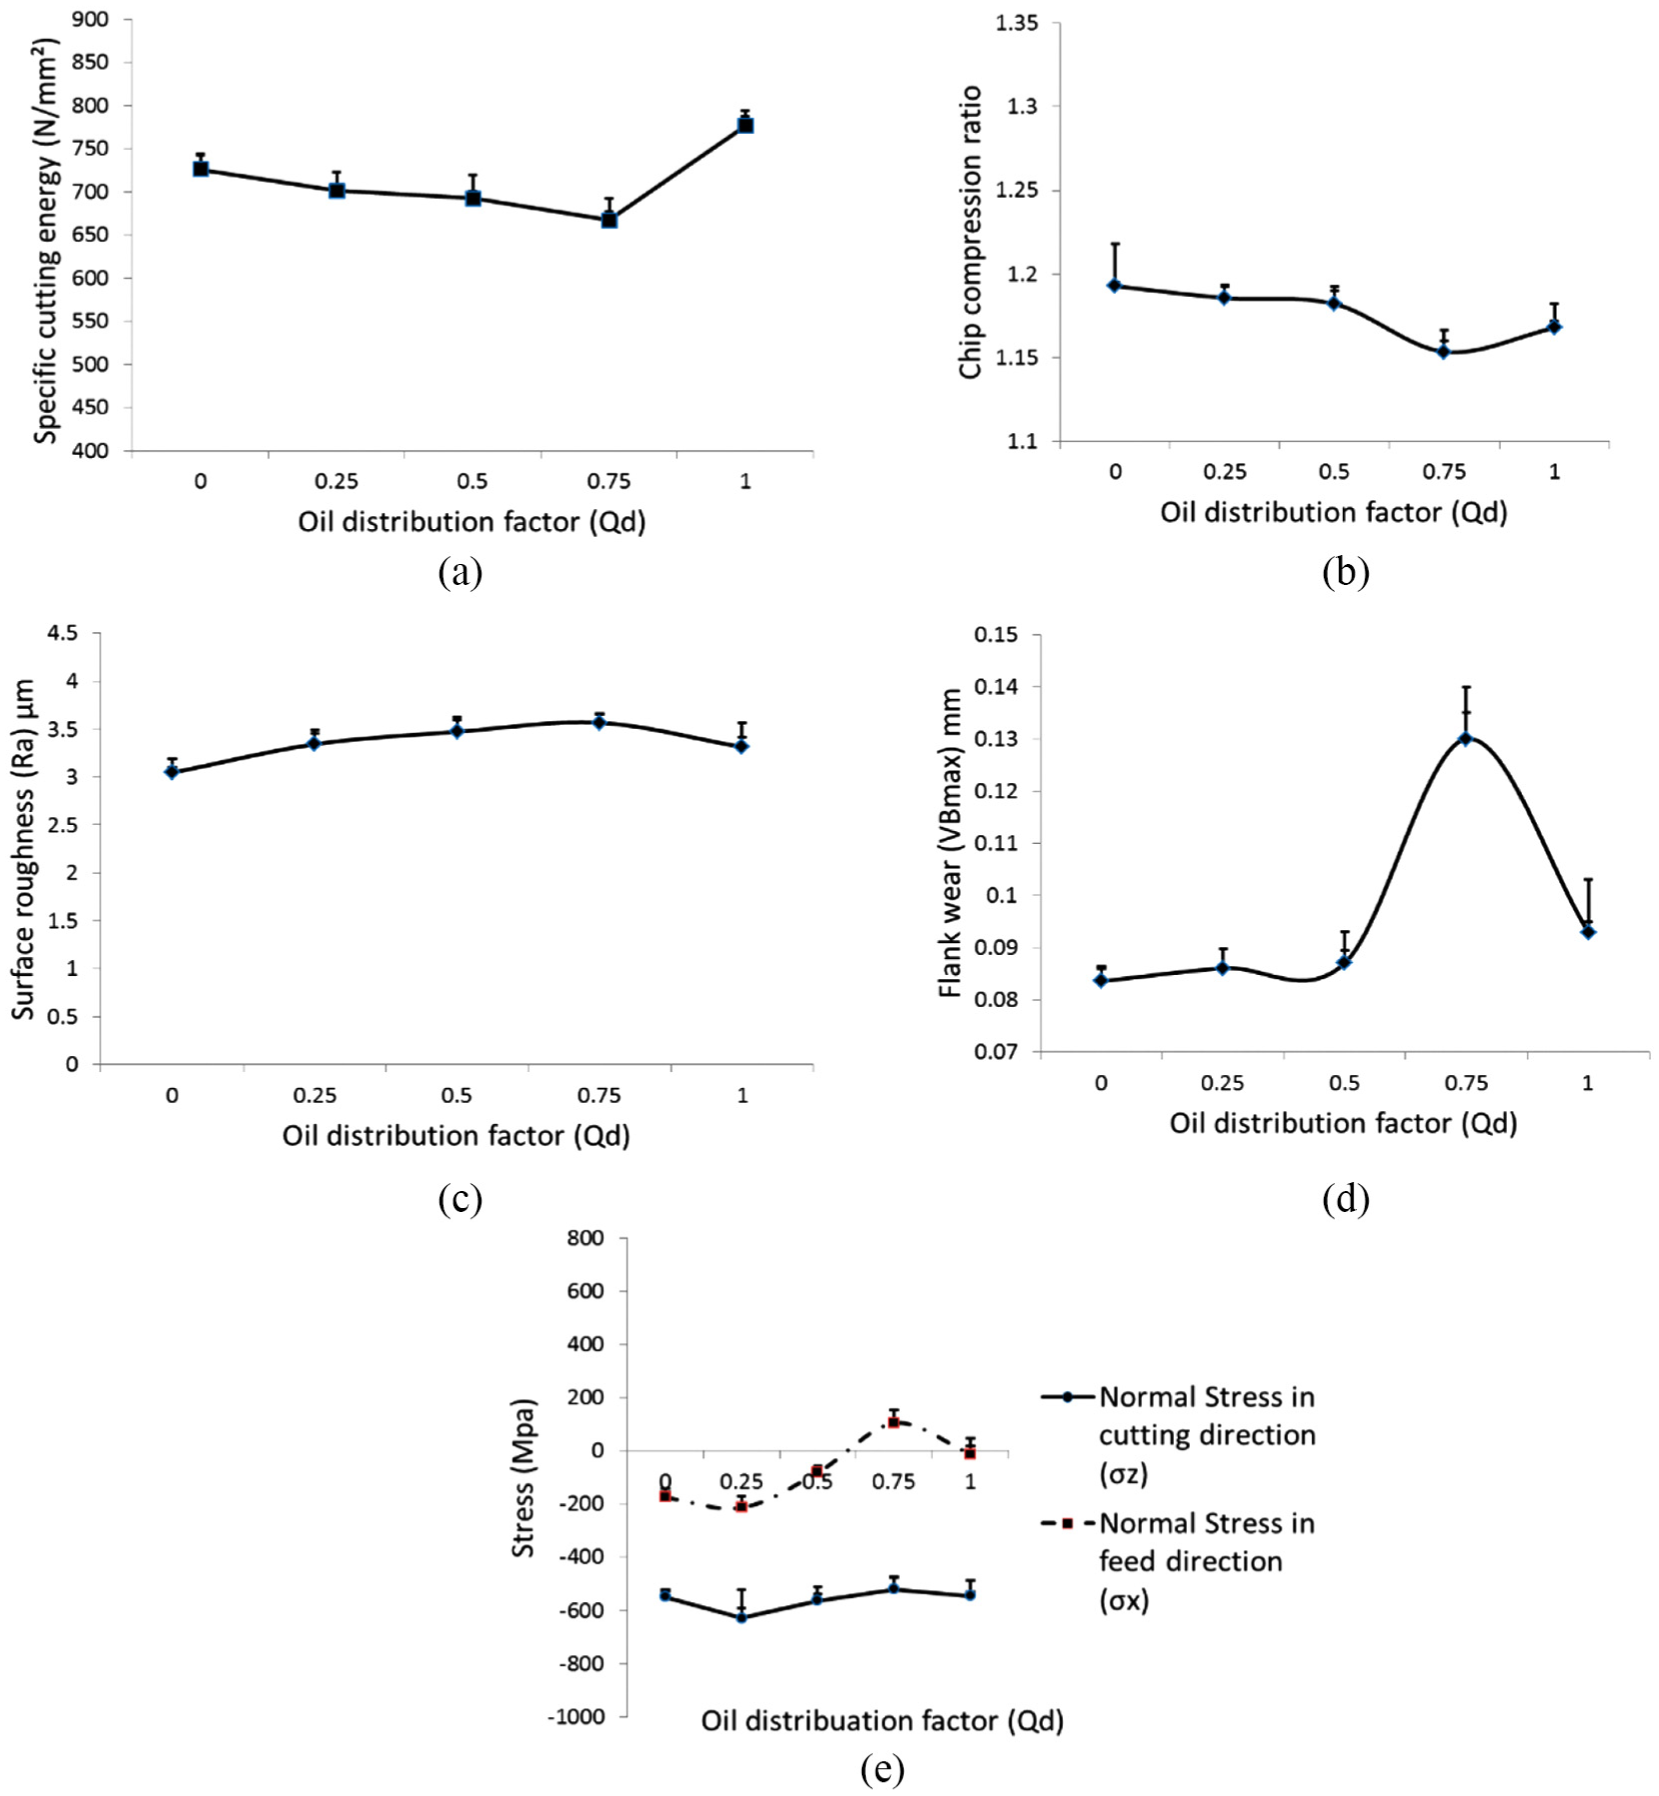
Effect of oil distribution factor on (a) specific cutting energy, (b) chip compression ratio, (c) surface roughness, (d) flank wear, and (e) residual stress (air pressure = 5, stroke frequency = 3, stroke volume = 0.02).
Figure 9(a) shows that when Qd = 0.75, that is, 75% of the total oil was applied at the rake face of the tool and the remainder on the flank face of the tool, the lowest specific cutting energy was achieved. This variation was also supported by changes in the measured chip thickness, which was also minimum at Qd = 0.75, as displayed in Figure 9(b). However, greater oil injection at the flank face, for example, Qd = 0.25, can provide better surface finish, evident from Figure 9(c), and can decrease tool wear (Figure 9(d)). The residual stress started altering from compressive to tensile as the amount of oil injected at the rake face increased from 25%, that is, Qd=0.25 to higher values (Figure 9(e)).
Once the oil quantity was increased at the rake face, the chip curl lowered, suggesting increased lubricating action at the tool–chip interface (Figure 10(a)–(c)). Optical images of the rake and flank faces of the tool, displayed in Figure 10, show that the higher accumulation of workpiece material took place when oil was completely focused on the rake face, that is, Qd = 1 (Figure 10(c)). Lowering the oil consumption at the rake face provided a cleaner tool surface with less material accumulation (Figure 10(a) and (b)). Additional oil at the rake face hindered the lubrication process because of overheating and sticking of the workpiece material, resulting in increases in cutting energy. SEM images of the workpiece surface, shown in Figure 10(a)–(c), show that a smoother surface was obtained when the oil was injected fully at the flank face of the tool, that is, Qd = 0; as the oil supply decreases, additional rough surface with metal debris can be visible, which suggests decreased lubrication. While analyzing the surface topography images, it can be seen that when the oil quantity is reduced from the flank face (i.e. Qd = 0.75 and 1), more dense distribution of surface peaks and valleys can be seen which might have generated because of insufficient lubrication condition at the flank face of the tool. The distribution of oil toward the rake can be beneficial in achieving lesser cutting energy, but in terms of achieving better surface finish and lower tool wear, injecting the oil only at the flank face seems to be more beneficial.
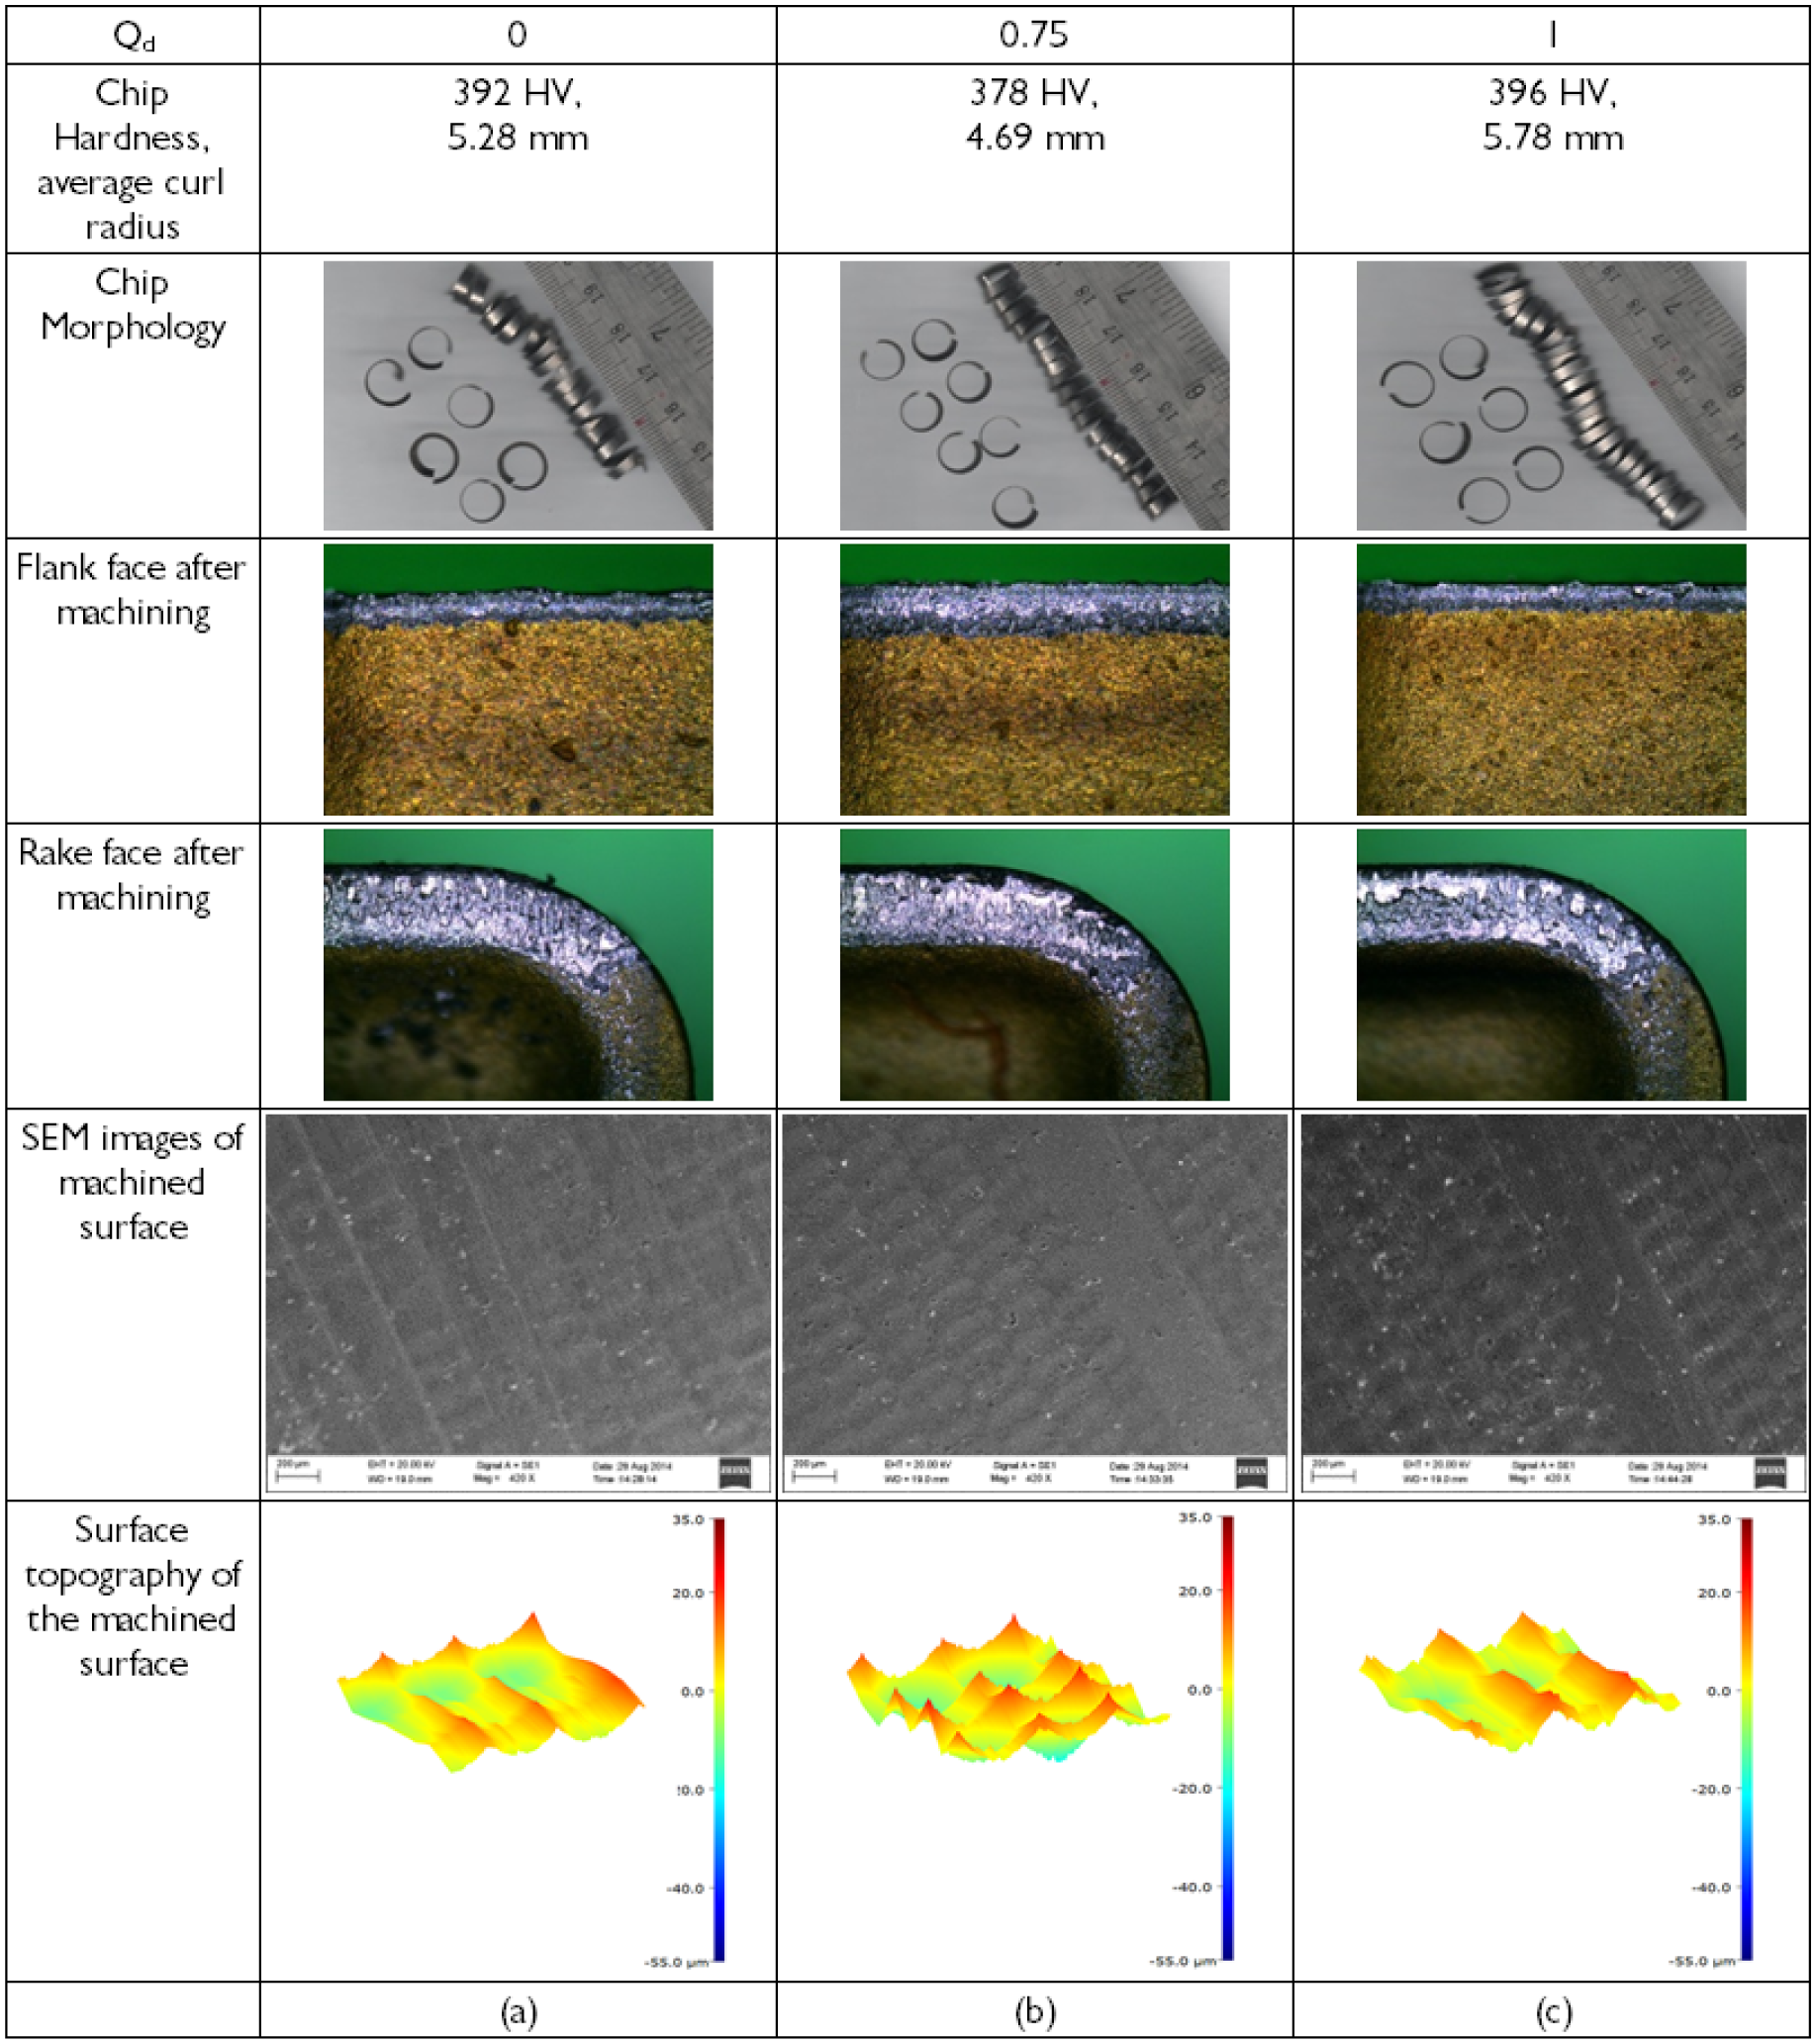
Effect of change in oil distribution (Qd) on chip, tool, and workpiece (a) 0, (b) 0.75, and (c) 1.
Mechanism of MMQL
Analyzing the adiabatic shear band formation on the front surface of the chip and the accumulation of dust particles at the back surface of a chip can give insight about the tribological conditions that prevailed at the rake face of the tool during MMQL. It can be seen in Figure 11(a) and (b) that with increased air pressure, fewer dust particles accumulated at the back surface of the chip. The front and back surface images of the chips suggest that at lower pressure, shear bands are crushed against each other, compared to higher air pressure, which might have generated more dust particles. 22
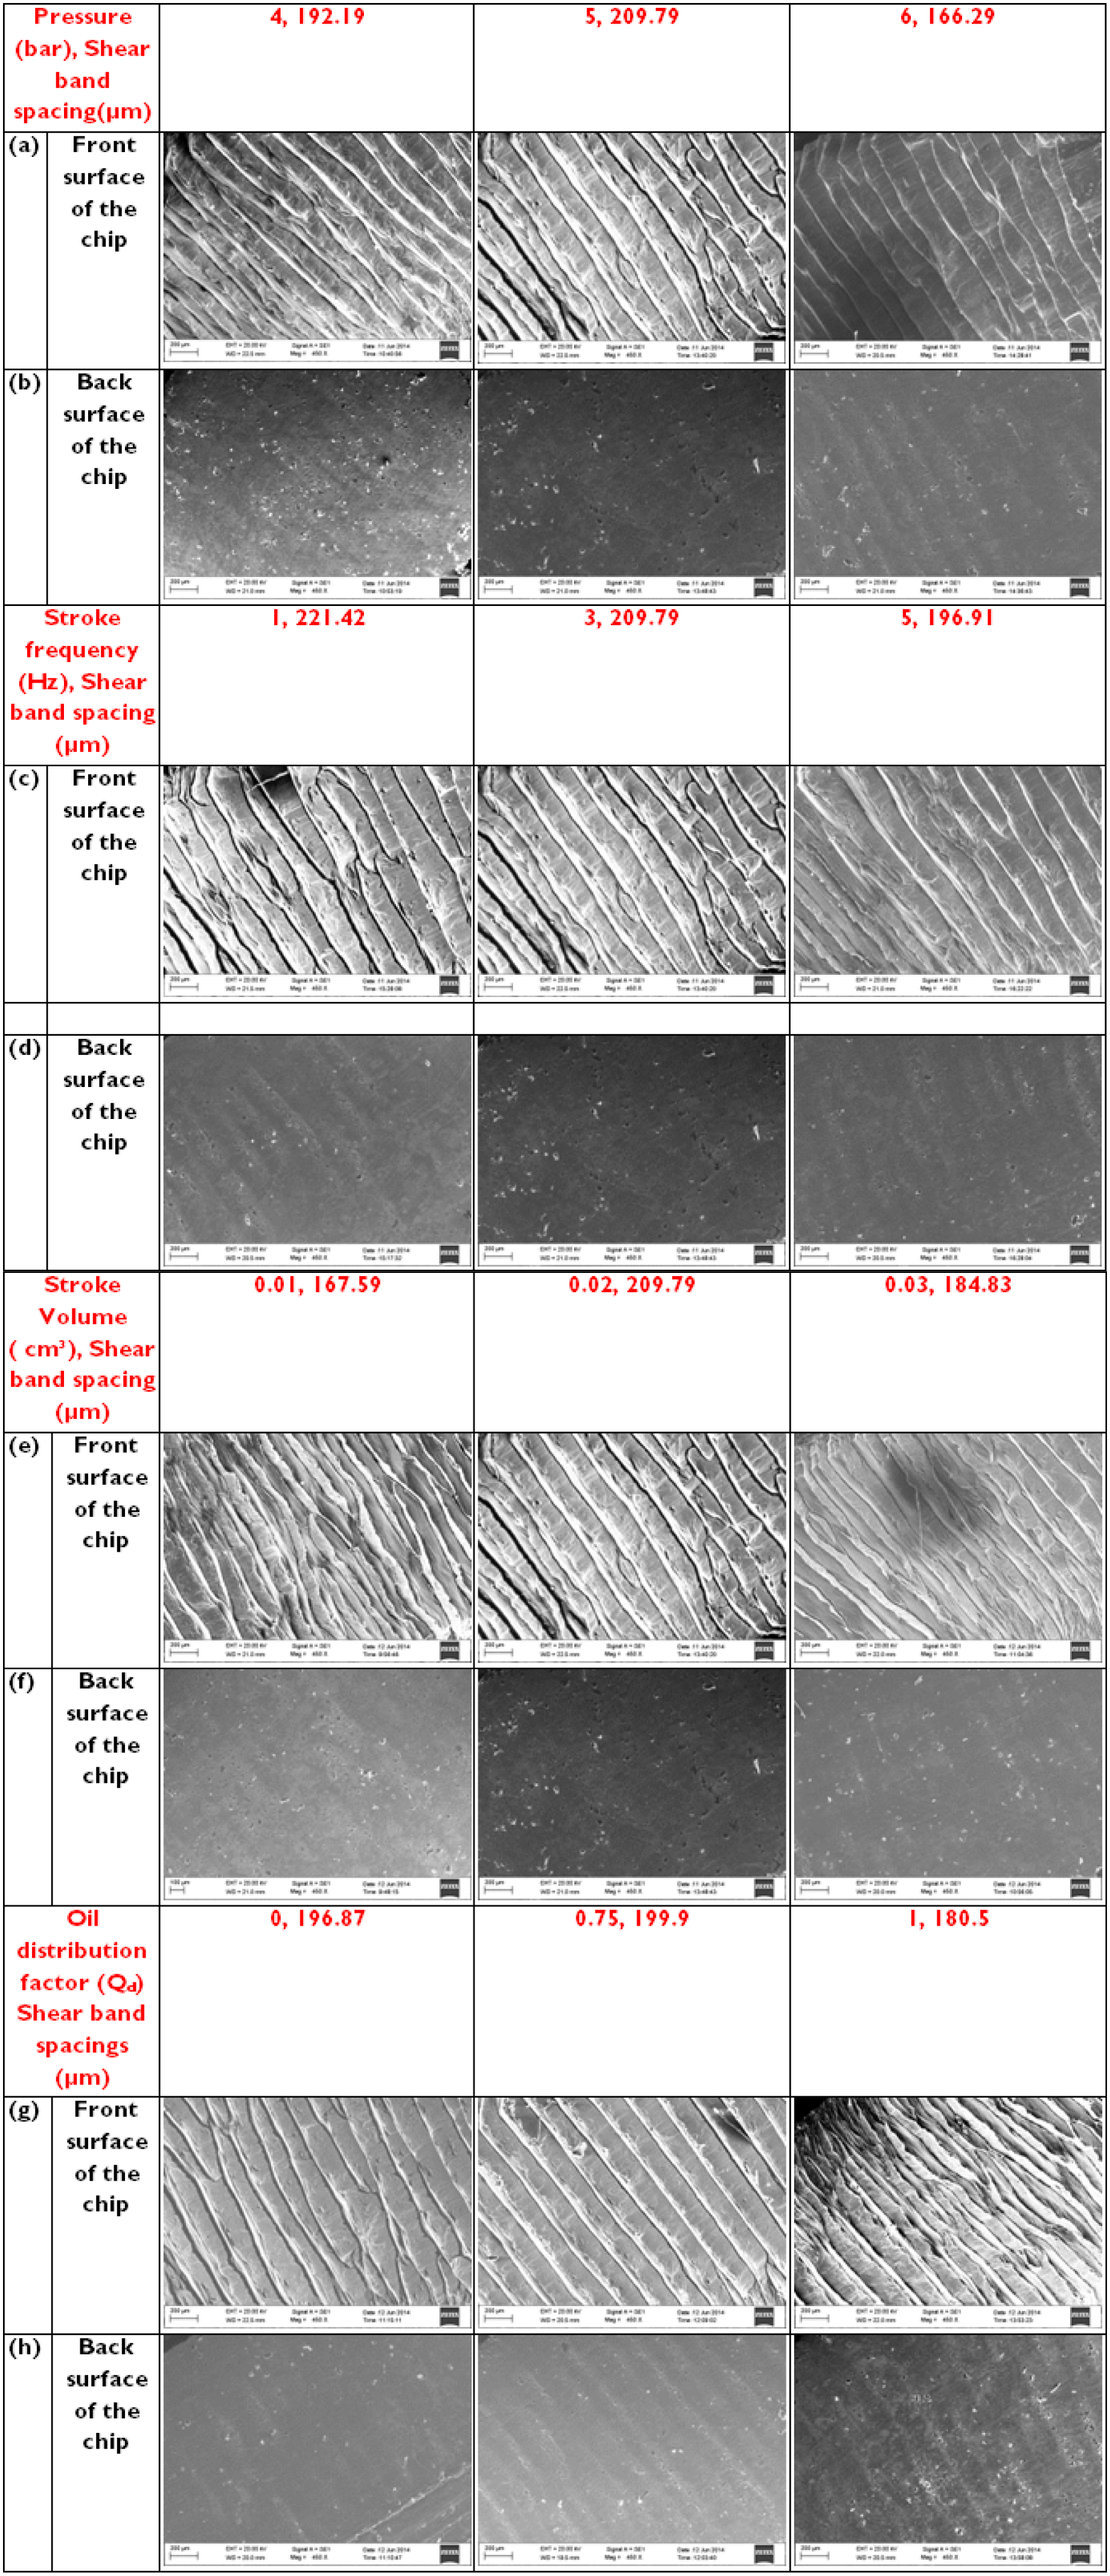
SEM images of the chip surface (a) front surface of chip at different pressures, (b) front surface of chip at different pressures. SEM images of the front and back surfaces of chip at different pressures (a and b, respectively), at different stroke frequencies (c and d, respectively), at different stroke volumes (e and f, respectively), and at different oil distribution factors (g and h, respectively).
In the cases of the stroke frequencies of 1 and 5 Hz, more fragmentation within the shear bands is visible on the front surface of the chips (Figure 11(c) and (d)), but in the case of 3 Hz, fragmentation within the shear bands was reduced. Increased fragmentation suggests the formation of more brittle chips, which might have occurred due to the generation of high temperatures at the tool–chip interface. This resulted in lower dust particle accumulation. It seems that a certain amount of the air–oil mixture is responsible for lower generation and sticking of the dust particles. Variations in stroke volume did not show any clear trend, but at the lowest stroke volume (0.01 cm3), the shear bands are more closely spaced compared to the highest stroke volume (0.03 cm3), which is visible at the front surface of the chip (Figure 11(e) and (f)). This might be the reason for decreased dust particle accumulation and sticking at the backside of the chip. In the case of the oil distribution factor, when the oil is totally focused on the rake face of the tool (Qd = 1), more sticking of dust particles is visible at the back surface of the chip (Figure 11(g) and (h)). However, when the oil is distributed on the rake and the flank faces of the tool, the dust particles sticking at the back surface of the chip were reduced. The front face of the chip showed much less fragmentation within the shear bands in the case of Qd = 0 and Qd = 0.75, which suggests that the brittle fracture of the chips consequently decreased the emission of dust particles.23,24 It can also be seen from the measurement of shear band spacing that smaller band width is associated with increase in fragmentation within shear bands. Chips with smaller band width further assist in crushing of the chip bands and generation of more dust particles as compared to chip with higher band width. It seems that higher band width chips with regular shapes are formed when sufficient lubrication is taking place at the tool–chip interface which is also visible in the form of reduced cutting energy, as discussed earlier. In general, it can be inferred that the conditions responsible for tool wear and rough machined surface also lead to dense adiabatic bands with fragmentation. Analysis of the chip structure in this section suggests that, because of the shear band spacing, fragmentation within these bands can influence the generation of dust particle emissions and accumulation on the back surface of the chip. This, in turn, can influence the efficiency of the lubricating mechanisms at the chip–workpiece interface and the working environment of the people. Hence, choosing proper parameters can effectively reduce dust particle generation and its emissions, which can lead to better machining performance and working environments.
Conclusion
The investigation reports experimental investigation on a MMQL system for metal cutting operations, wherein two separate supply systems provide an oil–air mixture at the rake and flank faces. The flow parameters, namely, air, pressure, oil quantity, and proportion of oil, are individually controlled at the rake and flank faces. The investigation indicates that different lubricating requirements prevail at the rake and flank faces of the tool. Injecting the oil fully at the flank face is beneficial for providing the best surface finish but a distributed supply, that is, 75% of oil at the rake face and the remainder at the flank face, is better for lowering the specific cutting energy. The optimum quantity of oil at lower pressure, low to moderate stroke frequency, and moderate to high stroke volume further assist in lowering the cutting energy; however, the effect on surface roughness and tool wear is opposite to that of specific cutting energy. Moderate air pressure, moderate to high stroke frequency, and low to moderate stroke volume give a smoother finish and less tool wear. The surface residual stress follows the tool wear and roughness pattern. A rough machine surface and excess tool wear correspond to higher tensile residual stress. The effects of changes in MQL parameters are clearly visible on the adiabatic shear band on the front surface of the chip and metal dust particles on the back of the chip. The conditions responsible for higher tool wear and rough surface result in crushing of the adiabatic shear band and generation of metal dust. The combined effects of simultaneously changing machining and MQL parameters should be the subjects of future study.
Footnotes
Declaration of conflicting interests
The author(s) declared no potential conflicts of interest with respect to the research, authorship, and/or publication of this article.
Funding
The author(s) received no financial support for the research, authorship, and/or publication of this article.