
Abstract
In a price-sensitive market, quality improvement framework also needs to incorporate cost factor. Past research on Lean Six Sigma gives limited insight on any framework catering to quality and cost together. This study aims to contribute in this niche by illustrating a hybrid framework, DMAIoC (define, measure, analyse, improve, optimise and control) to attain desired quality at minimum investment cost by integrating simplex method of optimisation in conventional DMAIC (define, measure, analyse, improve and control) framework. A case study is presented highlighting a field quality rejection problem faced by a manufacturing organisation of consumer goods. Sustainable drop height of a finished good is identified as a response variable to improve the quality. Proposed framework has been used to arrive at a statistical model to define relationship between response and input variables. Investment cost involved with change in input variables has been formulated as objective function. Constrains of objective functions were derived by extendable limits of input variables and by statistical model generated for sustainable drop height. Several feasible solutions to the objective function were identified using simplex method in optimise phase and the most economic was recommended for implementation to meet quality requirement at minimum investment. Suggested framework has significant practical implication in price–quality sensitive markets where manufacturers seek low cost process improvement solutions.
Keywords
Introduction
Since 1980s, a change became discernable in the methods of quality control in the manufacturing units. Earlier, the focus was on controlling through monitoring rather than process improvement and optimisation. 1 Now, with competitions among companies getting tougher, customers have become very demanding. In the process, operational improvement has become strategically important. 2 Companies and organisations are forced to devise innovative ways to fulfil and even exceed customers’ expectations. 3 For improving quality of operations, many firms throughout the world have adopted several innovative tools and techniques. In the prevailing environment, companies are adopting Lean Six Sigma (LSS) and its DMAIC (define, measure, analyse, improve and control) framework as the most widely accepted strategy for continuous improvement. 4 It has taken years to develop as a method that helps organisations in delivering near-perfect products and services. 3 Presently, there is good number of literatures available for a thorough understanding of the method. 5 Although it has been recognised as a very successful methodology for quality improvement, its efficacy can be enhanced even further if it is integrated with other improvement strategies. 6
LSS projects recommend solutions for quality improvement. In most cases, they require cost investment during implementation. Cost minimisation is also a major point for consideration, particularly in price-sensitive markets. This article proposes a hybrid framework DMAIoC (define, measure, analyse, improve, optimise and control), where Optimise phase is integrated with conventional DMAIC framework with an objective of achieving desired quality at optimum cost. Proposed framework is supported by a case study. In this case study, a real-life industrial problem is solved using the DMAIoC framework and the requisite quality improvement was achieved at an optimum cost.
Literature survey
A detailed literature survey was carried out on the use of the LSS for achieving process excellence in different types of industries. Antony et al. 7 suggested three different approaches. First one is a metric approach where the maximum allowable defect is 3.4 per million opportunities. Second is a framework for process improvement as given in the DMAIC. The third approach is to understand it in a philosophical term where the aim is to reduce variation in business processes keeping customer criticality in mind.
A number of researchers presented their views on LSS by implementing it on a specific problem related to a specific industry or process. LSS as a quality improvement framework is recognised as the most significant development in the technology and quality domain. However, it was noted that picking a project for implementation to achieve multiple objectives can be a tricky job. One is faced with many hindrances, such as, resource constraints, budget constraints, etc. Together, these aspects were formulated as diversity and management constraints. A Pareto frontier was developed to help the decision-makers in finding an optimal solution. It was found that the optimal solution was more sensitive to cost than benefit. 8 In complex manufacturing processes, known and unknown causal relationships exist. Having prior knowledge of causal relationship helps industrial engineers in evaluating the overall impact of a process improvement project. 9 Effect of lean manufacturing and value stream mapping using a case study and a comparative study of other process improvement tools, such as, Kaizen, 5 why, design of experiments (DOE), etc. was presented by Chen et al. 10 In their case study, a current value stream map was created and then a future state was proposed to improve the lead time. Integration of Six Sigma (SS) objectives and industrial engineering tools within a quality framework was presented by case study using a DOE-based technique to improve crate-less retort production to sort out the problems of damaged cans. 11 In sewing machine’s axle bearing, four characteristics are identified as critical to quality (CTQ). Multi-characteristic product capability analysis chart is used to identify and analyse the factors affecting bearing quality. Optimum process levels determined by control charts are presented. The results show that SS can be used by manufacturers of sewing machines to improve quality. 12
Few researchers evaluated the integration effect of SS with other improvement strategies. Wang and Chen 13 have applied the LSS approach and soft system methodology (SSM) to reduce variations of forecasting manufacturing costs of flat panel display equipment assembly. While the conventional LSS tools are used in the ‘define’, ‘measure’, ‘analyse’ and ‘control’ phases of the DMAIC approach, the SSM is used to identify scopes for improvement in the ‘improve’ phase. The SSM is used in understanding different perceptions of different stakeholders to generate ideas for improvement in a complex system of manufacturing. The authors further suggest application of newer tools and techniques in the future studies of the LSS approach. Integration effect of SS with total quality management was evaluated and it was found that combining with other strategies can actually increase the benefits. 14
There have been attempts to see its effect in different geographies. Mann et al. 15 have investigated the application of the business excellence (BE) approach in the Asian organisations. Based on a survey of 74 organisations in five countries, authors discovered that most organisations, which have implemented a BE framework, have realised its benefits. However, much more needs to be done to spread awareness about this approach, particularly in small- and medium-scale enterprises. Companies need to emphasise on networking with the established practitioners of the BE framework and the academics need to analyse the best practices. Alsmadi et al. 16 have examined the implementation of SS in Saudi Arabia and then generalised its results for the developing countries in general. According to their findings, the companies give top priority to impact on the bottom line during the project selection. Customer satisfaction follows it and the cost involved in running a SS project is the third most important consideration. Employees mostly use soft tools, brainstorming, 5 why, etc., but they seldom apply the advanced statistical methods. Main reasons behind not adopting the SS approach have been found to be lack of knowledge, budget and time constraints, etc. Therefore, in the context of developing countries, it is useful to adopt cost-effective techniques that can minimise investment for improvement. Results of a survey of manufacturing industries in Mexico for 37 main tasks associated with Kaizen implementation revealed that a total of seven factors were important for success. 17
Past research also targeted to evaluate organisation wide implementation of LSS framework. Having a practical implementation framework for successful application of SS in the context of small- and medium-sized enterprises is crucial. Good understanding of the problems and knowledge of how to start the process are important for successful SS and for other continuous improvement programmes. 18 Psychogios and Tsironis 19 have addressed the issues affecting the implementation of the LSS by its critical factors and have suggested a framework that constitutes core factors. Through an extensive literature review of 127 research papers on SS and 119 papers on ISO 9000 certification, Karthi et al. 20 have found that in the last three decades, ISO 9001 certification and SS have been used by companies in achieving continuous improvement. However, the synergy between the two approaches has been missing. The authors have proposed up-gradation of ISO 9001:2008 by certain amendments to include the principles of SS so that benefits of both could be enjoyed. Over the last few years, SS has come to be considered as an established method for quality improvement with near-zero defects.21–23 Moreover, it applies to common and advanced statistical tools.24–26 With the reduction in incidences of rework and rejections, it also facilitates monetary gains.27,28 Continuous improvement and lean objectives can also be achieved through the implementation of SS.29,30 Analysis of quality management practices for UK SS and non-SS small and medium enterprises revealed that strong leadership, management commitment, communication, education and training are important for success. Resource constraints, changes in management, lack of commitment and resistance to change were biggest hindrance. There are critical differences in SS and non-SS organisations, affecting the business performance. 31
Lean and its integration with SS had also been a matter of interest. Lean is considered as a waste reduction framework. It defines value of the product/service as defined by the customer and streamlines the flow with customer pull by continuous improvement to eliminate waste by sorting out value-added and non-value-added activity. Sources of wastes are transportation, inventory, motion, waiting, overproduction, over processing and defects. Typical tools and themes in this framework are value stream mapping, cellular production, U-line system, line balancing, inventory control, quick changeover, pull, kanban, load balancing, lot size reduction, kaizen and work standardisation. 32 Management and employee commitment and supplier participation are critical for success. Major focus of lean research was concept-based studies, and empirical-based studies are recent. Very few studies dealt with simulation and mathematical models. 33 Lean is an opportunity in competitive environment. This cannot be simply achieved by implementing lean techniques alone, instead, a successful move towards lean requires a coherent approach and involvement of everyone. Its application can differ from across industries. 34 Elnadi and Shehab 35 developed a model to measure leanness of product service and system in manufacturing companies. The index provides managers with an insight into the leanness of their services quantifies it.
Both lean and SS are classified under the umbrella of process improvement programmes. While there is difference in definitions, there are many success stories from a variety of organisations on forged application of lean-SS resulted in higher benefits. 36 Lean is explained as a philosophy, as well as a set of practices. SS too is regarded as a philosophy for improvement with a set of statistical tools. 37 Both lean and SS are characterised by business philosophy set of practices and tools and implementation orientation for process improvement. Philosophy is implemented through a set of activities/practices and tools/techniques. Evaluating these points, lean and SS have many similarities and few differences. Most significant commonality is quality management. Lean emphasises on streamlining processes, whereas SS on identifying root causes of defects. 38 In addition, lean addresses apparent problems such as material flow and safety, whereas SS looks into in apparent issues like process variation. 39 Most researchers agree that there is more commonality between lean and SS tools and practices than differences. 40
Past researches have pointed out a few shortcomings and future direction to the prevalent DMAIC framework. Montgomery 41 has divided growth story of SS into three phases. The first and second phases concentrate on defect and waste reduction. The present stage is phase three where the main focus is on adding value to the enterprise. The author further emphasises that success of the third phase of SS needs new methods and techniques to be deployed apart from the conventional practices of phases one and two. An important shortcoming, pointed out by Nakhai and Neves, 42 is that projects executed through such frameworks require investments and are not cost-effective. As a result, other techniques have to be applied simultaneously to make the LSS approach cost-effective as well. Antony 43 found that today’s market is very dynamic and customer priorities change as per time and geography. So project priorities also need to be updated accordingly, which is neglected so far, for example customers of developing economies are very sensitive to price and quality of products. 44
Research objective
Future research areas on LSS, suggested by past research,6,8,11,16,42–44 are broadly indicating on following three:
Integrating other improvement strategies with DMAIC shall be part of future research;
Specific customer requirement linked with specific market shall be addressed as it is a neglected area so far;
Minimisation of cost investment associated with quality improvement shall be taken into consideration. In most cases, suggested solution requires substantial investment which increases the cost of quality improvement, but the DMAIC framework itself has no provision to optimise associated cost investment. So far, there is a lack of quality improvement framework which can address quality and optimisation of improvement cost together.
Keeping suggested research areas together, research objective behind this work is framed as, to fill in this niche by proposing a hybrid framework DMAIoC (depicted in Figure 1) by ‘integrating Optimise phase into conventional DMAIC framework’. Application of the proposed hybrid framework is illustrated through a case study by solving a real-life industrial problem on high defect rate of a product. Goal of the case study is to meet ‘quality target at minimum improvement cost’. It is a specific customer requirement of price-sensitive markets. 44 Simplex method has been applied in Optimise phase to ‘minimise cost investment associated with quality improvement’.
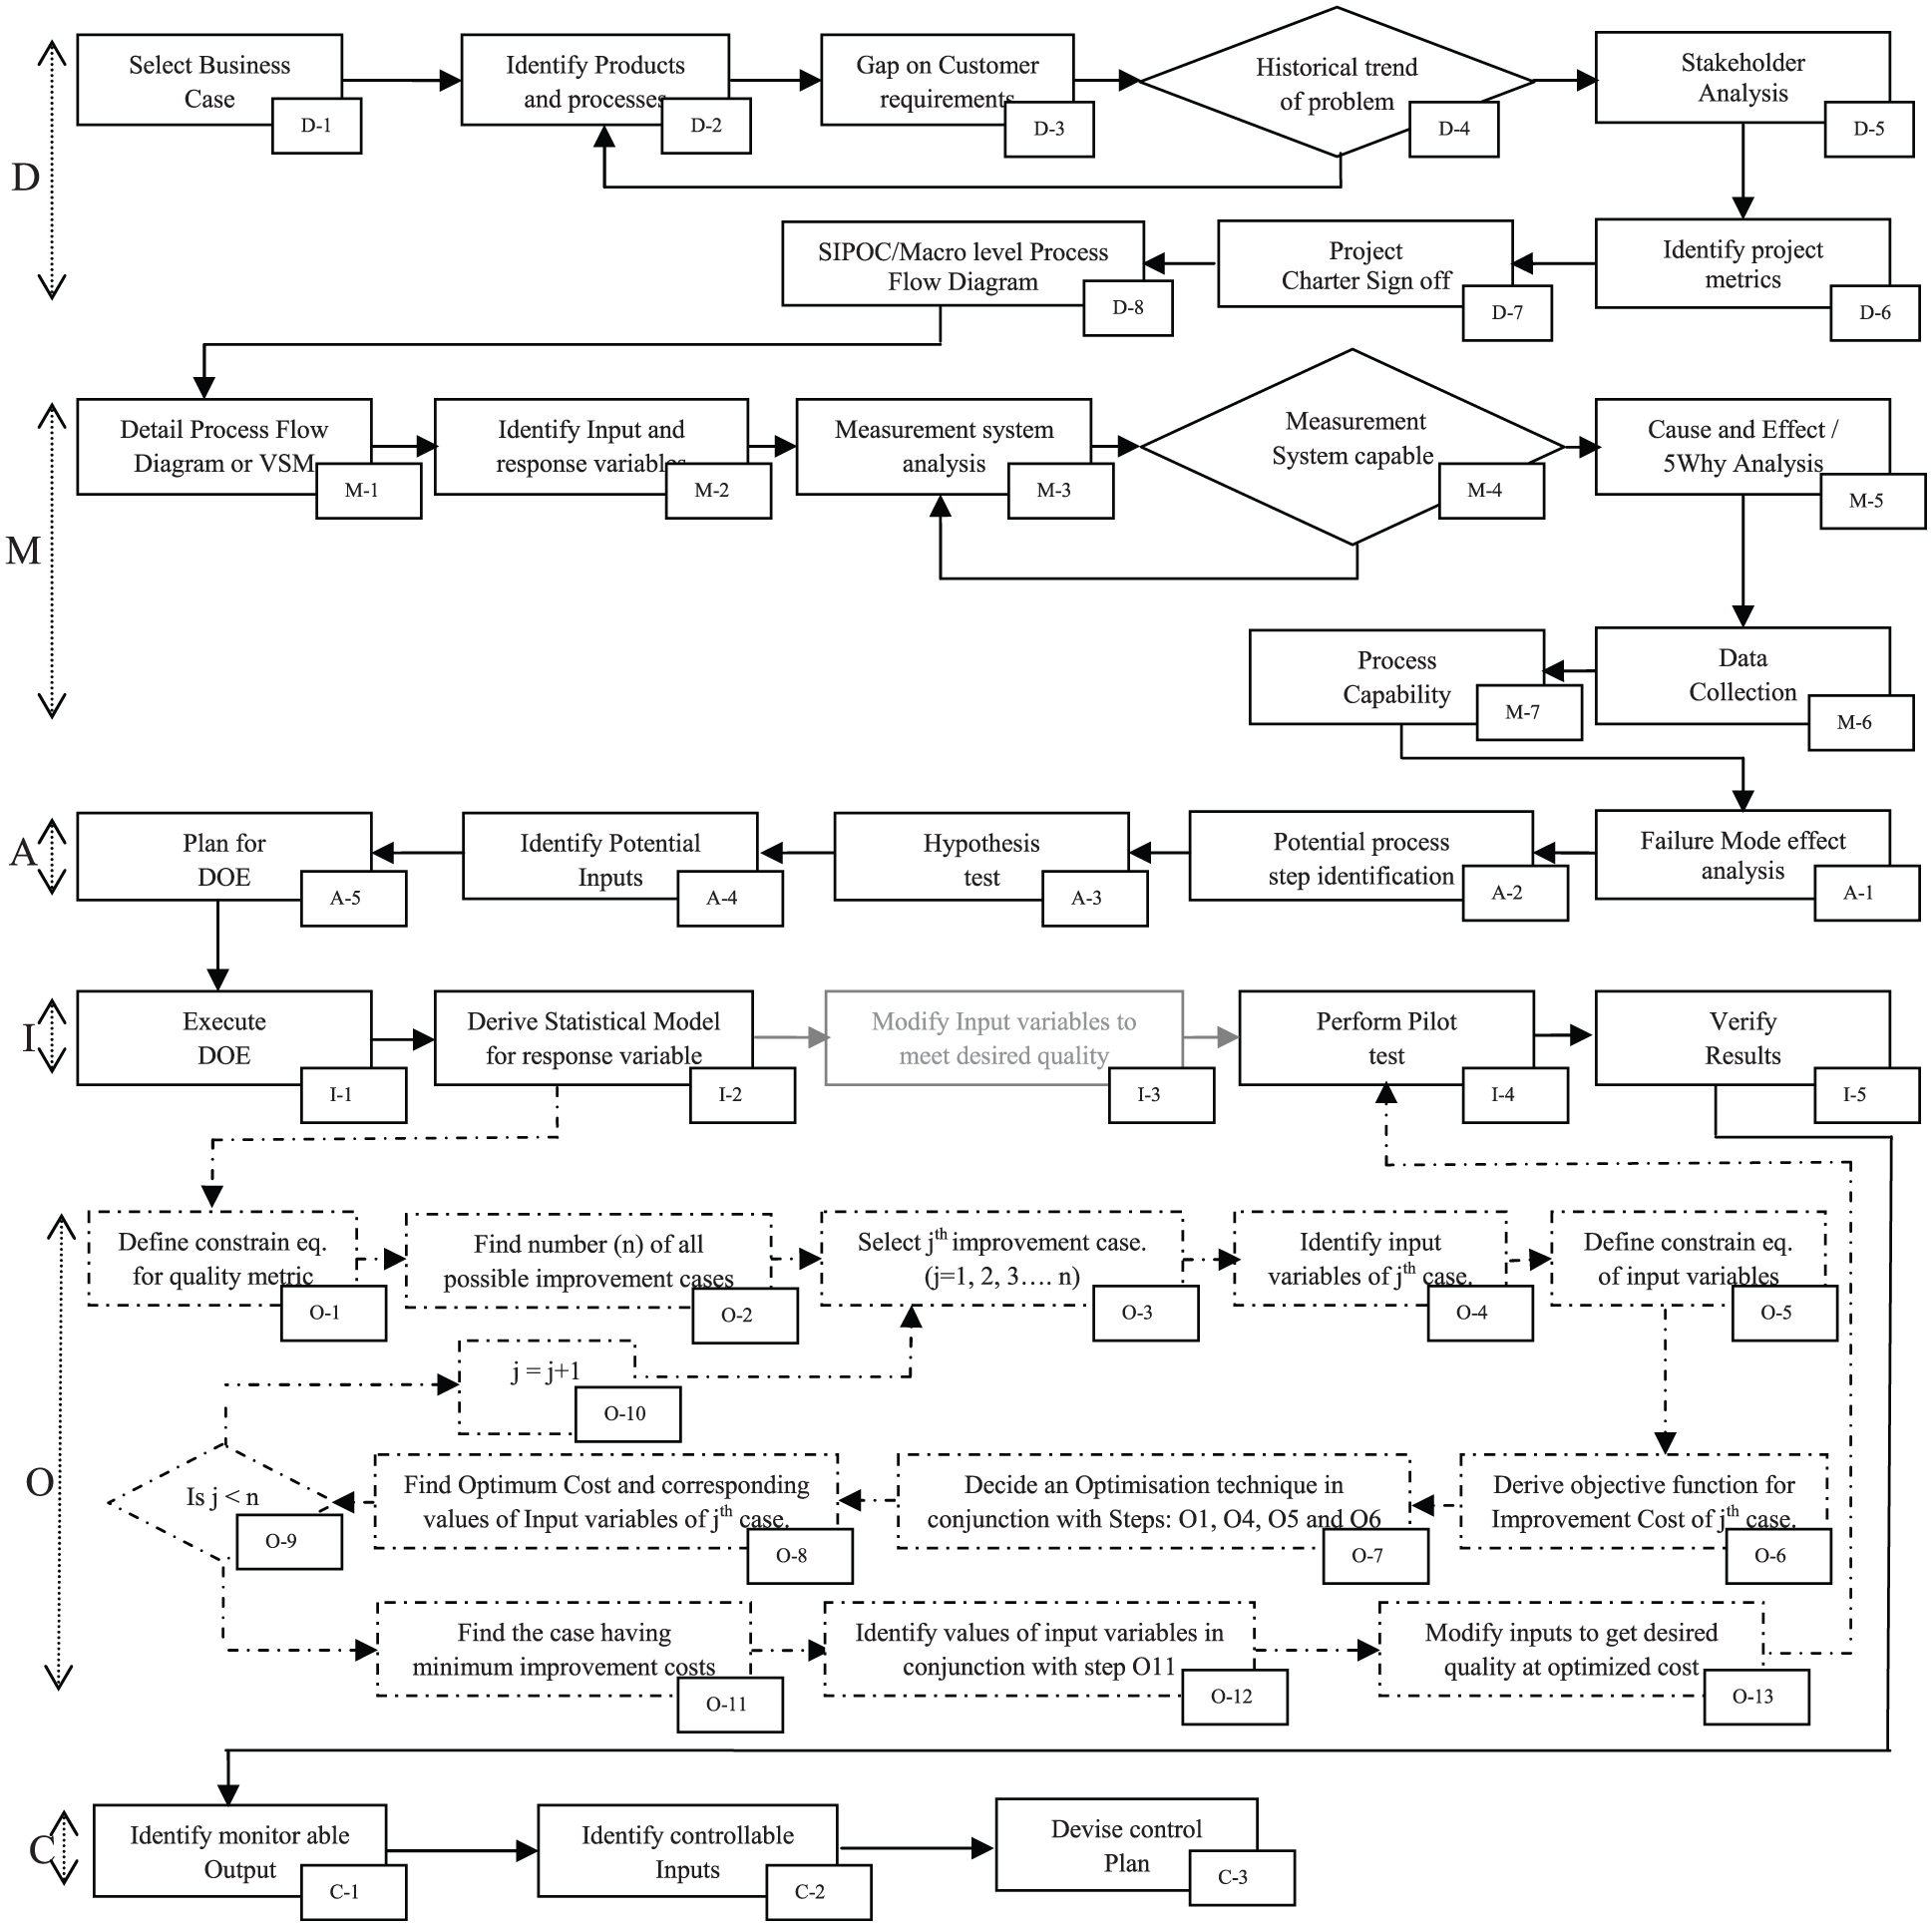
DMAIoC framework for improvement.
Research methodology
‘Optimise phase’ of the proposed DMAIoC framework differentiates it from conventional DMAIC framework. Referring to Figure 1, conventional phases were used to identify a response variable which is proportional to defect rate. Its corresponding input variables were also identified (steps D-1 to M-2). A threshold value for response variable was decided based on historical data, represented by step M-6 of Measure phase. DOE was used to get a statistical model of response variable vis-à-vis input variables, represented by step I-2 of Improve phase. Subsequently, conventional framework goes for a modification of input variables (step I-3). But in the proposed framework, step I-3 is skipped (written in light black font) and Optimise phase starts by defining constrain equation for response variable followed by finding all possible improvement cases. One case is selected at a time which goes through complete cycle of Optimise phase (steps O-3 to O-9). Once all cases are evaluated through this cycle, comparison is done to find out the case which meets quality target and has least of the minimum investment costs.
Workflow of the proposed framework is illustrated by a case study of real-life industrial problem. Experimental data were required at different stages of the workflow. Practical conditions of the industrial problem were simulated by an experimental setup.
Consumers of developing economies are very sensitive on price and quality relation, which greatly provides low cost manufacturer the edge in market. Companies cannot duplicate their successful business models of developed countries to such price-sensitive markets. They need to turn these price-sensitive characteristics to their advantage by offering good quality at low cost. 44 Therefore, in such scenarios, proposed framework can have significant practical implications where cost optimisation is always desirable. DMAIoC can also be used in other researches in solving industrial problems where resources such as time, effort, etc. required to be optimised along with meeting quality target.
Case study
ABC is an MNC operating in a price-sensitive market and engaged in mass production of consumer goods. The problem at hand was about a field quality rejection (FQR) faced by the entire manufacturing unit of the product ‘P’. Figure 2 represents the schematic diagram of the conveyor layout and transportation process for its product ‘P’. Subject matter experts (SMEs) have a list of recommendations but they do not know which one is the best for solving the given problem and keeping the required investment at minimum.
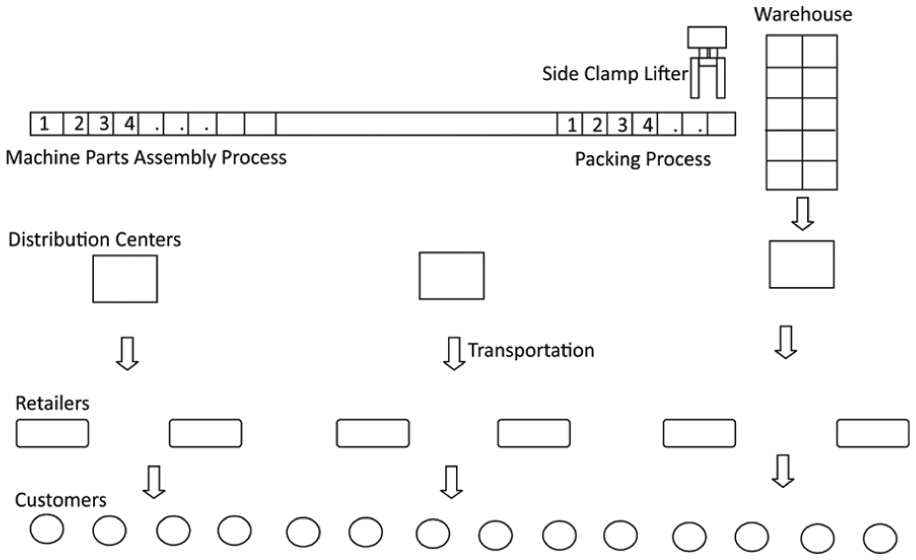
Product P’s conveyer layout and transportation.
This case study seeks to explain how a quality improvement in a business process can be achieved by following a DMAIoC framework at a minimum improvement cost. Its conventional phases were used to find out the root causes to the problem, whereas ‘Optimise phase’ is used to find out minimum improvement cost.
Experimental setup
At different stages of this case study, it was necessary to conduct experiments. Results of experiments are used to analyse impact of input variables on response variable. Data collated through these experiments are also used to derive statistical model for improvement of quality metric and also in formulation of improvement cases. An experimental setup was devised to simulate practical condition. Experiments were conducted at the manufacturing unit of ABC India Pvt. Ltd. A schematic diagram of experimental setup is provided in Figure 3. (actual picture cannot be provided due to confidentiality).
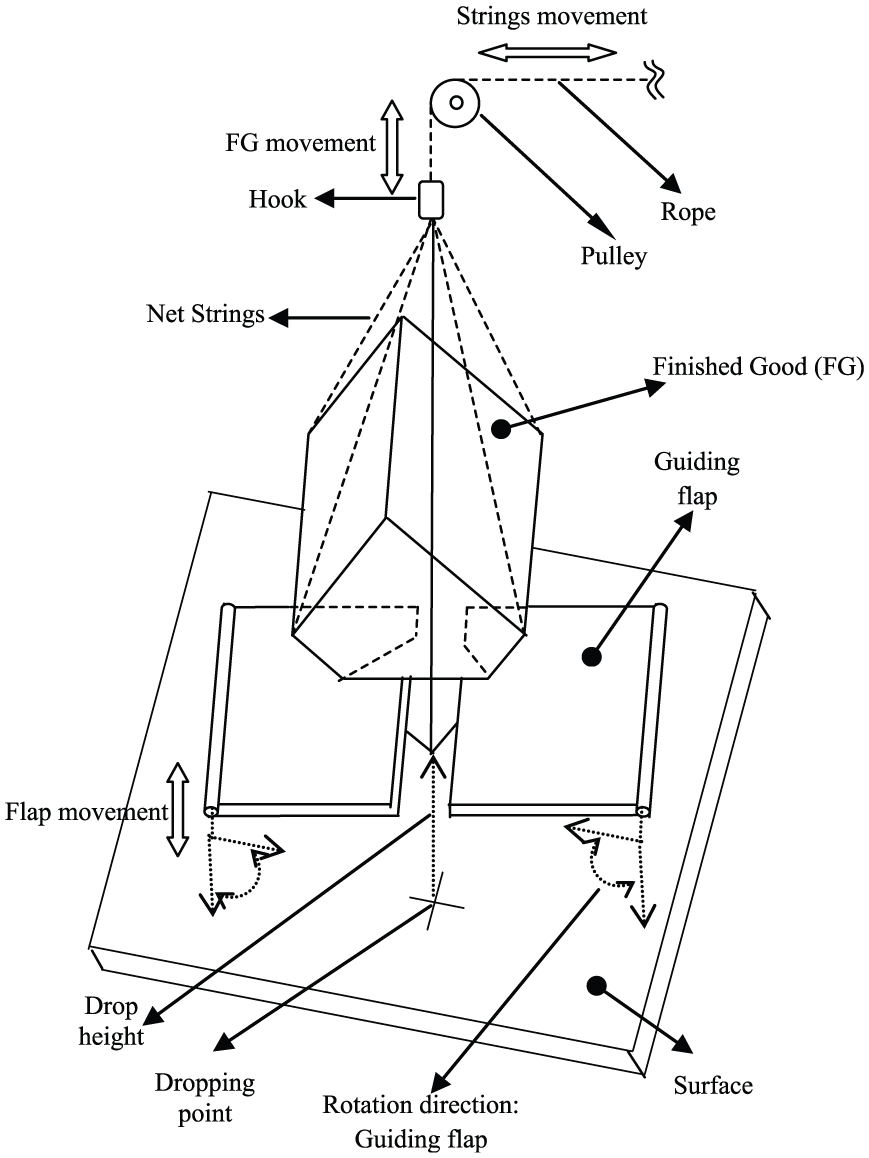
Experimental setup (schematic diagram, not to scale).
Adjustable guiding flaps have groves cut on them to support finished good (FG) in a way that corner 3 is pointed towards the surface. Drop height can be changed by adjusting the vertical height of flaps. FG is kept in hold by the help of Net strings and its vertical movement is controlled by the help of rope and pulley mechanism. At the time of drop guiding flaps rotate (as depicted by rotating direction) and rope is untied simultaneously so that corner 3 of FG hits the surface vertically.
Define phase
Business case: ‘Rejection of product “P” by customers because of defects, as reported by service engineering department, causing a huge revenue loss to the organisation’.
To quote from the field quality report: ‘product P is found to be dented, its rear cover broken and dislocated during transportation’.
History of the reported problem through a time series plot (Figure 4) indicated that the defect rate of product ‘P’ had increased from April to June, an average of 94–17,985 PPM.
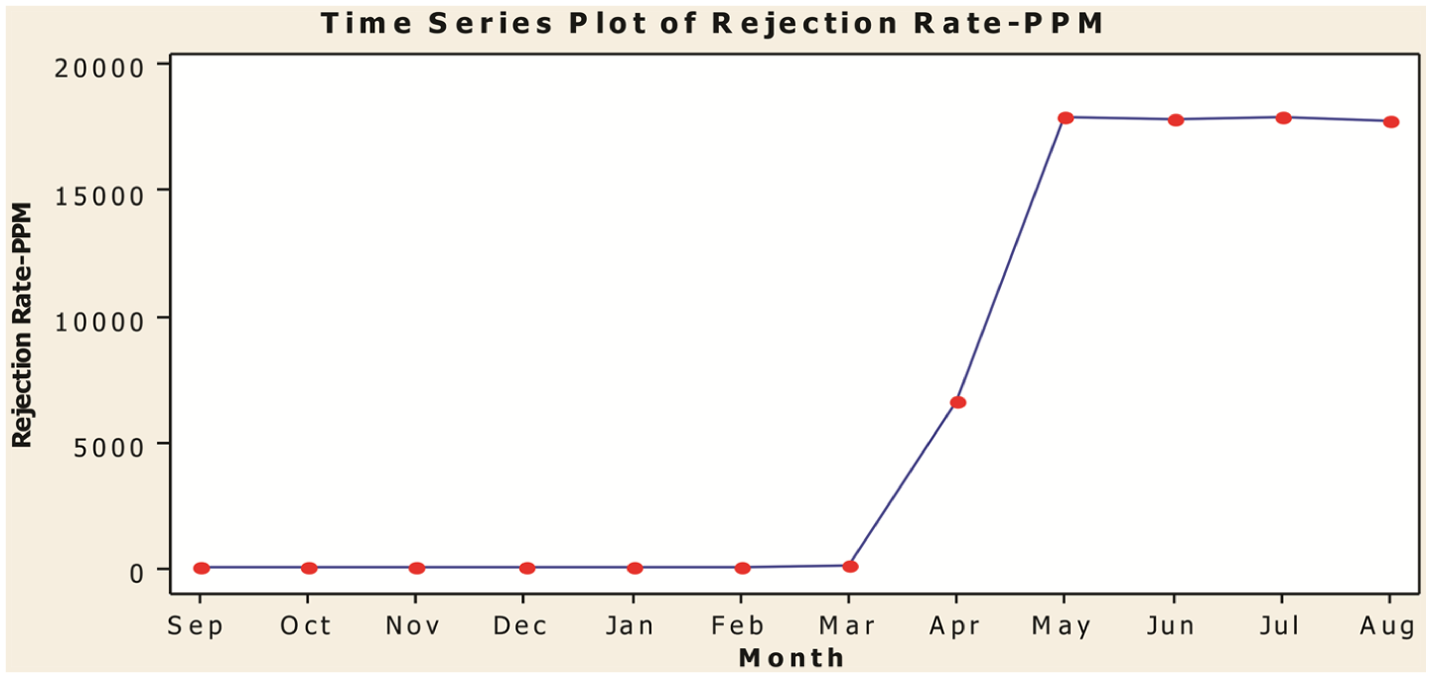
Time series plot of rejection rate.
Brainstorming for possible reasons behind increase in the defect rate during the period revealed that a thinner packing design was implemented in the month of March due to logistical reasons. In the entire transportation process, as presented schematically in Figure 1, a FG is subjected to several stress factors because of the road conditions and manual loading/offloading by untrained labourers. Combination of several parameters of packing designs and machine structure/dimensions makes it possible for the FGs to withstand these kinds of loads. A not-to-scale diagram of product ‘P’ along with an exploded view of packing items is provided in Figure 5.
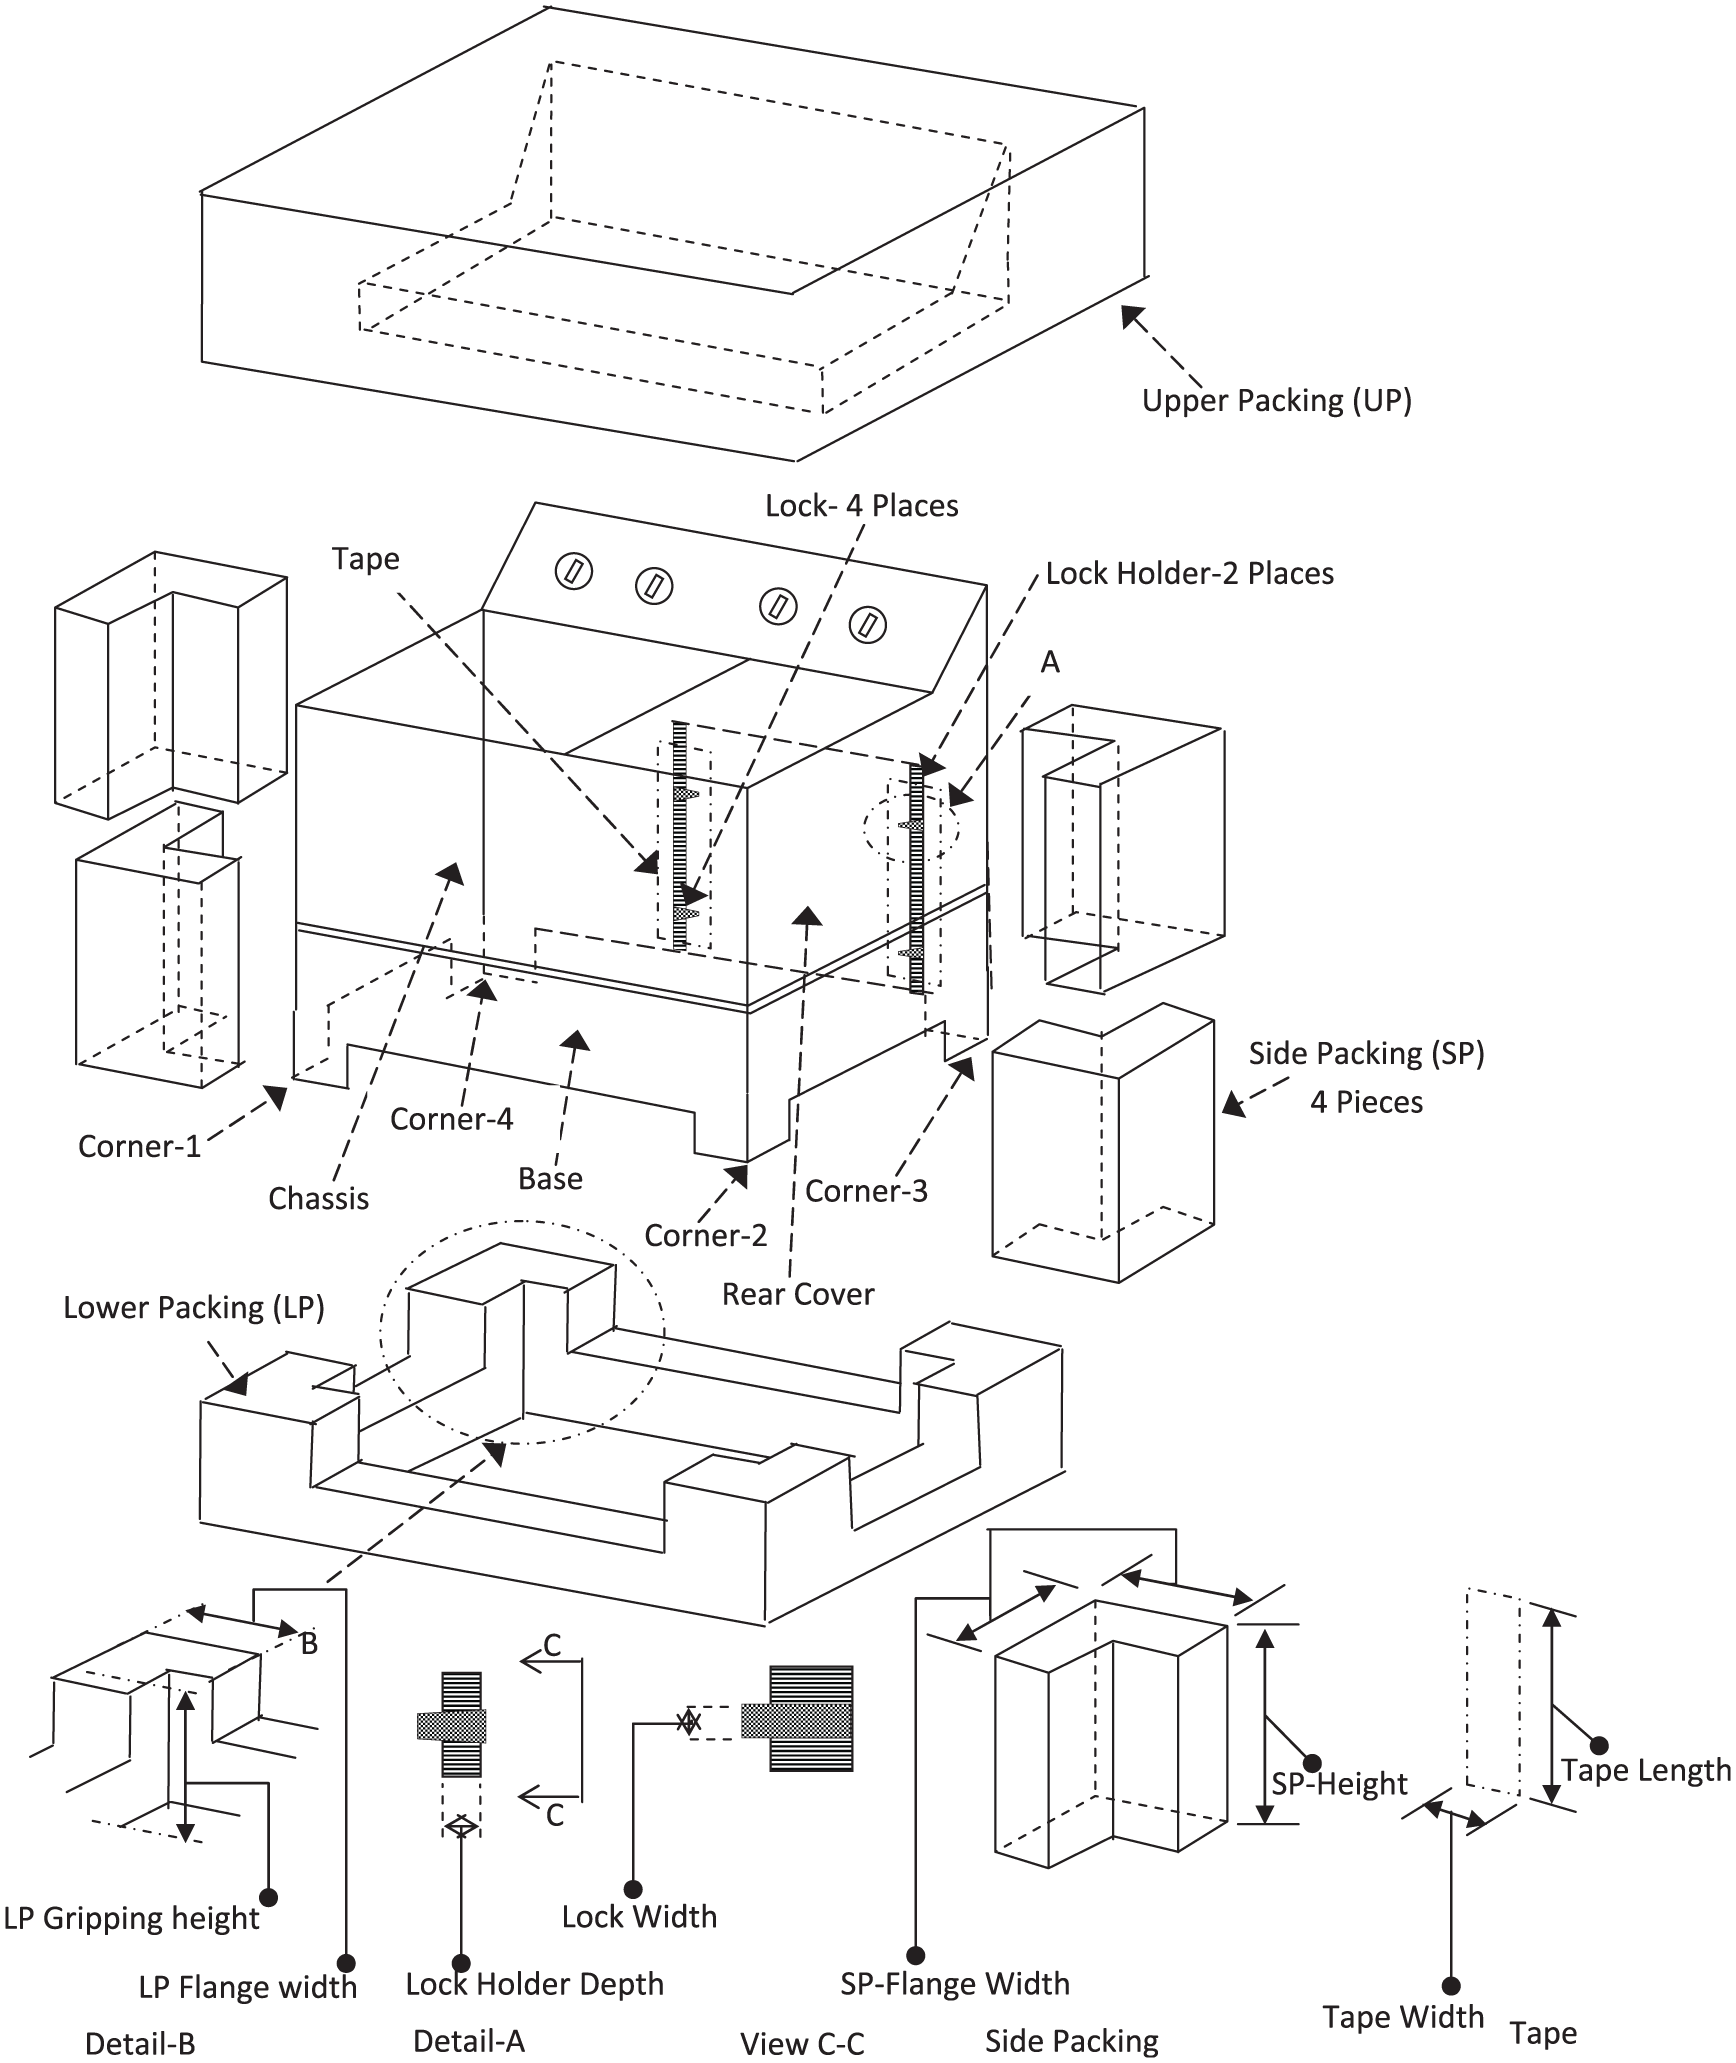
Product ‘P’ and its packaging items exploded view (not to scale).
A macro-level process flow diagram (PFD; Figure 6) was created to identify the downstream and upstream processes from the source (encircled) of the reported defect –‘rear cover dislocation and breakage’.
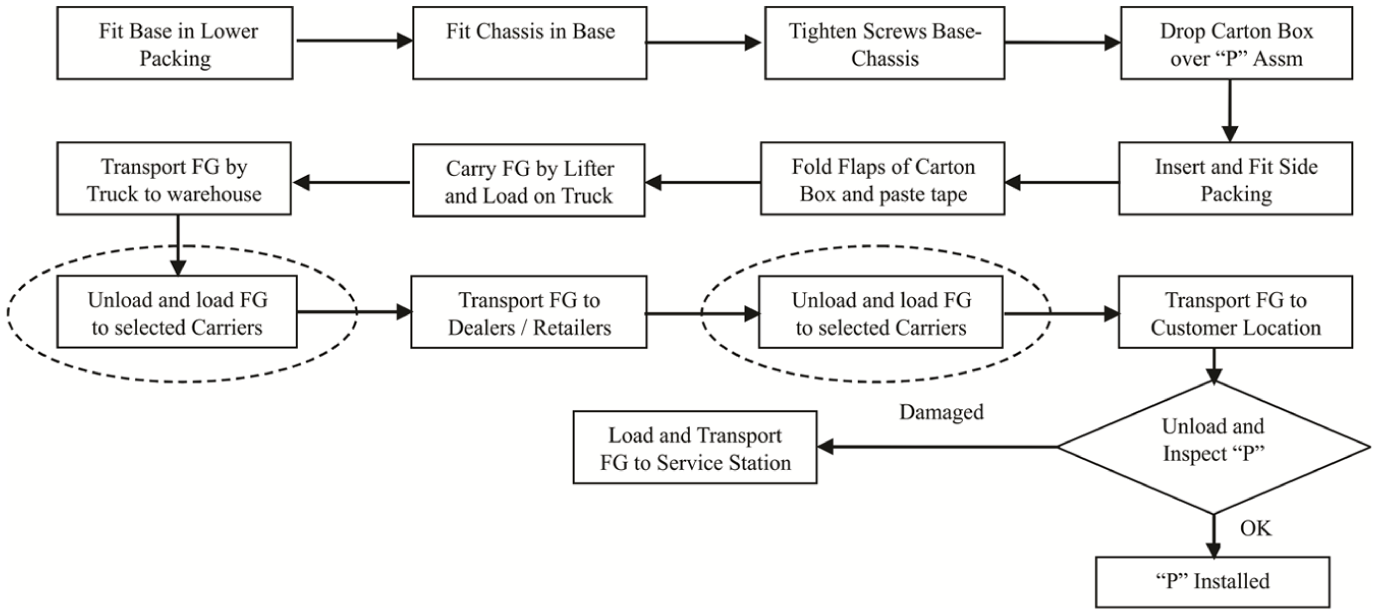
Macro-process flow diagram.
After interacting with experts, it was detected that defect occurs when packaged FGs are dropped by labourers with corner 3 (refer Figure 5) pointing towards the surface. It is difficult to control loading and unloading of thousands of FG. From the above analysis, the practical problem is formulated as, Product P, after being packed, is loaded and off-loaded manually, and dropped several times during transportation till the time it reaches to end customer. Machine gets dented and Rear Cover is dislocated and cracked due to repeated dropping when Corner 3 (of the machine) pointed towards the surface.
Experiments were conducted in the experimental setup (Figure 3) to determine maximum drop height that an FG could sustain in transportation, without occurrence of the defect. Table 1 shows the experimental observations on model variant-wise sustainable drop height (SDH) and field report on defect rate, production quantity and failure cost for ‘actual-last 6 months’, ‘as is forecast for next 12 months’ also ‘post-improvement forecast for next 12 months’.
Base entitlements, forecast and saving estimation.
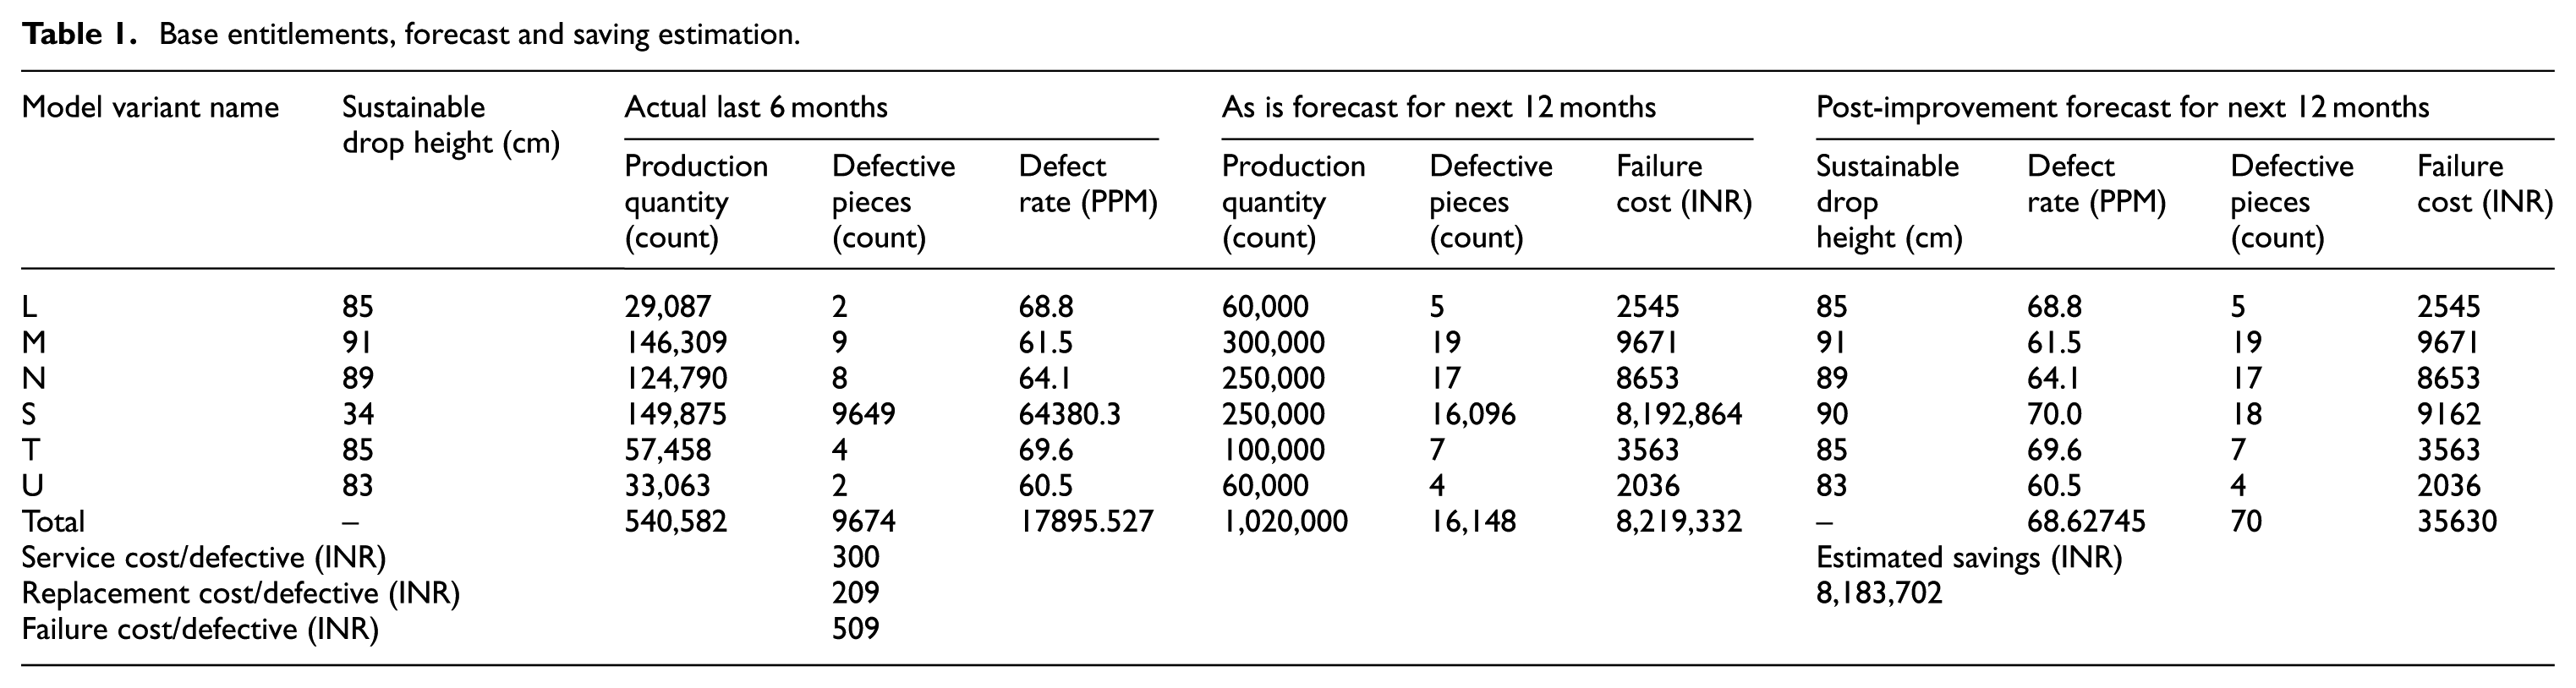
Experimental data reveal that the model variant ‘S’ having the least SDH of 34 mm, while other variants had a SDH of more than 80 mm. The above analysis provided the response variable (which is SDH) and its target for the improvement project. Experimental data and research objective together framed the goal statement.
Goal Statement: ‘Meet quality by increasing SDH of model “S” of product “P” from 34 to 90 mm, at “minimum improvement cost” and, thereby reducing the defect rate of model S from 64,380 to 70 PPM’.
Estimated saving: INR 81, 83,702.
Measure phase
Input variable identification
A PFD (Figure 7) for the upstream assembly process of model ‘S’ was created to identify machine parts, assembly procedure, packaging parts, to find variables having an impact on the SDH. Cause and effect diagram (Figure 8) indicates the variables that might have an impact on SDH. A total of 33 factors were identified through cause and effect diagram.
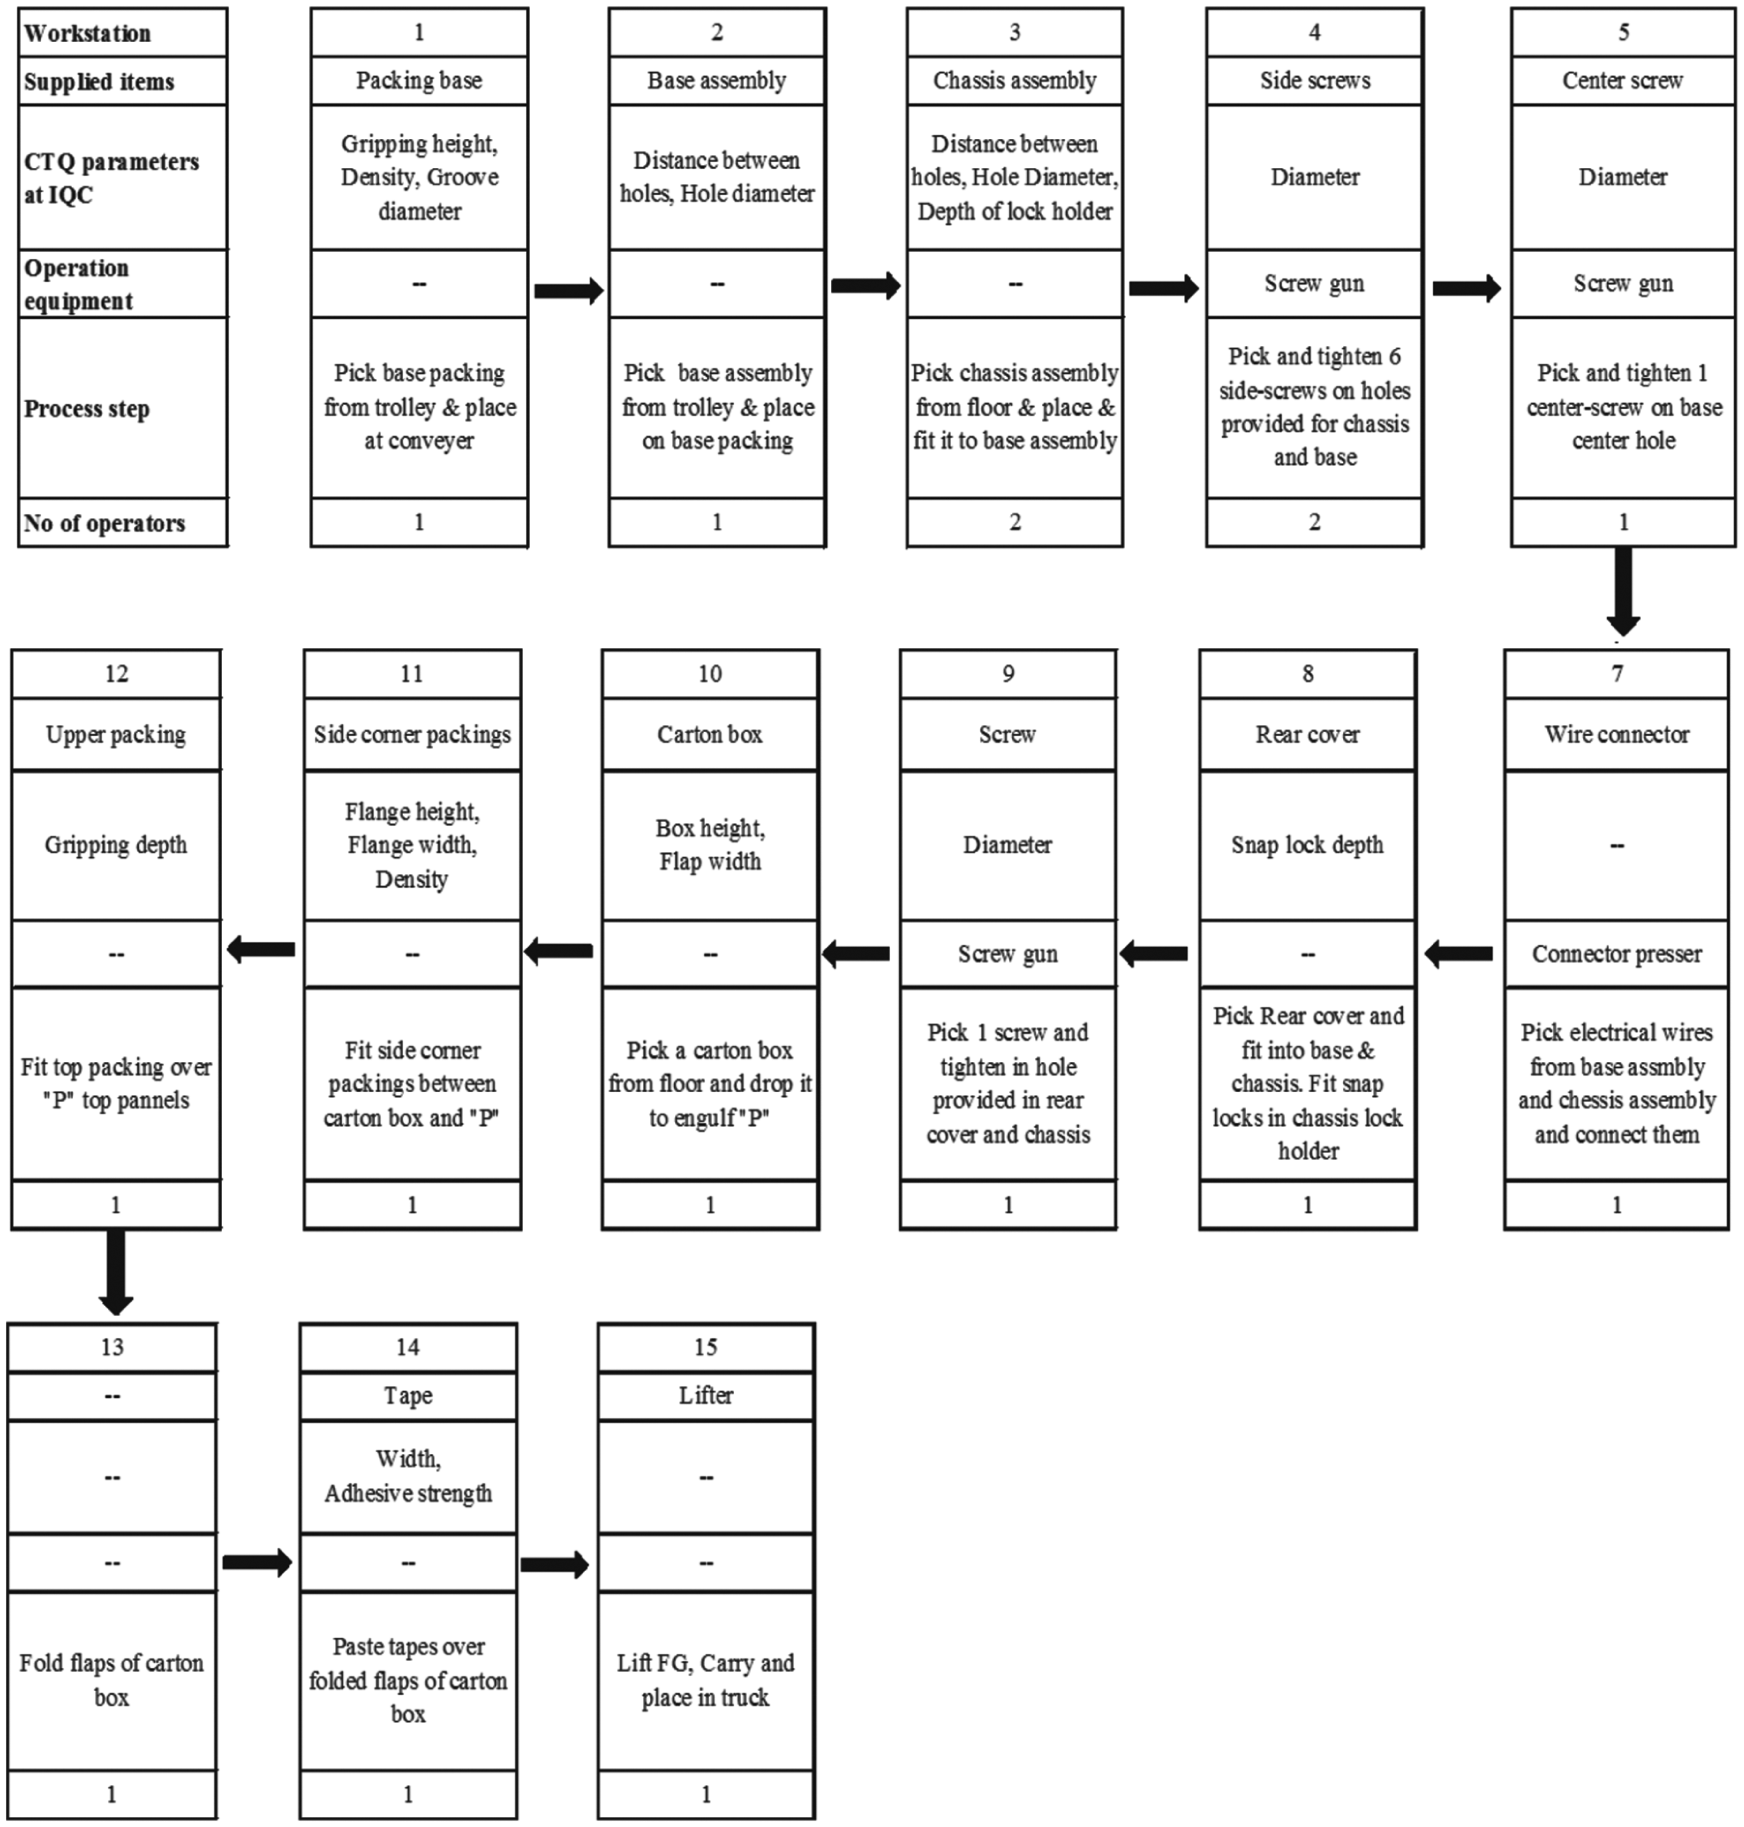
Detail process flow diagram.
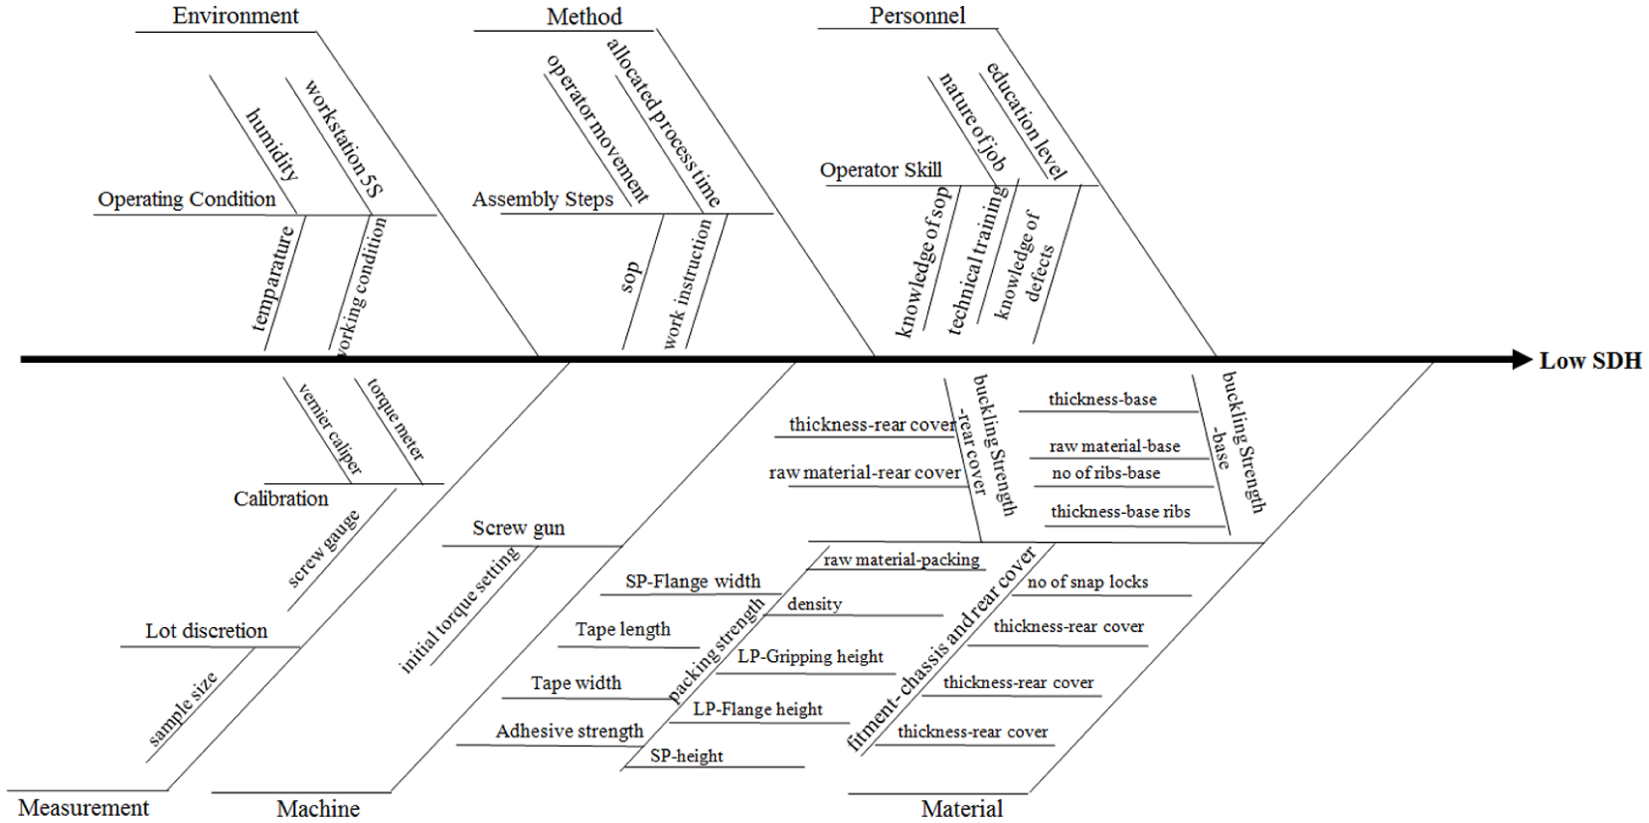
Cause and effect diagram.
A variable feasibility matrix was created (Table 2) to identify the high-weightage variables. Weight of a variable was determined on the basis of three criteria – impact, technical feasibility and economic viability. High weightage variables were identified considering those having weightage more than 400. A transformation function was derived for the response variable (SDH), vis-à-vis high weightage independent variables. The description of variables is provided in Appendix 1

Factor feasibility matrix.
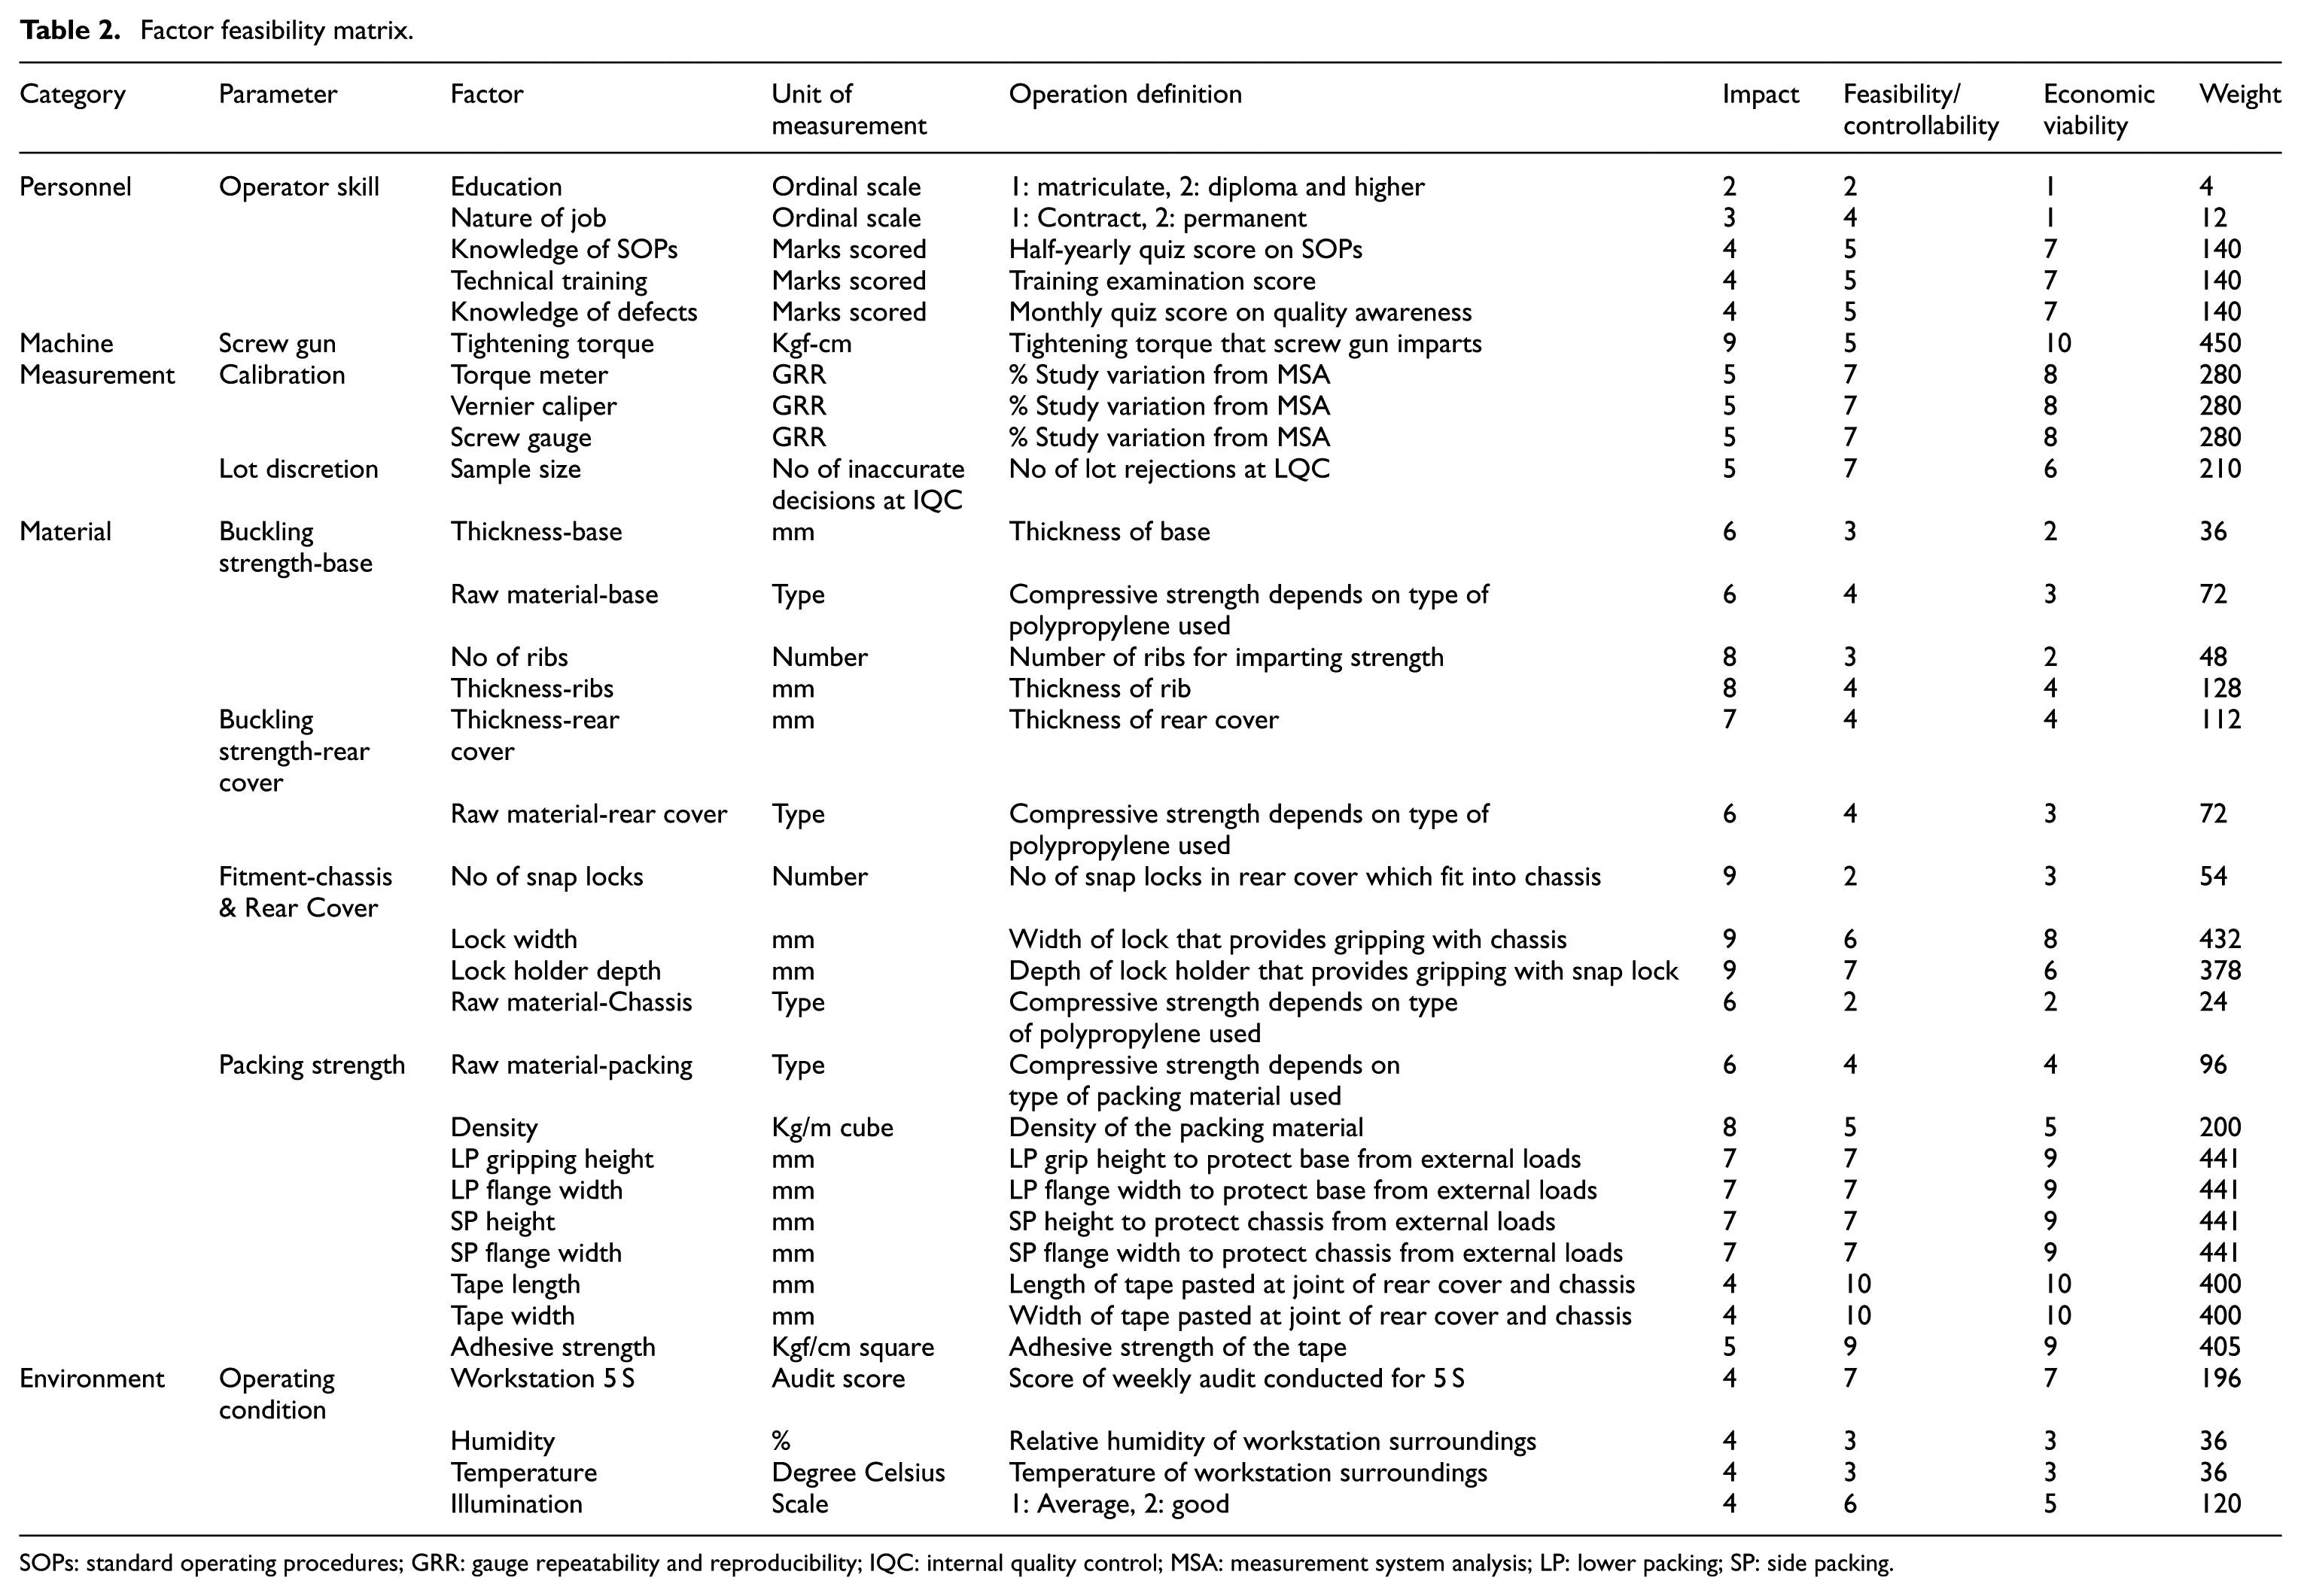
SOPs: standard operating procedures; GRR: gauge repeatability and reproducibility; IQC: internal quality control; MSA: measurement system analysis; LP: lower packing; SP: side packing.
Performance base lining
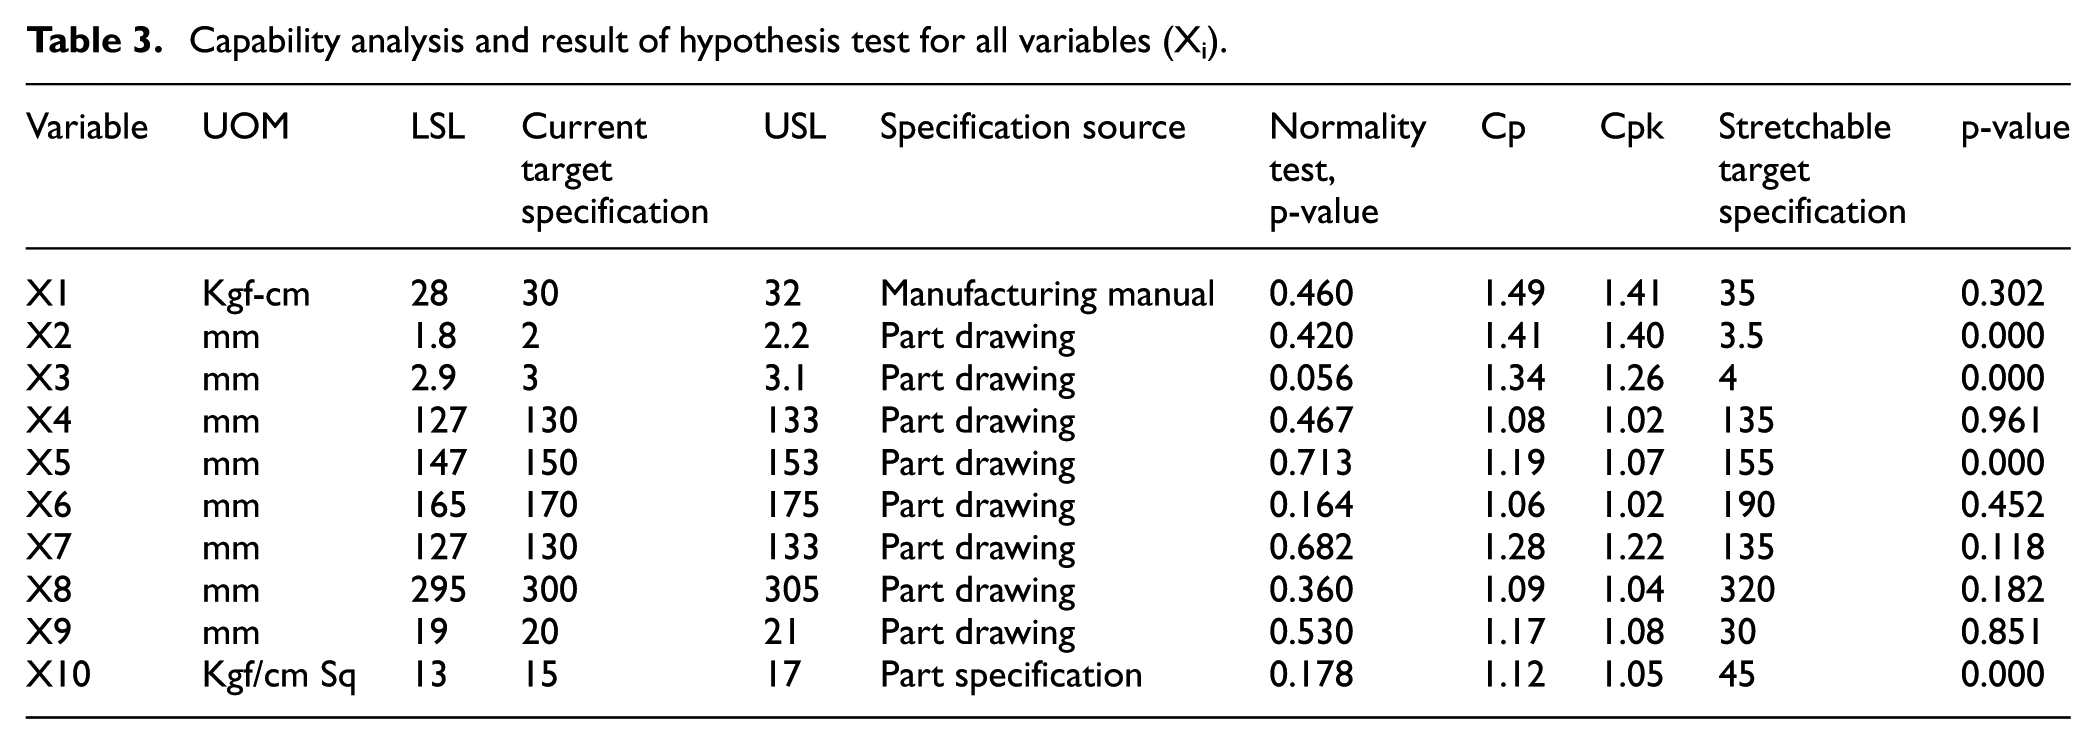
Capability analysis for all Xi was done using MINITAB 45 to find out whether any Xi did not meet the design specifications. Figure 9 shows the sample calculation of Cp, Cpk (process capability indices) for Xi = X1 (tightening torque) for 30 randomly selected units. Specification limit of 30 ± 2 Kgf-cm was taken from the manufacturing manual. Torque distribution data were found normal through a normality test as shown in Figure 9(a). p-Value for Anderson Darling normality test was found to be 0.46, which was more than 0.05. Cp and Cpk given in Figure 9(b) are more than 1 indicating that the process was capable of meeting specification limits. Table 3 summarises Cp and Cpk values for all Xi.
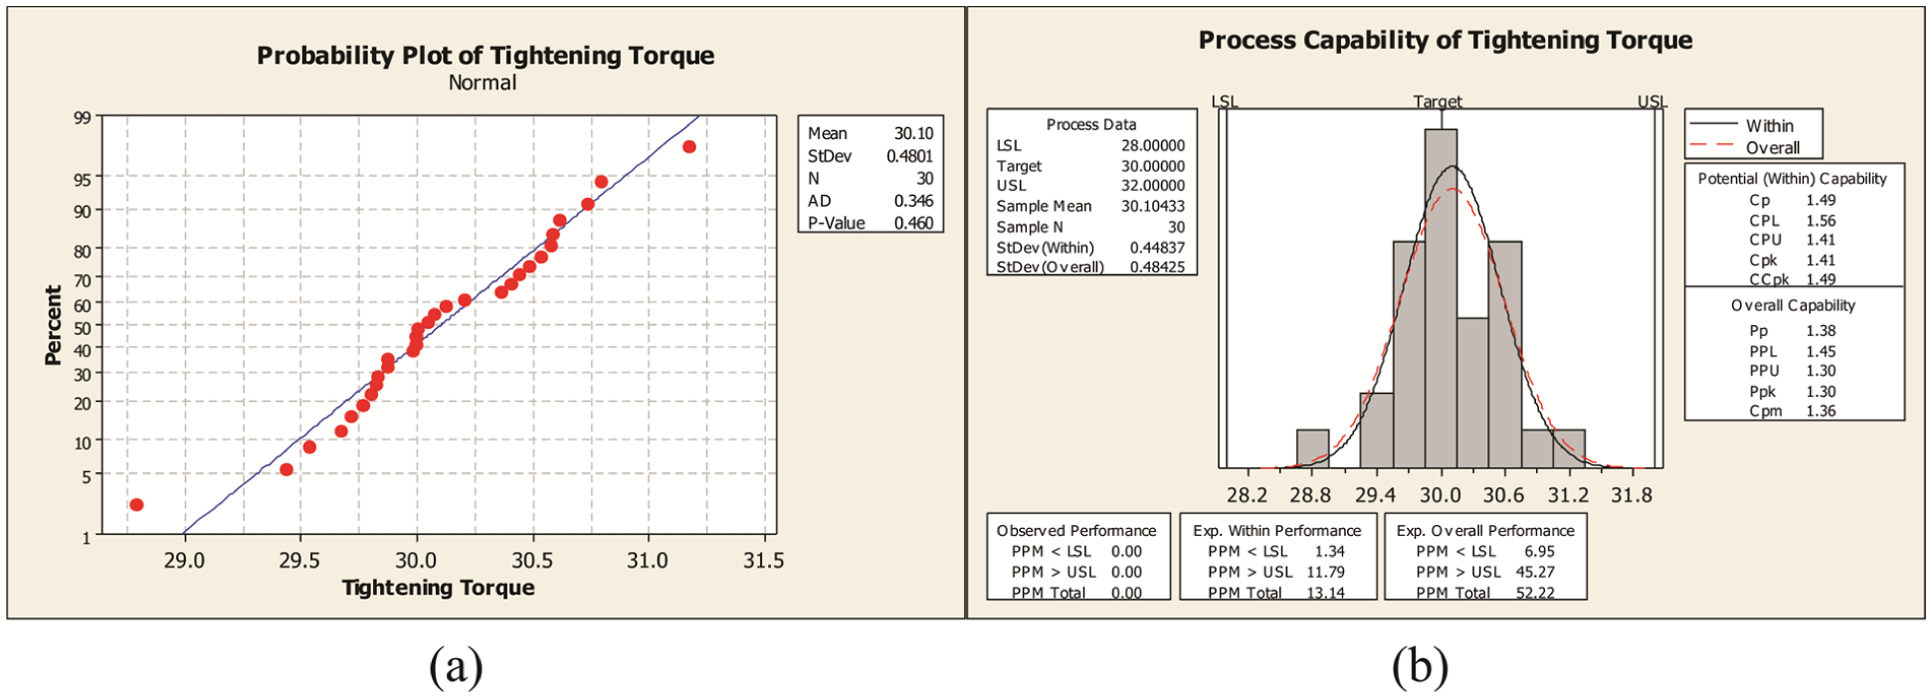
(a) Probability plot and (b) process capability.
Capability analysis and result of hypothesis test for all variables (Xi).
Analyse phase
Cp and Cpk values of all Xi are more than 1, suggesting that the current process is capable of meeting the specification limits. Therefore, it concludes that to increase value of the response variable, some or all Xi have to be altered. Every input variable can be modified only to an extent as there are technical constraints involved. For example, tightening torque could be increased, but only till the shear strength of the chassis material would allow. Table 3 provides current value and extendable limits for all Xi.
Potential variable identification
Experiments were conducted in the experimental setup (Figure 3) to get the data for improvement in the response variable (SDH) by changing value of one input variable at a time from its current value to its extendable limit, keeping all other input variables at current level.
Hypothesis tests were performed and corresponding p-values were used to evaluate the significance of the observed improvement in SDH. Sample size of experiments was decided so as to keep the power of the test minimum at 90% for a minimum detectable mean level difference of 5 mm. MINITAB 45 was used to get the requisite sample size. Graphic summary and control chart of historical data were provided in Figure 10(a) and (b). Sample size calculation for the required power is given in Table 4.
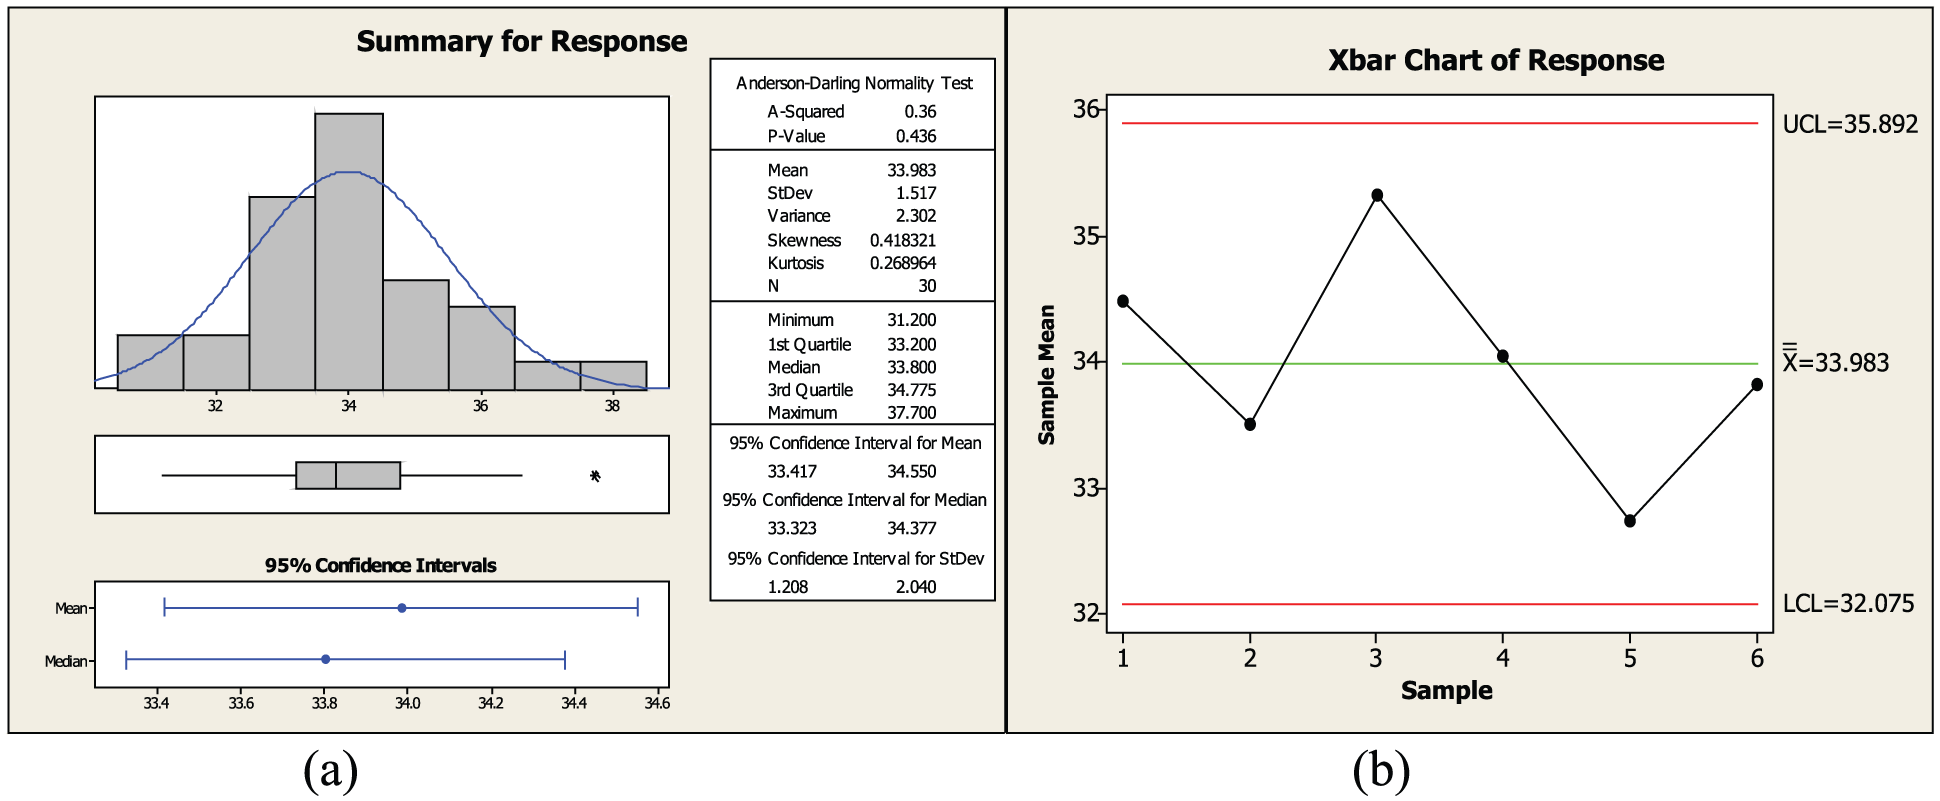
(a) Summary of historical data and (b) control chart of historical data.
Sample size evaluation (two-sample t-test) (the sample size is for each group).
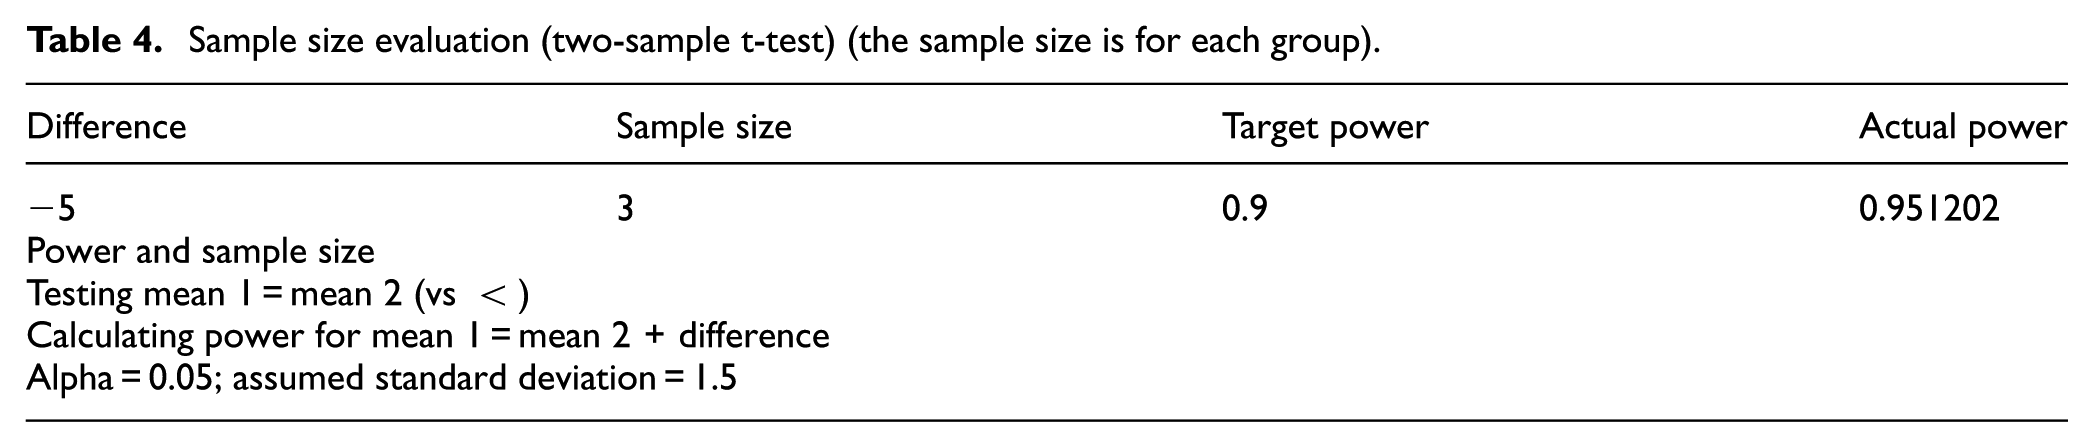
Inference from Table 4 is that a sample size of 3 at each level is required to get a target power of the test more than 90%. Experiments were conducted to find out SDH for a sample size of 3 at each level. Levels were decided as per the current and extendable limits. Table 3 provides the summary result of the experiments for all high weightage input variables. In these experiments, variables with p-value less than 0.05 were identified as potential variables. They are X2, lock width; X3, lock holder depth; X5, LP gripping height; X10, tape adhesive strength.
Improve phase
Experimental setup depicted by Figure 3 is again used to carry out controlled experiments through DOE. The purpose was to find out quantum of modification of every potential input variable required for getting value of SDH to be more than 90 mm. A two-level full factorial design was opted for the experiment. Having four variables and two levels, a total 16 runs were required. Levels of all the variables were decided as per current and extendable limits, provided in Table 3. This was done after giving due consideration to constraints of part design, product design, changeability in tool and die, supply availability and production line. The response data were collected as per treatment combinations. Table 5 provides the Standard Order and Run Order of treatment combinations and corresponding response data. Treatment combinations were executed according to the Standard Order.
Treatment combination.
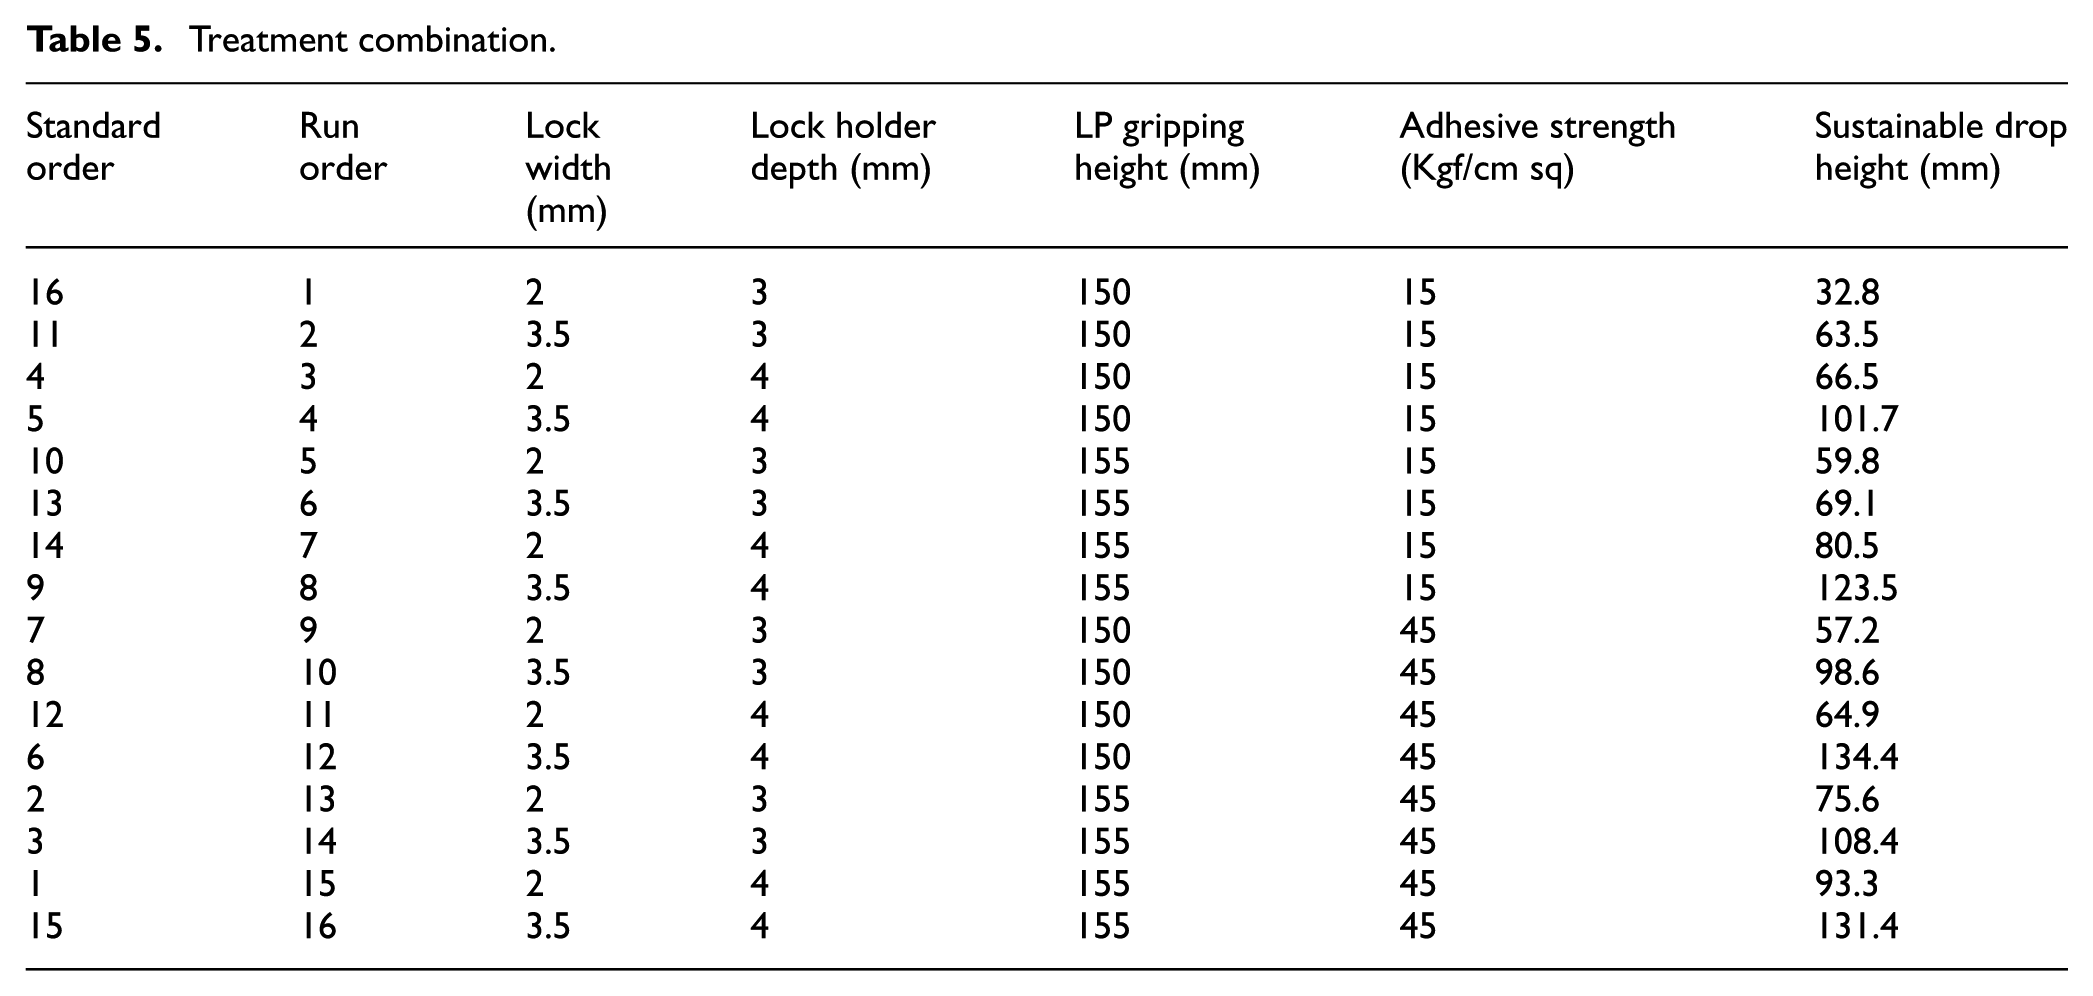
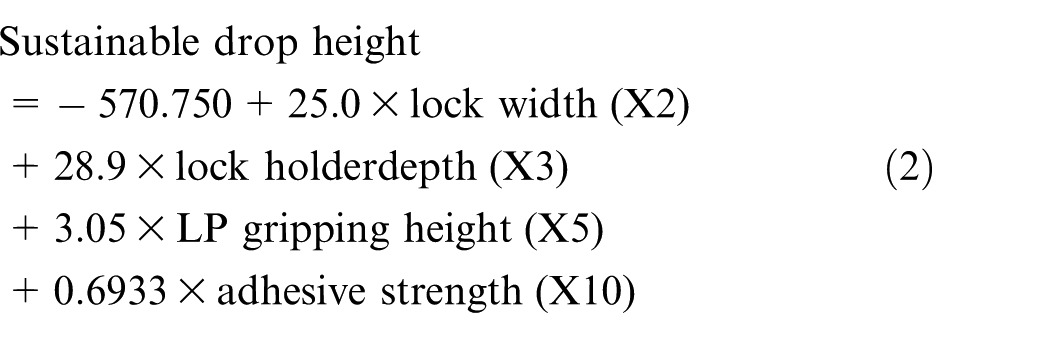
p-Values of main effects and interaction effects were considered to determine which of the effects were significant. In Figure 11(a), Pareto chart of the standardised effects for the final iteration indicates that only the main effects of factors are significant and no two-way or three-way interaction has any significance. Analysis of the result of the DOE which includes p-values of effects and their coefficients for coded units and un-coded units is given in Table 6. The statistical model has p-values of individual factors less than 0.05, R2 more than 90%, p-Value of main effects in analysis of variance (ANOVA) is less than 0.05. In Figure 11(b), no trend could be observed in the residual versus the fitted values. Observation order of residuals also did not indicate any time dependency, and in Figure 11(c), the probability plot of residual data was also found to be normal. Based on the above observations, the suggested model was accepted for fine-tuning of the factors and written down using the coefficients of un-coded units
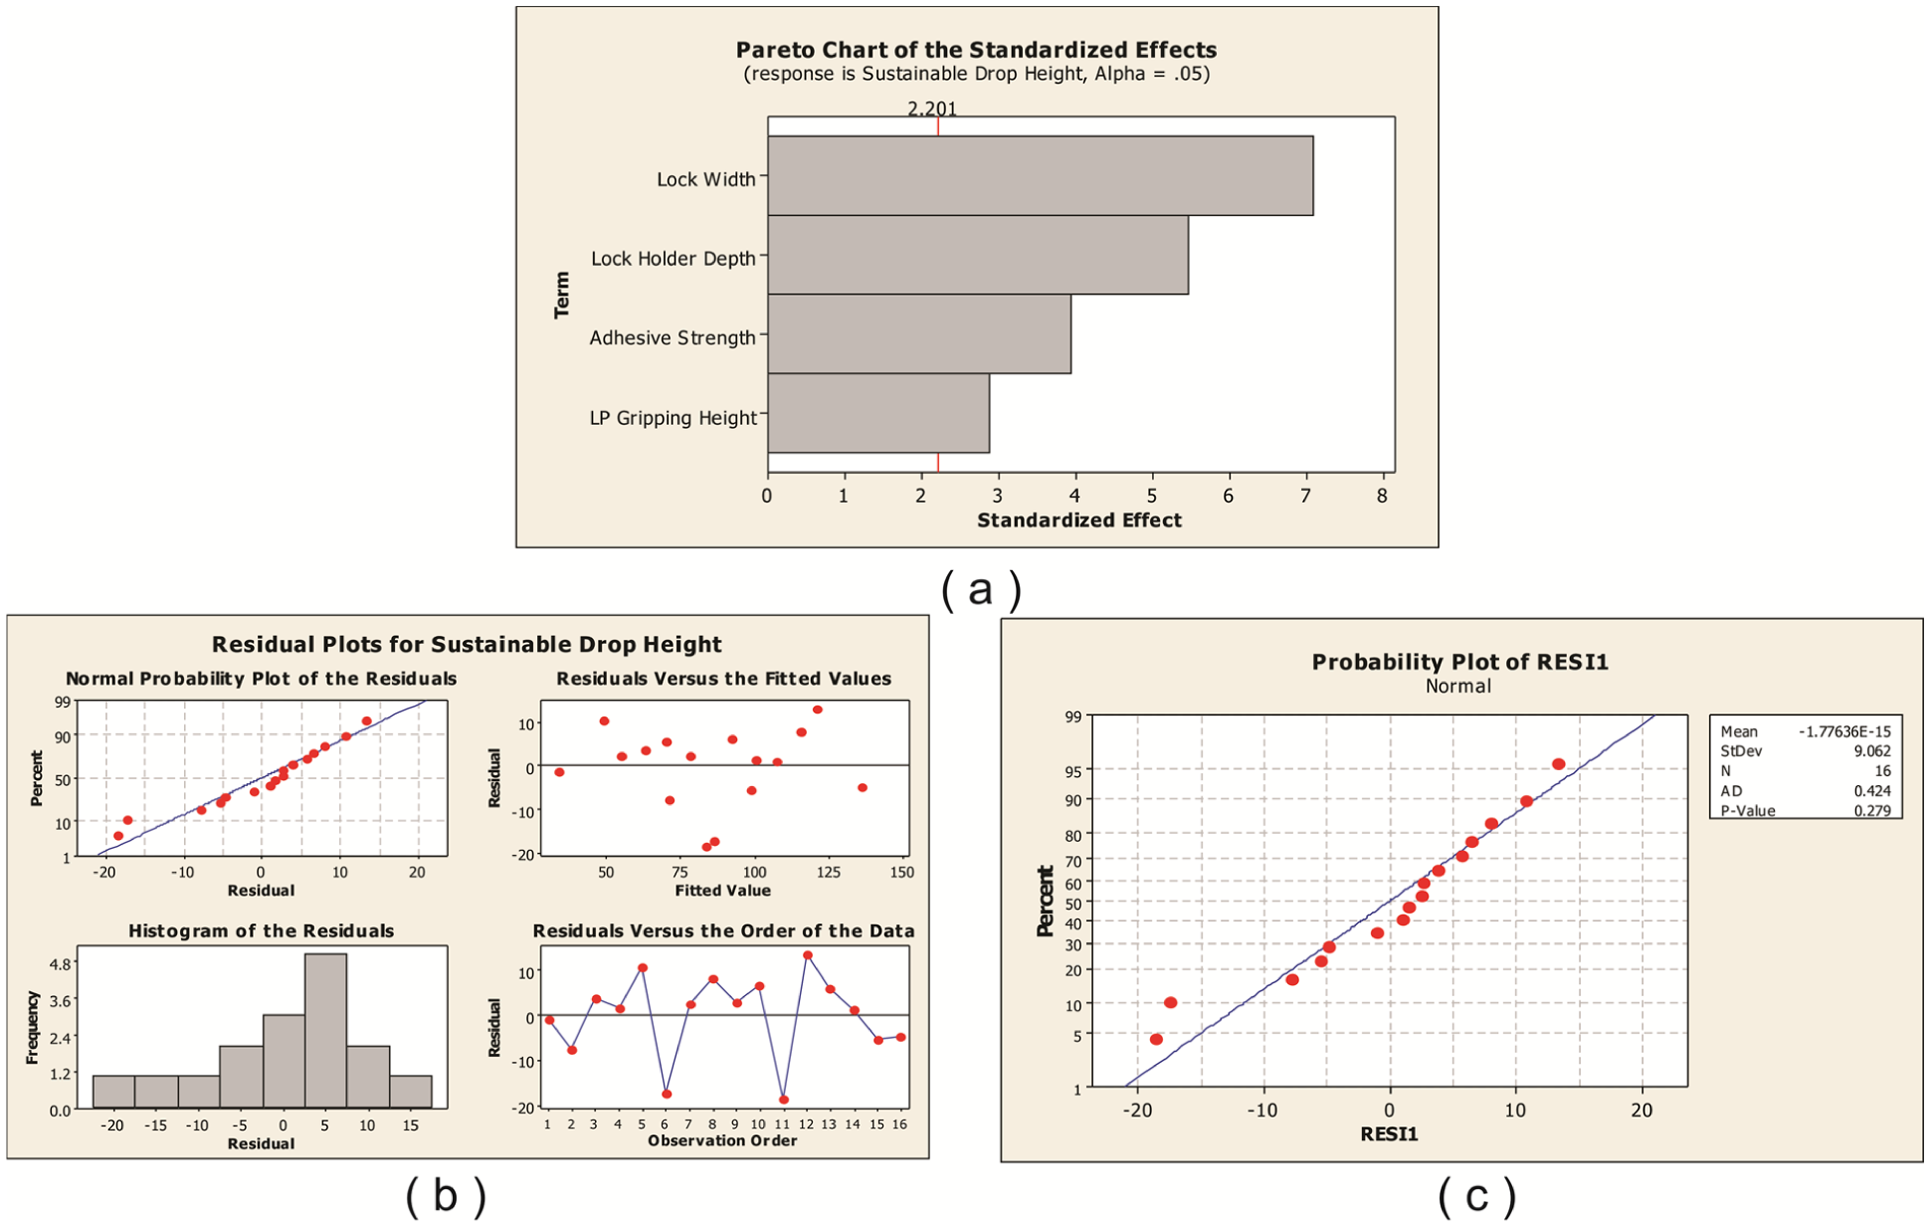
(a) Pareto chart of standardised effects, (b) residual plot for response variable and (c) probability plot for residuals.
Analysis result of DOE.
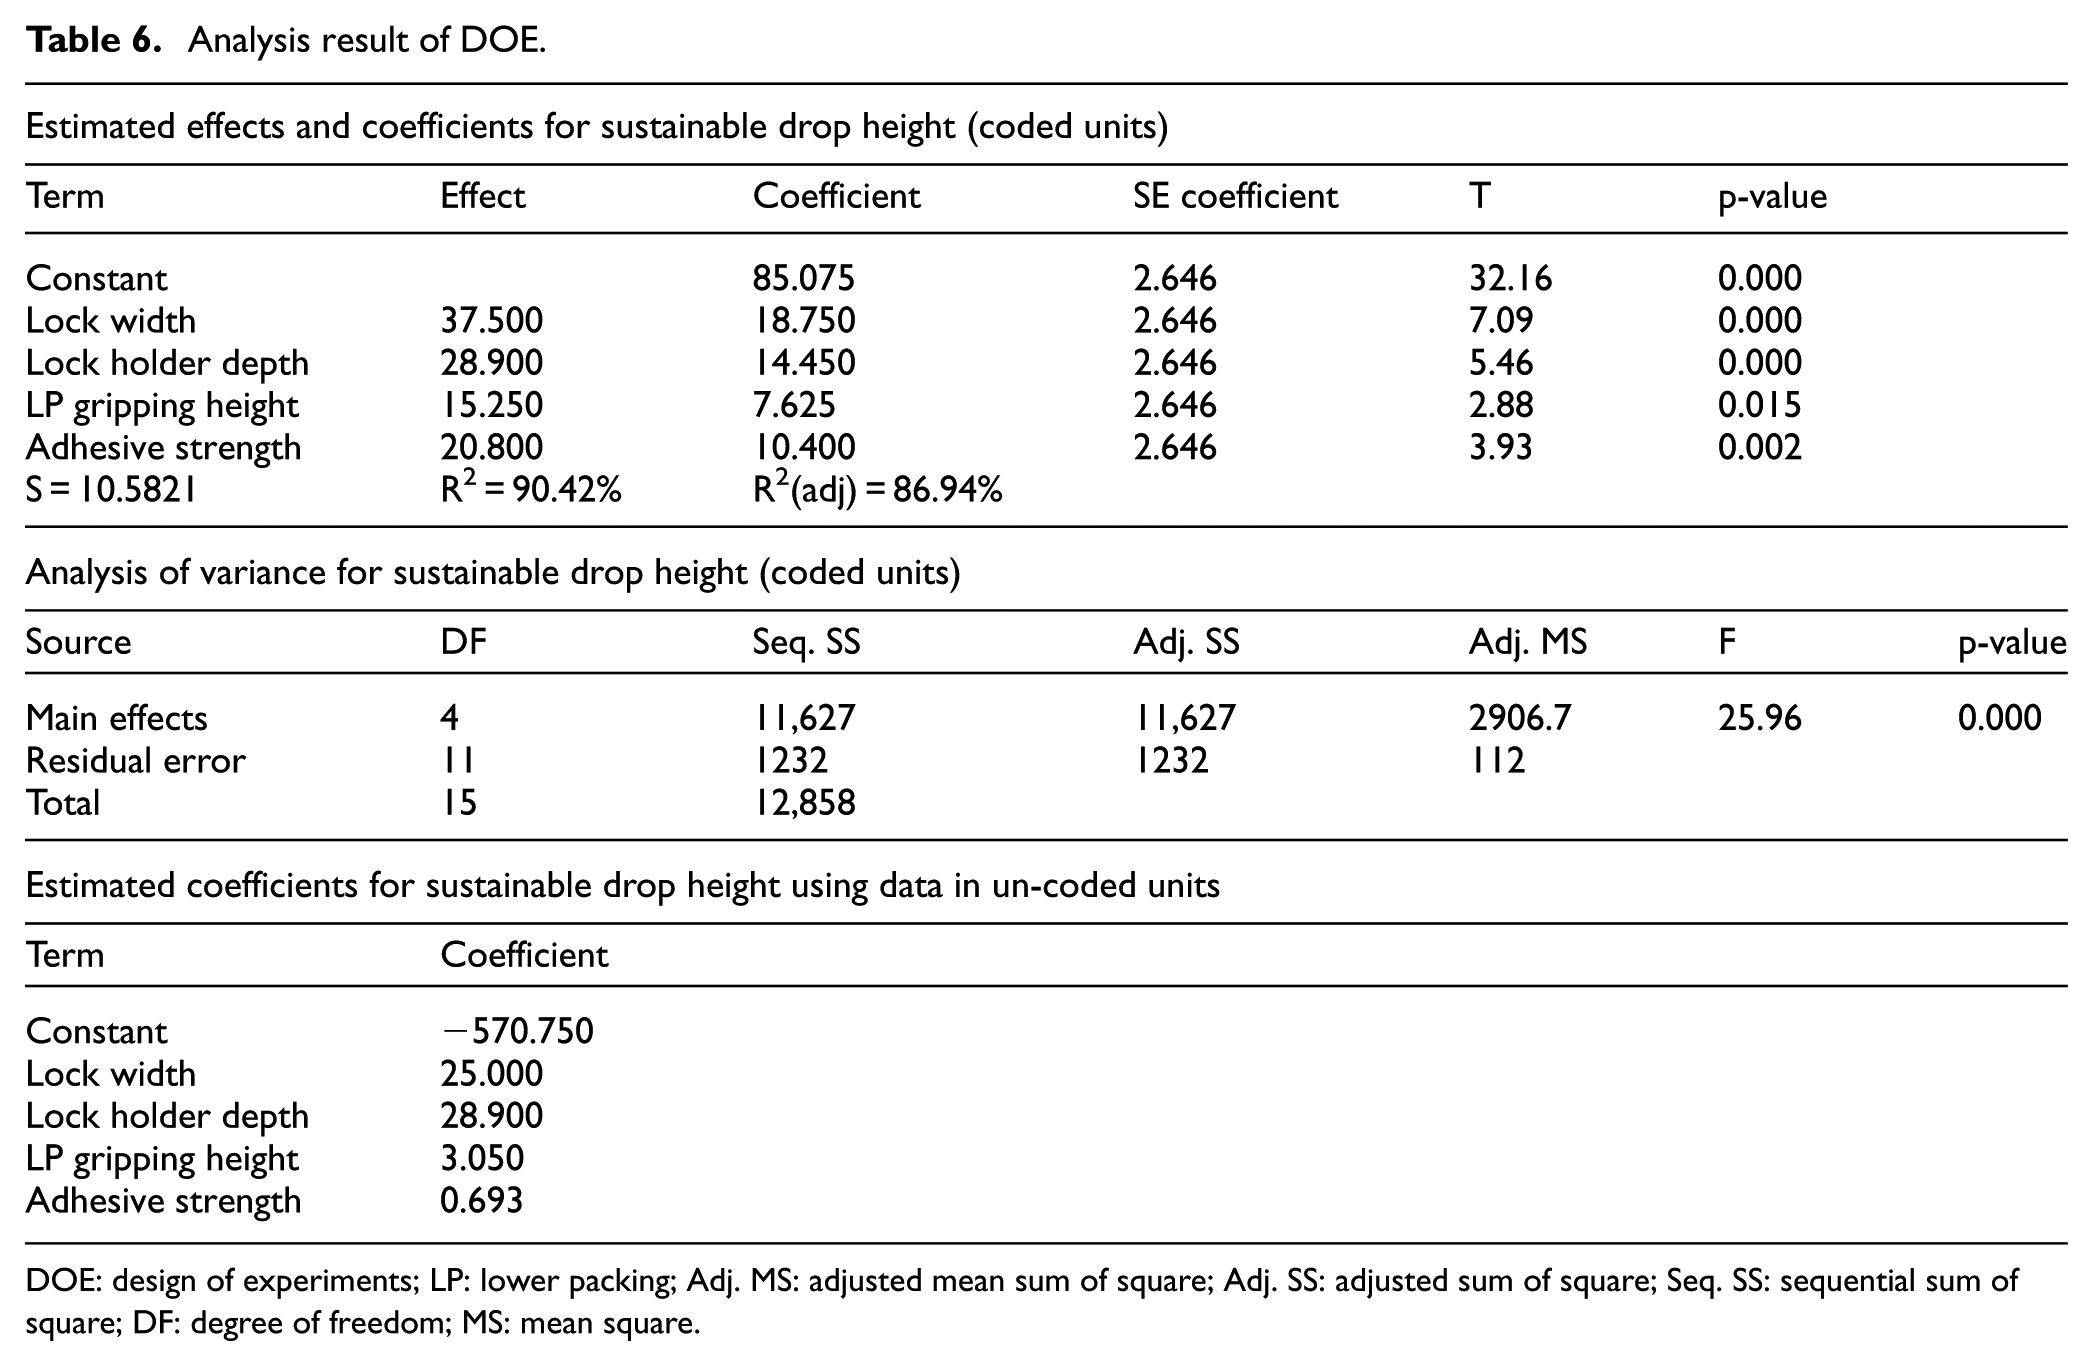
DOE: design of experiments; LP: lower packing; Adj. MS: adjusted mean sum of square; Adj. SS: adjusted sum of square; Seq. SS: sequential sum of square; DF: degree of freedom; MS: mean square.
Optimise phase
In the workflow of DMAIoC (Figure 1), conventional phases are used till the statistical model for response variable is developed in step I-2. Subsequently, DMAIC framework would have gone for modification of input variables (step I-3). But in the proposed framework, step I-3 is skipped (written in light black font) and Optimise phase starts, as elaborated below:
Step O-1. Statistical model of response variable from step I-2 is used to derive a constrain equation to ensure that quality target is met.
Step O-2. All possible improvement cases are enlisted and are sequenced as 1, 2, …, n. where n is total number of cases.
Step O-3. Out of n possible cases, jth case is selected for subsequent analysis, starting from j = 1.
Step O-4. Input variables related to the jth case are identified their extendable limits based on technical constrains are obtained.
Step O-5. Technical constrains are formulated as mathematical constrains.
Step O-6. Objective function for cost minimisation is formulated at this step. Cost of improvement has two components – fixed cost and variable cost/unit. Table 7 provides the modification cost for variables. Based on this, cost minimisation problem was formulated. Description of the variables used in formulating the problem and variable modifiability is provided in Appendix 1.
Step O-7. An optimisation technique is decided based on all constrains and objective function for optimisation. In this case study, ‘simplex method’ has been used.
Step O-8. Optimisation algorithm is applied to objective function to find out minimum cost for jth case.
Step O-9. Check if improvement case sequence analysed is less than ‘n’.
Step O-10. Select the next case and repeat steps from O-4 to O-8.
Step O-11. Compare to find out the case having least of the minimum cost of improvement. Figure 12 provides the comparison of costs required for feasible cases.
Step O-12. Identify values of input variables for the case identified in previous step to get the quantum of modification.
Step O-13. Modify input variables as per quantum of modification found in previous step.
Modification cost.
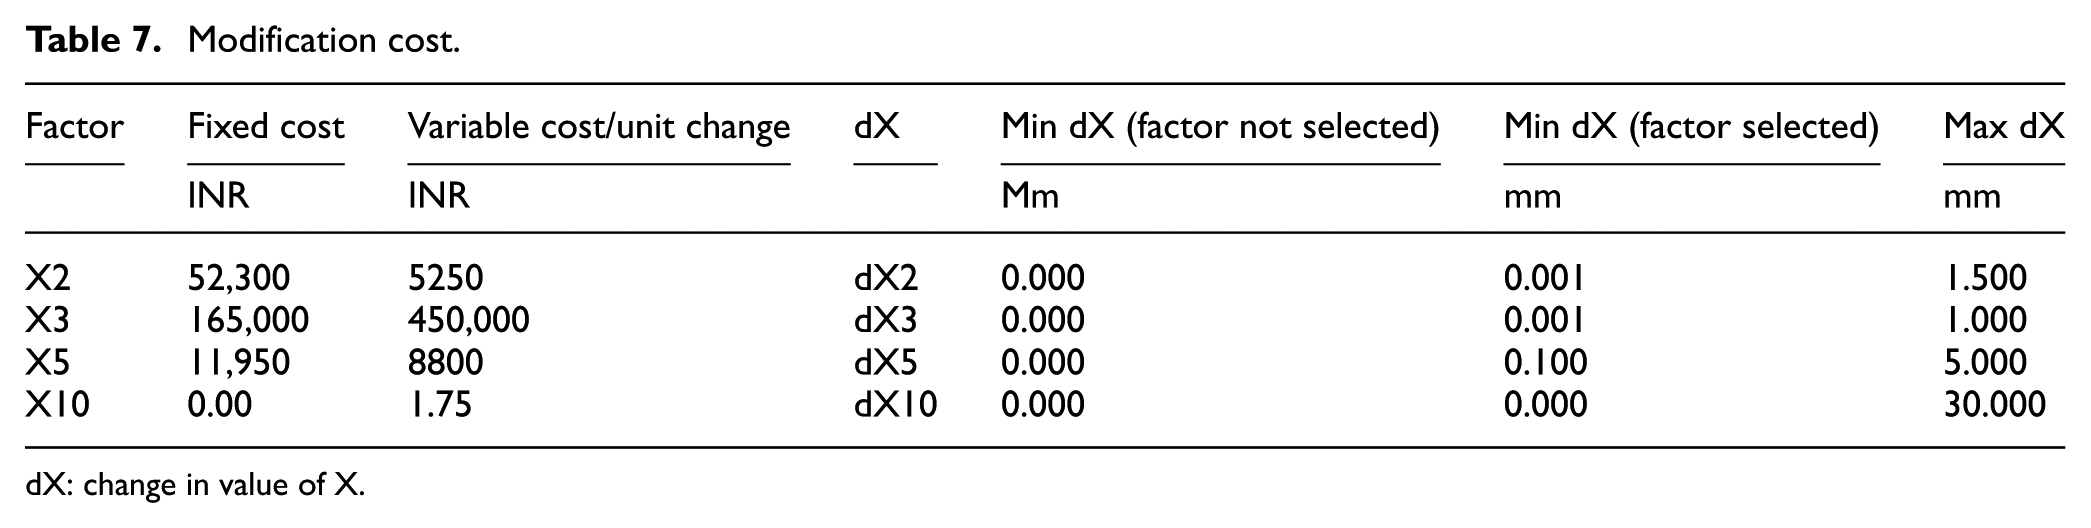
dX: change in value of X.
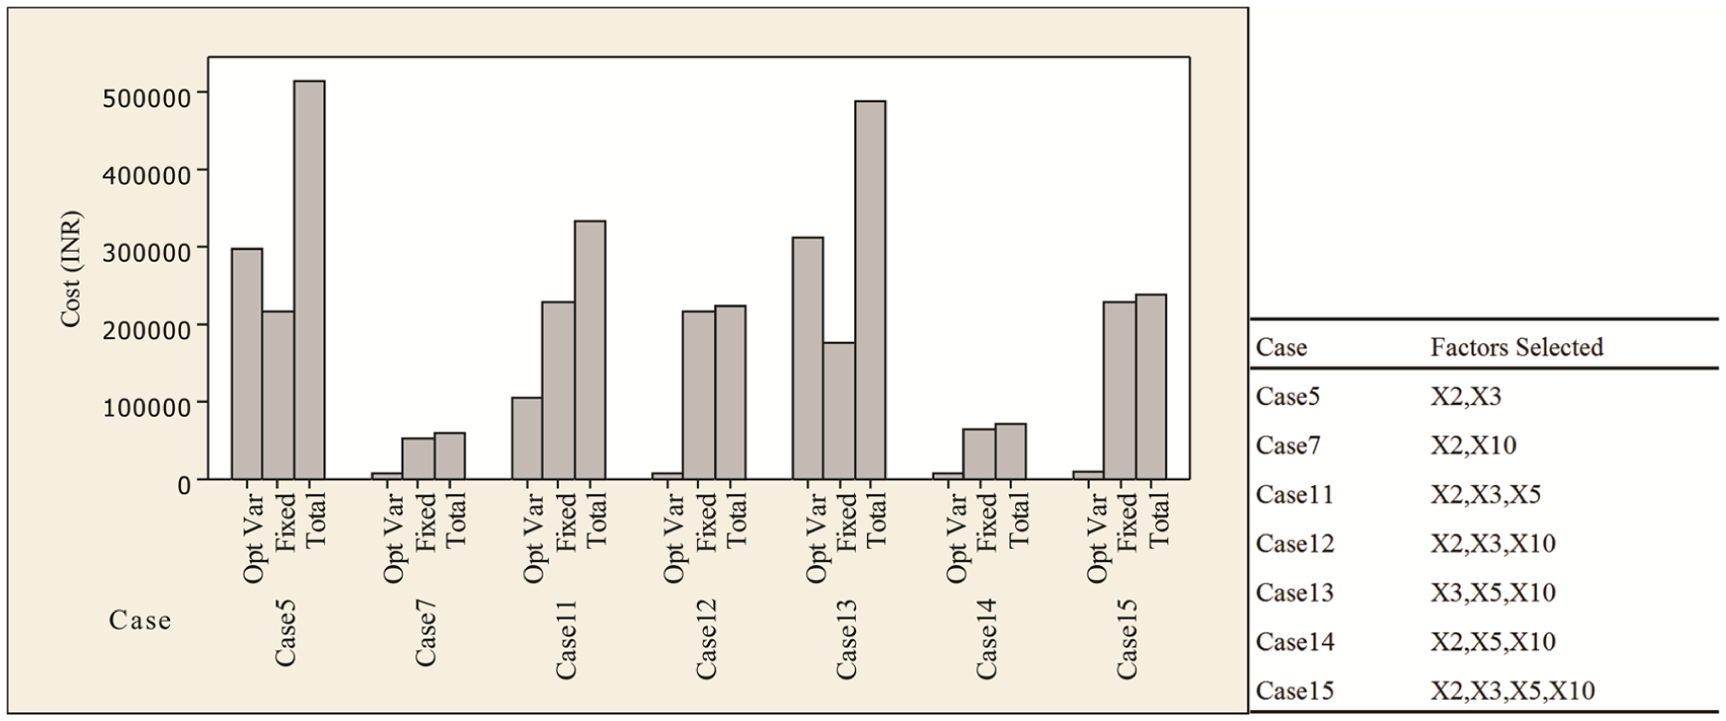
Case versus cost comparison.
After step O-13 workflow of DMAIoC framework goes back, Improve phase step I-4 and subsequently conventional steps are followed till the completion of control phase.
Control phase
To sustain the benefits delivered through this case study, a Control plan was also recommended for the input factors using the principles of acceptance sampling.46–48 Measured value less than 4.2 mm, 2.9 mm, 147 mm and 45 Kgf/cm2, respectively, for X2, X3, X5 and X10 were decided as non-acceptable part items. As per the most frequent lot sizes, a randomly selected sample size of 13 was taken for inspection. Any lot having one or more defective piece needs to be checked 100% by the supplier and only the acceptable pieces can be taken. Acceptable quality level of 1.0 (1 defective per 100 units) and corresponding acceptance number was taken from Military Standard 105D. 49 Same sample size of FGs was inspected for transportation testing. No defective FG was expected out of tested sample for lot acceptance. Complete lot needs a 100% checking if there is a defective FG found in sample testing. These input characteristics were notified as CTQ parameters to the suppliers and were asked to maintain X-bar R chart with root cause analysis in case of any assignable cause.
Results
Referring to Figure 12, case 7 was found to have least of the minimum investment requiring values of input variables, X2 (lock width) = 3.414 mm, X10 (adhesive strength) = 45 Kgf/cm2 and rest at the existing values. Lock width was increased by 1.414 mm and adhesive strength by 30 Kgf/cm2 to meet a new tape was provided by the supplier as per recommendations. Experimental observation of SDH post-improvement was found to be varying from 89.6 to 92.4 mm.
Discussion
Review of the past literature6,8,11,16,42–44 suggests that, (1) integrating other improvement strategies with DMAIC, (2) specific customer requirement linked with specific market and (3) minimisation of cost investment associated with quality improvement, are three research areas where not much work has been done. Aforesaid, three research areas along with lack of a framework to meet quality and cost together have been taken as research objectives for this work.
This article proposes a hybrid framework, DMAIoC by ‘integrating optimise phase into conventional DMAIC framework’ as an attempt on first research area. Application of the proposed framework is illustrated by a case study. A real-life industrial problem from a price-sensitive market has been taken. Second research area is attempted by making goal of the case study to ‘meet quality target at minimum improvement cost’. It is a specific customer priority linked to price-sensitive markets. 44 Through the Optimise phase, ‘simplex method’ is applied to formulate and ‘minimise cost investment associated with quality improvement’ which is aligned with third research area.
Practical conditions were simulated by an experimental setup. Experiments were conducted at in multiple phases and experimental data were used to analyse impact of input variables on response variable. Using DMAIoC framework, business case was converted into a practical engineering problem. Controlled experiment using the DOE was used in finding a statistical model for fine-tuning of variables in achieving the desired value of the response variable. Objective functions for cost minimisation were formulated based on investment cost for modifying input variables. Constraints to the objective functions were decided by extendibility limits of input factors. Simplex method was applied to get a solution at minimum cost, meeting the desired quality as well. Post-improvement defect rate had decreased from 64,380 to 65.87 PPM, for a data collection period of initial 12 weeks.
Conclusion
Optimise phase of the proposed DMAIoC framework enhances its capabilities vis-à-vis conventional DMAIC framework. Quality improvement has been an obvious objective of many LSS projects, but implementation of recommendations of these projects requires resources in various forms, for example, cost, time, human effort, etc. At any given point of time and geography, different markets have their own specific customer priorities, linked with optimisation of these resources.
Proposed DMAIoC framework has significant practical implication, as it can be applied in solving other industrial problems whenever any resource is required to meet the quality target. Examples of such resources are cost incurred for production down time, human effort (man-hr), transportation, inspection time, infrastructure setup, testing time, raw material, etc. As demonstrated in this article, such resources can be formulated as objective functions for optimisation using workflow steps of Optimise phase. Constrains to objective function can be derived through external limits imposed on input and response. In this article, simplex algorithm has been used in the optimise phase. In other industrial problems, various optimisation techniques, suitable to the nature of the problem, may be applied to derive an optimum solution.
Comparing DMAIoC versus DMAIC, both frameworks are applied for problems related to quality improvement. But DMAIC does not have a provision for optimisation phase; therefore, optimal solution vis-à-vis resource utilisation may not be ensured, whereas in the proposed DMAIoC framework, optimisation phase is integrated. Therefore, identified solutions have to be evaluated on their resource utilisation aspect which will ensure that optimum solution is identified. Provision of optimisation phase in the framework makes DMAIoC more suitable for solving problems where quality target needs to be achieved at minimum resource utilisation.
In the case study, DMAIoC has demonstrated its practical implication by solving a high defect rate problem. In the context of price-sensitive market, recommended solution achieved the objective of meeting quality at minimum cost. Recommended improvement case successfully meets quality target of less than 70 PPM defect rate by increasing SDH from 34 to 90 mm. The optimum cost of improvement was 21% lesser than any other feasible improvement case. Problems from other industries can also be explored where cost of improvement is important consideration.
As part of future research, more complicated situations can be tackled by considering higher order interaction effect between factors while developing statistical model. Problems where objective function does not have a linear relationship can be explored using more sophisticated optimisation techniques.
Footnotes
Appendix 1
Declaration of conflicting interests
The author(s) declared no potential conflicts of interest with respect to the research, authorship and/or publication of this article.
Funding
The author(s) received no financial support for the research, authorship and/or publication of this article.