
Abstract
This article proposes a finite element analysis–based inverse approach to estimate the friction coefficient in hot bar rolling. The focus is to minimize the difference between the spread of material measured from the pilot hot bar rolling test and that computed from finite element analysis. The recursive response surface method was used with a changed observation range to minimize the difference. The pilot hot bar rolling test was conducted at temperatures ranging from 850 °C to 1150 °C and reduction ratios from 20% to 40%. Finite-element simulation of the pilot hot bar rolling test was carried out. A fast running model that can rapidly determine the friction coefficient at the arbitrary reduction ratios and temperatures in the ranges mentioned above was also presented. The estimated friction coefficient was approximately 10%–17% higher than the friction coefficient typically used in hot strip rolling. The effect of temperature variation on the friction coefficient was greater at higher reduction ratios (30%–40%) than at a lower reduction ratio (20%).
Keywords
Introduction
Friction coefficient affects the setup of rolling schedule, the accuracy of thickness, and the product profile in the rolling process. Hence, precise estimation of friction coefficient is an important task in the field of rolling analysis. However, inaccessibility of the interface between the material and work roll makes the friction coefficient difficult to measure.
There has been a lot of research performed to estimate the friction coefficient, and it can be divided into two groups: one is direct measurement and the other is an inverse estimation based on numerical methods. Direct measurement of the friction coefficient is accomplished through sensors embedded in the work roll. There have been many efforts to assess the friction coefficient between the work roll and material in the cold rolling process.1,2 Karagiozis and Lenard 1 inserted a set of specially designed sensors (pins and force transducers) in the work roll of a pilot cold rolling mill and measured variations in roll pressure (normal stress) and shear stress along the arc of contact. They showed that the friction coefficient varies along the arc of contact. Jeswiet 2 performed a pilot cold rolling test using Karagiozis and Lenard’s 1 approach and claimed that the friction coefficient was practically constant along the arc of contact. Propelled by the success of Karagiozis and Lenard’s approach (i.e. the direct measurement method), Hum et al. 3 applied it to measure the friction coefficient in warm rolling. They measured the friction coefficient when commercial pure aluminum was rolled at a temperature of 500 °C. They showed that the friction coefficient increased with reduction ratio and decreased with rolling speed.
The direct measurements proposed by Karagiozis and Lenard 1 require considerable effort and cost for installing sensors in the work roll and for data acquisition. Therefore, a model-based inverse method has been used as an alternative to overcome this problem. The inverse method infers the friction coefficient value by comparing the measurements (that are not difficult to get) to predictions made by a model. Evans and Avitzur 4 proposed a procedure that evaluates the coefficient of friction for several forming processes. For example, they estimated the friction coefficient in a pilot cold rolling process by comparing the predicted roll forces with the measured roll forces. Roberts 5 also estimated the friction coefficient in actual hot strip rolling by comparing the roll forces predicted by a one-dimensional simplified model with the measured roll forces. However, the roll forces measured during hot rolling test are sometimes unreliable.
In an actual hot rolling mill, in which rolling temperatures range from 850 °C to 1150 °C, the material surface is oxidized while material is transported between stands (passes). Subsequently, oxide scales are formed on the material surface. The oxide scales behave in a brittle or ductile manner depending upon the temperature and chemical composition of the material. 6 Oxide scales deform or fracture inside the roll gap. 7 This affects the frictional state along the arc of contact as well as the surface quality of the product.8,9 As a result, the roll force measured during hot rolling frequently fluctuates and therefore may not be a suitable basic parameter for estimating friction coefficient.
Munther and Lenard 10 assumed slip forward as a basic parameter and performed a pilot hot strip rolling test. They measured forward slip of the material (the strip) and carried out two-dimensional finite element (FE) analysis of the test. Next, they estimated the coefficient of friction using an FE analysis–based inverse method. The estimated friction coefficient was in the range 0.10–0.26, which is low in comparison with the friction coefficient—0.30 to 0.40—usually used in common hot strip (or plate) rolling processes.11,12
In recent years, many research groups have released research results (model-predictions and experiments) in hot rolling such as the material’s outer (or inner) shape at exit,13–17 roll force,18–20 and material temperature.21,22 They have not tried to measure the friction coefficient; instead, they examined the effect of oxide scale on the friction coefficient and its deformation behavior in the roll gap23–25 and the effect of roll speed on the friction coefficient. 26 The exit temperature of the material (workpiece) in each pass and the effective strain and strength (hardness) evolution of the material can be possible candidates for basic parameters. In reality, though, these values are difficult to measure. The effective strain and strength (hardness) evolution are not measureable when material is deformed inside the roll gap. The exit temperature can be measured, but the model-predictions notably depend on the contact heat transfer coefficient, which is dependent on the surface condition of the work roll.
In this study, the spreading of material was selected as a basic parameter to estimate the friction coefficient in hot bar rolling where spreading of material is noticeable. Aspect ratio of cross section of the strip is less than 0.1, but that of the bar is usually in the range of 0.7–1.0. The advantage of using the spreading of material as a basic parameter is that the spread measurement is more stable and easy than measurements of other physical quantities. The spreading of the material during hot bar rolling is noticeable and almost constant except in the front and rear part of the material when the material is rolled in a single-stand rolling mill. Hence, the spreading measurement is very reliable if only the spreading is measured in the middle section of the material (specimen) being rolled. A two-high, single-stand pilot hot rolling mill at POSCO Technical Research Laboratories was used. High carbon steel (ASTM E52100) obtained in the form of an as-cast square billet (160 mm) was used for rolling test. The billet was cutout and machined into rectangular bar specimens with a square section (70 mm × 70 mm). They were rolled at four different temperatures (850 °C, 950 °C, 1050 °C, and 1150 °C) and three different reduction ratios (20%, 30%, and 40%). The spreading of the specimens rolled in each rolling condition was measured after they were cooled in air to room temperature. A series of three-dimensional FE analyses in which the Coulomb contact friction model was imbedded were then performed to simulate the pilot hot bar rolling test and predict the spreading of material. The friction coefficient was then estimated by minimizing the difference between the measured spreading and that computed by FE analysis. The recursive response surface method (RSM) with a changed observation range was used to minimize the difference. Based on the results obtained, a fast running model was proposed that instantly computes the friction coefficient value when an arbitrary material temperature and reduction ratio for a pass (stand) are provided.
FE-based inverse approach to estimate friction coefficient
Figure 1 illustrates the direct approach suggested by Karagiozis and Lenard 1 and the FE-based inverse approach proposed in this study. The RSM was adopted, 27 which is a type of optimization scheme to transform a set of response values into a response surface (i.e. an objective function) and minimize it. It should be mentioned that the ring compression test28,29 has been used to measure the local friction coefficient corresponding to a specific process condition. However, the approach proposed in this study measures the mean friction coefficient. The friction coefficient in hot bar rolling varies continuously along the arc of contact in the direction of the rolling direction as well as the work roll axis. Hence, in this study, the mean friction coefficient, which is a single-valued friction coefficient representing variations in the friction coefficients inside the roll gap, has been defined and estimated.
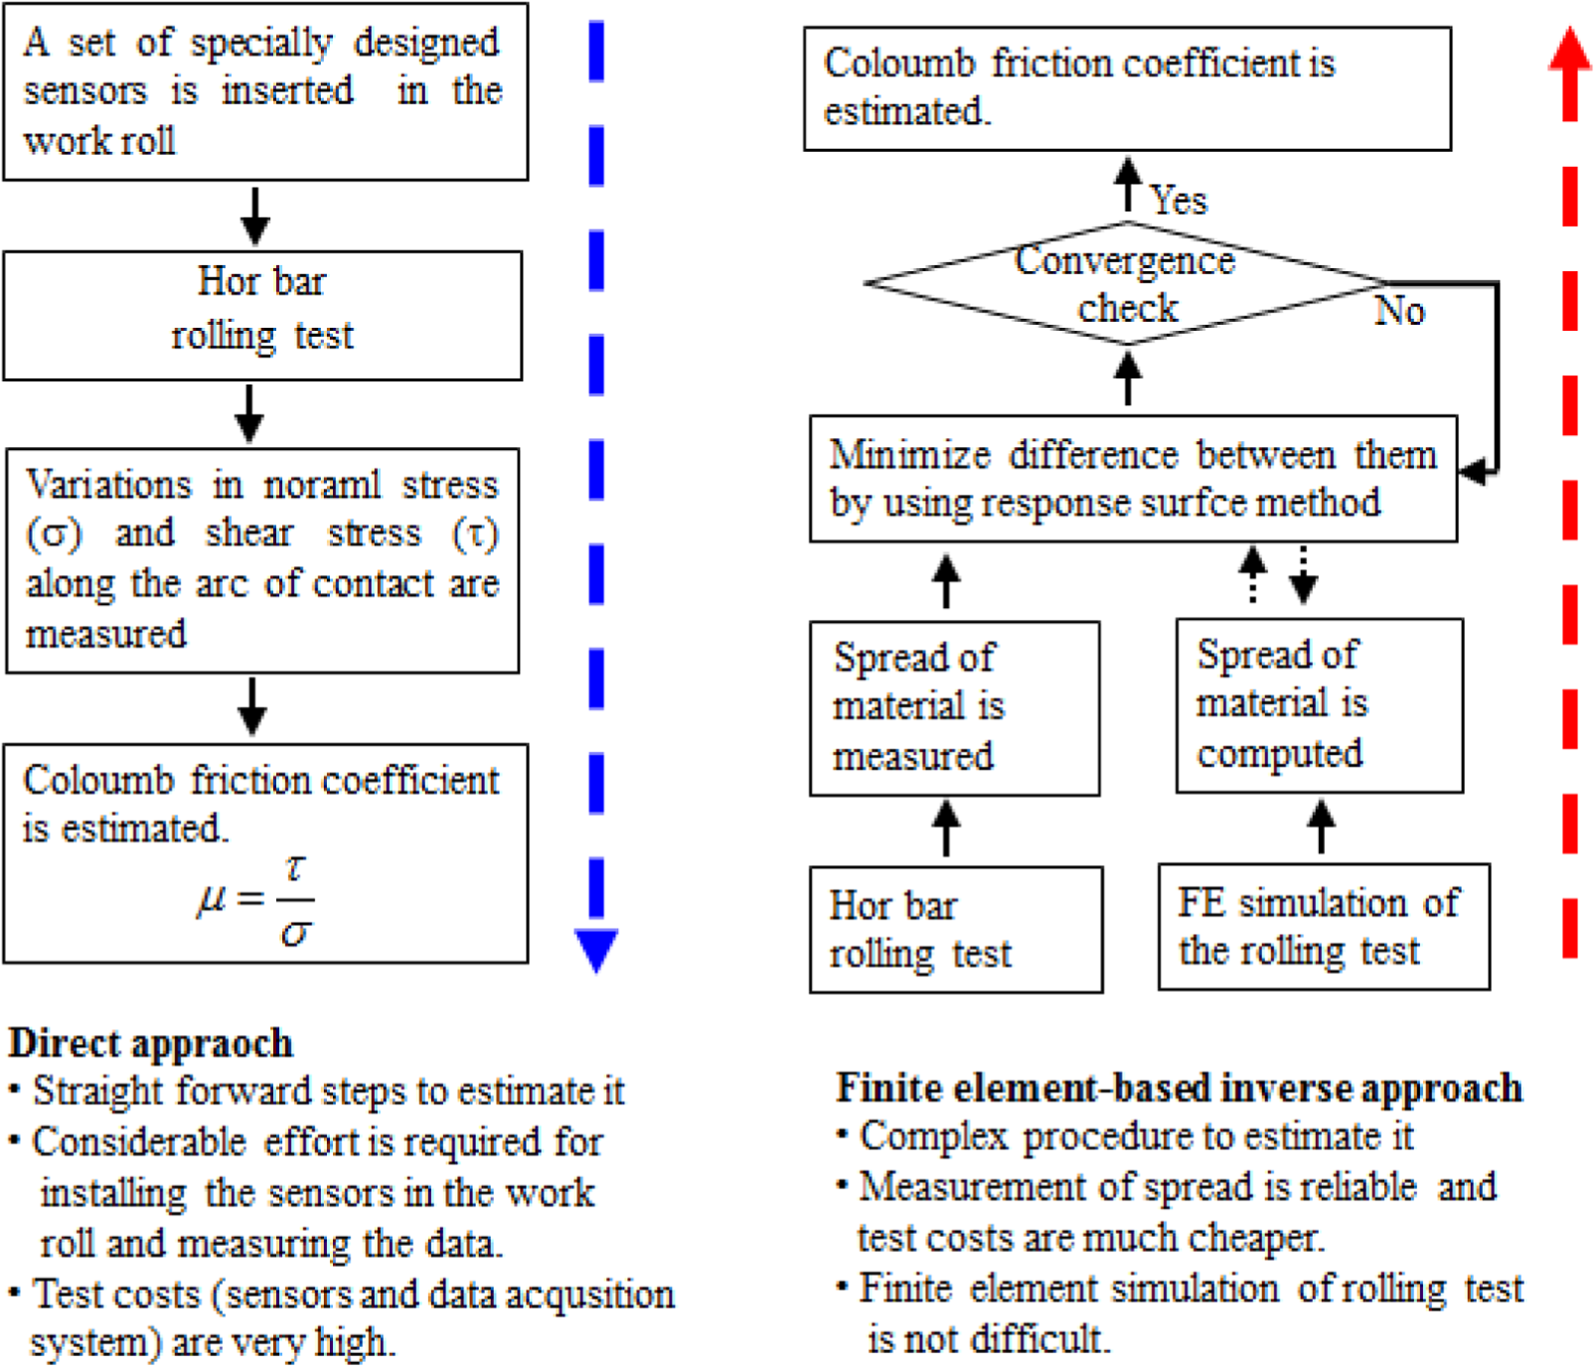
Illustration of the direct approach and finite element–based inverse approach.
Objective function
The response value is first defined to set up the response surface. In this study, the response value
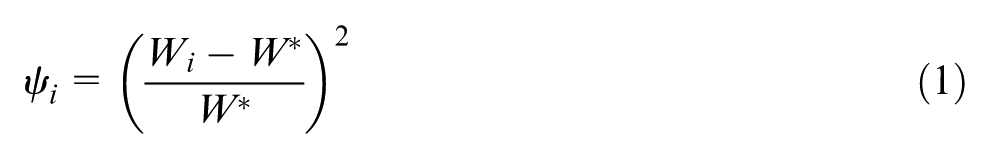
where
Hereafter, the response surface linking a set of the response values is called the objective function for convenience since the RSM is used to find the minimum point of the response surface. In this study, a format of the objective function

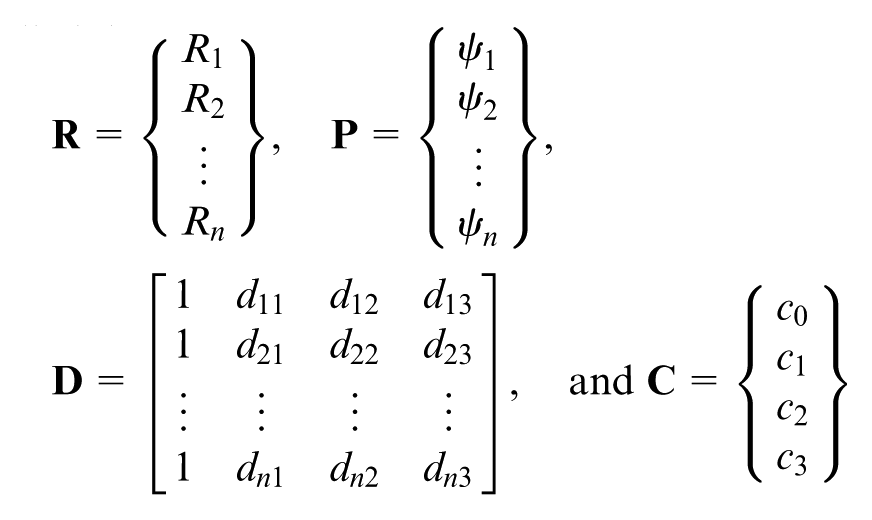
Here,
The difference between

Here,

where
The square of the residual was obtained in order to minimize the magnitude of the residual in an average sense as follows
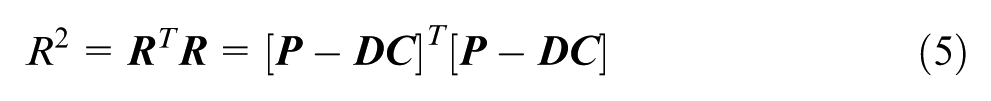
Utilizing the stationary condition, the values of
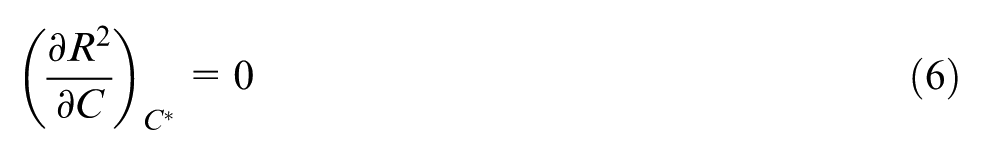
Solving equation (6) gives the values of
where
Computational procedure to estimate the friction coefficient
An FE-based inverse approach is presented, coupled with the RSM that minimizes the response value, that is, the difference between the spreading of material measured in the hot bar rolling test and that predicted by FE analysis.
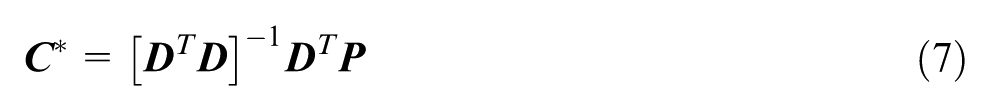
Figure 2 shows a flow chart that estimates the friction coefficient using an FE-based inverse approach coupled with RSM. A range is set up in which the friction coefficient may exist. This range will hereafter be called the friction coefficient change range (FCCR). Within a given FCCR, FE analysis of hot bar rolling was performed for each trial friction coefficient, and the spreading of material for each trial friction coefficient was computed. Response values
Flow chart to estimate the friction coefficient in hot bar rolling using finite element–based inverse approach coupled with response surface method (RSM).
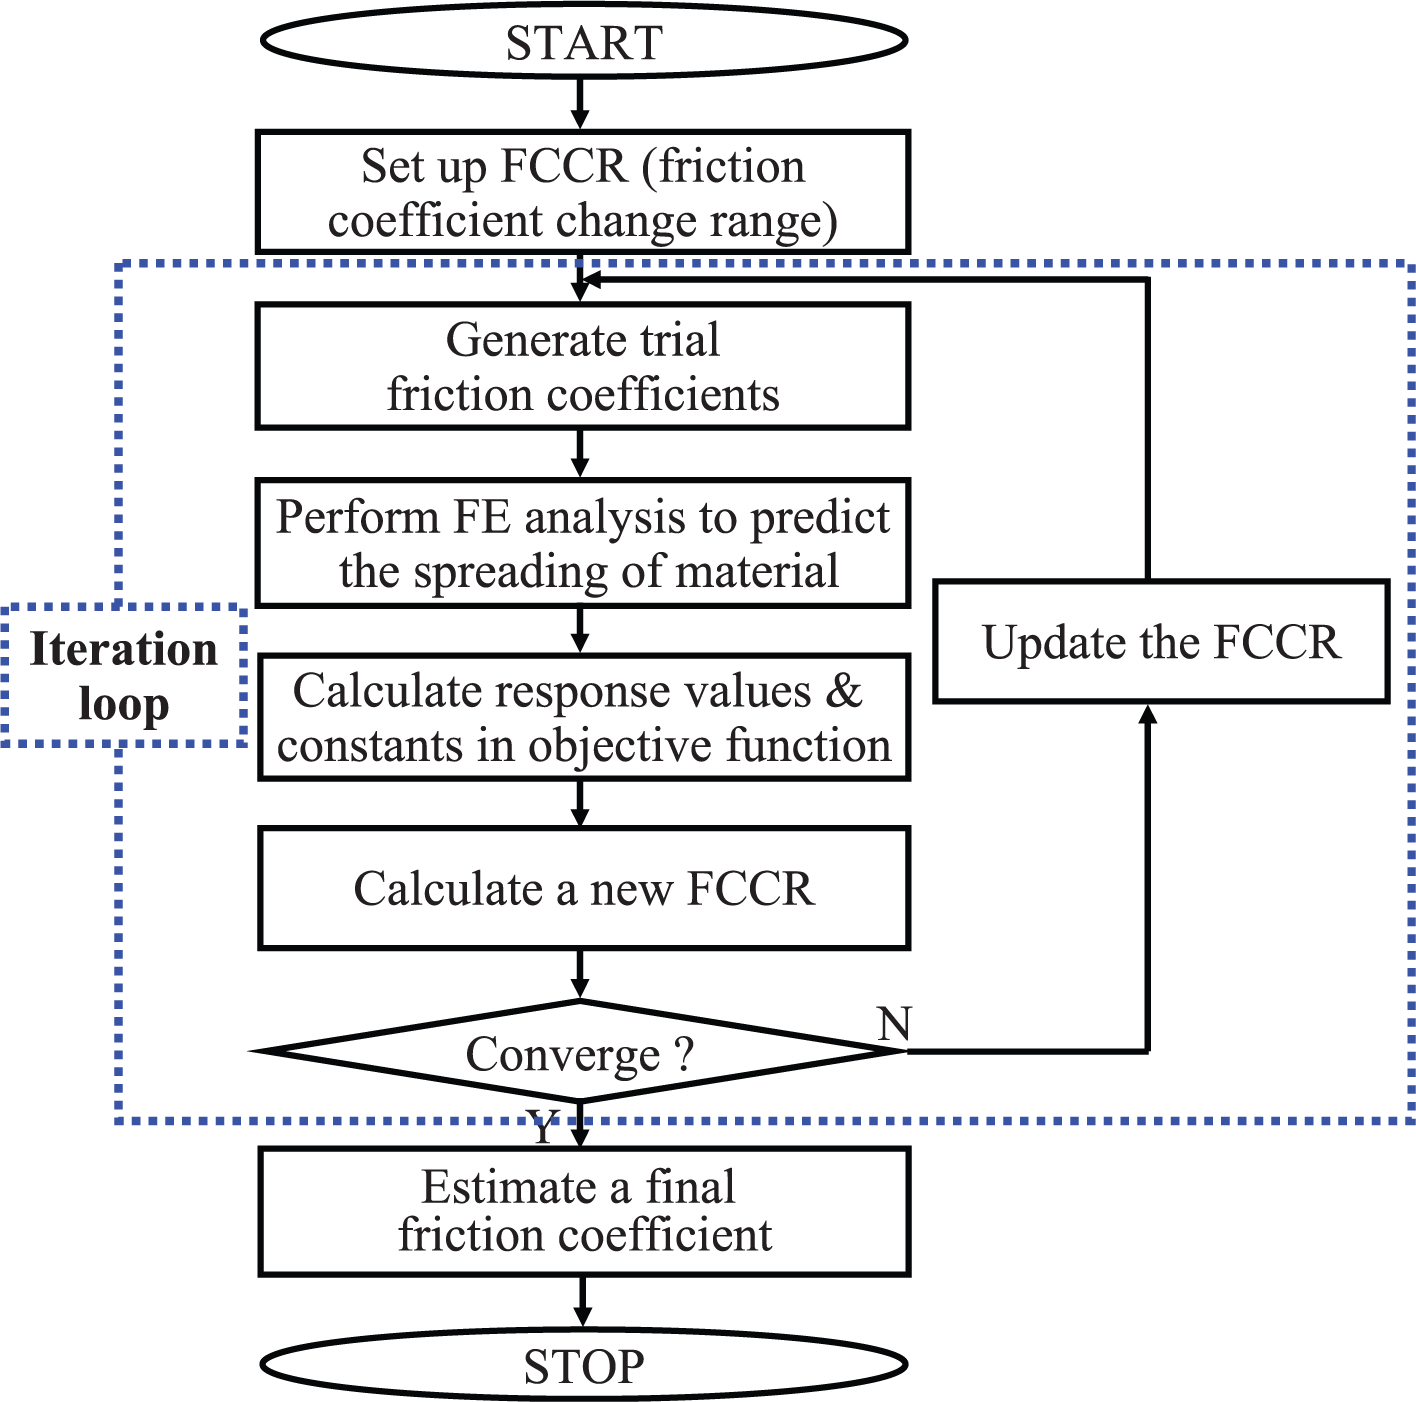
Schematic of the procedure that FCCR (friction coefficient change range) is decreased as the calculation is repeated: (a) friction coefficient is minimized at ith iteration and (b) friction coefficient is minimized at (i + 1)th iteration.
Figure 3(a) shows the objective function (ψ0) that links a set of the response values (ψk) and the minimum point of the objective function at the (i)th iteration. (µL) i and (µU) i represent the lower and upper bounds of a trial FCCR, respectively, at the (i)th iteration. (µmin) i denotes the friction coefficient minimized at the (i)th iteration. The new response surface and updated FCCR are shown in Figure 3(b). The new (i.e. updated) FCCR was calculated as follows


where (µL)i + 1 and (µU)i + 1 represent the lower and upper bounds of the updated FCCR at the (i + 1)th iteration. β denotes a reduction coefficient, which is a value between zero and 1/2. In this investigation, we chose β = 1/4. The minimum friction coefficient at the (i + 1)th iteration, (µmin)i + 1, was then determined by applying the stationary condition
Convergence of the minimized friction coefficient value was checked before the friction coefficient value was determined. A mean value of the objective function
where

where
Experiments
Material and pilot bar rolling mill
The material used in this study was high carbon steel (ASTM E52100) (C: 0.98, Si: 0.21, Mn: 0.36, P: 0.014, S: 0.004, Cr: 1.43, N: 0.003 wt%). The material was obtained in the form of an as-cast square billet (160 mm). A set of specimens (70 mm2 and 250 mm in length) was machined from the billet. A single-stand, two-high laboratory rolling mill in the POSCO Technical Laboratory was employed. This mill was driven by a constant torque, 68 kW direct current (DC) motor. Work rolls in the pilot rolling mill had diameters of 720 mm and were made of ductile casting iron (DCI). Entry guides were installed in the front of work rolls to minimize lateral bending of the specimen during the rolling test. Roll r/min was 35.
Hot bar rolling test
The specimen was heated in a reheating furnace for 30 min to ensure a homogeneous temperature distribution inside the specimen. The specimen discharged from the reheating furnace was transported to the laboratory rolling mill. The surface temperature of the specimen decreased while the specimen was transported via the roller table to the work rolls (about 5 s). Rolling was started when the surface temperature of each specimen measured by a pyrometer reached the predetermined temperatures of 850 °C, 950 °C, 1050 °C, and 1150 °C. The specimen rolled out of the pilot rolling mill and was cooled in air to room temperature. After cooling, 10-mm-thick cross sections were obtained by cutting down the middle of the rolled specimen and spreading of the specimen was measured as shown in Figure 4. No lubricant was applied to the roll surface during the rolling test.
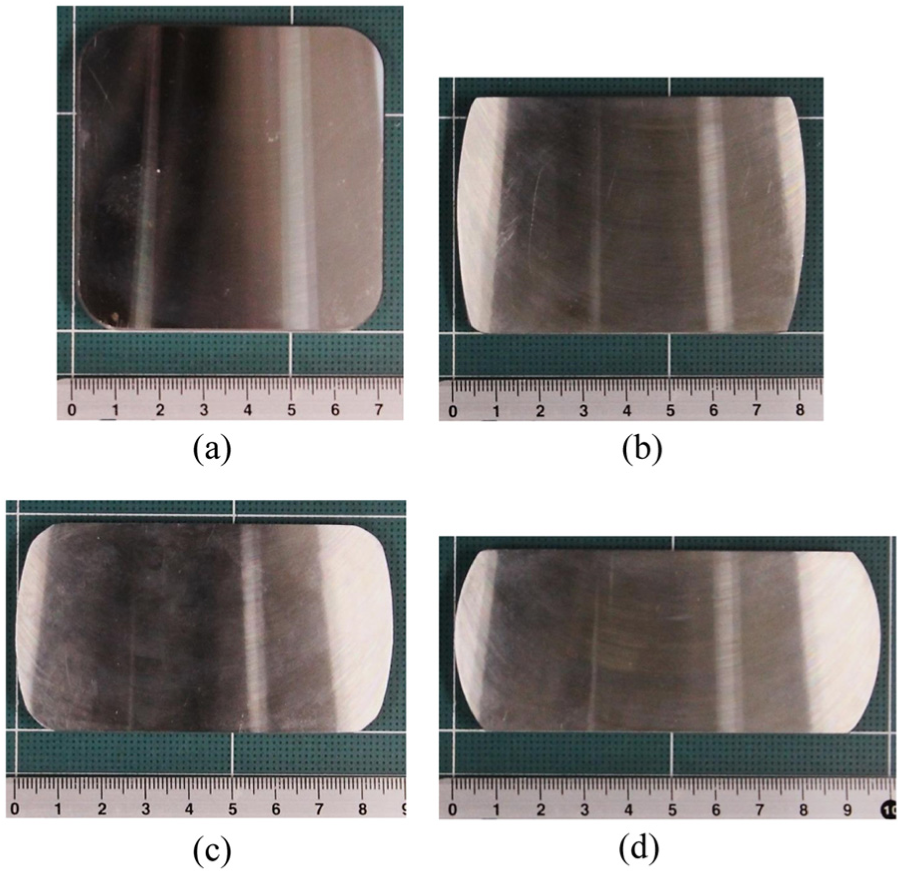
Cross-sectional shapes of (a) initial specimen and deformed specimens with reduction ratios of (b) 20%, (c) 30%, and (d) 40% rolled at 1050 °C.
FE analysis
Elastic–plastic FE analysis was conducted to compute the spreading of the specimen during hot bar rolling using the commercial FE software, ABAQUS. The explicit time integration method was used, and the element type used for the specimen was C3D8RT (an eight-node thermally coupled brick, tri-linear displacement and temperature, reduced integration, hourglass control), which is suitable for metal forming analysis. 30
Boundary conditions
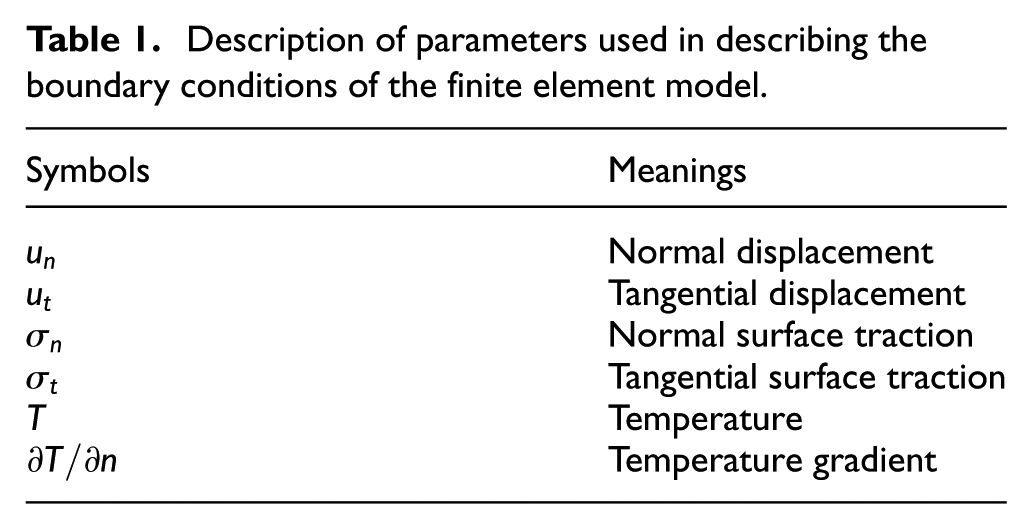
Figure 5 shows mesh and boundary conditions used in the specimen and work roll. A thermo-mechanically coupled analysis was carried out that included the mutual dependency between the mechanical and thermal behaviors of the specimen and work roll. A quarter symmetric condition was adopted for hot bar rolling due to its bilateral and up-and-down symmetric configuration. The symbolic parameters used for describing the mechanical and thermal boundary conditions are listed in Table 1.
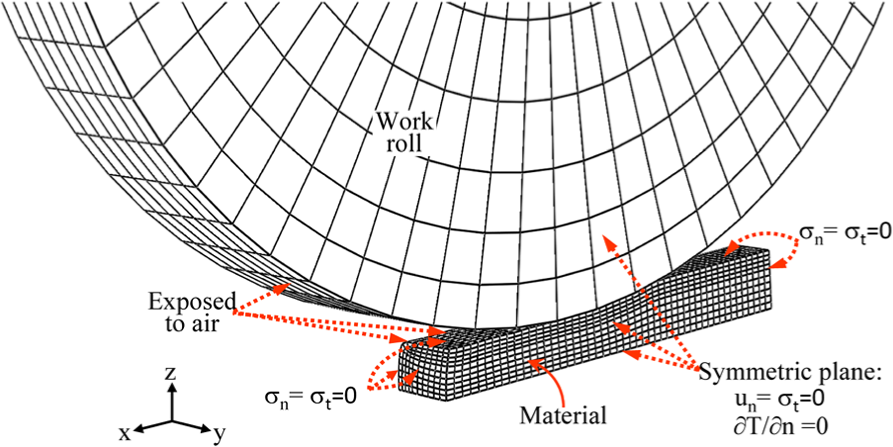
Mesh and boundary conditions used for specimen (material) and work roll. Symbolic parameters are described in Table 1.
Description of parameters used in describing the boundary conditions of the finite element model.
The friction at the interface between the work roll and the specimen was assumed to follow Coulomb’s law of friction. The thermal conductivity of the specimen was set to 27 W/m K 31 and that of the work roll was set to 32 W/m K. 32 At the deformation zone, heat is conducted from the specimen to the work rolls. At the same time, heat is generated due to frictional force. Previous studies have reported that the magnitude of the heat transfer coefficient at the contact surface between the specimen and the work rolls was generally in the range from 8.6 to 17.6 kW/m2 K. 33 Hence, in this study, the contact heat transfer coefficient was set to 15 kW/m2 K.
Constitutive equation of the material
The constitutive equation of the material (which relates stress and strain to current conditions such as temperature and strain rate) plays a crucial role in the analysis of elastic–plastic deformation. The FE analysis considered the influence of temperature on stress. Figure 6 shows the stress–strain curves used in the FE analysis. These stress–strain curves were measured using a high-temperature deformation test. The compression test was carried out at high temperatures to investigate the effects of temperature on the stress–strain behavior of material at a fixed strain rate of 0.8 s−1. The commercial thermal–mechanical simulator, Gleeble® 3800, was used for performing the deformation test. The strain rate of 0.8 s−1 corresponds to the average strain rate that the material (workpiece) experiences during pilot hot bar rolling. Test temperature ranged from 700 °C to 1200 °C. Cylindroid specimens with dimensions of 15 mm length and 10 mm diameter were machined. The specimen was heated to the desired temperature using radiation from halogen lamps inside the furnace and held for 2 min to produce a uniform distribution of temperature across the specimen. Two Teflon sheets were inserted between the surface of jig (top and bottom) and that of the specimen (head and tail) to minimize the barreling caused by friction at the interface.
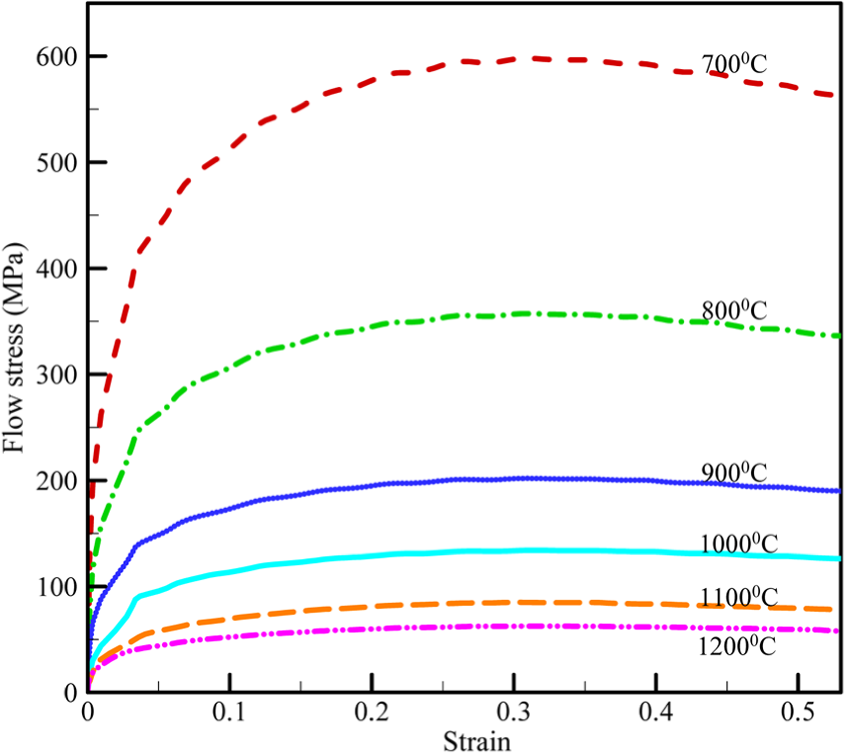
Dependence of flow stress on material temperatures at a strain rate of 0.8 s−1.
Results and discussion
Measurement of the spreading
After the rolling test was completed, 10-mm-thick cross sections were obtained by cutting down the middle of the rolled material. The rolled material was cutout carefully to keep the cutting plane perpendicular to the direction of length of the rolled material. Two persons measured the spreading at a clearance of 2 mm and calculated the average of the total spreading. Standard deviation of the measured spread was about 0.01 mm. In FE simulation, spreading was calculated using the following procedure: the maximum width of the cross section of the material was calculated at the same points where measurement of the spreading had been taken. The maximum width, that is, spread, was calculated along the middle of the deformed material and was found to be almost constant.
Figure 7 shows the measurements of the spreading of the material (specimen) for four different temperatures (850 °C, 950 °C, 1050 °C, and 1150 °C) and three reduction ratios (20%, 30%, and 40%). The centerline of box indicates the average and the half width of box indicates the standard deviation. An increase in the spreading, approximately proportional to the material temperature, was obtained. In addition, it was observed that an increase in the reduction ratio had more influence on the spreading than the material temperature.
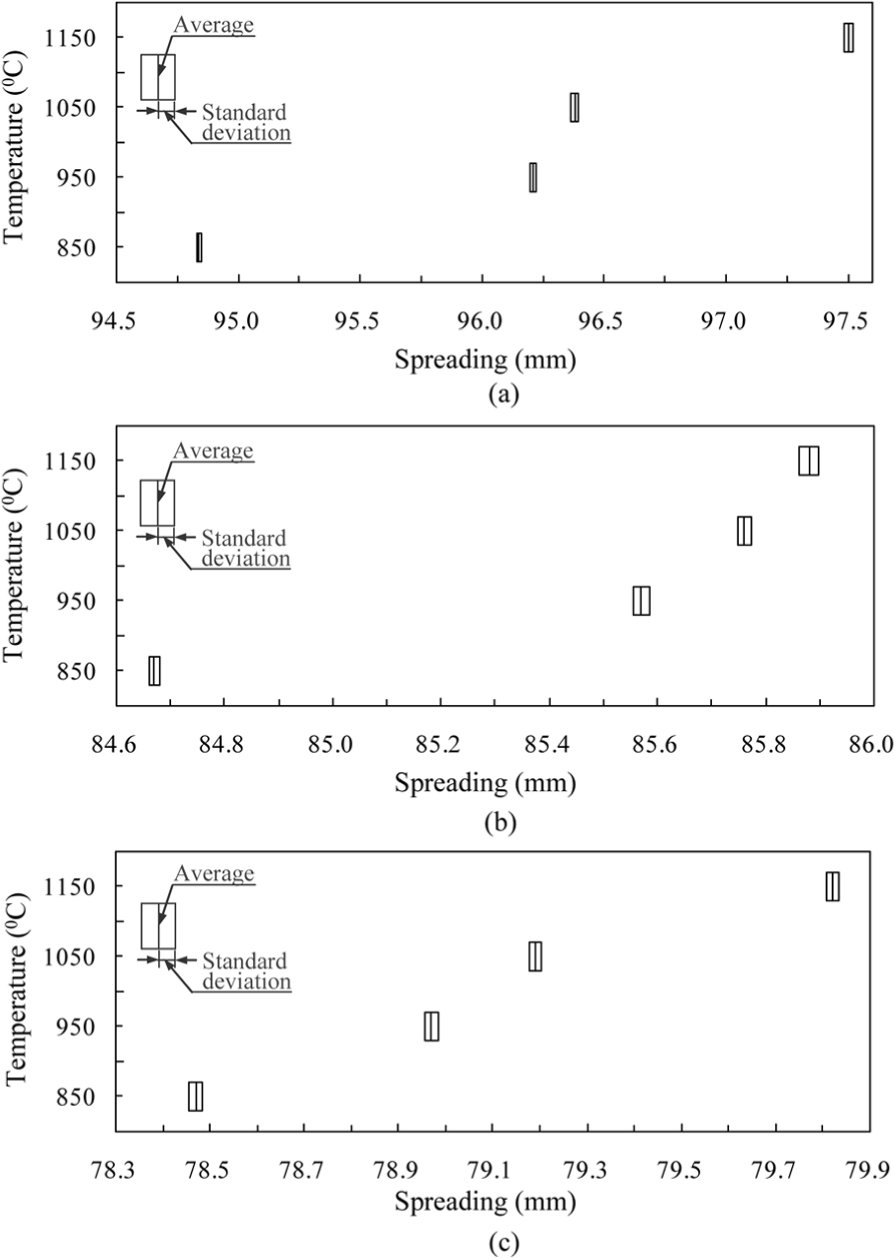
Measured spreading of material at different temperatures and reduction ratios: (a) reduction ratio = 40%, (b) reduction ratio = 30% and (c) reduction ratio = 20%.
Friction coefficient estimated by FE-based inverse approach
Figure 8 shows the variation in the objective function (i.e. response surface) as the FCCR is updated. The range of the friction coefficient change is reduced as FCCR is updated. These results were obtained for particular combination of values—a material temperature of 1050 °C and a reduction ratio of 30%. Symbols marked with solid circles, squares, triangles, and diamonds indicate response values predicted by FE analysis at first, second, third, and fourth FCCR, respectively. The solid line represents the objective function that was obtained by linking a set of the response values to a cubic polynomial function (see equation (2)). The FCCR decreased from 0.28 (Figure 8(a)) to 0.043 (Figure 8(d)) as the calculation was repeated four times. In Figure 8(a), the friction coefficient was estimated to be 0.378 (i.e. the minimum point on the axis of the abscissa of Figure 8(a)) after the objective function was calculated once. Meanwhile, the estimated friction coefficient changed to 0.409 (i.e. the minimum point on the axis of abscissa of Figure 8(d)) after the calculation was repeated four times. Friction coefficients for the other combinations of temperatures and reduction ratios were estimated in a similar manner.
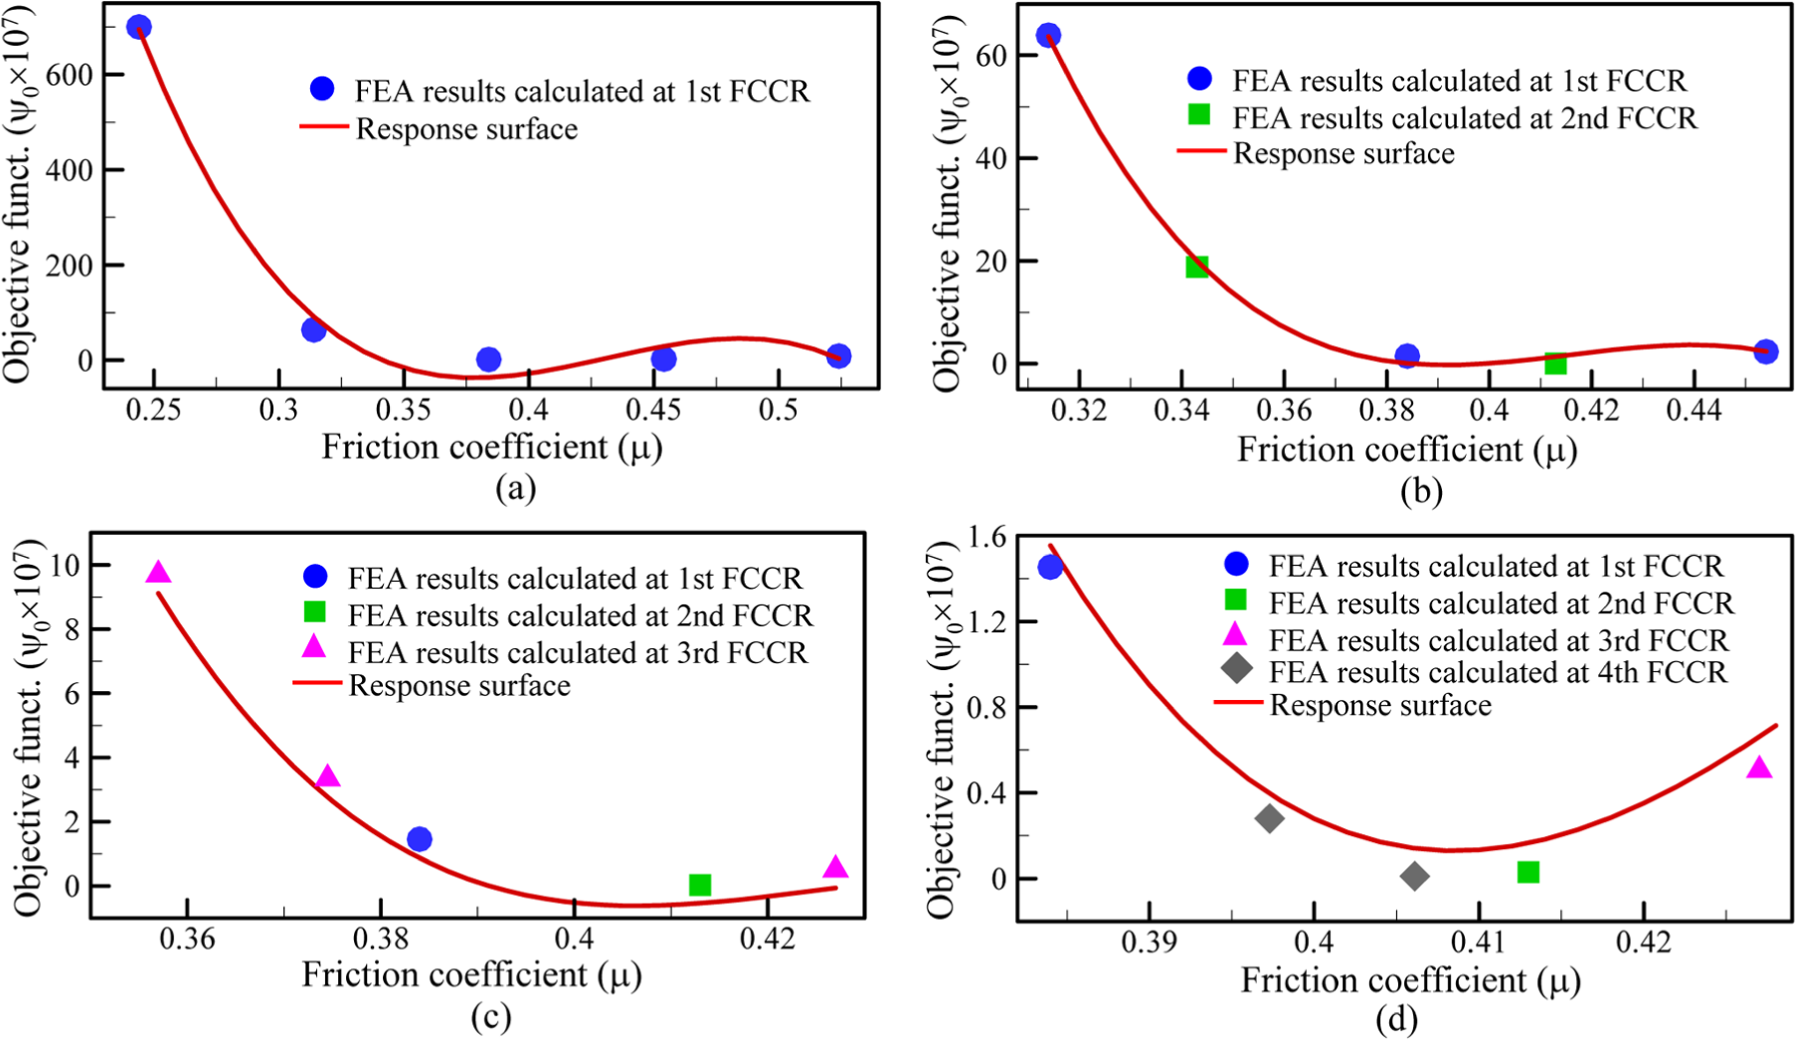
Variation in objective function (i.e. response surface) as FCCR (friction coefficient change range) is updated. These results are for a temperature of 1050 °C and a reduction ratio of 30%: (a) first FCCR, (b) second FCCR, (c) third FCCR, and (d) fourth FCCR.
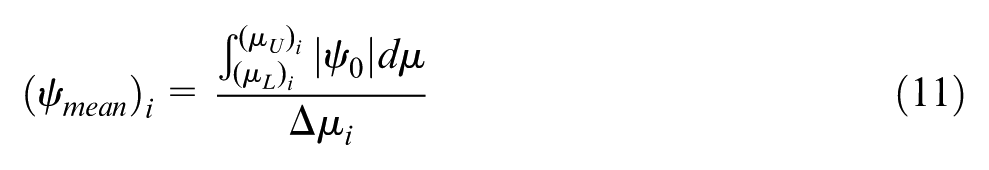
Figure 9 shows the variation in the mean value of the objective function (see equation (11)) when the number of FCCR iterations increase. The mean value of the objective function approached zero as the number of FCCR iterations increased. This implies that the friction coefficient value used in the FE analysis approaches the actual friction coefficient value in hot bar rolling. In this way, the friction coefficients for four different temperatures (850 °C, 950 °C, 1050 °C, and 1150 °C) and three reduction ratios (20%, 30%, and 40%) were estimated.
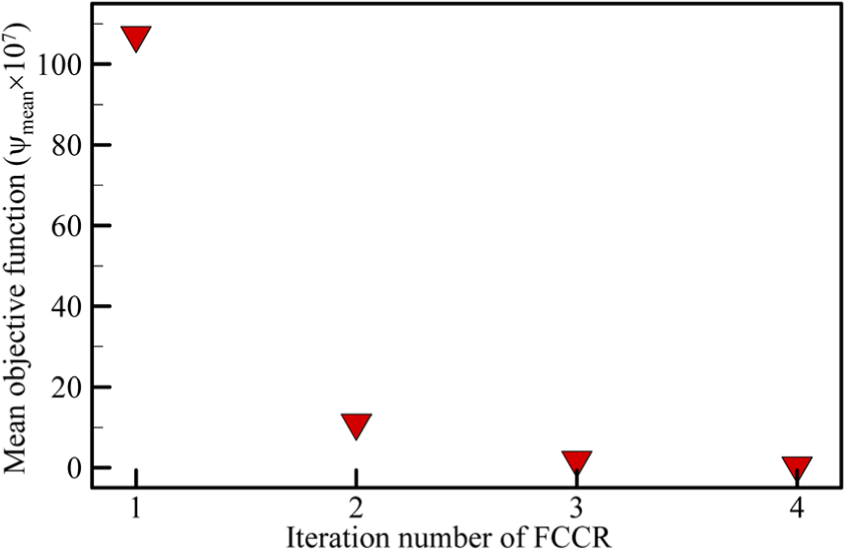
Variation in mean objective function as the iteration number of the FCCR (friction coefficient change range) is updated. These results are for a temperature of 1050 °C and a reduction of 30%.
The friction coefficient estimated from the approach proposed in this study was used in a FE analysis, and the cross-sectional shapes were predicted. In Figure 10, a quarter of experimentally measured cross sections are compared with the ones computed from FE analysis for reduction ratios of 20%, 30%, and 40% at a temperature of 1050 °C. Dashed-dotted lines indicate the outer shapes of cross section predicted by the FE-based inverse approach, and the images are the ones obtained from the rolling test. The predicted spread is in good agreement with the measured spread. However, there are some deviations between the predictions and the measurements near the corner where the material is separated from the work roll.
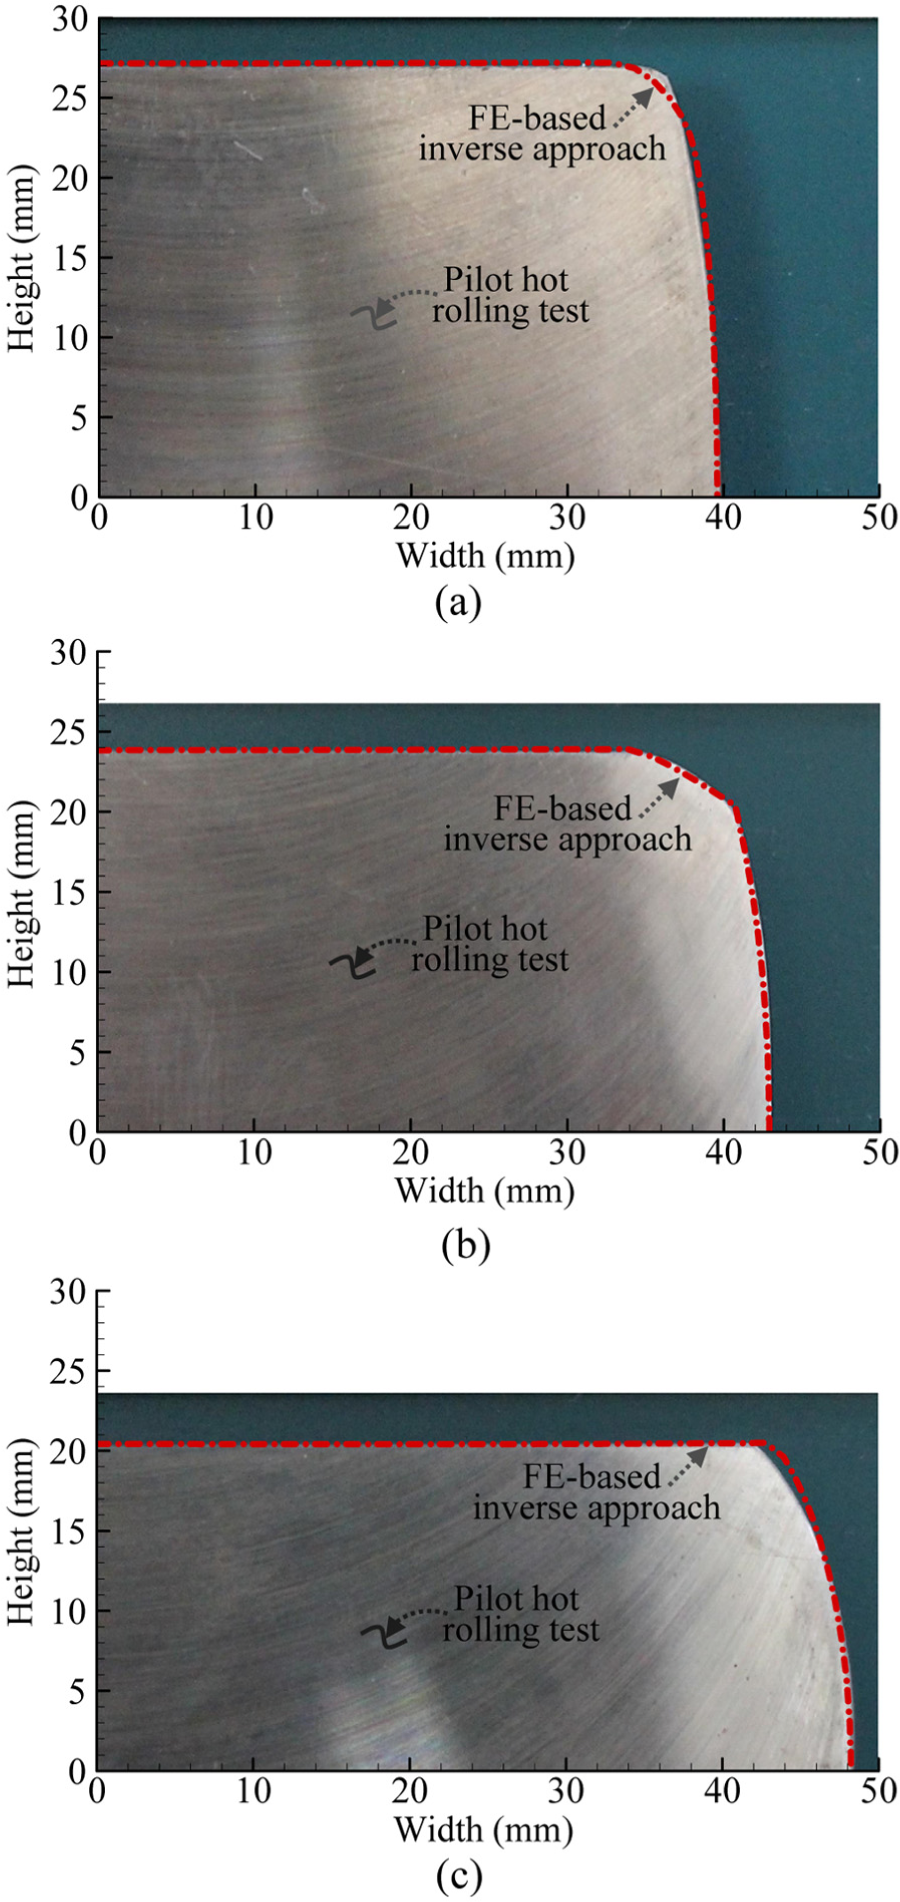
Quarters of cross-sectional shapes computed by finite element–based inverse approach (dashed-dotted line) are compared with the ones (image) measured for the cases that (a) 20%, (b) 30%, and (c) 40% rolled at 1050 °C.
Figure 11 shows the final friction coefficients estimated for the four different temperatures and three reduction ratios. Figure 11(a) shows the variation in friction coefficient as a function of temperature for set reduction ratios. A higher reduction ratio results in a larger friction coefficient. This result is in an agreement with the work of Hum et al., 3 who experimentally examined the dependence of the friction coefficient on the reduction ratio when commercially pure aluminum was rolled at a temperature of 500 °C. They also reported that the friction coefficient increased as reduction ratio increased. In this study, the effect of temperature variation on the friction coefficient is greater at higher reduction ratios (30%–40%) than at a lower reduction ratio (20%). This will be discussed further below. Figure 11(b) shows the variation in friction coefficient as a function of reduction ratio for given temperatures. There is a relatively sharp increase in the friction coefficient at a reduction ratio of 30% when the material temperature is in a relatively higher range of temperature (1050 °C to 1150 °C). This might be attributable to a situation where the oxide layer on the material surface is broken up at higher temperatures and at a reduction ratio of 30%. This situation would allow more virgin metal to be in contact with work rolls, 3 which may increase the magnitude of the adhesive contact at the interface of the material and work rolls. This enhanced adhesive contact leads to a sharp increase in the friction coefficient.
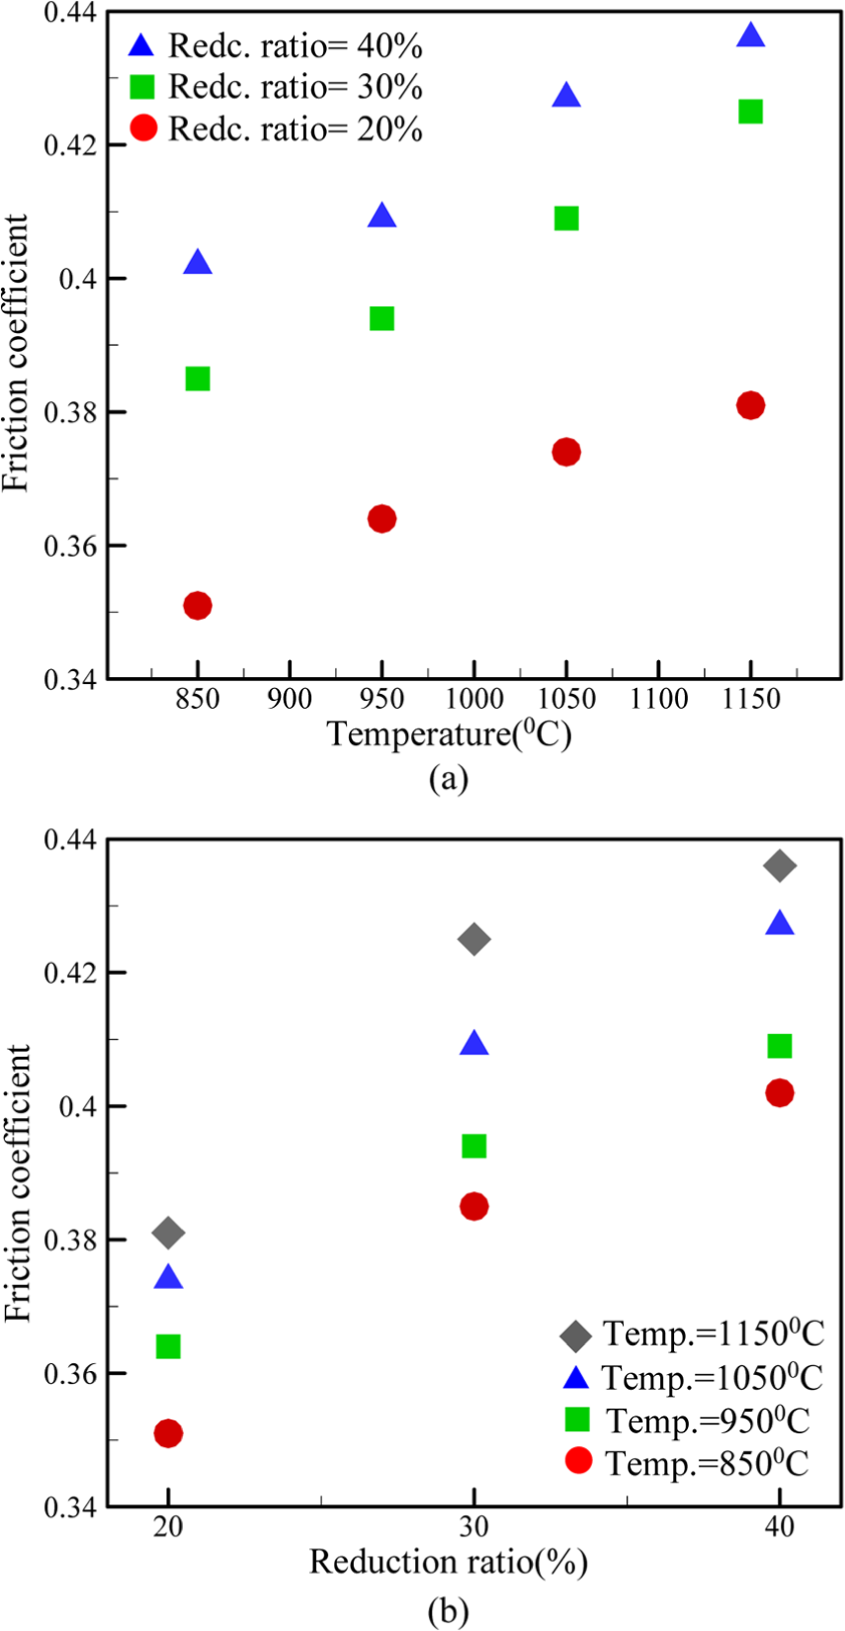
Friction coefficients calculated for (a) four different temperatures (850 °C, 950 °C, 1050 °C, and 1150 °C) and (b) three reduction ratios (20%, 30%, and 40%).
The range of the estimated friction coefficient during hot bar rolling was from 0.35 to 0.44. These values are almost in agreement with the ones evaluated by Lundberg. 34 He measured forward slip in the rolling test with a box groove and converted it into friction coefficient. These values are somewhat higher than the friction coefficient usually used in hot strip and plate rolling. Friction coefficient values in hot strip and plate rolling are usually in the range of 0.3–0.4.11,12 The discrepancy between the friction coefficient values in hot bar rolling and those in hot strip and plate rolling may be attributable to the deformation behavior of the material in the roll gap. In strip and plate rolling, there is little deformation in the direction of the width of the material during rolling. However, a noticeable lateral deformation occurs in hot bar rolling. Frictional forces that resist lateral deformation as well as longitudinal deformation exist in hot bar rolling. Therefore, friction coefficient in hot bar rolling is slightly higher than that in hot strip and plate rolling.
Fast running model for the friction coefficients
Prediction of roll force and torque in hot bar rolling is influenced directly by the value of the friction coefficient. Hence, it is highly desirable for engineers in a hot bar rolling mill to determine the friction coefficient value for the given (or known) rolling conditions, such as material temperature and reduction ratio. Therefore, there is a need for a fast running model that outputs the value of friction coefficient in a second, when an arbitrary material temperature and reduction ratio for a pass (stand) are provided as inputs.
The fast running model was formulated by examining the relationship between the estimated friction coefficients and rolling conditions (i.e. temperature and reduction ratio). Hence, the estimated friction coefficient was expressed by a two-variable linear function as follows

Here, α, β, and γ denote the coefficients. These coefficients are determined by applying the least square method 35 to the data in Figure 11. Substituting the determined coefficients into equation (13) gives
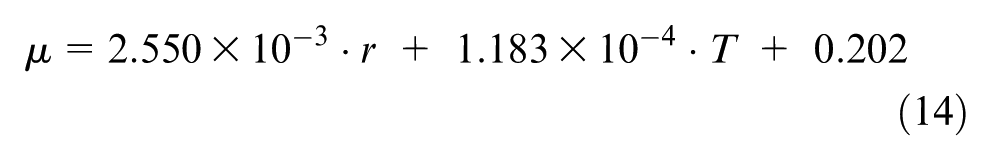
where T and r stand for temperature in Celsius and percent reduction ratio. Equation (14) indicates that a friction coefficient can be determined explicitly if an arbitrary material temperature and reduction ratio for a pass (stand) are specified.
Figure 12 shows a friction coefficient plane as a function of temperature (T) and reduction ratio (r). This plane is plotted based on equation (14), that is, the fast running model. Solid-circle symbols denote the friction coefficients estimated by the FE-based inverse approach, which were in reasonable agreement with the plane of the friction coefficient.
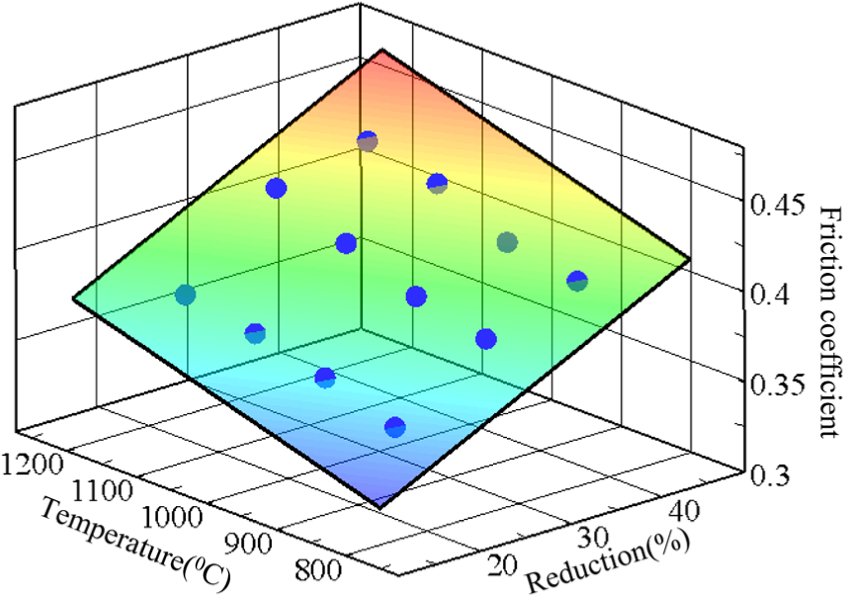
Values of friction coefficient (marked by solid-circle symbols). Plane of friction coefficients is plotted based on the fast running model representing the relationship between the friction coefficients and the rolling conditions (i.e. temperature and reduction ratio).
Figure 13 shows the validity of the proposed fast running model. The abscissa indicates the friction coefficient estimated by an FE-based inverse approach, and the ordinate provides the friction coefficient calculated by the fast running model. If the symbols are positioned along the solid line, then the fast running model shows good linearity. The dashed line represented by the “+5% line” shows that the friction coefficient calculated by the proposed fast running model is higher than the friction coefficient estimated by an FE-based inverse approach. However, the dashed-dotted line represented by the “−5% line” illustrates that the friction coefficient predicted by the proposed fast running model is lower than the friction coefficient estimated by the FE-based inverse approach. Deviations within ±5% were observed. Hence, the proposed fast running model can be a convenient tool for engineers in hot bar rolling mill to quickly assess the friction coefficient of material for the given temperature and reduction ratio. This model is always valid if it is applied to the hot bar rolling process. However, its usage is restricted to the situation in which steel (ASTM E52100) is rolled, and the property of the work roll is ductile cast iron. The fast running model has an accuracy of 95% in predicting the friction coefficient, compared to estimations by the FE-based inverse approach.
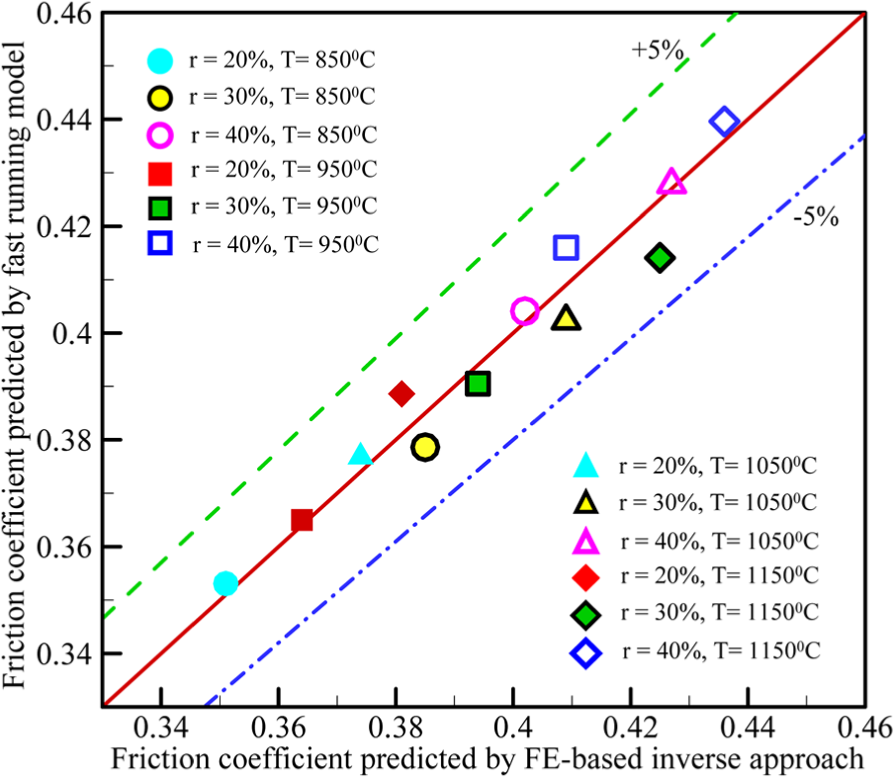
Comparison between the values of the friction coefficient predicted by the fast running model and those predicted by the finite element–based inverse approach.
Concluding remarks
In this article, spreading of material during hot bar rolling has been used as a basic parameter for estimating the friction coefficient of a material (ASTM E52100) when the material was rolled at temperatures ranging from 850 °C to 1150 °C and reduction ratios of 20%–40%. The fundamental idea considered in this study is that the friction coefficient can be estimated by minimizing the difference between the spreading measured from a hot bar rolling test and that predicted by FE analysis. The RSM was used to minimize the difference. The conclusions are as follows:
It is possible to estimate the friction coefficient in hot bar rolling by selecting the spreading of material as a basic parameter and minimizing the difference between the measured spreading and the spreading computed by FE analysis.
The effect of temperature variation on the friction coefficient is greater at higher reduction ratios than at a lower reduction ratio.
The estimated friction coefficient values (0.35–0.44) are higher than the friction coefficient values (0.30–0.40) typically encountered in hot strip and plate rolling, since there is considerable lateral deformation of a material in hot bar rolling.
The fast running model proposed in this study could become a convenient tool for engineers in industry, since it can be used to quickly determine the friction coefficient for an arbitrary material temperature and reduction ratio for a pass (stand).
Footnotes
Declaration of conflicting interests
The author(s) declared no potential conflicts of interest with respect to the research, authorship, and/or publication of this article.
Funding
The author(s) disclosed receipt of the following financial support for the research, authorship, and/or publication of this article: This work was supported by the Dong-A University research fund.