
Abstract
Measurement and quality control of turbine blades is critical to the successful operation of power plants. It has a key role in manufacturing and reverse engineering. Novel technologies continue to be developed to measure parts with complex geometries, such as turbine blades. Digitizing techniques, using both contact and noncontact methods, are used. Selecting the most appropriate digitizing method for a turbine blade requires consideration of the measuring performance of the alternative methods, including criteria such as accuracy, speed and cost. This study seeks to evaluate the practical accuracy and efficiency of various contact and noncontact digitizing methods through measurement and associated quality control of a complex part, that is, a turbine blade airfoil. Four popular technologies, using distinct underlying measurement methods, were chosen to measure a Frame 5 gas turbine blade, namely, a touch trigger probe mounted on a Zeiss coordinate measuring machine, a touch scanning probe and a spot laser probe separately mounted on Renishaw coordinate measuring machine and a linear laser system from ZScanner. The measured point cloud resulting from each method was then used to reconstruct three-dimensional computer-aided design models of the blade. The accuracy of each measuring system was evaluated against the original blade. The evaluation incorporated a comparative study of design parameters derived from the point cloud and reconstructed surfaces associated with each measurement method. The maximum error of point clouds were −123, 2530 and 2173 µm for the ZScanner linear laser, Renishaw spot laser and Renishaw touch scan, respectively. These measured errors indicated higher accuracy from linear laser method than spot laser scanning and touch scanning methods. Furthermore, the achieved standard deviations of 42, 170 and 269 µm for point clouds of ZScanner linear laser, Renishaw spot laser and Renishaw touch scan, respectively, showed that the manufacturer reported that information cannot be always reliable.
Introduction
Turbine blade design engineers place a far higher importance on the blade’s aerodynamic performance than its geometric shape. In general, when a new blade design is developed, significant time and funding is required to complete the analysis and testing to achieve the sought properties.1,2
When approving technology development programs, companies focus on issues about the most significant impact of cost, for example, reduction of hardware costs, design and redesign costs and reduction of expensive preproduction performance test through the implementation of numerical simulation and concurrent simultaneous engineering.
This article reports on an investigation that seeks to improve the engineering design process, which to a large extent now is computer based. The design process in aero-engine design is fundamentally driven by physical properties of the components. All these properties are estimated by various numerical simulation methods such as finite element method (FEM), computational fluid dynamics (CFD) and crack propagation calculations. On the design side, engineers are using more advanced computer-aided design (CAD) system features. 2 In order to process iterative changes and adjustments, applying different and iterative simulations and tests on a turbine blade within the entire development cycle, reverse engineering (RE) has the potential to offer efficiencies to the overall development program. In addition, RE is the primary method to collect the essential data and reproduce a part, when the technical data, engineering drawings and design information of the part are not available.1,3–6
A turbo-machinery blade design is an iterative process, where a number of (sometimes competing) targets have to be met. A turbine blade has close dimensional and geometrical tolerances and is made from alloys and is typically manufactured by investment casting. The accuracy of the resulting wax patterns directly determines the dimensional accuracy of the molded metal blades and the subsequent finishing process.7–9
Usually, the blade surface is generated from a set of two-dimensional (2D) sections stacked over different heights to a complete three-dimensional (3D) blade in a smooth and aerodynamically efficient way. The simplest way of stacking the section curves is on a series of parallel section planes. Each section curve is divided into four parts: leading edge, trailing edge, suction side and pressure side.2,10
The produced turbine blades often experience the deviations of the actual part profile from its design model due to the imperfections caused by different manufacturing operations and external object impact. Therefore, to inspect the deviations or repair the damaged blades, it is necessary to reconstruct the surface model of the actual blade. 11
At present, a range of alternative metrology instruments are used for quality control and RE of complex parts that incorporate nonalgebraic parametric surfaces to ensure that the geometric tolerances required by the designer are being maintained. This is critical for precise aerodynamic parts, such as turbine blades, where variation from the designed shape can have a significant detrimental effect on subsequent performance and associated in-service operating expenses, if not detected prior to installation.
Metrology devices use either a contact or noncontact means of digitizing the surface properties of complex parts. 12 During the digitizing process using noncontact devices, some problems may be encountered, including unexpected light disturbance and invisible occluded surface regions, which would make the scanning results error prone and can have an associated reduction in measurement accuracy. Moreover, these methods tend to offer superior digitizing rates, and from the surface modeling point of view, the large amount of surface data is not easily modeled by current CAD systems.13,14 However, coordinate measuring machines (CMMs) applying touch probes are widely used as the preferred method of digitizing the part geometry. The main limitation with touch probes is the time required for digitizing.14,15 Although offering slower digitizing rates, contact methods have the potential to offer higher accuracy and precision.3,4,16 Therefore, RE in the last years has focused on hybrid systems which blend the advantages of both contact probes and noncontact scanners.14,17,18
Background
The first step in turbine blade production technology is preparing an operational plan. Without adequate information and design documents, RE may prove both helpful and challenging technique simultaneously. RE refers to creating a CAD model from a physical part. The first step of the RE process is to capture information describing the physical component’s features. The 3D industrial scanning equipment is used to digitize the component shape and compute a cloud of points that fully define the object’s surface features.8,19,20 RE is limited to the quality of the measurement and complementary computer-aided modeling activities. 14 RE of a turbine blade involves all stages of obtaining point cloud from blade surface, conversion of captured points to triangular mesh, optimization of triangular mesh and 3D model reconstruction. Furthermore, the most difficult to understand part of an axial gas turbine blade is the airfoil. The airfoil of a blade is a 3D free-form shape, which plays the main role in the performance of the whole turbine. A small change in the airfoil geometry can lead to a significant change in turbine performance. Therefore, becoming familiar with the analysis of every minor detail of the blade shape is critical to the successful performance of metrology specialists. 5 This study concentrates on the first step, namely, the measurement and extraction of its surface data as point cloud on airfoil of a gas turbine blade. Previous studies on RE and design parameters of turbine blade, and comparative studies of corresponding measuring systems, have been reported. The following paragraphs offer a summary of significant studies in the available literature.
Extracting parametric geometry of an airfoil from digitized information has been investigated. For example, Zhang et al. 10 have developed a mathematical model for leading and trailing edges of turbine blade using extracted point cloud of a blade. This article presents a novel method of curve fitting through the captured points and compares its accuracy with another method; however, there is no data about the accuracy of digitizing process itself. Therefore, digitizing errors could have influenced the accuracy of the subsequent curve fitting. Studies into the parametric design of turbine blades based on design intent have been reported.2,21–23 More specifically, Mohaghegh et al.5,24 reconstructed a distinct class of gas turbine blades based on design intent. Each of these investigations contains some general useful hints on digitizing, surface reconstruction methods and design aspects of a blade but does not actually show how to deal with digitizing selection criteria for a part with a complex geometry that is critical to design performance.
Bagci 4 has used RE to reproduce a turbine blade from defected and worn parts. He used a contact CMM to achieve point clouds and processed the cloud data to regenerate an appropriate model. The study mainly focused on surface reconstruction of damaged parts and discussed essential approaches and the algorithms used. Bagci did not consider the errors that may occur due to either systematic or random errors associated with digitizing machines.
A hybrid inspection method, where two digitizers are employed, offers the potential of exploiting the advantages of both the contact and noncontact apparatus. Chen and Lin 13 applied a noncontact method for producing primary data in order to describe measuring strategy by an accurate contact measuring method. However, there is no reported verification of the performance, accuracy and precision of the devices used. Moreover, due to technical difficulties and additional time-consuming processes, the approach used by Chen and Lin is not practically applicable for industrial applications, especially when iterations are required.
Some prior investigations into the practical scopes and accuracy of digitizers have been reported in the literature, in particular, investigations into the performance of a single digitizer through a measurement process. Valkenburg and McIvor, 25 Rocchini et al. 26 and Skotheim et al. 27 accomplished a measuring process on planar surfaces using a structured light system and maintained the average error of measurement as the result of study. Similarly, the accuracy of different laser systems is reported in the works of Thompson et al. 28 and Son et al. 29 Other researchers attempted to compare two or more different scanning systems, for example, Iuliano and Minetola, 30 where a standard structured light scanner with a laser scanner was compared. Budzik 31 proposed a digitizing process of an aircraft jet engine blade by means of two noncontact devices consist of laser scanning and computer tomography (CT) scan. Comparing characteristics of these devices, the selection criteria of each method were assessed. Barbero and Ureta 32 stated that according to previous studies, it is difficult to set up a reliable standard process for evaluating the uncertainty of the 3D digitizers and the accuracy of the whole RE process. To evaluate the accuracy and the quality of digitizers, Barbero and Ureta have carried out an assessment on five different digitizing systems. All of the devices were selected among noncontact techniques. The chosen apparatuses were applied to digitize some conventional and free-form pieces. The resulted sets of point clouds from each device were converted to mesh models using different software, each belonging to a system. However, they mentioned that it is difficult to compare the meshing quality of each software package, and as such, different final models with free-form and complex surfaces may result. None of the parts measured by Barbero and Ureta required high-precision manufacture. Furthermore, they have checked the dispersion of the point clouds with respect to the fitted surface of that method, which means that the reference of each of objects for each of the methods is different from the others. To have comparable investigation, it is necessary to have a unique reference model for all the methods.
The other similar work studied by the authors focused on comparison of two noncontact scanners. Tóth and Živčák 33 have investigated the results of an optical scanner and a laser scanner through a special specimen they had designed. They clarify that the designed part satisfies scanning criteria using the two types of the 3D scanners, and it does not contain complicated shapes or parts that are not possible to scan using the chosen technologies. Similar to Barbero and Ureta’s work, lack of investigating the contact digitizers is noticeable. Also, relying on the outcomes which are resulted through applying on a special designed specimen, with no complicated surface, is not logical to be used for industrial complex parts. It means that the specimen is designed to cover the capacities of these scanners and maybe is not reliable for the other scanners. Also, the results of this study for these scanners are not reliable for other parts.
Most of the studied literatures about the performance investigation and comparison of digitizers are accomplished for general-purpose applications. Therefore, the studied specimens usually consist of conventional and simple form and surfaces. The authors have learnt from a long experience of working on digitizers and especially in RE of turbine blades that the accuracy and performance achieved through measuring the simple and conventional surfaces always could not be reliable for a complex free-form surface. Also, the maintained accuracies of manufacturers for digitizers, which are all tested using standard tests, do not guaranty the desired accuracies and performances. Therefore, we need to directly investigate the accuracy and performance of digitizers in RE of turbine blade. So, this article is focused on investigation of digitizers’ accuracy in RE of turbine blade and not just investigating the accuracy of some digitizers. None of the above-mentioned studies have compared the accuracy of competing data digitizing methodologies and the associated reconstructed model of a complex surface of a turbine blade. The authors have not found evidence of any prior investigations of this type in the available literature. Moreover, the accuracy of common digitizers that are used to inspect free-form surface of a blade, including both contact and noncontact systems, has not been thoroughly investigated. The aim of the study reported in this article was to practically examine the accuracy and performance of different contact and noncontact measuring methods in RE of a gas turbine blade to identify the most appropriate method for reconstructing the associated optimized surface model of a turbine blade. Rather than following the usual approach of only analyzing acquired point clouds to distill geometric information about performance of an RE system, the authors incorporated sectional parameters of an airfoil into their analysis. To this end, among a wide variety of techniques, some advanced and conventional digitizing methods were investigated. With respect to the conventional imaging strategies that are considered in RE, the surface data of a gas turbine blade were collected and prepared for subsequent steps. Acquired sets of point clouds were processed and converted to CAD models by means of CATIA V5-R20 software package. After surface reconstruction, the resulting 3D CAD models were compared with a precise reference model and then the accuracy of point clouds, reconstructed 3D models and 2D sectional curves was compared.
The RE digitization comparison method reported in this article has been customized for the high-accuracy requirements of turbine blade selection. The comparison method would be applicable to components with similar geometric and tolerancing accuracy requirements. Finally, based on the experimental outcomes of the gas turbine blade study, some general observations, with associated implications about selection criteria for digitizing and surface reconstruction methods, are proposed.
Digitizing methods
The methods used to inspect a turbine blade have evolved over time. Earlier inspection methods include destructive methods using machining and project profilers, nondestructive methods such as the “point-by-point” method to measure the blade’s sectional profiles using an indicator gage with a pointed plunger and checking the sectional profiles of airfoil with rigid profile gages. 34 More recently, destructive methods are rarely used for digitizing because of their high costs, time consumption and lower precision when compared to nondestructive approaches. Selecting the most appropriate method for nondestructive geometry inspection requires consideration of factors including the size and tolerance limitations of the work piece, sought rate of data collection and essential technical skills necessary to successfully operate with the measurement instrument. The most commonly used nondestructive measurement systems can be categorized into two general groups, these being contact systems and noncontact systems.
Free-form surfaces can be categorized with respect to specific features including part size, complexity of form, surface quality and their tolerances. Based on such a categorization, the most appropriate metrology instrument can then be used. When considering turbine blades, most blades are classified as parts with medium size (i.e. typical long dimension in the range of 0.1–10 m). 16 This quite large geometric range of turbine blade size, in addition to their sophisticated shape, allows both contact CMMs and noncontact optical CMMs to be candidates for the geometric digitization of turbine blades for RE.
Contact digitizers
Generally, two main types of contact probes consisting of touch trigger and touch scanning systems are used for digitizing purposes. Generally, it is considered that touch trigger probe (contact) CMM scanners yield higher accuracy.3,16,35 However, the associated measurement is often completed using a slow point-by-point procedure. Therefore, the typical resulting point cloud is limited to thinly distributed points, with approximated intermediate points being needed in the subsequent surface modeling process. Therefore, digitizing using touch trigger probes is slow and time-consuming. Nevertheless, simplicity and ease of controlling a limited number of acquired data points can offer advantages to the overall RE process. Unlike touch trigger contact probes, touch scanning systems with continuous measuring process are faster. However, center points of stylus sphere are always recorded in both contact measurement methods that cause errors in the subsequent digitizing process.15,35–38
Different measurement techniques are used in touch trigger probe heads that usually consist of a kinematic mechanism for holding the stylus and imparting a small deflection to it. This class of sensors tends to use the following technologies: kinematic resistive, strain gage or piezoelectric. Of these, the kinematic resistive probes are most widely used as they have a simple design, are cost-effective and are compact and robust.16,35,39
If the measurement of a surface form is sought, touch scanning systems can be used. The data acquiring rate of touch scanning systems is high enough to enable a time-efficient scan, although vibrations associated with stylus movement due to surface roughness of the part will reduce measurement accuracy.35,39 Scanning probes have two main categories: those with passive sensors and those with active sensors. Passive sensor systems use simple designs with compact and lightweight attributes with associated motor drivers or electronic dampers, no locking mechanism and tare system and no electromagnets. Active sensor scanning probes require complex electromechanical design including force generators, dampers and linear variable differential transformers (LVDTs) with deleterious attributes compared to the passive sensor design: large size, high cost and sensitive and readily damaged sensors.35,39
Noncontact digitizers
In noncontact digitizer probes, point cloud measurement of component surfaces is performed using specific energy sources that are projected onto, then reflected from, the surface of component, for example, visible light, sound and magnetic fields. A noncontact probe requires both a transmitter and a receiver for sending and receiving energy to measure point coordinates on the surface. Optical methods are categorized into five groups: triangulation, ranging, interferometry, structured lighting and image analysis. 6 The precision of laser optical-based probes, which obtains the points very rapidly using triangulation, relies on manufacture quality and calibration certainty and in actual operation the distance between the probe and the surface.
The principal advantages of noncontact digitizer probes versus contact digitizer probes are no physical contact with the part, rapid acquisition of relatively large quantities of points with high distribution density, adequate accuracy and repeatability for conventional applications and ability to scan detailed surface features. Noncontact digitizer probes do have limitations such as inability to digitize surfaces with incompatible colors or components that are transparent or translucent. They can also have insufficient accuracy when attempting to complete a precise digitization. 4
Accuracy of digitizing
The quality of a measurement is assessed by its accuracy. The “accuracy” of a measuring instrument is a qualitative concept that refers to the ability of a measuring instrument to give responses close to a true value, whereas “precision” is a term that describes an instrument’s degree of freedom from random errors.40–42 BS ISO 5725-1:1994 43 defines accuracy as “trueness plus precision,” where “trueness” is the agreement between the average values obtained from a large series of test results and an accepted reference value, and “precision” is the level of agreement between independent test results obtained under the stipulated conditions. 42 Moreover, manufacturers of both contact and noncontact metrology instruments often warn of uncertainty in measuring process for their devices. Uncertainty is described as a quantitative indication of the quality of a measurement result. Without an awareness of the uncertainty associated with a measurement, measurement results cannot be compared either between themselves or in relation to reference or specification values. 6 Uncertainty does not correspond to “error.” Once all the known or suspected components of an error have been assessed and adequate corrections made, there still remains an uncertainty about the value of the stated result. 40
A measurement corresponds to the true geometric value sought with an inevitable associated error. The error typically consists of a systematic error and a random error. In order to minimize measurement error, corrections must be applied to minimize systematic errors, and measurement repetition can reduce random errors. 40 Errors are inevitable in both the digitizing and surface reconstruction processes. Therefore, to access the total uncertainty of an RE process, errors introduced at all the stages of the process must be considered. During the measurement and data acquisition stages, significant errors may arise from the following sources. The probe head and measuring instrument can introduce systematic and random errors associated with misalignment of probe and measuring parts, errors due to measurement of a part in more than one configuration due to part dimensions that are inaccessible from one measuring configuration and modeling errors within the surface modeler software. These errors can be reduced with regular calibration of the measuring instrument, robust measuring protocols with enforced adherence and software benchmark evaluation. All digitization procedures reported in this article adhered to BS ISO 5725-1:1994, incorporating extraneous error reduction techniques to ensure that the comparative study does not have inherent biases due to these errors. For example, digitization was completed in an environmentally controlled situation, and the technician completing the digitization (M.M.) was fully trained in the use of each method before the experimental digitization occurred to minimize the impact of human error in the comparative study.
When using contact digitizing methods, probe radius variation error can have a significant deleterious impact (i.e. the stylus tip spherical surface, and not the center point of the stylus, measures the point coordinate with an associated offset, as shown in Figure 1). This error can be readily compensated with a measuring protocol that requires an offset associated with the stylus tip radius when the touch trigger probe stylus axis is perpendicular to the measurement surface. The other form of this error occurs when the probe stylus axis is not perpendicular to the surface at the contact point; this can occur in both touch scanning and touch trigger probes. In this circumstance, compensation in the direction of the probe stylus axis will lead to erroneous results. A schematic representation of this issue is illustrated in Figure 1(a). One way to avoid this error is to approach the surface in a perpendicular direction and use this vector for offsetting (Figure 1(b)). 16
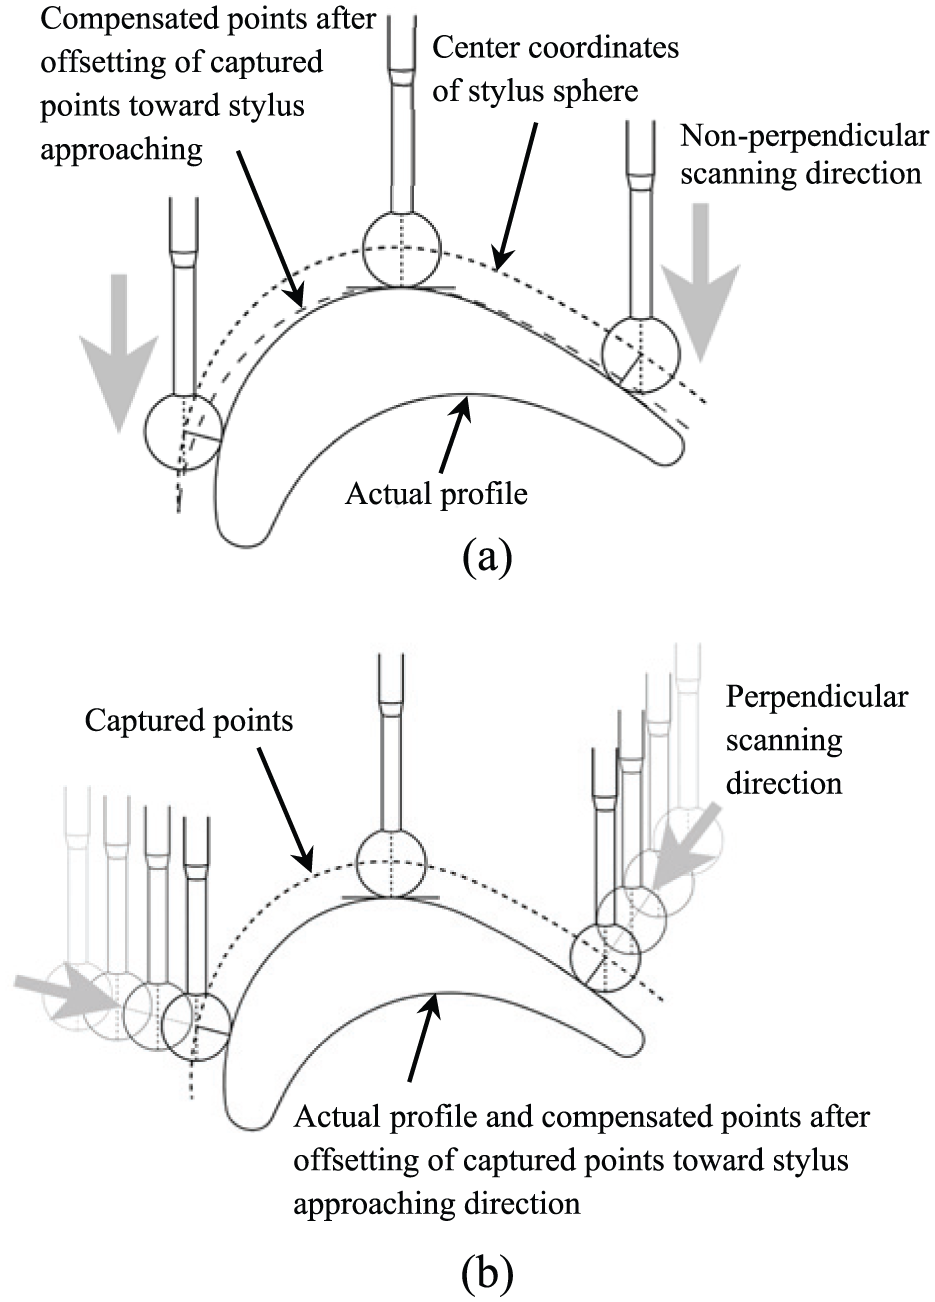
(a) Correct and (b) incorrect contact stylus probe approach protocols when digitizing a surface.
If normal tracking is not possible, error compensation should be applied after measuring and through software calculations. There are several methods for tip radius post-correction that estimate the contact point and can be divided into three groups: methods using the information on the reciprocal position of neighboring indicated points, methods using the information retrieved from the force transducers of active scanning probes and methods based on the CAD model of the measured surface.15,36–38
Some of the stated errors in contact probes can also occur in noncontact instruments. However, the causes of issues may differ. Measuring tool error of optical measurement systems in free-form surfaces appears due to slope, nonuniformity of texture, color and surface transparency in which the reflected radiation from the surface may be received to the probe sensor with distortion. Therefore, accuracy of a laser scanner as an electro-optic and triangulation-based instrument is influenced by different phenomena such as random errors including spot noise caused by interference and repeatability of the CMM’s motion system and systematic errors such as wrong interpretation and laser imaging reproducibility.
Measurement process of the turbine blade airfoil using four digitizing methods
To comparatively evaluate the performance and accuracy of different digitizing systems, a case study has been completed where four different digitizing methods were used to measure an object with precise but sculptured surfaces—the airfoil of a gas turbine blade, more specifically, a turbine blade from the second stage of the “Frame 5” gas turbine (a 26- to 30-MW gas turbine manufactured by General Electric; Figure 2). Four digitizing methods were employed to represent different contact and noncontact techniques. The general characteristics of these digitizers are described in Table 1.
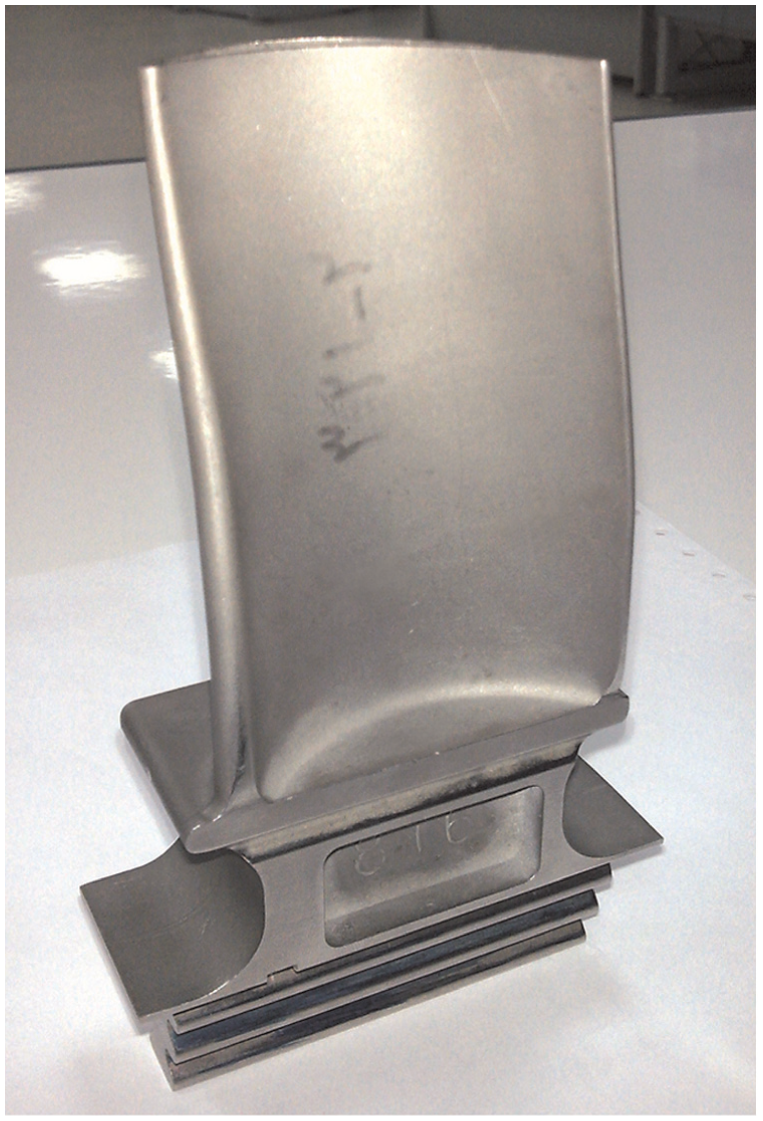
Gas turbine blade used in the case study—used in the General Electric “Frame 5” gas turbine.
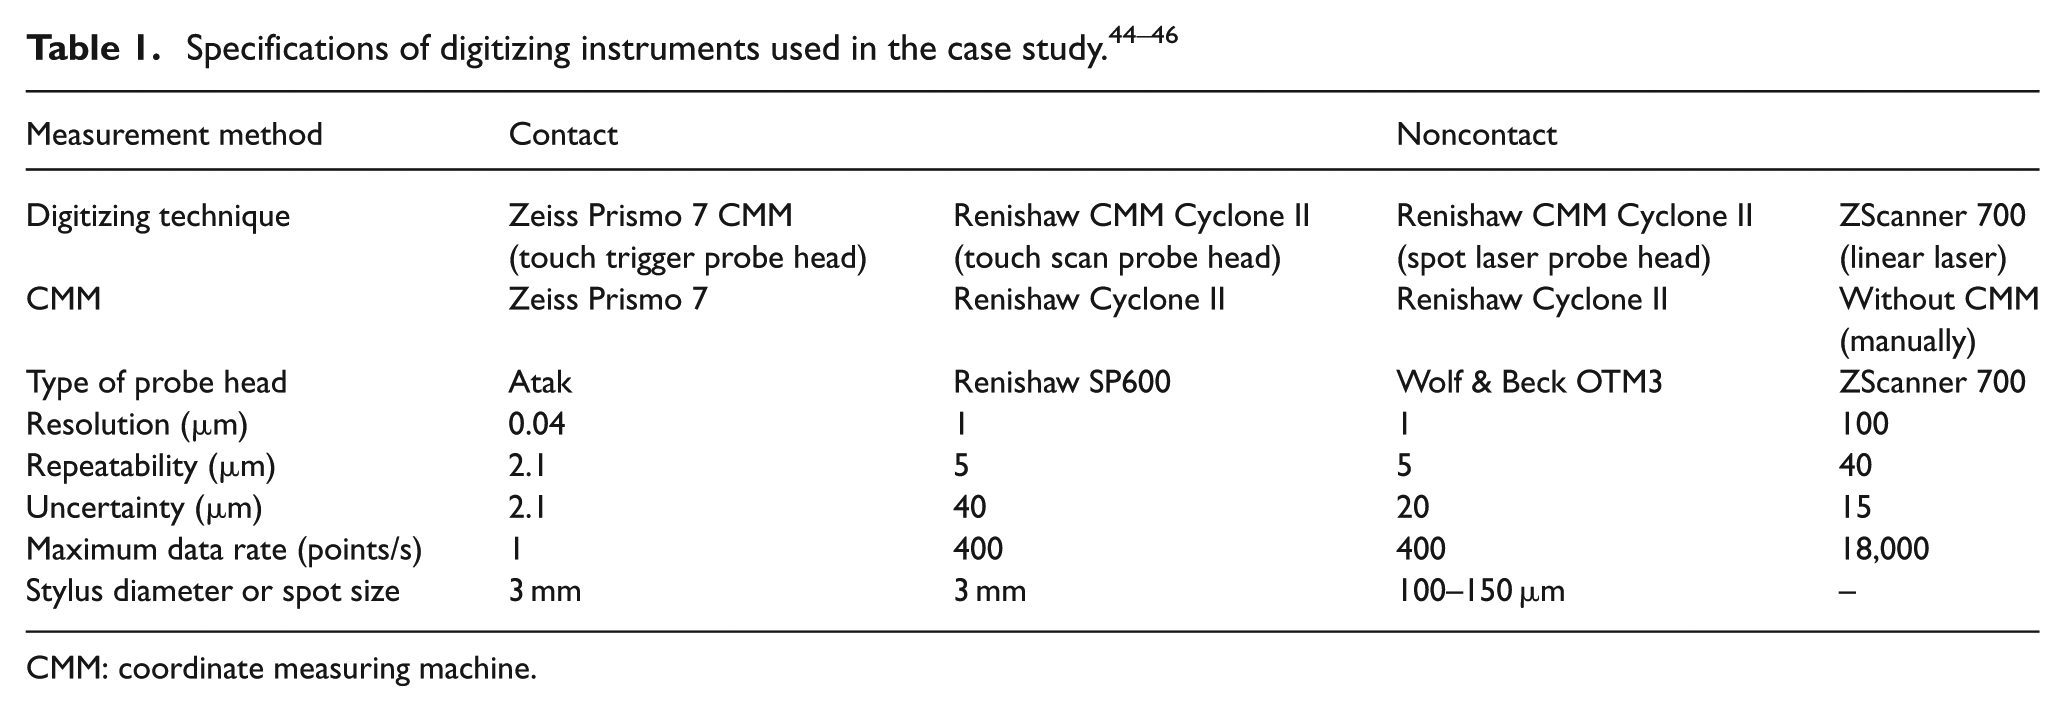
CMM: coordinate measuring machine.
Environmental variations of humidity and temperature can adversely affect the effective function of digitizers and the associated digitization results. As such, all work reported in this article was carried out in an instrumentation laboratory with standard atmospheric conditions monitored to ensure minimal variation. The movement accuracy of CMMs was calibrated using a ML10 laser interferometer. The probe heads mounted onto each CMM was calibrated using the standard accessories provided by the manufacturer. The authors made every effort to ensure that random, avoidable errors were minimized while completing each blade measurement digitization.
Zeiss Prismo 7 with Atak probe head
The first instrument used to measure the blade was an Atak touch trigger probe head mounted on a Zeiss CMM. To facilitate the Zeiss digitization, the airfoil surface was digitized in 10 sections with 10 mm equal spacing between sections. To achieve an efficient data gathering digitization, and to record all the geometric details of the airfoil, a resolution of 0.03 was used with reference to the length of airfoil chord for suction and pressure surfaces, and a resolution of 0.01 was used with reference to the length of the airfoil chord for leading and trailing edges. 5 The Zeiss Prismo 7 CMM is equipped with Holos digitizing software, which provides the measurement of point coordinate when approaching normal to the surface. By manually introducing the digitizing area in each of the four regions of the blade, Zeiss interpolates a preliminary surface and imaginary curves to carry out an accurate measurement. Because of the necessity to approach the surface in a perpendicular fashion, the resulting measurement is then free of stylus tip radius error. Because the center of stylus sphere is recorded as the contact coordinate, the actual coordinate points have to be offset in the approaching direction to the extent that stylus radius leans toward the surface. The captured point cloud and the measurement setup by Zeiss CMM are illustrated in Figure 3.
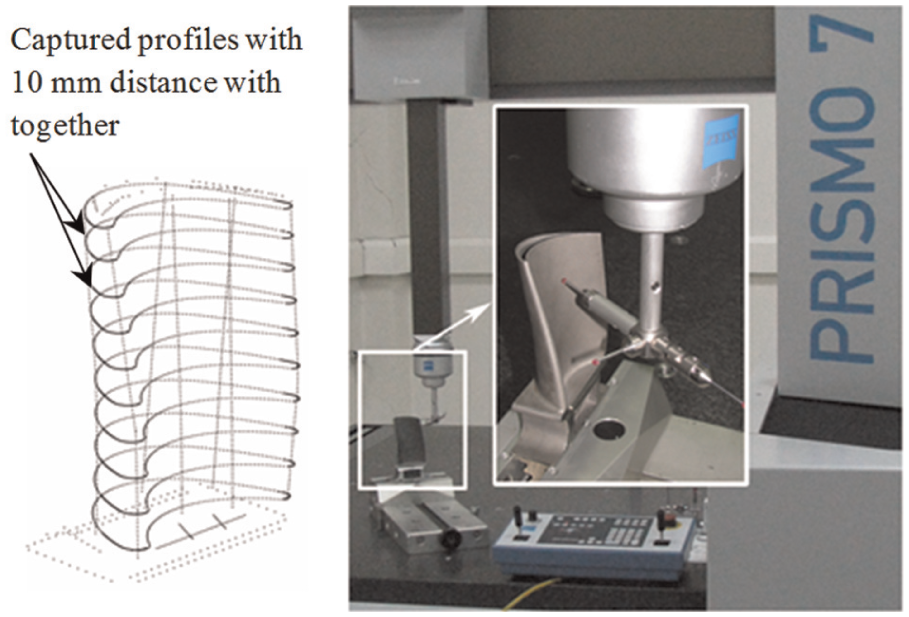
Data digitizing of turbine blade airfoil shape using Zeiss touch trigger CMM.
The process of setting up, calibration and digitizing the turbine blade airfoil according to BS ISO 5725-1:1994 using the Zeiss CMM required 8 h of a trained technician’s time. The method has inherent low speed of scanning due to its touch trigger probe. In addition, setup preparation required far more time compared to the other digitization methods in this study. Four reorientation setups were required to enable the entire airfoil to be digitized.
Renishaw Cyclone II with Renishaw probe head
Renishaw Cyclone II CMM is another commonly used CMM for inspecting and RE purposes. This CMM was equipped separately with a touch scanning probe head and a spot laser probe head. The Renishaw SP600 contact scanning probe head was used to complete a second contact trial (Figure 4). As was the case for the Zeiss CMM, to digitize the entire airfoil surface, a series of different views were required. An automatic rotary indexer (Renishaw RX10) was available on this machine implementation. The rotary indexer reduced the number of setups required to enable probe head access to the entire blade. A total of seven reorientation setups were required for this Renishaw digitization, with an overall time commitment of 4 h.
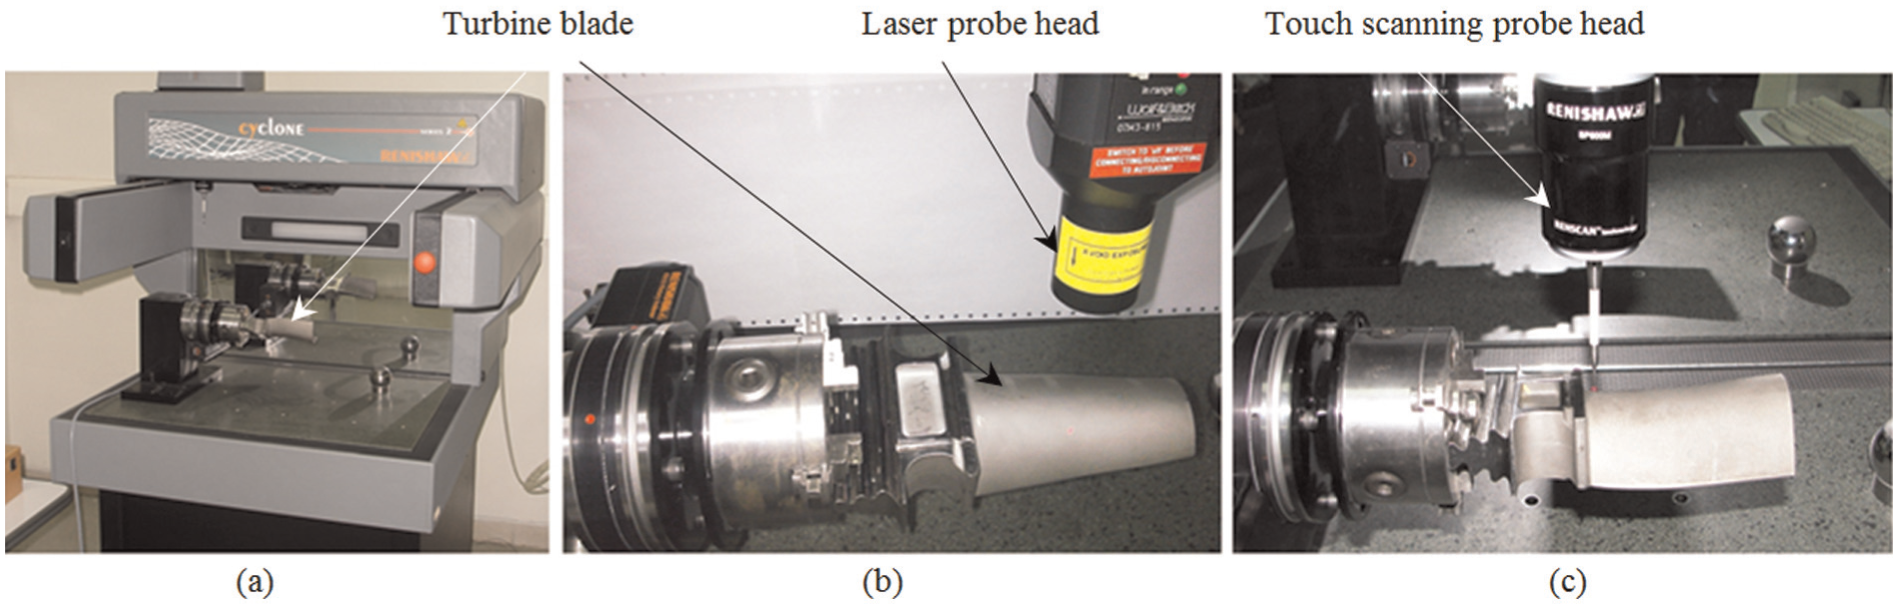
(a) Renishaw CMM, (b) spot laser probe head and (c) touch scanning probe head.
Renishaw Cyclone II with Wolf & Beck probe head
The Renishaw Cyclone II CMM was then used with a Wolf & Beck OTM3 spot laser scanning probe head. This laser probe head uses a “circular triangulation” technique to complete a surface digitization, where a laser beam is reflected off the object’s surface and into a sensor. 32 Unlike the “simple triangulation” method, in which a laterally arranged lens receives the reflected laser light, circular triangulation uses a ring-shaped (symmetrical) optical lens, arranged concentrically around the measurement beam. This enables the reflected light to be recorded in a cone-shaped pattern and not merely from one direction in space. Reflections from the object are averaged to calculate reliable distance values. Using this circular triangulation laser probe in combination with the available Renishaw RX10 rotary indexer, seven reorientation setups were required for this digitization, with an overall time commitment of 3 h.
Although the uncertainty, resolution and repeatability of the Wolf & Beck laser probe head itself are declared as 7.5, 0.3 and 1.5 µm, respectively, the overall uncertainty of the probe head accompanying the Renishaw CMM is specified at 20 µm. 45
Hand-held (manual) ZScanner 3D digitizer
The ZScanner 700 is a hand-held (manual) “linear laser” system that is not mounted on a CMM or FaroArm. As was the case with all the previously described methods, digitizing using the ZScanner required several reorientation setups. To synchronize and register the data captured dynamically from different views, the ZScanner relied on targets placed on the blade’s surface by the technician. The stitching (synchronize and registering) of digitized data was completed automatically using ZScanner software. Moreover, to diminish digitization noise, the ZScanner relies on blade airfoil surfaces being painted with a fine-grained white spray. A technician completed both these preparatory tasks prior to digitization. Just one setup was required for blade airfoil digitization using the ZScanner, with an overall time commitment of 1 h to complete the digitization according to BS ISO 5725-1:1994. Figure 5 shows the ZScanner, a view of the digitized blade showing two of the required white targets and a sample digitized point cloud.
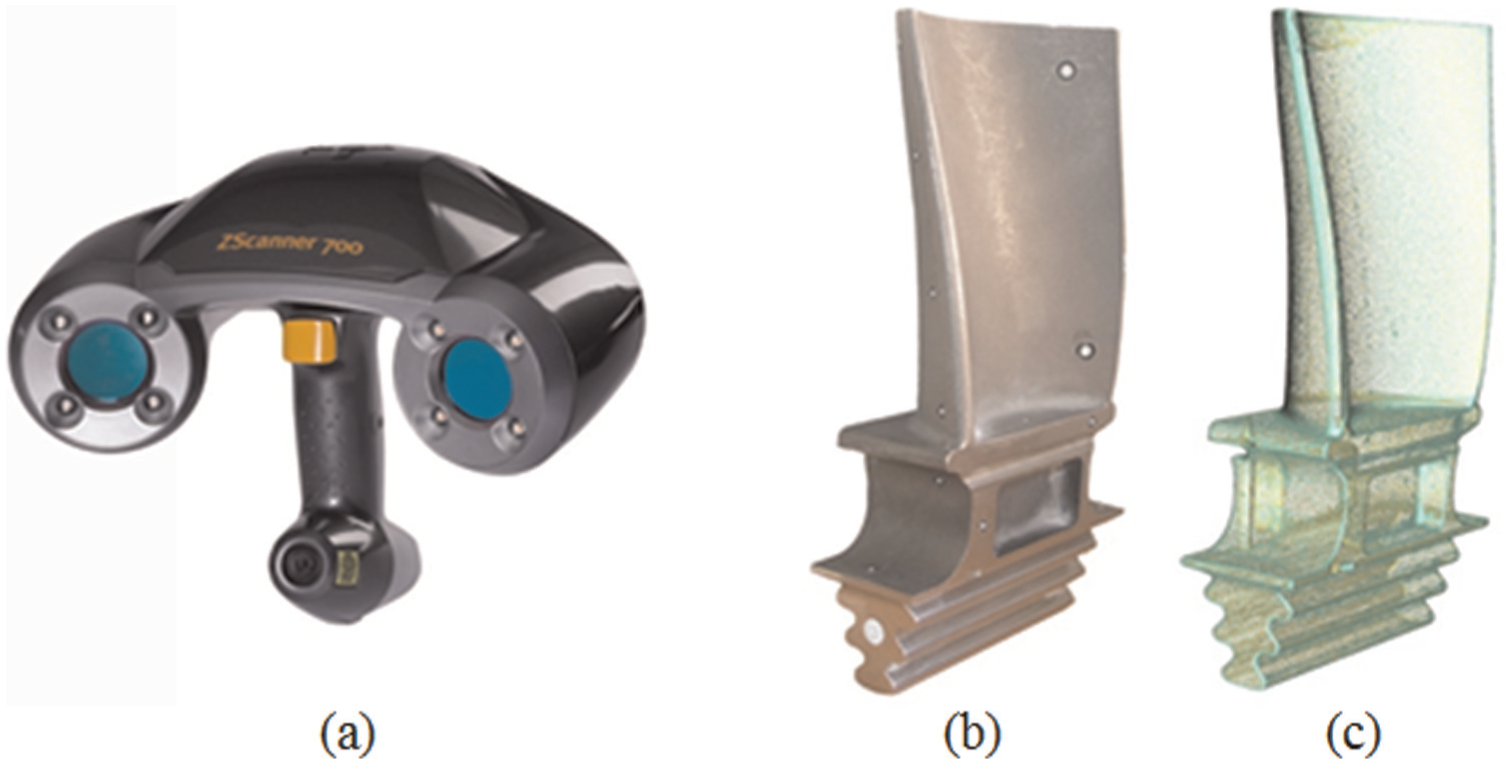
(a) ZScanner 700 linear laser digitizer used by the authors, (b) turbine blade with white targets shown and (c) resulting digitized point cloud.
Surface modeling of the blade using captured point cloud
Surface modeling using the digitized point clouds was completed using commercial CAD software (CATIA V5-R20). Depending on the properties of the specific point cloud, the surface (and eventual solid model) preparation will include different stages including sampling to eliminate redundant points, repairing and registering operations. Then, a surface model is reconstructed using either the “surface method” or the “curve or section method” within CAD software. In the surface method, a synthetic surface is fitted directly from the point cloud. Nonuniform rational B-spline (NURBS) is one of the widely used synthetic surfaces that can be used in both RE and designing purposes.16,47 In the curve method, the extracted curves from iso-planar surfaces are used to form the model by fitting a surface into the profiles using lofting or sweeping techniques. The profiles can be synthetic curves such as B-spline or NURBS, which are interpolated from the captured points.16,48
As the intention of this study was to evaluate the accuracy of point clouds and associated post-processed surfaces, only essential repair actions were completed so as to minimize either deleterious or ameliorating impacts on the final assessed surface. To ensure that captured points were explicitly included in the final assessed surfaces, interpolating curves and surfaces of NURBS were applied rather than approximating methods.
Creating a dense point cloud using the Zeiss CMM is very tedious and time-consuming. As such, point clouds from this system tend to be thinly distributed. A thinly distributed point cloud has the disadvantage that the surface method is not able to produce an acceptably uniform surface model, and the reconstructed airfoil surface texture had poor smoothness. Overall, the RE surface was evidently different from the real surface. Consequently, the surface reconstruction of the blade from the Zeiss CMM point cloud was performed using the curve method. This follows the essential procedure used when actually designing an airfoil of a turbine blade.2,5 A total of 10 NURBS curves were interpolated from the points of captured blade sections. Then, using a sweeping technique, a 3D surface model was fitted to the profiles.
A compensation process was required as the Zeiss CMM records the center point of the stylus sphere as the contact point. As discussed earlier, this is achieved by applying an offset as stylus tip radius (Figure 1). The preliminary reconstructed airfoil surface and its modified format, after offsetting, are shown in Figure 6. For all the other digitizing methods discussed in this article, the surface modeling process was performed in a similar manner to that described for the Zeiss CMM.
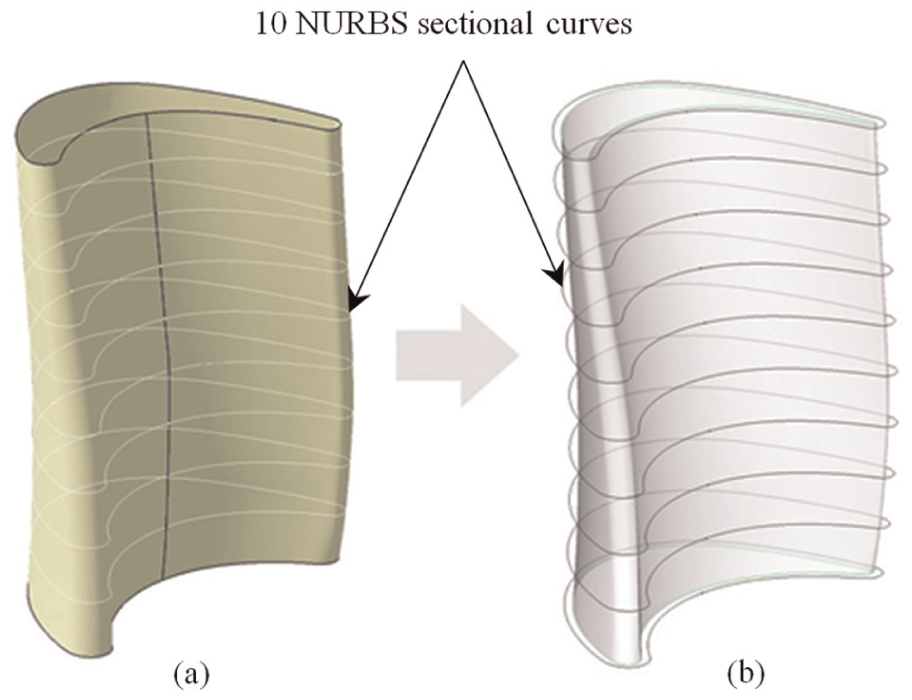
Reconstructed airfoil surface from captured points by Zeiss CMM (a) before and (b) after offsetting.
Comparative study of digitizing methods
This comparative study of the relative accuracy of the four available digitizing methods in RE of a turbine blade includes the constraint present in a majority of RE activities, that is, only a reference part is in existence with the original design information being no longer available. In addition, geometrical deviations of a manufactured part make it different from the CAD model, and we did not intend to find the manufacturing deviations from the CAD model. However, the results of our study will help to choose the effective method and instrument to evaluate such deviations in RE of turbine blade and other similar specimens having complex free-form surfaces. The authors needed to have a reference 3D model of studied turbine blade to investigate the performance of digitizers. Thus, we had to use one of the reconstructed 3D models, similar to work of Persson et al. 49 To find the satisfying model, the Pugh 50 method was used, which requires that one of the four digitizing methods be chosen as the datum used to create the reference model. The Zeiss CMM with touch trigger probe head has the highest specified accuracy (Table 1) and also the highest measurement repeatability (about 5 µm) obtained through various measurements on airfoil profiles. As such, the Zeiss CMM with touch trigger probe head was chosen as the datum digitization method. This choice was independent of measuring speed, cost considerations and the other comparative parameters.
Quality of the captured data of utilized methods
The point cloud and the reconstructed surfaces of the three alternative digitization methods (i.e. Renishaw spot laser, Renishaw touch scanning and ZScanner linear laser) were compared with the Zeiss CMM reference model using commercial metrology software Geomagic® Qualify™. The point clouds and the reconstructed surfaces were precisely aligned with the reference model to enable deviations to be readily identified. To achieve an accurate alignment, the iterative closest point (ICP) algorithm was used. The alignment process was performed manually by selecting the same points on the reference and alternative objects.
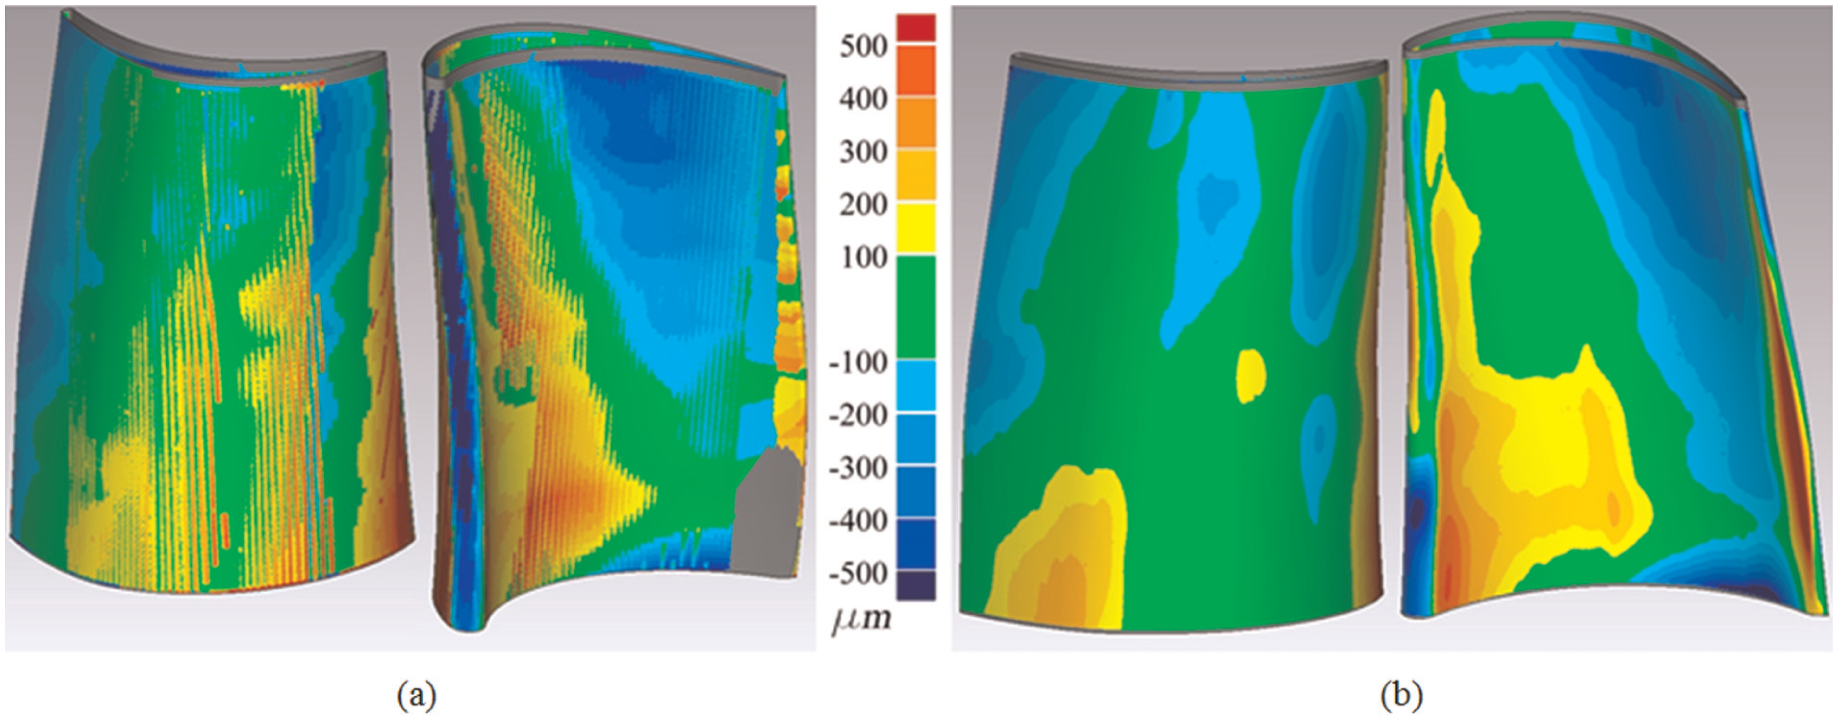
Savio et al. 16 report on acceptable measurement deviations in turbine airfoils: the range of −100 to +100 µm is regarded as the best, which is demonstrated with green color, and the range of −500 to +500 µm is regarded as acceptable. Outside the introduced range, meaning below the deviation limit of −500 µm (dark blue in Figures 7–9) and over the maximum material limit of +500 µm (dark red in Figures 7–9), is regarded as unacceptable. These ranges were applied to this comparative study.
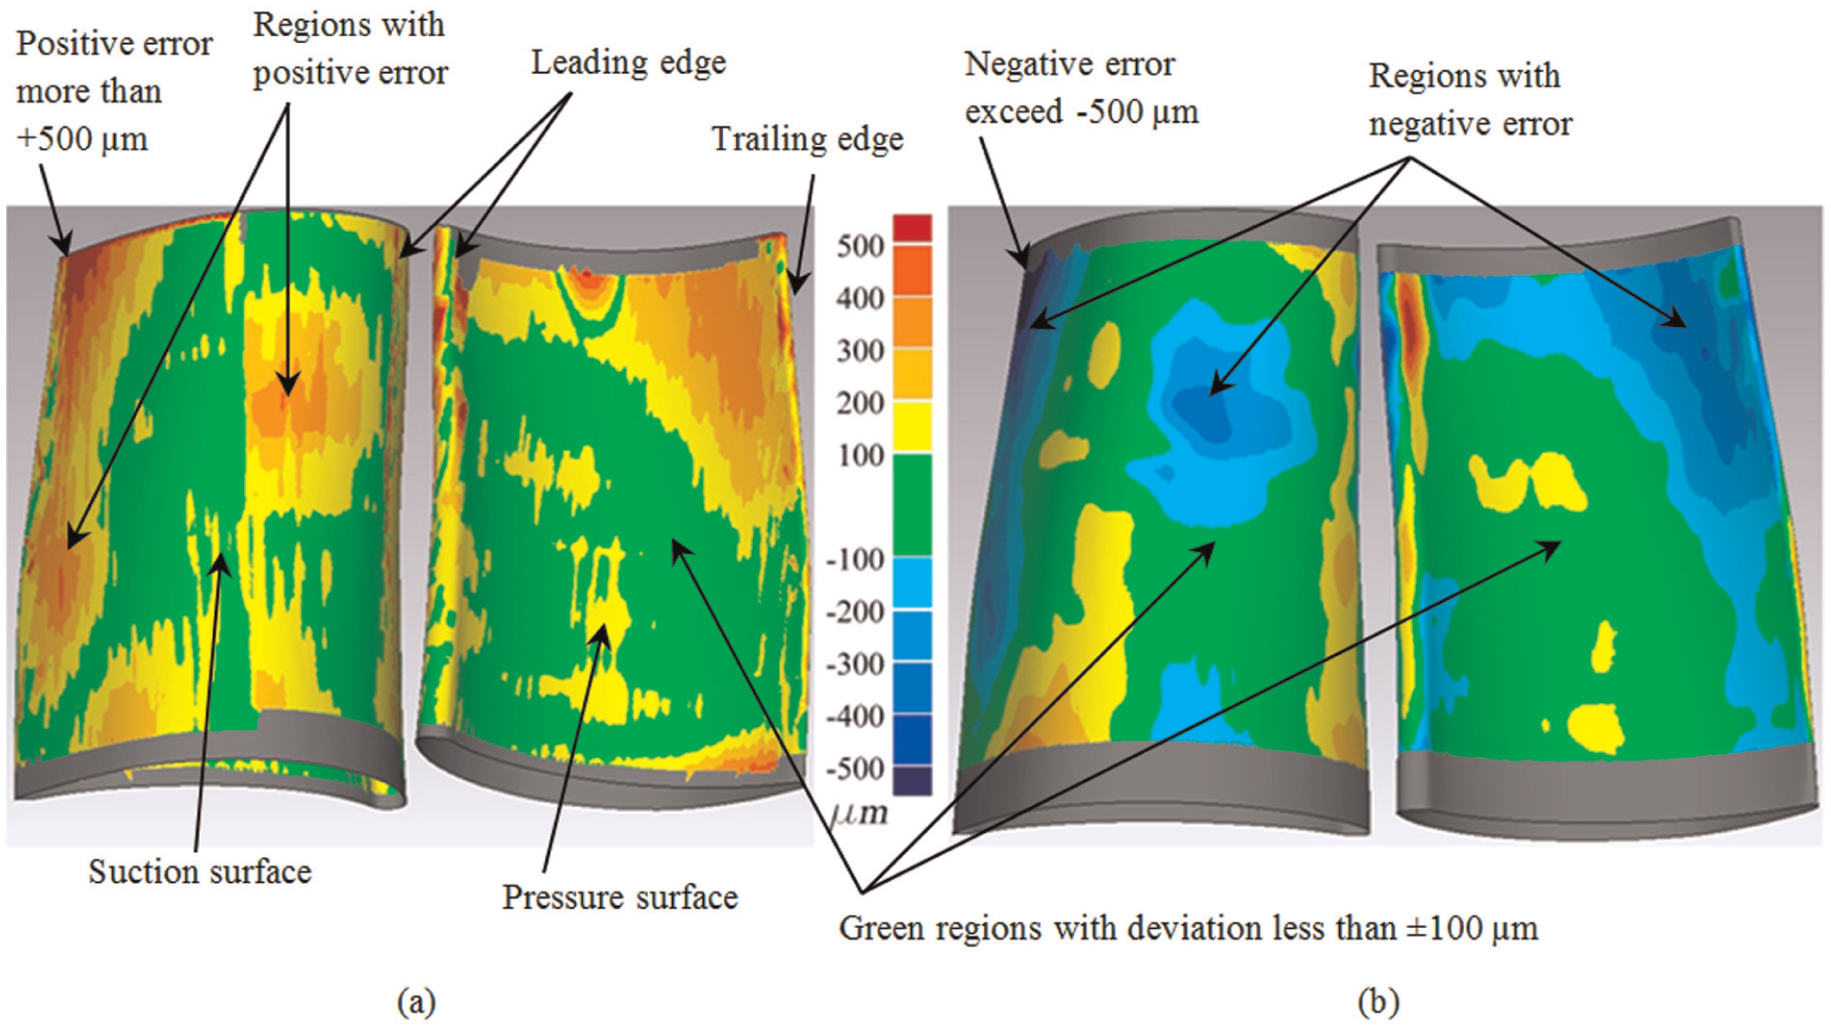
Error map of (a) point cloud and (b) surface model of the Renishaw laser method.
Error map of (a) point cloud and (b) surface model of the Renishaw touch scanning method.
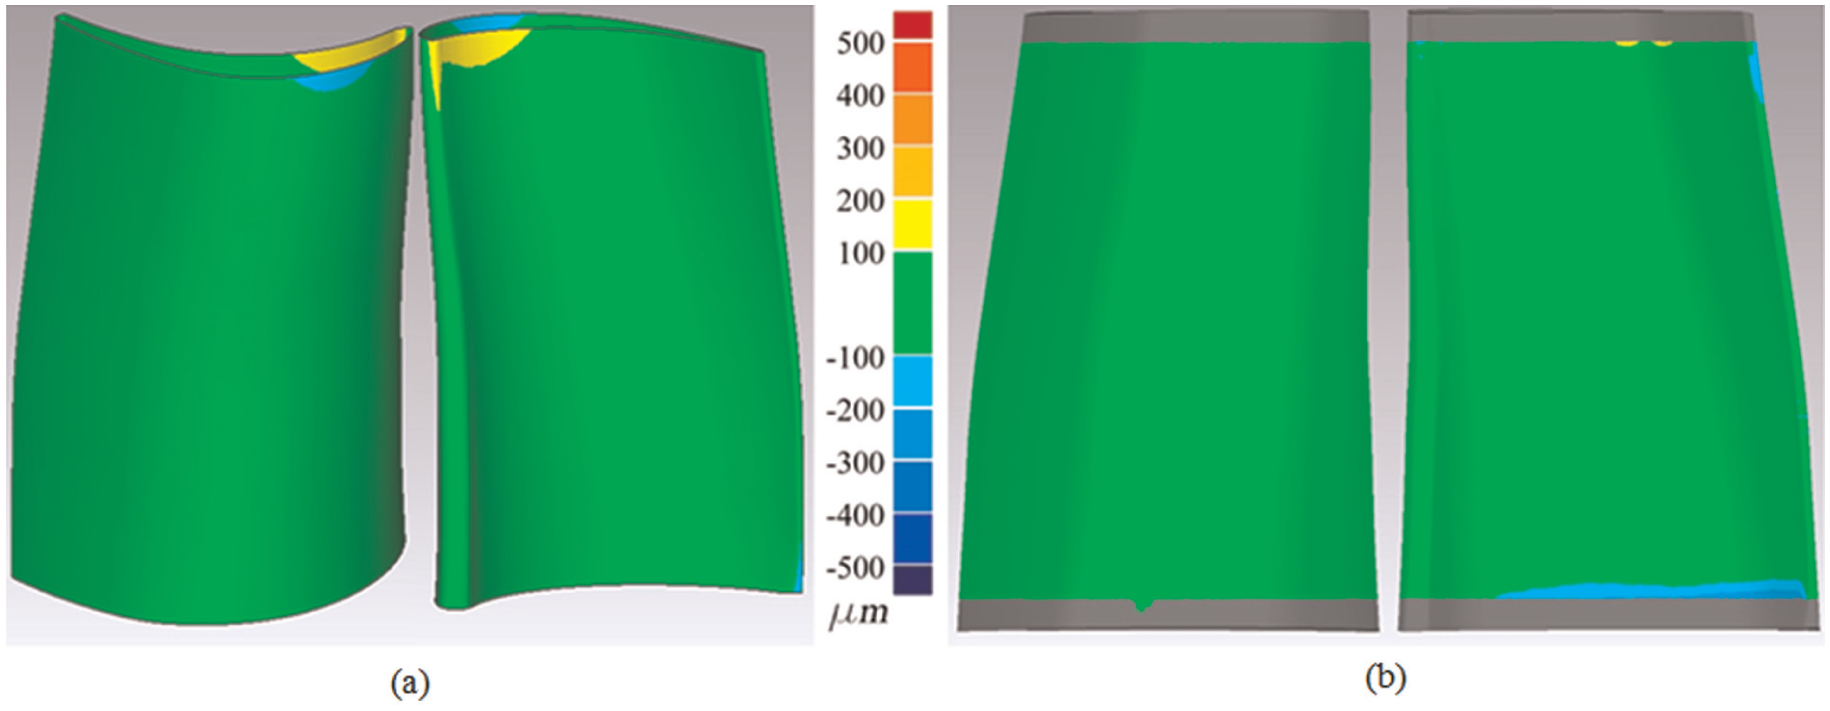
Error map of (a) point cloud and (b) surface model of the ZScanner linear laser method.
Digitization measurement deviations associated with point clouds and subsequent surface modeling of each of the three alternative blade airfoil RE methods were each compared individually to the blade model produced using the Zeiss CMM method, according to the Pugh method. The 3D point cloud and surface model error maps for each of the three alternative digitization methods are shown in Figures 7–9, showing deviations from the Zeiss CMM datum.
Interrogating the error maps, it is apparent that deviations from the reference model can occur locally or can occur over large regions. The deviations related to random errors tend to appear within a limited region, in which the position may change in scans of different sessions, similar to results of Bagci, 4 Barbero and Ureta 32 and Tóth and Živčák. 33 This is clearly illustrated in Figure 10(a), where a statistical analysis of the reconstructed surfaces shows that >99% of the digitized points recorded by the ZScanner are located in the defined best range (i.e. −100 to +100 µm) and 100% of the sampled points are within the range of −260 to +260 µm. However, the Renishaw touch scan and Renishaw laser scan have only 53% and 44% of the digitized points located within the best range, respectively. Both the Renishaw touch scan and Renishaw laser scan have 99% of digitized points located in the acceptable range (i.e. −500 to +500 µm), corresponding to 1% of digitized points outside the acceptable range. A similar analysis has been implemented by Barbero and Ureta. 32
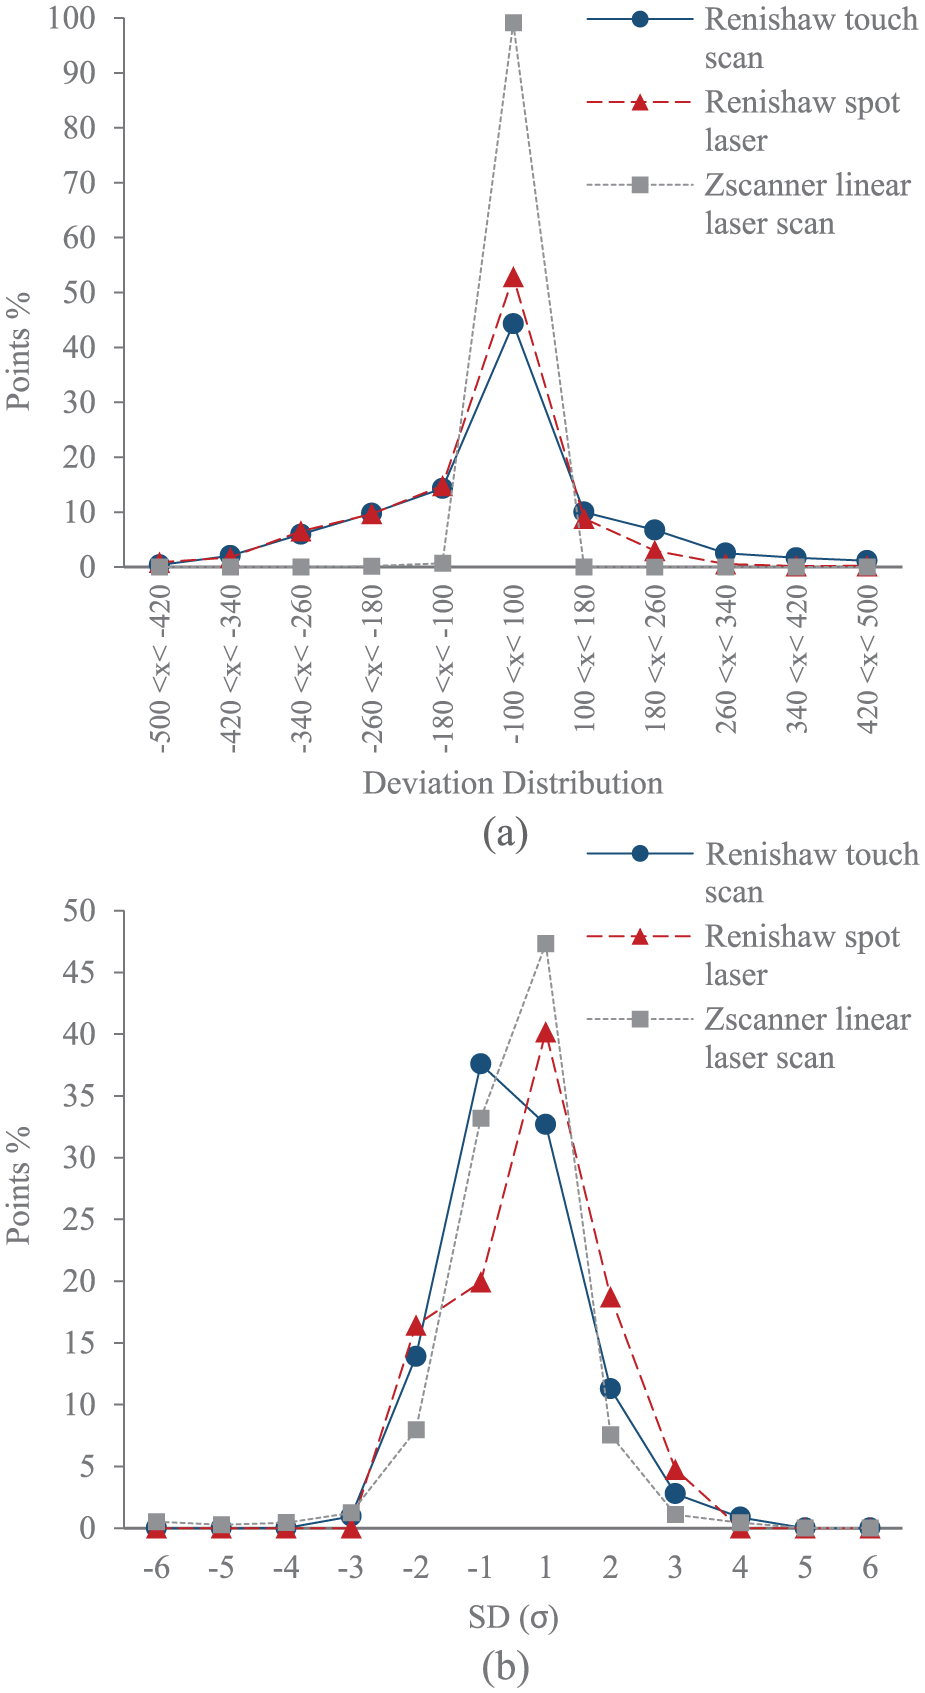
(a) Deviation distribution chart and (b) SD chart of reconstructed surface models.
Figure 10(b) shows the standard deviation (SD) of reconstructed surface models. The ZScanner digitization resulted in the least overall deviation from the reference model (i.e. 80% of points associated with the 3D model being within the ±1σ range), and the Renishaw touch scan and Renishaw laser scan have higher deviations (i.e. 70% and 60% of points associated with the 3D model being within the ±1σ range, respectively).
The deleterious impact of random errors and local deviations can be reduced through the application of appropriate surface reconstruction techniques. Figure 11 compares the deviations of the three alternative digitization methods with respect to the Zeiss CMM reference datum: (a) captured point clouds and (b) reconstructed surfaces. It is apparent that the maximum deviations of both the Renishaw touch scanning and Renishaw laser probe head point clouds were substantially decreased after surface reconstruction (i.e. deviations up to ∼2500 µm were reduced to a maximum of ∼700 µm). Figure 11 shows an apparent increase deviation error after surface reconstruction for the ZScanner alternative. The importance of reviewing information from multiple perspectives is apparent here, as Figure 9 error maps show that these increased errors are focused at the root of the airfoil around surface discontinuities. Nonetheless, Figure 11 also shows a reduced SD in the point cloud to surface reconstruction process. No evidence was found for implementation of a similar investigation in the reviewed literatures.
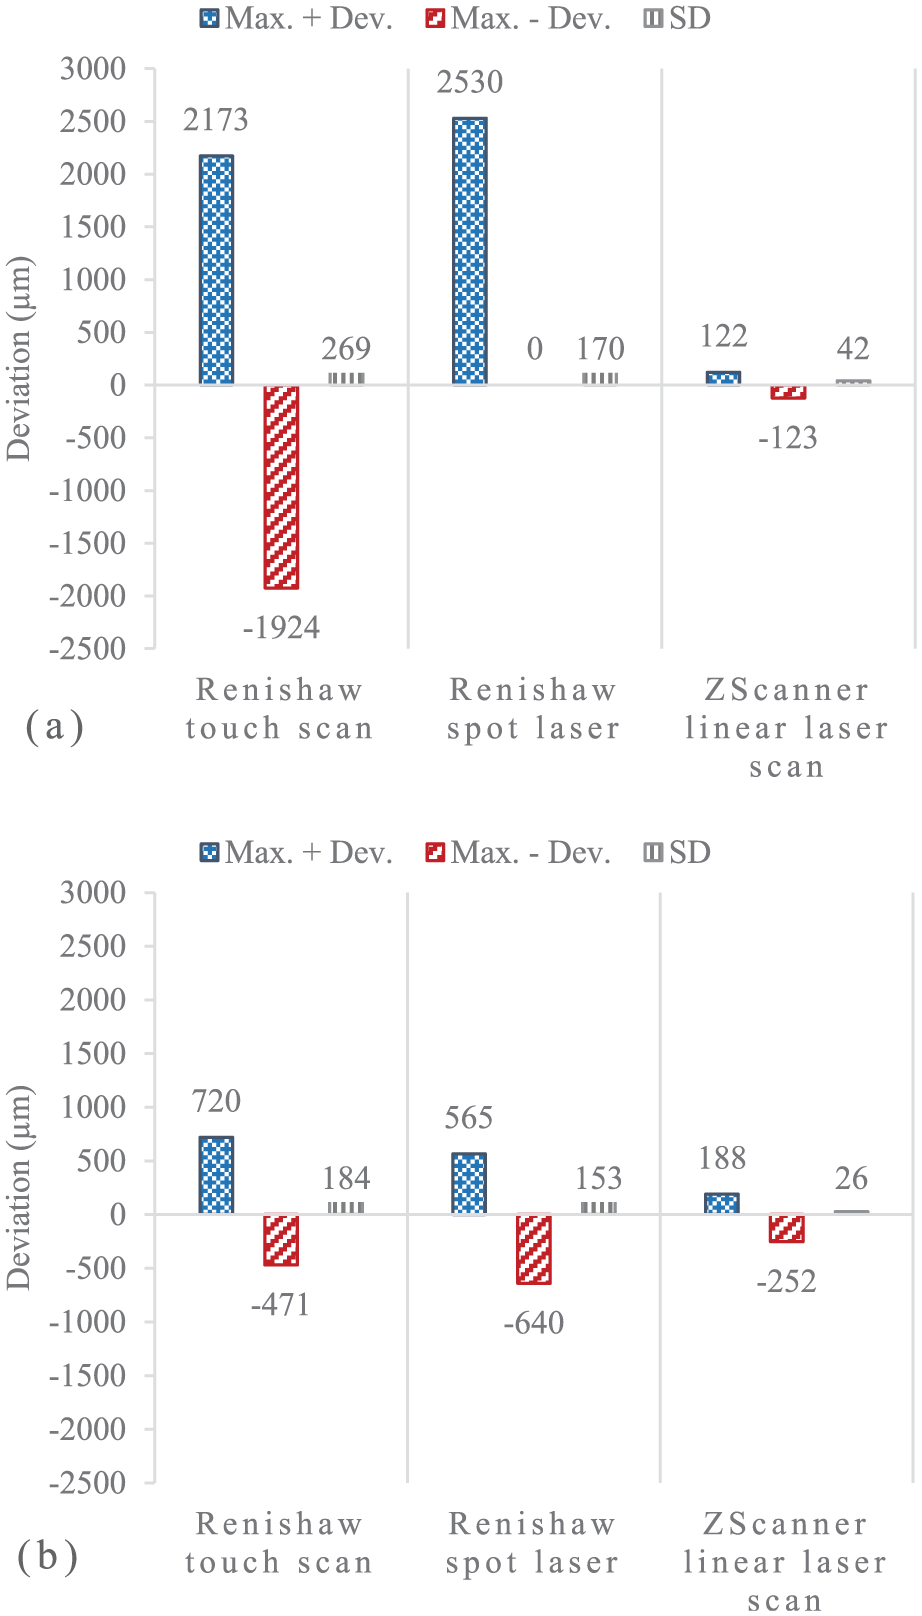
(a) Deviation of captured point clouds and (b) reconstructed surfaces from the Zeiss CMM reference datum.
Deviation in airfoil sections and design parameters
When designing a turbine blade, the most critical phase is the design of the airfoil two-dimensional lofted sections.1,2,5 There is an extensive number of parameters associated with each section, including camber line, chord length, axial chord, maximum thickness, trailing edge radius, leading edge radius, stagger angle and stacking angle. Fundamentals of fluid mechanics and thermodynamics are applied to the overall design specification to determine which of the myriad of parameters are of primary importance and which are of lesser importance.
Accuracy of the primary functional parameters is also essential for correct RE, which is one of the novel aspects of this study. The General Electric “Frame 5” gas turbine blade has the following primary functional parameters: maximum chord length, maximum thickness, leading edge radius and trailing edge radius (Figure 12). The maximum chord length is the distance between two contact points of the smallest circle that envelops the airfoil’s lofted section. The maximum thickness is the diameter of the largest circle that can be drawn inside the blade section between the concave pressure surface and the convex suction surface. Leading edge radius and trailing edge radius are the radii of circles that fit, respectively, into the leading edge and trailing edge.
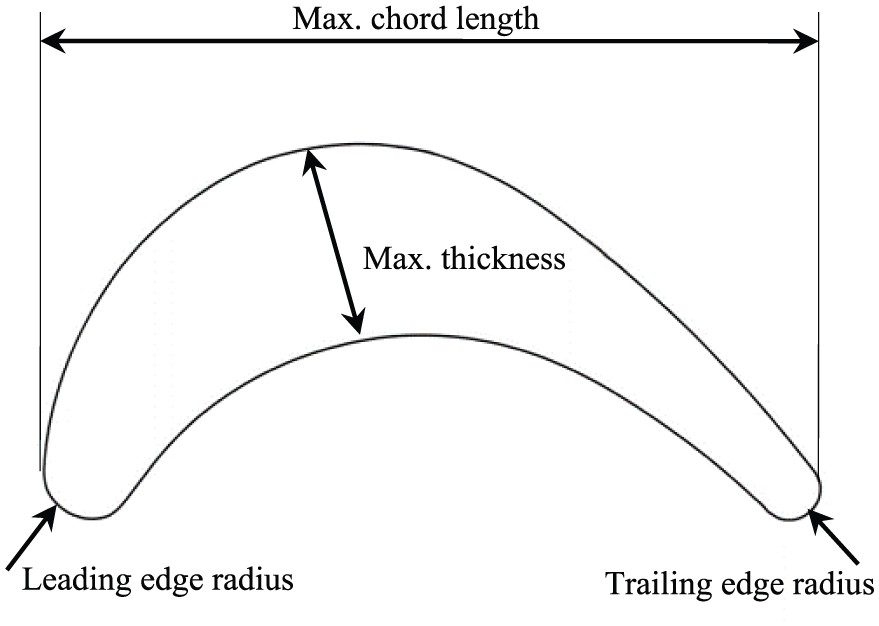
Investigated design features of turbine blade airfoil section.
These parameters were all inspected in the three alternative reconstructed models with reference to the Zeiss CMM reference reconstructed model. A total of eight lofted section profiles, different from the sections used to originally complete the point cloud surface modeling, were considered for each of the alternative models. Inspection results are shown in Tables 2–4 for Renishaw touch scan, Renishaw spot laser scan and ZScanner linear laser scan, respectively. In addition, the general deviation of profiles was studied. The graphical result of inspected sections belonging to the three methods is illustrated in Figure 13.
Dimensions and deviations of Renishaw touch scan model from the Zeiss CMM reference.
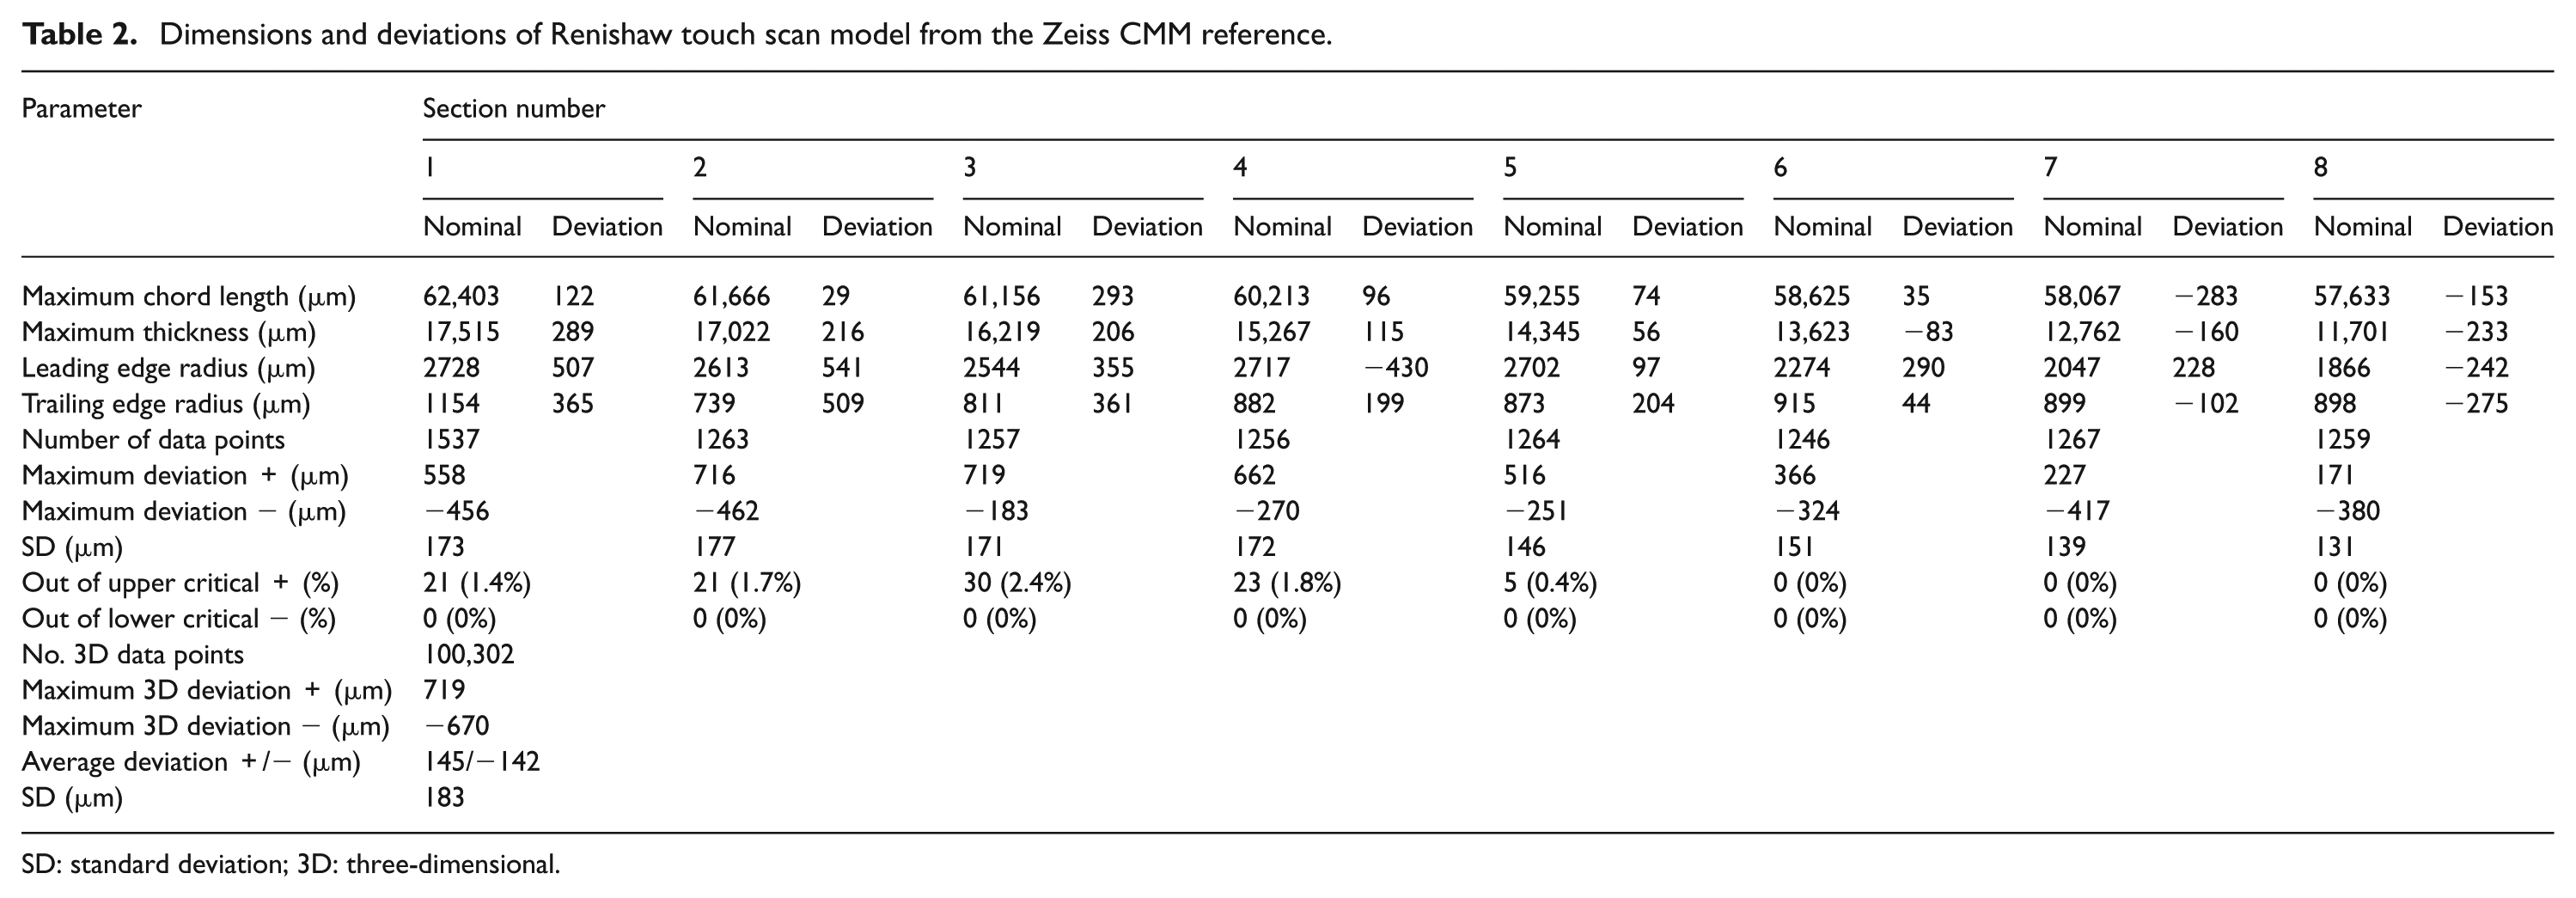
SD: standard deviation; 3D: three-dimensional.
Dimensions and deviations of Renishaw spot laser scan model from the Zeiss CMM reference.
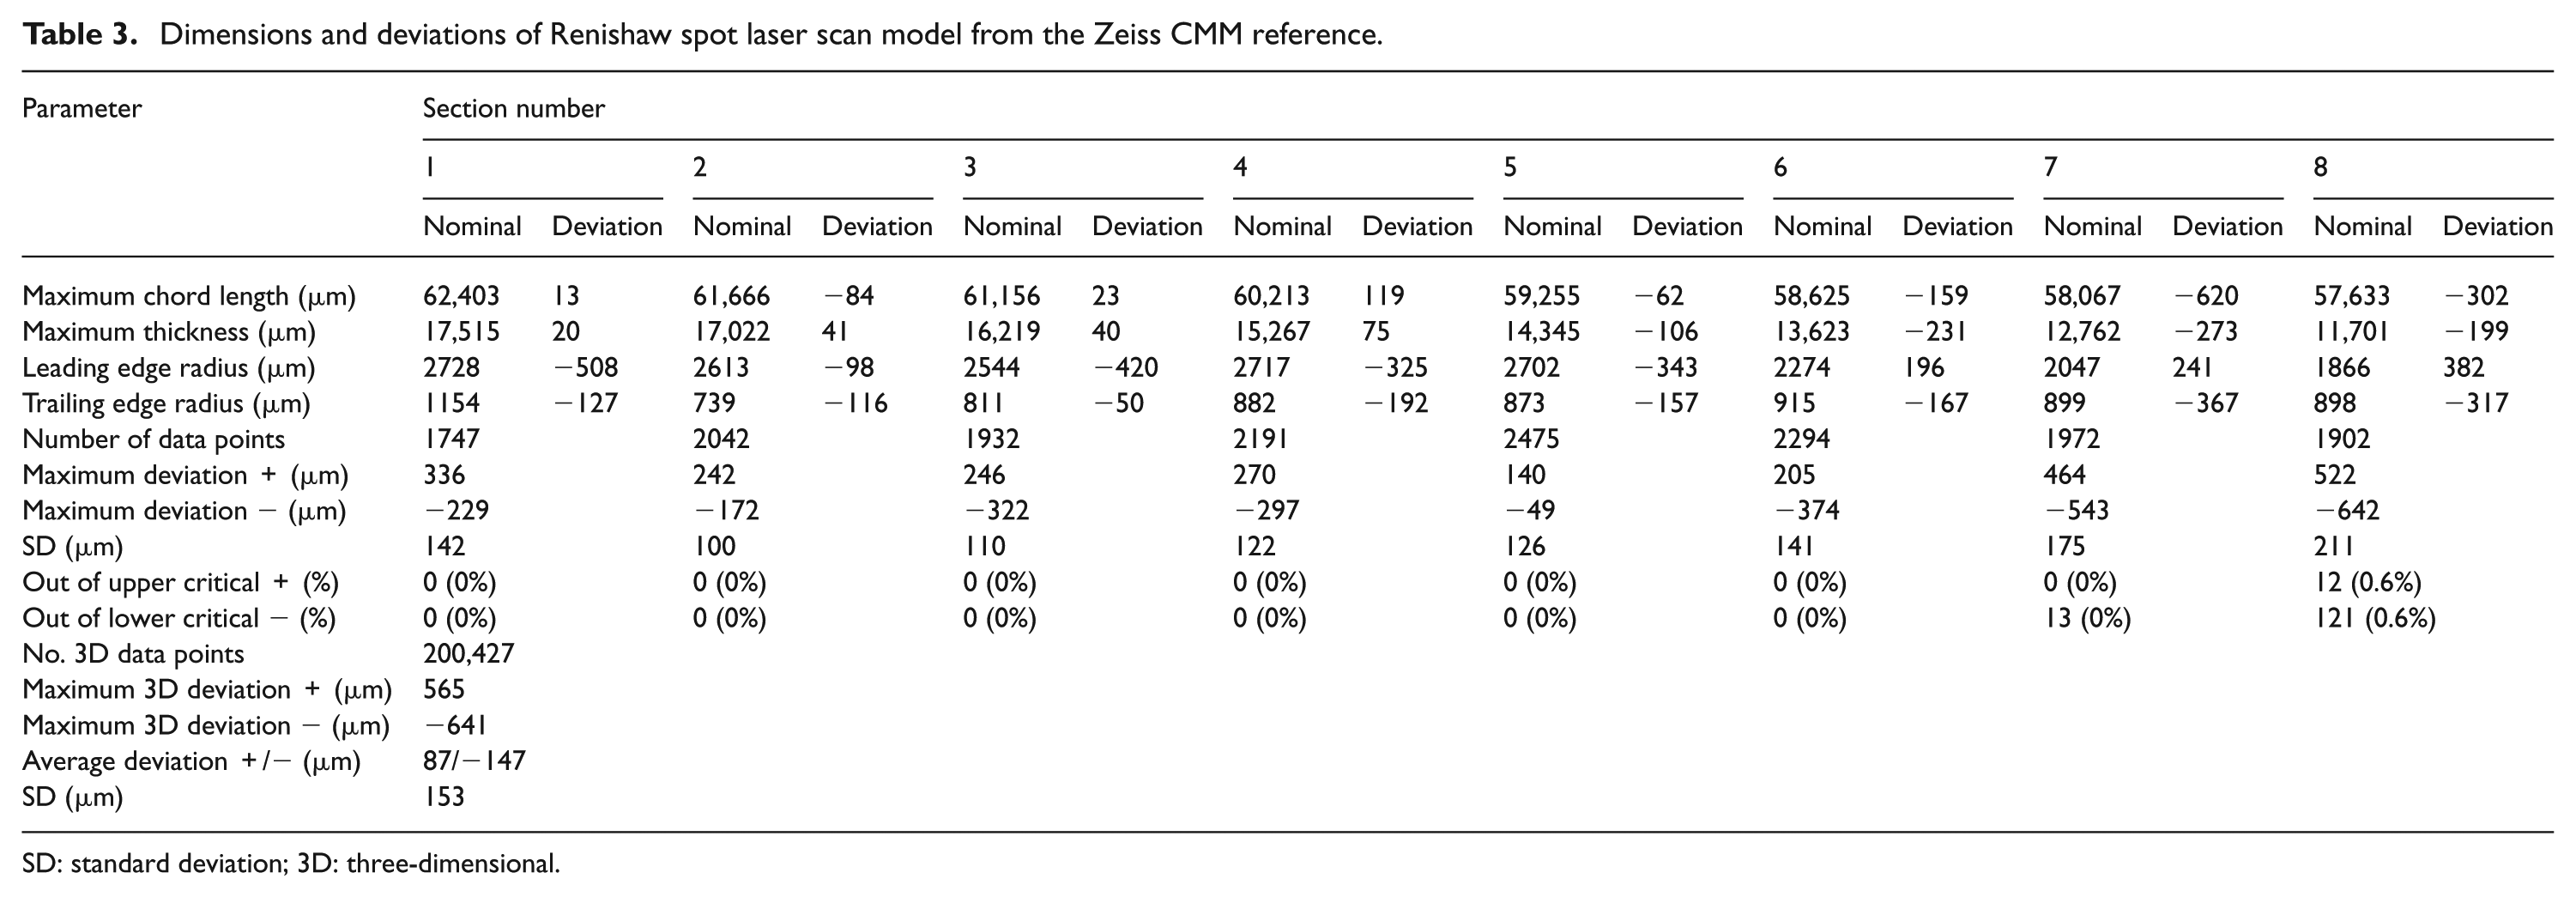
SD: standard deviation; 3D: three-dimensional.
Dimensions and deviations of ZScanner linear laser scan model from the Zeiss CMM reference.
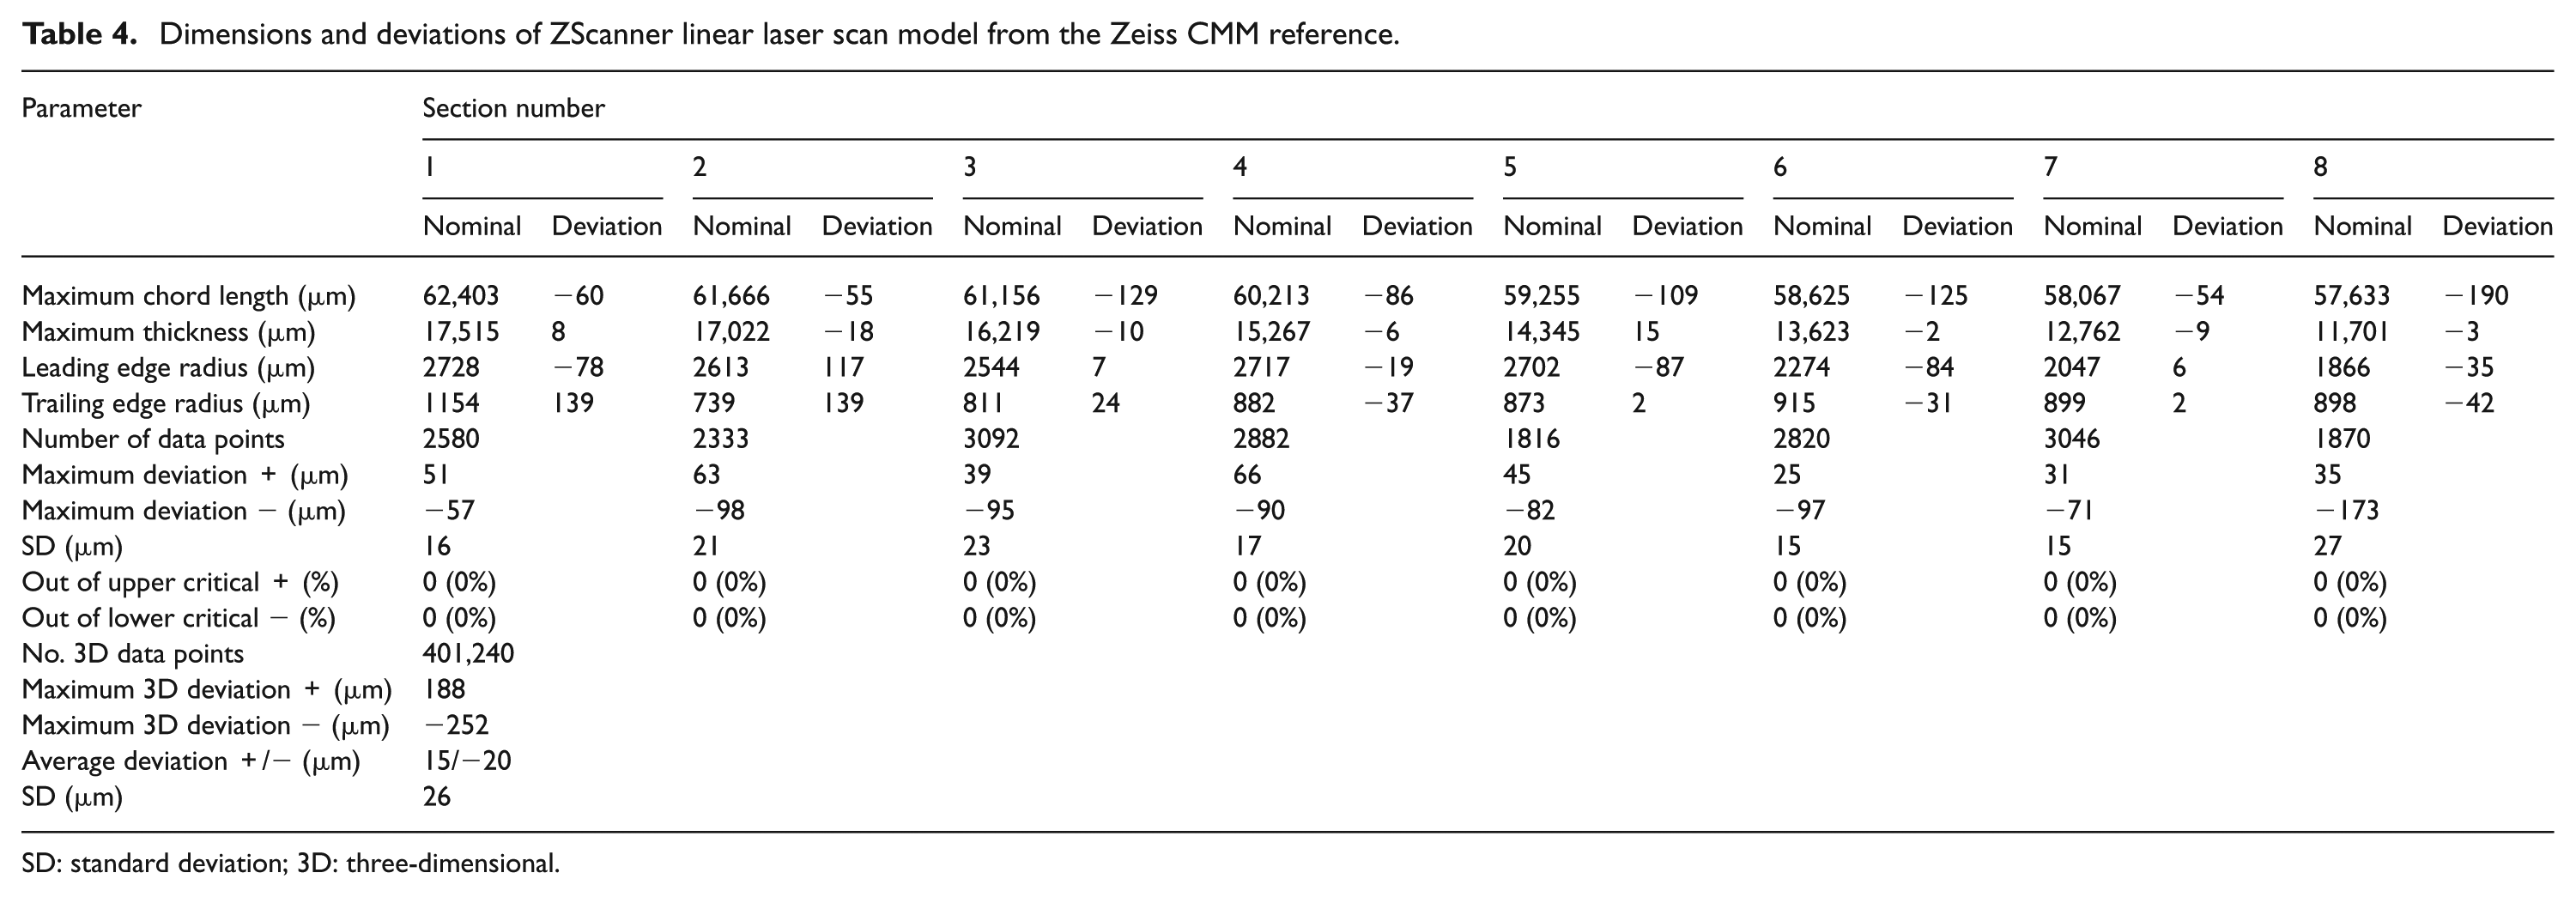
SD: standard deviation; 3D: three-dimensional.
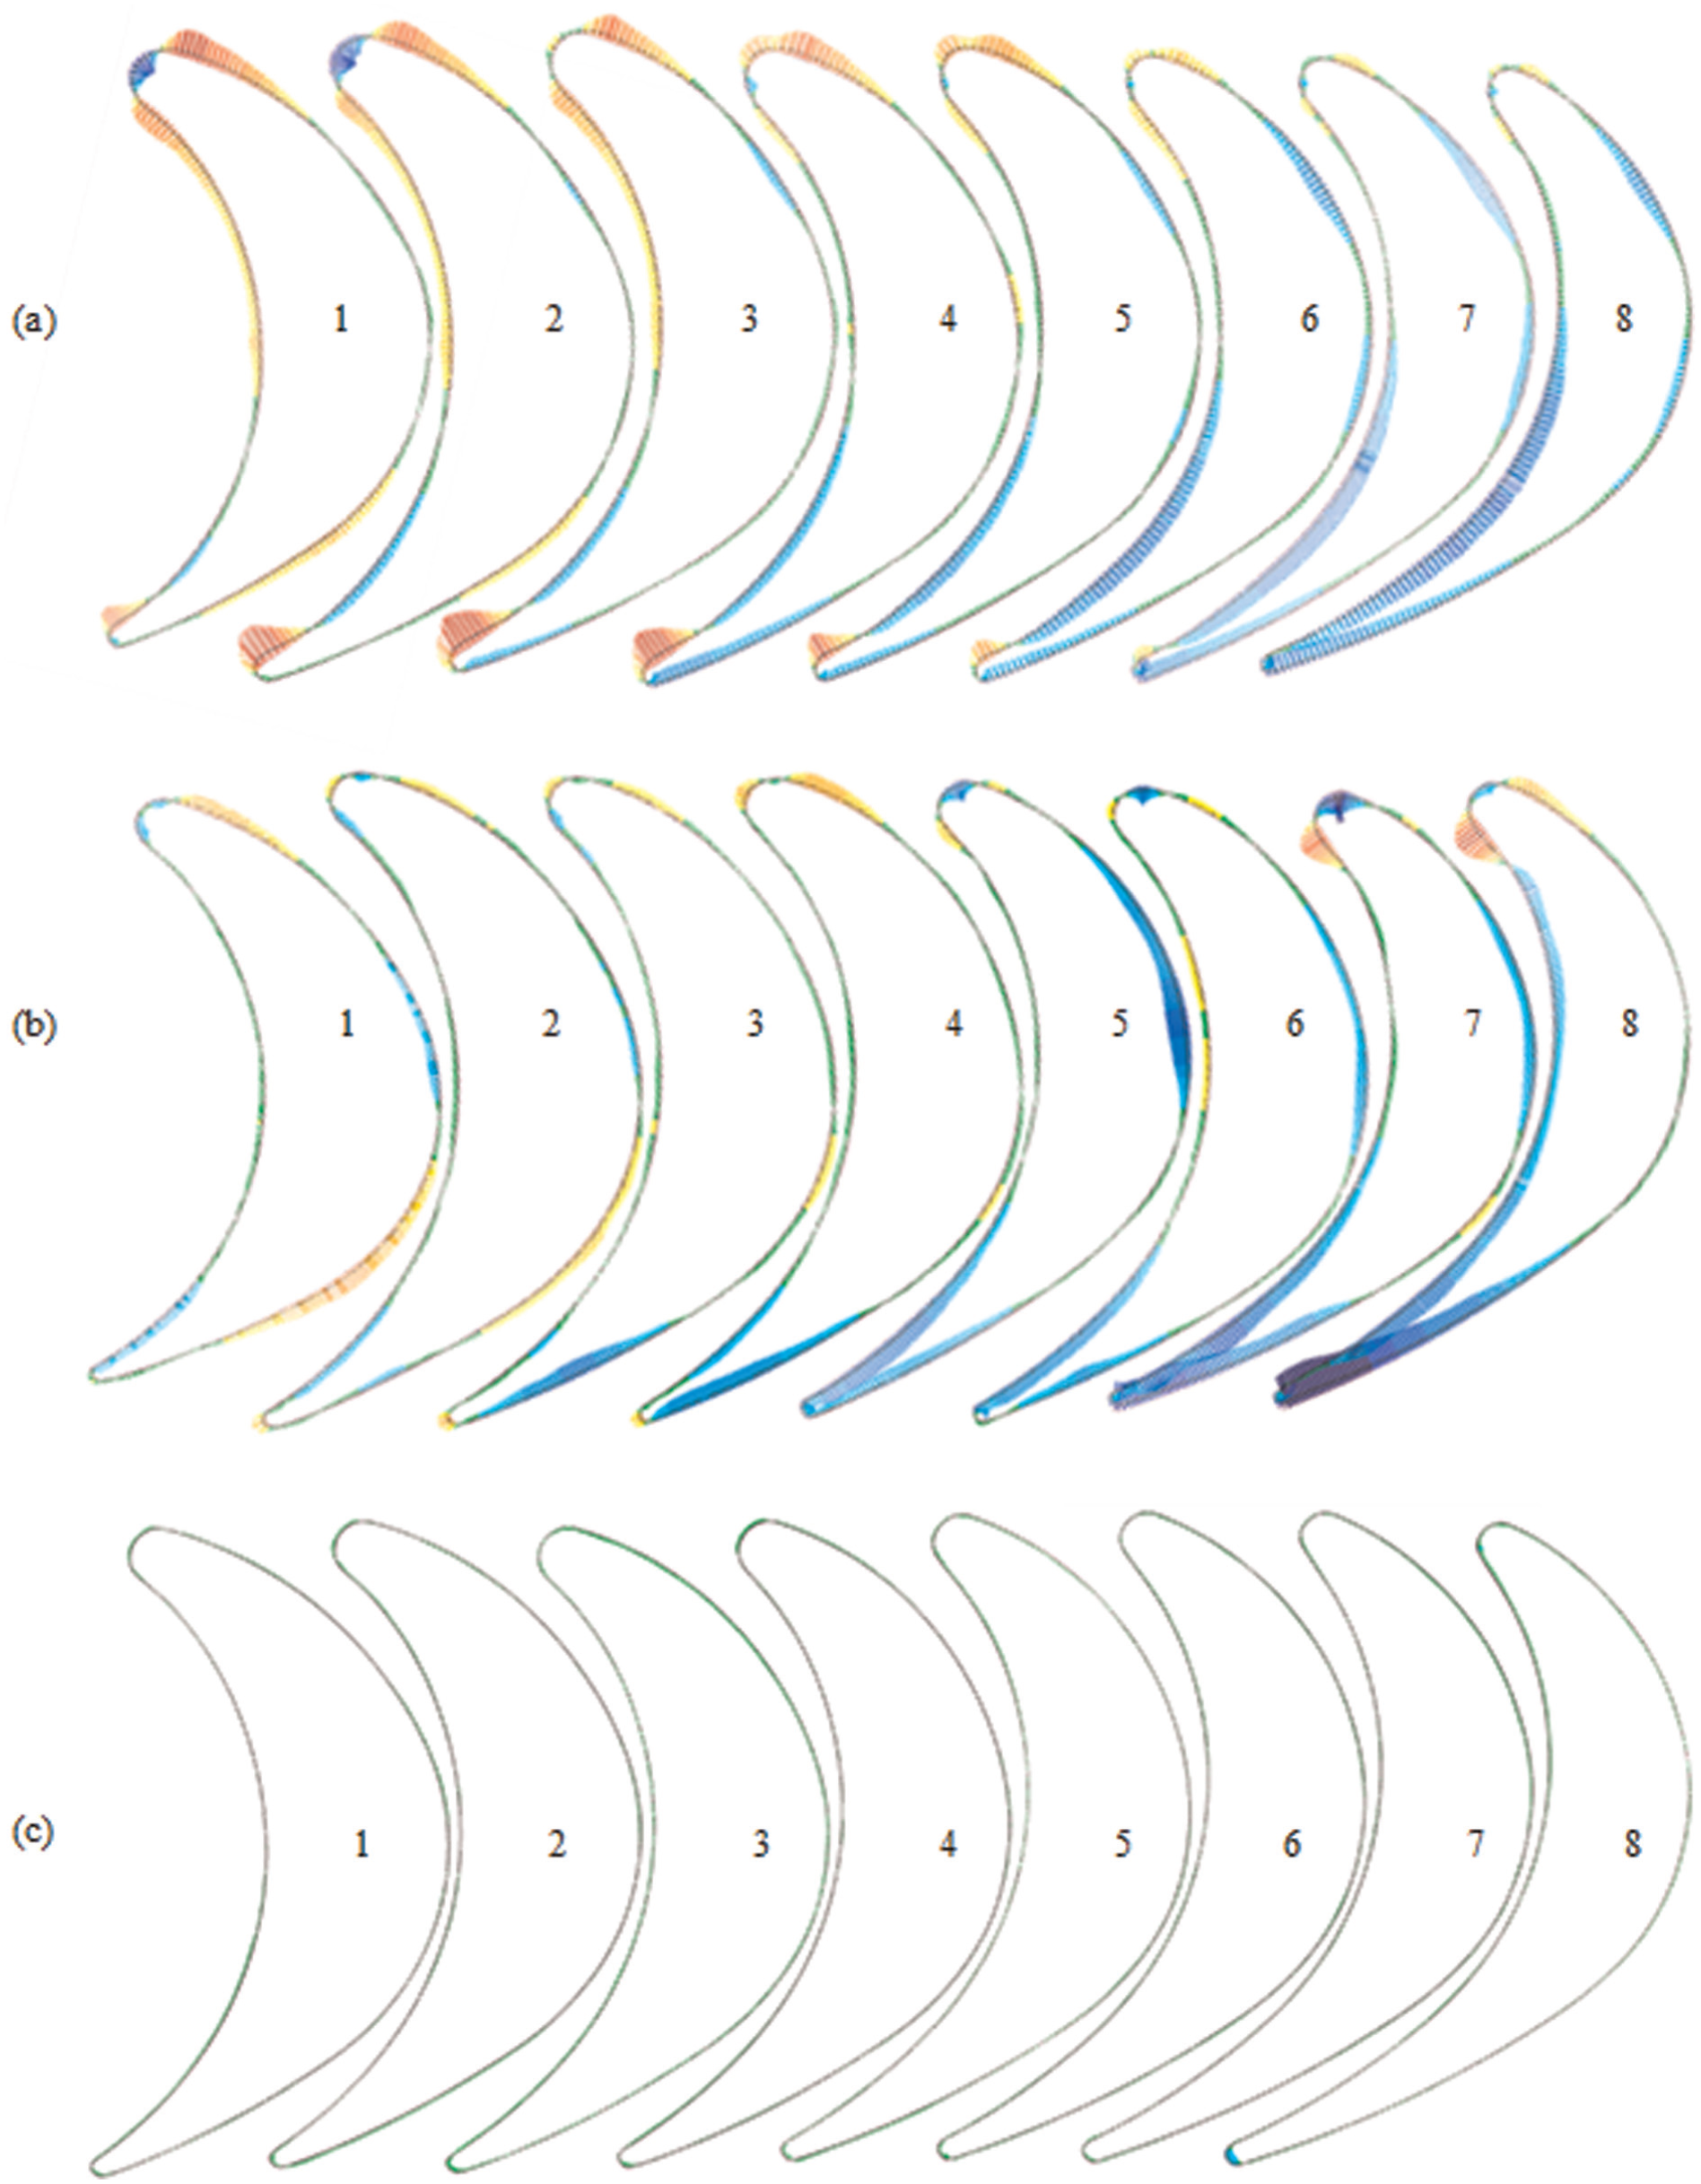
Graphical result of inspected sections with reference to the reconstructed model of Zeiss CMM for (a) Renishaw touch scan, (b) Renishaw spot laser scan and (c) ZScanner linear scan.
Comparing the alternative digitization approaches
After evaluating the accuracy of digitizers and surface fitting through calculating the error of point clouds, reconstructed surfaces and design parameters of airfoil sections, this section reports on data analysis and overall relative performance of the alternative approaches. Table 5 shows summarized results with the Zeiss approach as reference. The “Pugh matrix” is a qualitative decision matrix used to evaluate competing conceptual design concepts and will be used in this section to review the alternative digitization approaches.
Technical details of turbine blade digitization and CAD model reconstruction.
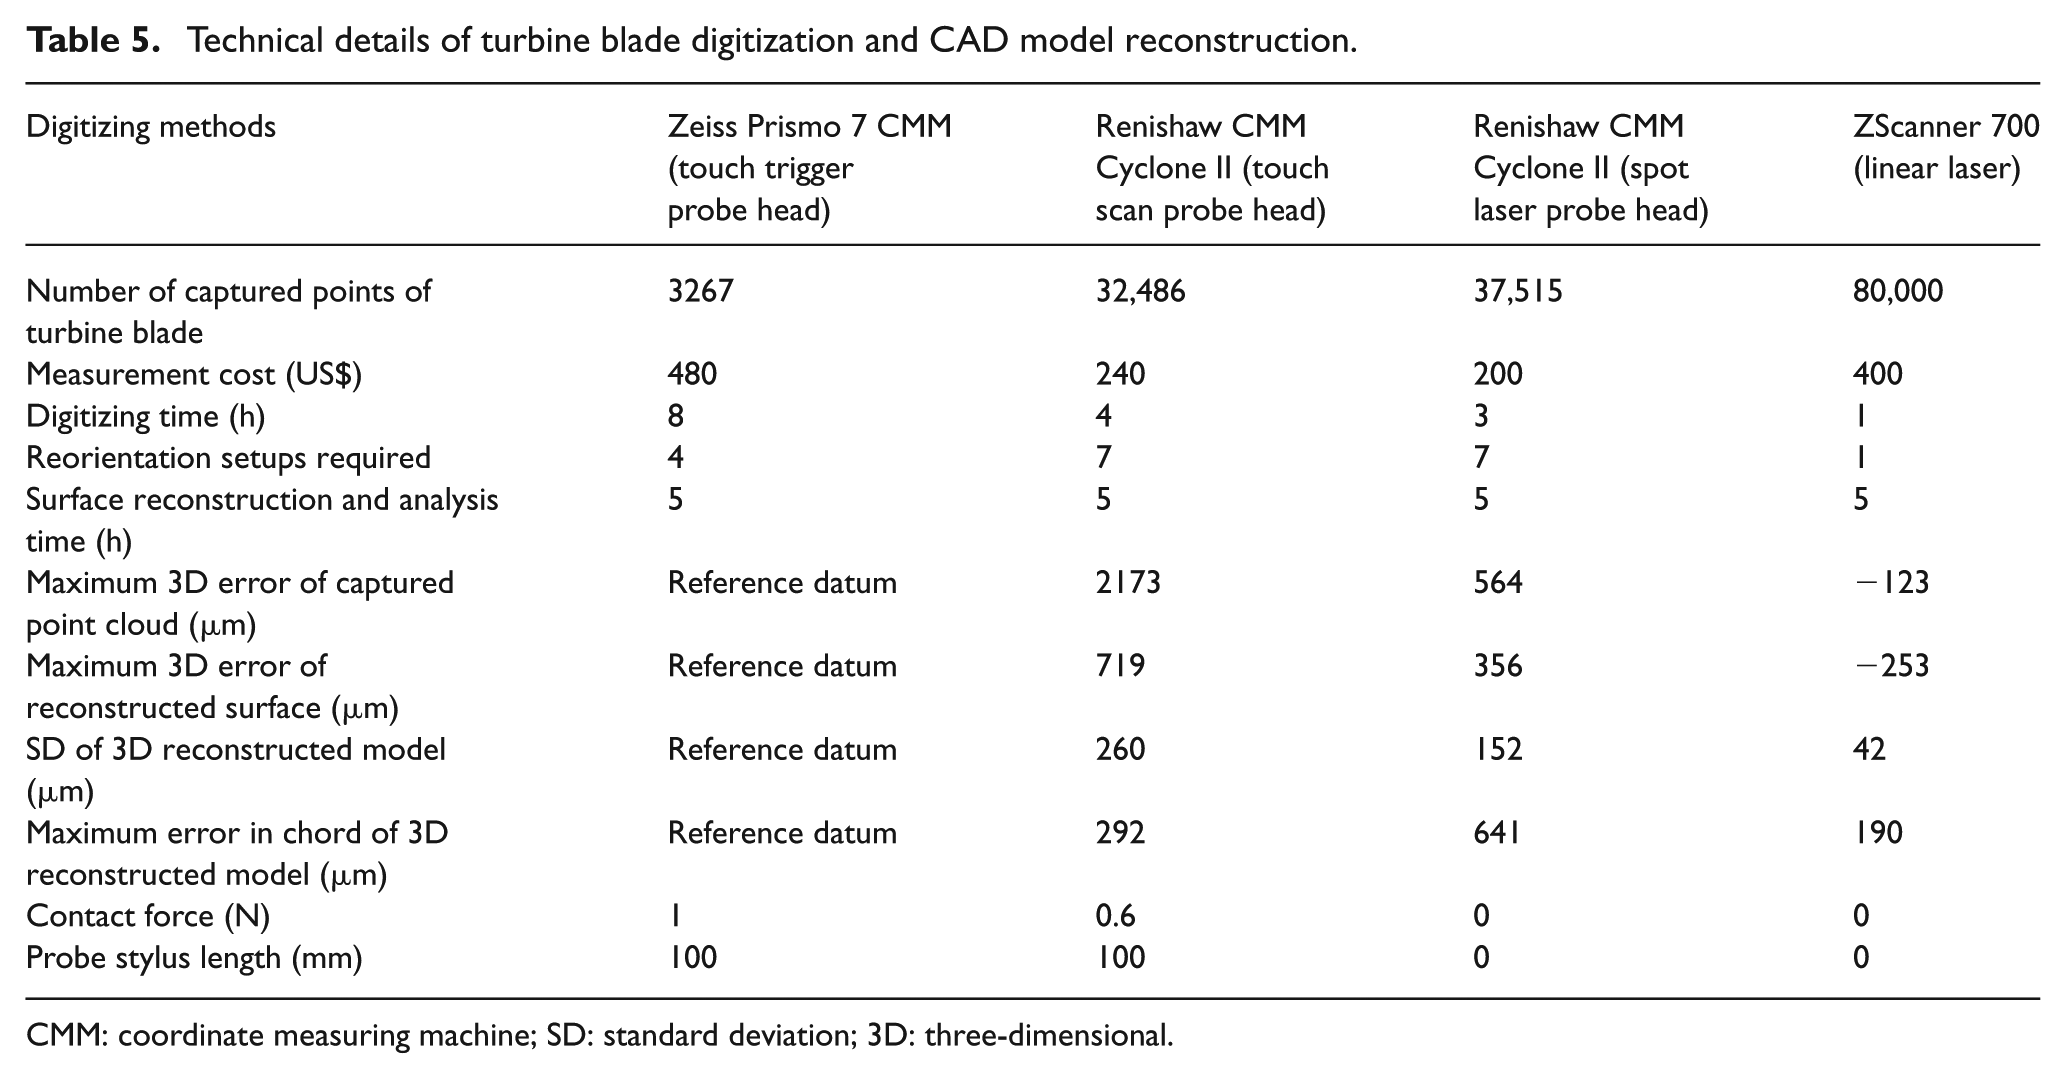
CMM: coordinate measuring machine; SD: standard deviation; 3D: three-dimensional.
In general, the Pugh matrix approach requires that the researcher has access to a datum embodiment with subsequent competing concepts then compared to this datum embodiment. The comparison invokes several performance factors and in its basic form assigns only positive (better), negative (worse) or zero (the same) values to each performance factor, relative to the datum, in the matrix. 51 Moreover, to distinguish the differences between alternatives, modified Pugh matrix uses weighted values and different levels of positive and negative scores.52,53 In the study reported in this article, the authors have used the Pugh method to compare the alternative approaches with respect to two sets of evaluation criteria, these being RE accuracy associated with manufacturer specifications and a more complete set of evaluation criteria that includes parameters associated with the reported comparative study.
Regarding RE accuracy, the approaches were compared to enable the selection of the reference method for evaluating the point clouds and reconstructed models. The Pugh analysis was completed four times, that is, with each alternative method set to the datum in turn (Table 6). The analysis considered only the relevant specification parameters stated by the manufacturer. For three of the four analyses, the Zeiss approach achieved the best score. In the work of Persson et al., 49 they have selected randomly one set of the digitized points as the CAD reference model. Table 7 shows the Pugh matrix considering both the relevant specification parameters and the practical results from the comparative study. The Zeiss approach, according to the previously mentioned reasons, is selected as datum. The important parameters associated with the comparative RE investigation are included in this Pugh analysis matrix. Each evaluation criteria was adjusted to a common unit-less range, that is, scaled from −3 to +3, where −3 corresponds to relatively bad or poor and +3 corresponds to relatively superior or desirable. To acknowledge different importance criteria, a series of importance weighting factors were applied in the range of 0–10, where 0 corresponds to nil importance and 10 corresponds to highest importance. This analysis included subjective assessments by the authors, and the analysis considers criteria relevant to the specific RE case study reported in this article. Using an evaluation technique such as the Pugh matrix enables otherwise disparate criteria to be directly incorporated into an evaluation, reasoned decision making where a large body of information is presented in a succinct form and readily achieved adjustments to specific estimates in advance of a final decision.
Pugh analysis to choose the reference model for RE accuracy (point cloud and surface model evaluation).
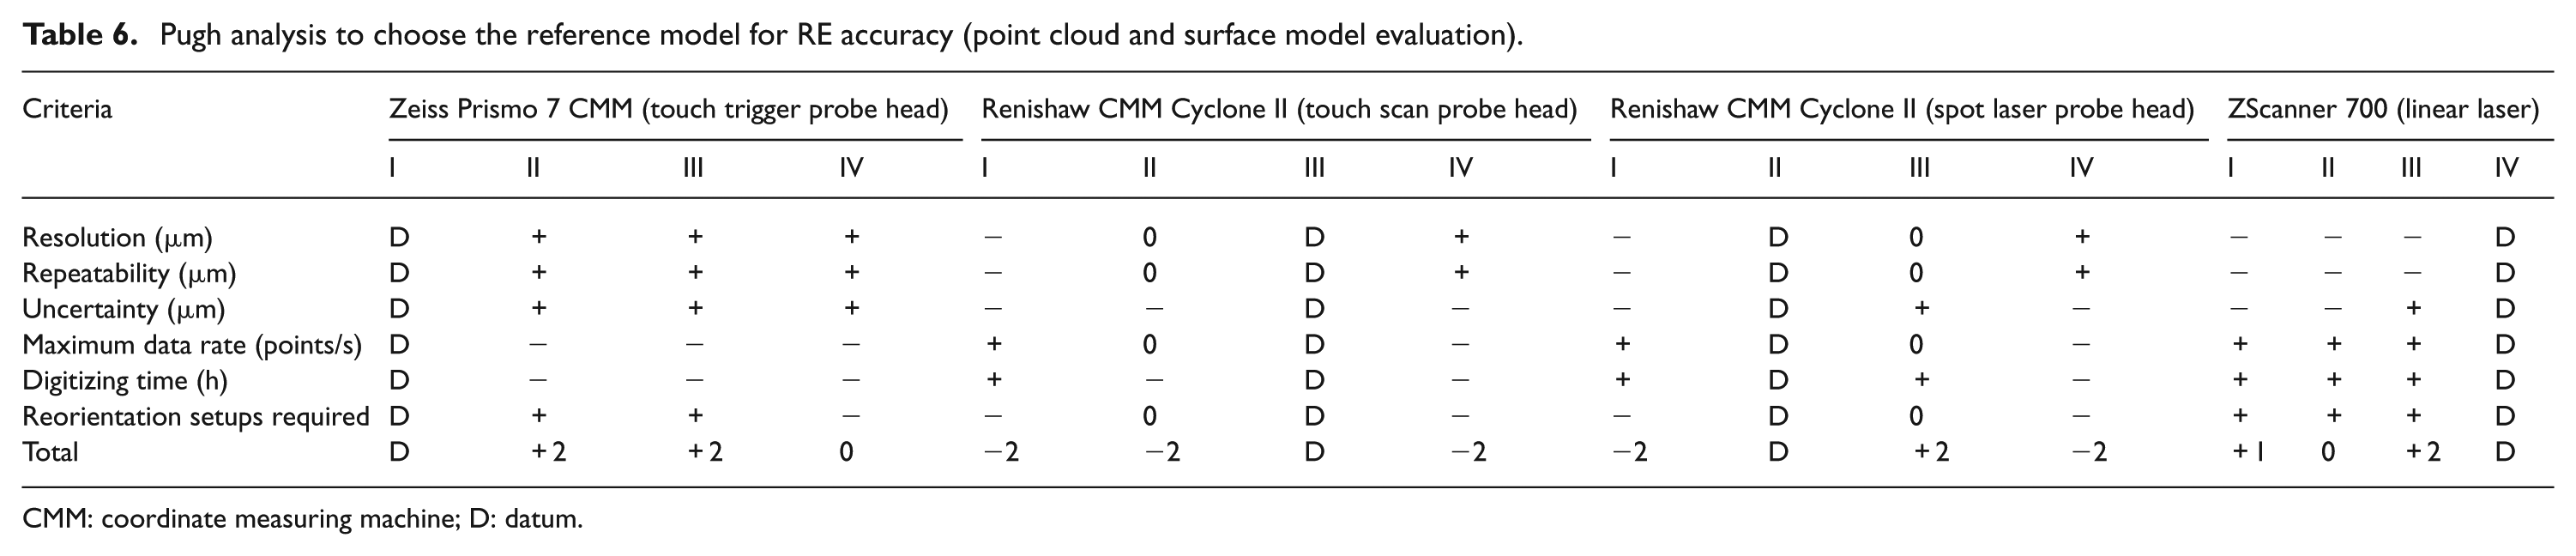
CMM: coordinate measuring machine; D: datum.
Pugh analysis of alternative RE digitizing approaches.
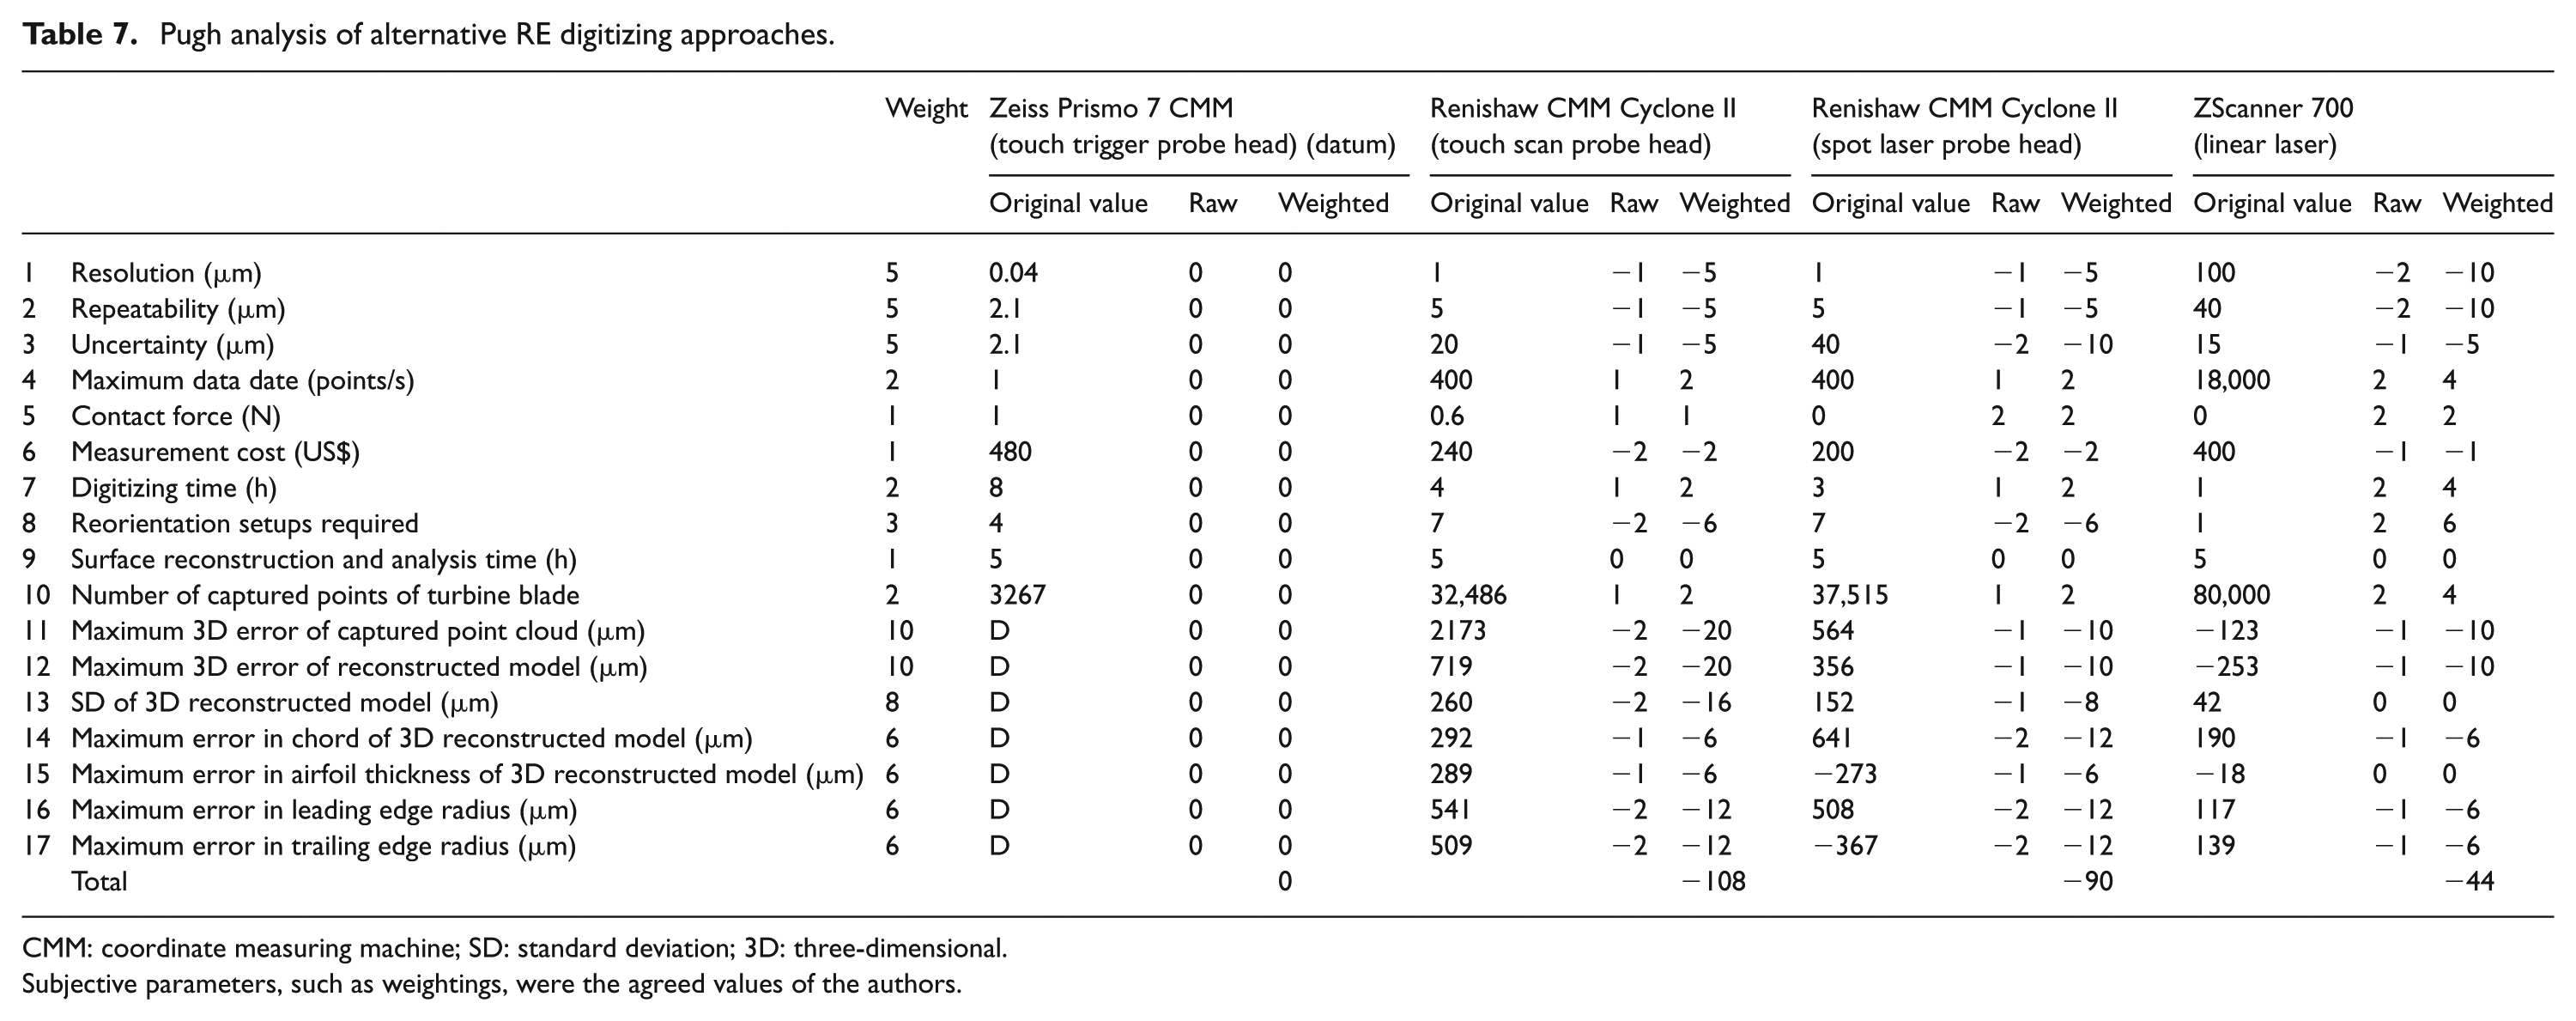
CMM: coordinate measuring machine; SD: standard deviation; 3D: three-dimensional.
Subjective parameters, such as weightings, were the agreed values of the authors.
This table demonstrates how the Pugh method can enable the decision maker to complete a sophisticated comparative study using evaluation criteria with different units and magnitude ranges (set a standard range) and importance (through the introduction of weighting factors).
The focus of this study was to investigate the measurement accuracy of digitizers and determine the best method for RE of a turbine blade. The Pugh decision matrix shown in Figure 7 reflected this overall focus on system accuracy, with the ZScanner 700 using a linear laser as a slightly worse Pugh score than the Zeiss datum approach. The other alternatives (i.e. the Renishaw CMM Cyclone II with either touch scan or spot laser probe head) had comparable Pugh scores that were far worse than the datum. The datum error analysis associated with the ZScanner affirms the decision forthcoming from the Pugh comparative analysis.
Given the dominance of evaluation criteria associated with measurement accuracy in the preceding Pugh analysis, a subsequent Pugh analysis was completed with reference to Market Competitiveness Evaluation. 54 In this analysis, measurement cost (US$) and digitizing time (h) were given far higher importance weighting factors with correspondingly lower measurement accuracy criteria applied to measurement accuracy criteria. Irrespective of whether cost or time was nominated to have the highest importance weighting, the associated Pugh analyses considered the ZScanner 700 to be the preferred RE alternative according to the methodology of Market Competitiveness Evaluation proposed by Lee et al. 55
Concluding remarks
This article has reported on a comparative study of commonly used digitizing methods, including Zeiss Prismo 7 CMM (touch trigger probe head), Renishaw CMM Cyclone II (spot laser probe head), Renishaw CMM Cyclone II (touch scan probe head) and ZScanner 700 (linear laser), to complete an RE of a commercial turbine blade. RE projects are essential when the original design specification of a part has been lost. The digitizers used each to acquired point clouds according to standard BS ISO 5725-1:1994. Surface reconstruction was completed using the curve method and NURBS curves via CATIA® CAD software. Variation errors in point clouds, 3D CAD data and design parameters of 2D sections of the blade were investigated. To enable a comparative study, the 3D reconstructed model of Zeiss CMM with touch trigger probe head, which has the highest specified accuracy and the highest measurement repeatability, was chosen as a datum reference using Pugh method. This investigation was completed using Geomagic Qualify software. The deviation range of −100 to +100 µm was specified as the best deviation and the range of −500 to +500 µm as acceptable deviation. The maximum error of captured point clouds measured as 2173, 2530 and −123 µm, respectively, for Renishaw touch scan probe, Renishaw spot laser and ZScanner linear probe demonstrated that information reported by manufacturer cannot always be relied upon. Statistical analysis of deviations for ZScanner point cloud showed that >99% of points were located between −100 and +100 µm and 100% of the sampled points were within the range of −260 to +260 µm. However, 53% and 44% of digitized points of Renishaw touch scan and Renishaw laser scan, respectively, had located within the best range. Both the Renishaw touch scan and Renishaw laser scan had 99% of digitized points located in the acceptable range. The SDs of 269, 170 and 42 µm for point clouds of Renishaw touch scan, Renishaw spot laser and ZScanner linear laser, respectively, were decreased to 184, 153 and 26 µm as a result of using proper surface reconstruction techniques.
Accuracy of the primary functional parameters including maximum chord length, maximum thickness, leading edge radius and trailing edge radius was also investigated, and this is one of the novel contributions of this study. The study sought to identify the most effective measuring method, with respect to accuracy of digitizing. The Pugh “decision-matrix method” was applied to complete an overall comparative study of the alternative methods. The analysis reveals that from the measurement accuracy viewpoint, ZScanner 700 using linear laser offers the best performance, and Renishaw CMM using spot laser has the worst performance. However, when time and/or cost was considered the factor of highest importance, ZScanner 700 with linear laser was found to have the best performance.
Future work will include the inclusion of other available digitizing methods in a more substantial RE investigation to enable a more complete comparative study into the merits of all significant digitizing methods. The authors also plan to complete the following comparative studies: the influence of ambient environment changes (i.e. pressure, temperature, atmospheric particulates and humidity) on digitizer performance, especially on noncontact scanners, and CFD analysis of blade performance on reconstructed models resulting from different digitizers.
Footnotes
Declaration of conflicting interests
The author(s) declared no potential conflicts of interest with respect to the research, authorship and/or publication of this article.
Funding
The author(s) received no financial support for the research, authorship and/or publication of this article.