
Abstract
A finite element model has been developed to determine the effectiveness of a cold compression technique to reduce the large residual stresses generated from quenching solution heat treated T-section components of aluminium alloy AA7050. To compress long components, a multi-step process is required with some amount of overlap. A parametric study has been performed to determine the effect of the compression ratio, friction coefficient, length of overlap and length of the T-section component on the residual stress distribution post-quenching and after subsequent cold compression. Generally, a percentage reduction in the peak residual stress of over 90% was found. The optimal parameters for residual stress relief by cold compression have been suggested from the cases considered.
Keywords
Introduction
Extra-large plate-like structures for modern aircrafts are made from heat treatable high strength 7XXX series aluminium alloys. 1 For Airbus A-380, some plates can be as long as 36 m. 2 The manufacturing process of critical structural components with stiffened ribs involves a number of operations as illustrated in Figure 1. The hot rolled plate is incrementally hot forged and bent to achieve specific section designs. To improve the properties of the components, solution heat treatment (SHT) is performed and the component is subsequently quenched to ‘freeze’ the microstructure of the SHT material. The quenching processes can generate significant residual stresses, particularly in large and thick components. It is well known that residual stresses lead to component distortion, especially post-machine finishing 3 and tensile residuals stresses promote cracking and are generally deleterious to the integrity of the structure. Therefore, it is essential that the level of residual stresses is mitigated as far as possible.
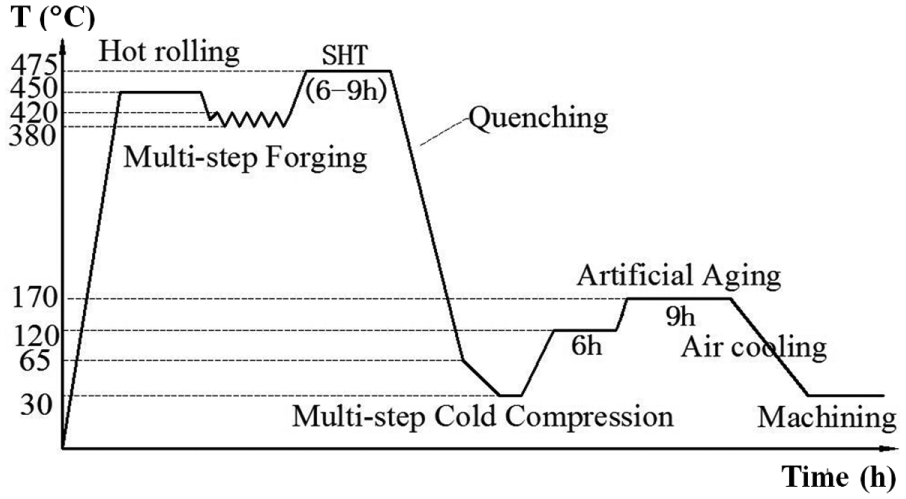
Schematic illustration of a typical manufacturing process for extra-large plate-like aluminium components.
It is well known that non-uniform plastic deformation and temperature gradients associated with welding, quenching and forming procedures, such as rolling and grinding, are the main causes of residual stress. To reduce quench-induced residual stresses, which are generated due to a mismatch in strains in neighbouring material, cold forging may be performed to plastically deform the quenched work-piece by 1%–3%, 4 hence significantly removing the strain mismatch in the component. Theoretically, this is a simple method to remove the residual stresses in quenched plates. In practice, however, difficulties arise in achieving uniform plastic deformation throughout an extra-large work-piece, as due to practical limitations in possible die dimensions, the cold forging process cannot be performed in a single operation. Hence, multi-step cold compression operations are required with a certain length of overlap between operations for some extra-large components. Consequently, complex stress states can be generated in the overlapping area which affects the quality of the component manufactured and subsequently the dimensional accuracy and fatigue life in-service.
Extensive research has been performed to measure and predict residual stresses in a wide range of materials and structures. Giorgi 5 and Mahmoodi et al. 6 found that, for aeronautic stainless steel, the surface residual stresses in cold rolled components were tensile, and that the magnitude of tensile residual stresses increased with the rolling reduction level, in this case to a peak value 200 MPa (approximately, 42.6% of the yield stress). Yang et al., 7 Robinson et al. 8 and Totten and MacKenzie 9 studied the effect of SHT and quenching on the distribution and magnitude of residual stress in aluminium alloys. They found that the specimen size, the initial temperature of the specimen, the coolant temperature and the thermo-mechanical properties of the material, for example, thermal conductivity, specific heat and the coolant all influenced the residual stress, as can be expected. Tanner and Robinson 4 and Koc et al. 10 reported that cold stretching and single-strike cold compression could significantly relax residual stress in relatively small aluminium blocks. In fact, in some cases, they succeeded in reducing the peak residual stress to 10% of their initial values.
However, relatively little work has been performed on residual stress reduction techniques on large plates using multi-step compressive forging processes with overlap. Tanner and Robinson 4 studied the influence of cold compression in sections, denoted as ‘bites’, on residual stress distribution in 7449 aluminium alloy in relatively small block of material (length: 550 mm), and found that high tensile stresses are generated in the longitudinal and transversal directions, in the vicinity of the overlap region at a location at the end of the initial ‘bite’. Prime et al. 11 compared the predictions obtained from a two-dimensional (2D) finite element (FE) analysis and contour measurement results for a multi-step compression process with overlap on an AA7050 block and found that the stress predicted showed periodicity with an interval corresponding to the length of compression die, less the length of overlap.
The main aim of this work is to develop an integrated numerical modelling technique, incorporating a dislocation-based material model, to simulate the SHT and quenching process in extra-large, stiffened, T-section plate-like components and predict the resultant residual stress distribution, and subsequently predict the residual stress reduction through multi-step compression cold forging operations. In particular, the residual stress redistribution in regions where the multi-step compression operations with overlap are investigated.
The FE model developed for the integrated residual stress modelling of the large T-section component is first introduced. Visco-plastic constitutive models have been calibrated for AA7050 and are incorporated into the commercial FE code ABAQUS via a user-defined subroutine. The residual stress generation due to SHT and subsequent quenching has been modelled, followed by the cold forging process. The residual stress redistribution produced by the cold forging operation and the influences of processing parameters have been studied in detail. The integrated modelling method has been verified by simulating two cases for bulk forming operation published in literature,4,10 and found very good agreement between the predictions and measurements.
Numerical model
The geometry and dimensions considered in this work are illustrated in Figure 2(a). In initial studies, a plate of length 1000 mm has been considered (the influence of plate length is examined later). Two planes of symmetry exist in the geometry; however, only one of these may be exploited to simplify the FE model, due to the nature of the quenching procedure, as shown in Figure 2(b). The co-ordinate directions are defined such that z is along the length of the plate/stiffener, x is transverse to the stiffener and y is through the thickness of the plate, with the origin defined at the mid-length and mid-width position of the plate at the top of the plate (i.e. the flat region). The cooling rates/temperature distribution during quenching is affected by the orientation that the component enters the water. In industrial practice, it is not feasible to lower the extra-large component into the water in the longitudinal direction, as it is not cost-effective to build such a deep pool and more importantly, it would take a longer time for the component to be completely immersed in water, which could significantly decrease the cooling rate of the whole component. The component is lowered into water as illustrated in Figure 2(b).
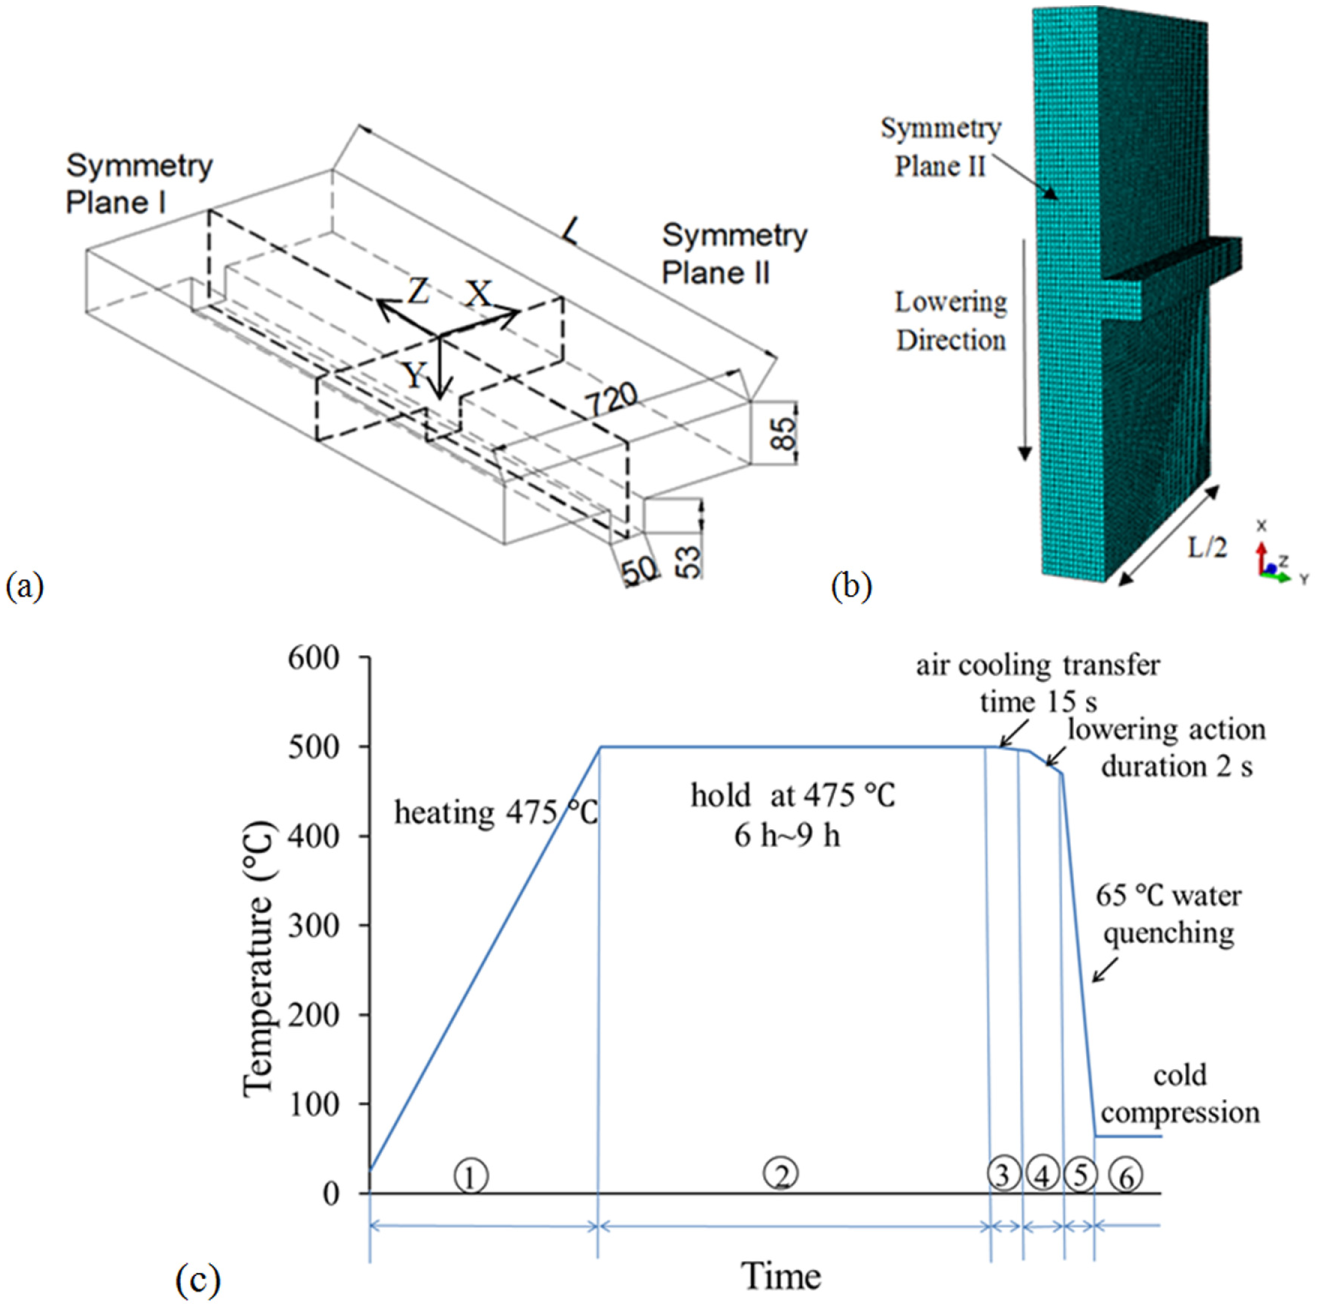
Model of quenching and cold compression processes: (a) T-section component geometry (dimension in mm), (b) illustration of the FE model showing the lowering direction and (c) thermal cycle for heat treatment and cold compression for AA7050 alloy.
A schematic illustration of the heat treatment process employed in the current model is shown in Figure 2(c). According to Prime and colleagues11,12 and Robinson et al., 13 the deleterious effect of large residual stresses should not be ignored when cold water (25 °C) is used as a quenchant. However, it will hinder the formation of the desired super-saturated solution if the component is quenched in boiling water (around 100 °C). Therefore, to ensure quenching with adequate cooling rate while reducing the quench-induced residual stresses, the water temperature is usually chosen between 60 °C and 70 °C. In industry, a huge water pool (sometimes over 20 m long) is built to quench extra-large T-section components. In addition, several agitators are installed at the bottom of the pool to keep the water temperature constant. For this study, the water temperature is taken as 65 °C. The first stage of the model is the removal of the component from the furnace after SHT, that is, the third section in Figure 2(c), where the component is uniformly at 475 °C. It takes 15 s to transfer the component in air before one end of the component first makes contact with the water. Subsequently, it is quickly lowered into water with a constant velocity of 360 mm s−1, thus taking 2 s to completely immerse the component. The component cools down in the water, which remains constant and uniform at 65 °C. Finally, cold compression is applied to reduce residual stress induced during quenching.
Thermal model of the quenching process
As the component has been held uniformly at high temperature for a substantial period of time, the residual stress resulting from the earlier manufacturing processes such as hot rolling and forging, as described in Figure 1, would have relaxed, and it is reasonable to assume that the stresses in components are negligible before water quenching.
A sequentially coupled thermal-mechanical analysis was performed, as any heat generated due to plastic deformation during quenching is considered negligible. Results including all nodal temperature history during the thermal analysis are transferred to the mechanical (stress) analysis as a predefined field input. Three dimensional (3D), 8-noded heat transfer elements, DC3D8, were employed in the thermal analysis and 8-noded 3D continuum reduced integration elements, C3D8R, were employed on the mechanical analysis. Reduced integration elements that were used as C3D8 elements are considered overly stiff 4 and they improve the computational efficiency. The mesh is illustrated in Figure 2(b).
Both radiation and convection heat transfer boundary conditions are applied to the T-section component. The ambient temperature is taken to be 20 °C and the emissivity ratio is set as 0.3. 14 The convective heat transfer coefficient is taken as 10 W m−2 K−1 for natural convection in air and for water quenching, temperature-dependent heat transfer coefficients were taken from Bamberger and Prinz 15 and other temperature-dependent thermal properties of 7050 aluminium alloy were taken from the study of Baldwin. 16 During the quenching process, the dominant heat transfer mechanisms from the T-section component and its surroundings change.
Mechanical model of the cold compression process
In the cold forging model, the dies are assumed to be discrete rigid bodies. As illustrated in Figure 3, the top die is flat and the bottom die is stepped to accommodate the T-section geometry. The final state of the quenched T-section component in the FE model is used as the initial state for the cold compression model. An arbitrary compression speed of 1 mm s−1 was used for all analyses, as speed has little influence on simulation results at room temperature according to Koc et al. 10 The cold forging process is divided into three displacement controlled stages: (1) the top die is moved downwards to compress the component (loading), (2) the die is held at constant displacement (holding) and (3) the top die is moved upwards to remove the applied load (unloading) and the residual stress develops.
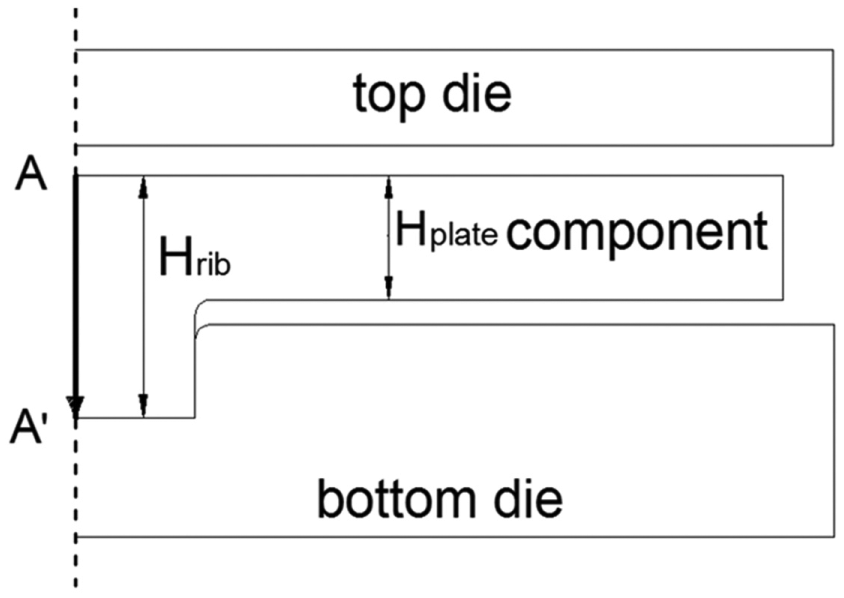
Schematic of the die and the paths AA′ for residual stress analysis. (Point A is located on the top surface of component, while point A′ is on the bottom surface.)
In the analysis, the bottom die is fully fixed in position, whereas the top die is free to move in the vertical direction during the compression process. Since the thickness of ribbed region, Hrib, and plate region, Hplate, of T-section component differ, an initial gap of height Hgap is required so that the compression ratio in both regions are equal. Note that Hgap may be calculated as the product of (Hrib − Hplate) and the compression ratio.
A cross-sectional view of the 3D compression model is illustrated in Figure 3. Full symmetry conditions have been exploited in the compression model (Figure 2(a)) and a quarter model has been employed, assuming that the residual stress distribution after quenching was relatively symmetric about Symmetry Plane I (as will be shown later). The top die is a cuboid of width 400 mm, height 50 mm and length 700 mm. The length and width of the bottom die are identical to that of the top die, but its height is dependent on the value of the compression ratio required. The height profile of the bottom die is shown in Figure 3. The bottom die is designed such that the rib and plate in the T-section component are subject to the same deformation ratio during forging process, thus minimising any non-uniform plastic strain caused by the cold compression process.
Material model
Dislocation-based constitutive equations have been implemented into the FE analysis via the user-defined subroutine, VUMAT, to describe the materials’ elastic-plastic deformation behaviour. In this study, a material model based on Cao et al. 17 has been employed. The constitutive equations for the material model are as follows
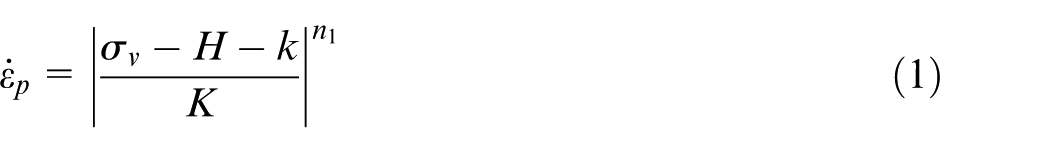


where
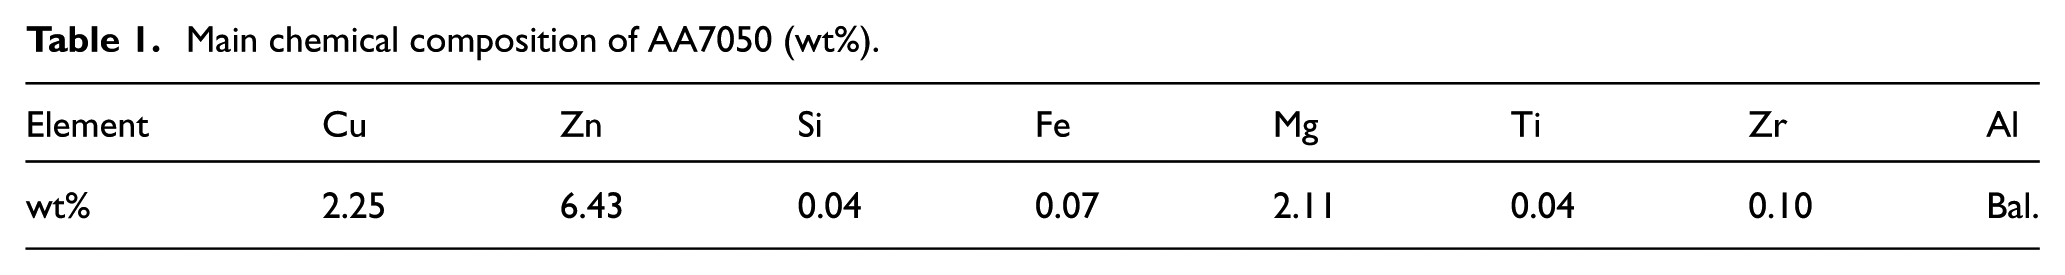
The chemical composition of the aluminium alloy AA7050 considered in this work is given in Table 1. To calibrate the material model and determine the material constants for the equations above, compression tests have been performed on cylindrical samples of AA7050, 8 mm diameter and 12 mm in height, to determine the material stress–strain response at a range of temperatures and strain rates using a Gleeble 3800 thermo-mechanical test machine (Dynamic Systems Inc., Poestenkill, New York, USA).
Main chemical composition of AA7050 (wt%).
As previously described, in an industrial manufacturing procedure, a 7XXX component undergoes SHT at 475 °C and is then rapidly quenched in a water bath at 65 °C, and subsequently plastically deformed by cold compression.18,19 Therefore, prior to compression testing in the Gleeble, the test samples were heat treated to simulate the industrial thermal process and material microstructure. The test samples were first heated to 475 °C in a furnace and held at temperature for 3 h; subsequently, they were quenched in water at 65 °C. Post-quenching, isothermal compression tests at a range of temperatures from 200 °C to 450 °C (Figure 4) were conducted on the Gleeble. The samples were re-heated in the Gleeble to 475 °C and held at that temperature for 30 s, then cooled at an approximate rate of 10 °C s−1 until the required test temperature was attained and the compression test was performed at the respective temperature. However, the samples tested at room temperature were finally water spray quenched to room temperature after air cooling to 180 °C to accelerate the cooling process. As shown in Figure 4, compression tests were performed at a range of temperatures for a constant strain rate of 0.1 s−1 and for a range of strain rates, 0.01, 0.1 and 1 s−1 for a constant temperature of 450 °C.
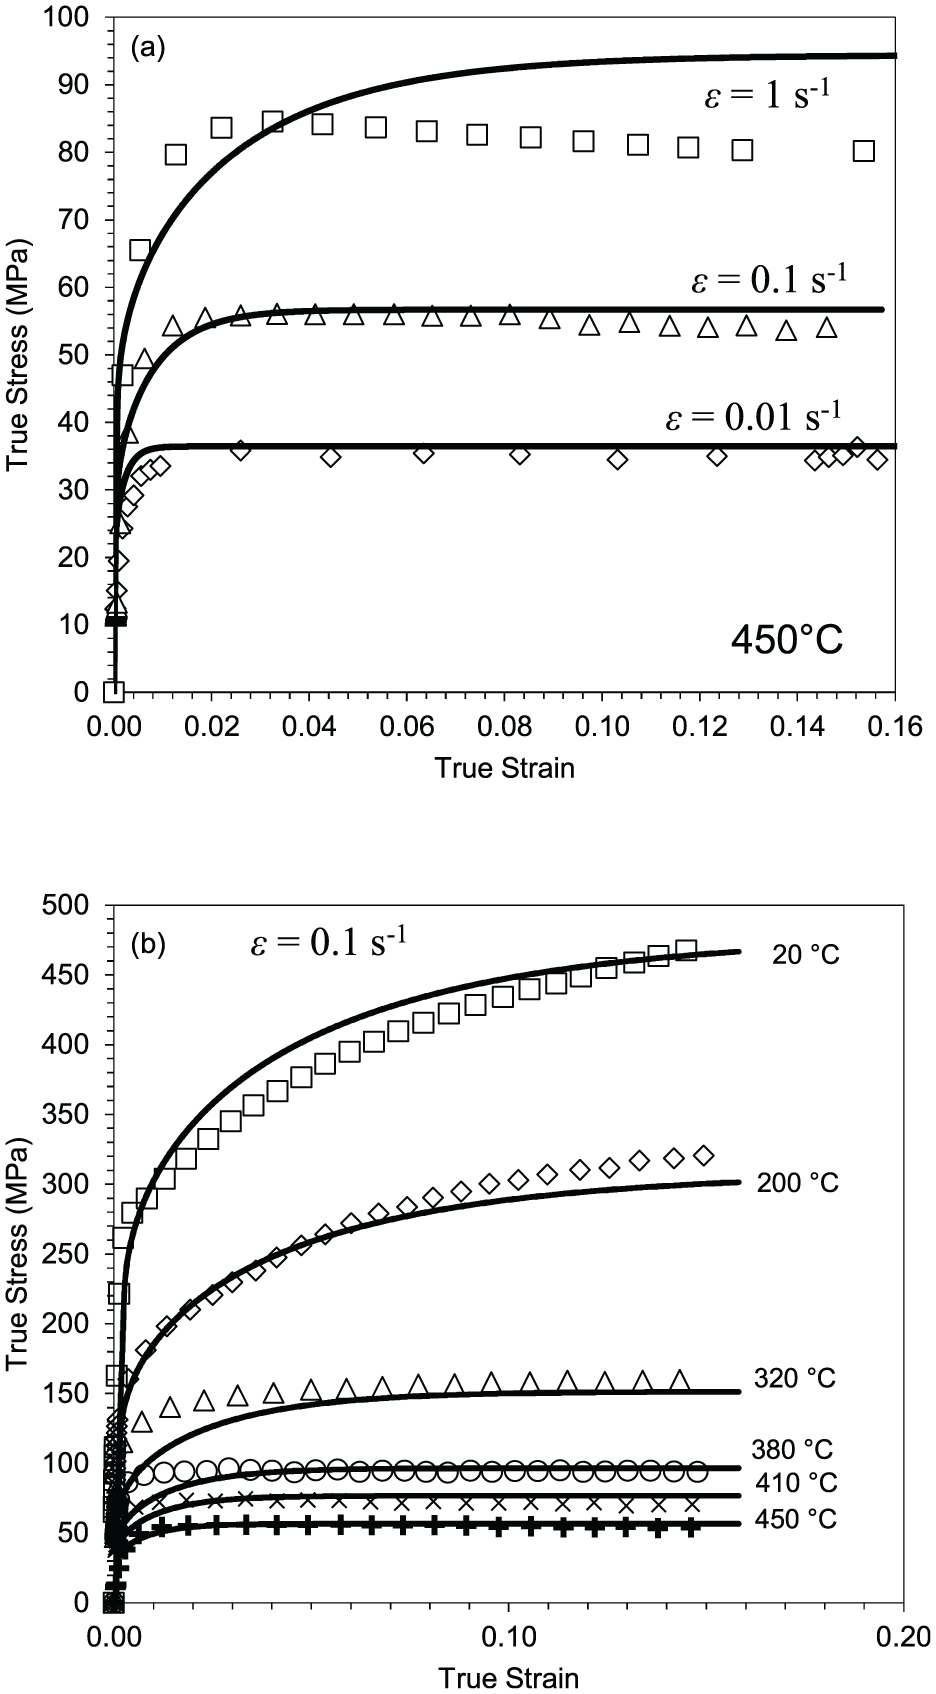
Stress–strain curves at (a) a constant temperature of 450 °C and a range of strain rates and (b) at a constant strain rate of 0.1 s−1 and a range of temperatures.
Results of these uniaxial compressive tests of AA7050 were used to calibrate the earlier equations. The determined material constants for the equations are listed in Table 2. Figure 4 shows the comparison of the experimental data (symbols) and the simulated results using the constants in Table 2 (solid lines) under different strain rates and temperatures, demonstrating a good agreement.
Material constants for the visco-plastic constitutive equations of AA7050.
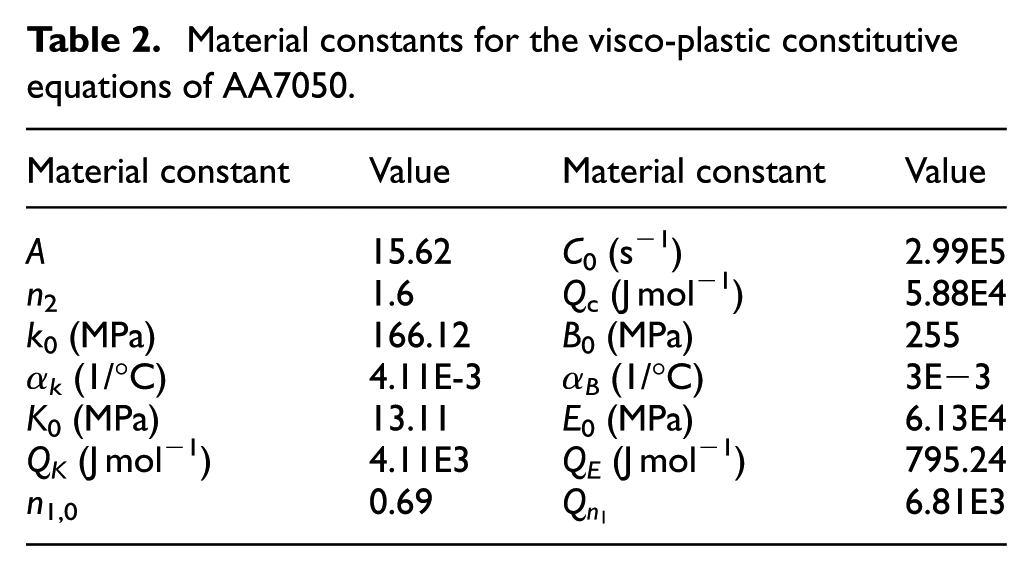
During quenching, the total strain increment,


where
Thermal and residual stress distributions due to quenching
Figure 5 shows the transient temperature distributions at five locations across the T-section component (along x-axis) during the quenching process. These five points, distributed evenly through the width of the plate at 180 mm intervals, are located at the mid-length of the plate (z = 0 mm) and positioned 50 mm from the left surface as indicated in the inset in Figure 5. Note that a log-scale has been used on the time axis in Figure 5 to enable the differences in the first few seconds to be seen clearly. There is little temperature decrease during the air cooling period (0–15 s). The surface containing Point 1 touches the water first in 15 s (Figure 2(b)) and during the lowering period (from 15 to 17 s), Points 2–5 are sequentially immersed into the water. It can be seen that, negating the 2 s time difference in time for Points 1 and 5 to enter the water, both points have similar thermal profiles during quenching, as is the case for Points 2 and 4. This is because that Points 1 and 5 (and Points 2 and 4) are at symmetric positions, that is, at exactly the same position relative to the bounding surfaces of the component.
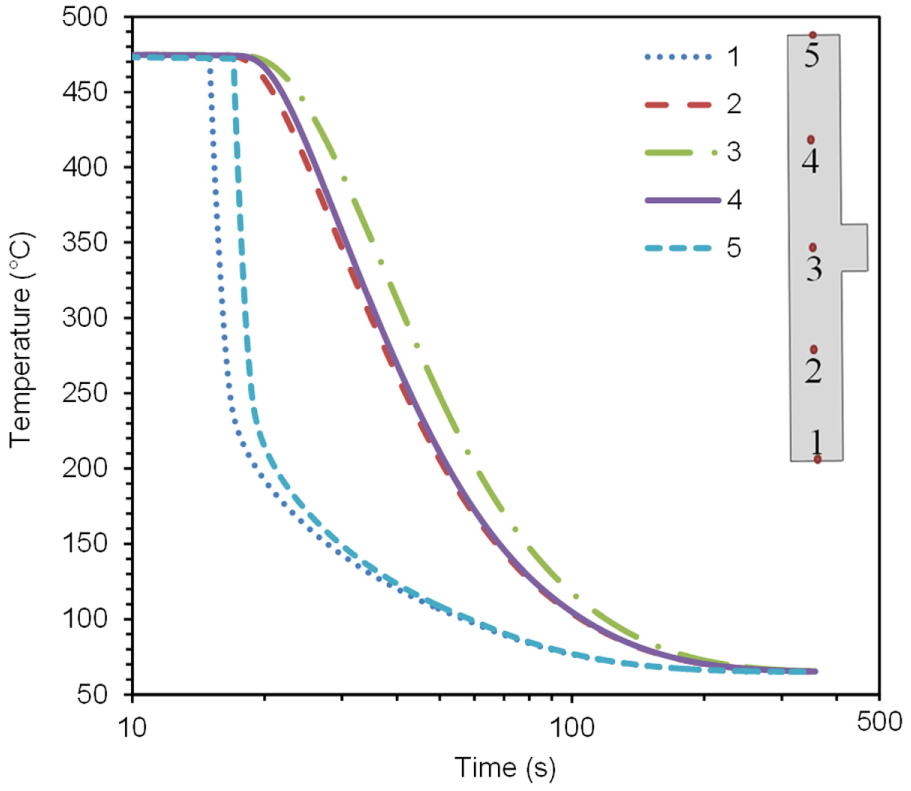
Cooling curves at different locations in T-section component during quenching in 65 °C water.
Figure 6 shows the contour plots of the predicted temperature distribution during quenching. As can be seen from Figure 6(a), the decrease in temperature during the transfer period is minor. When the component is in contact with water, the surface temperature decreases quickly (Figure 6(b) and (c)). Figure 6(d) shows such a state when the whole component has been immersed in the water for 3.5 s. At this time, the core of the component is still hot while the surface has rapidly cooled to a relatively low temperature.
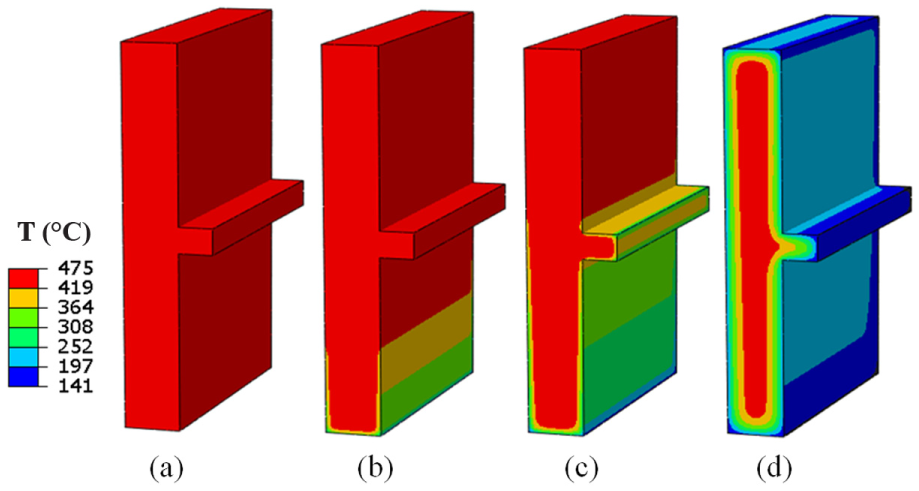
Contour plot of the temperature distribution during various stages of the quenching process. (a) After 15 s transfer time (air cooling), (b) initial stages of quenching (15.6 s), (c) over half the sample immersed (16.2 s) and (d) 3.5 s after full immersion (20.5 s).
Thermal stresses are generated when the surface of a thick component is rapidly cooled (or heated). Rapid surface cooling during quenching leads to surface contraction that is restrained by the underlying material leading to a large tensile stress being generated at the surface that is balanced by a compressive stress in the underlying material. As time proceeds, the near-surface material has cooled but the central part of the component continues to cool and contract. This core contraction is resisted by the currently cold and therefore relatively stronger outer material. As a consequence, the tensile stress gradually builds in the centre which is balanced by the compressive stress that develops around the surface of the component.
Figure 7(a) shows the post-quench residual stress distribution in the x-, y- and z co-ordinate directions through the thickness of the plate from the flat surface (y = 0 mm) to the tip of the rib (y = 138 mm) that is, the line A–A′ defined in Figure 3. Figure 7(b) shows the three stress components in a path along the length of the plate (z-direction) and at a depth 50 mm below the top surface. Note that z = 0 mm corresponds to the centre of the component and z = 500 mm to the surface. The corresponding contour surface plots are given in Figure 8.
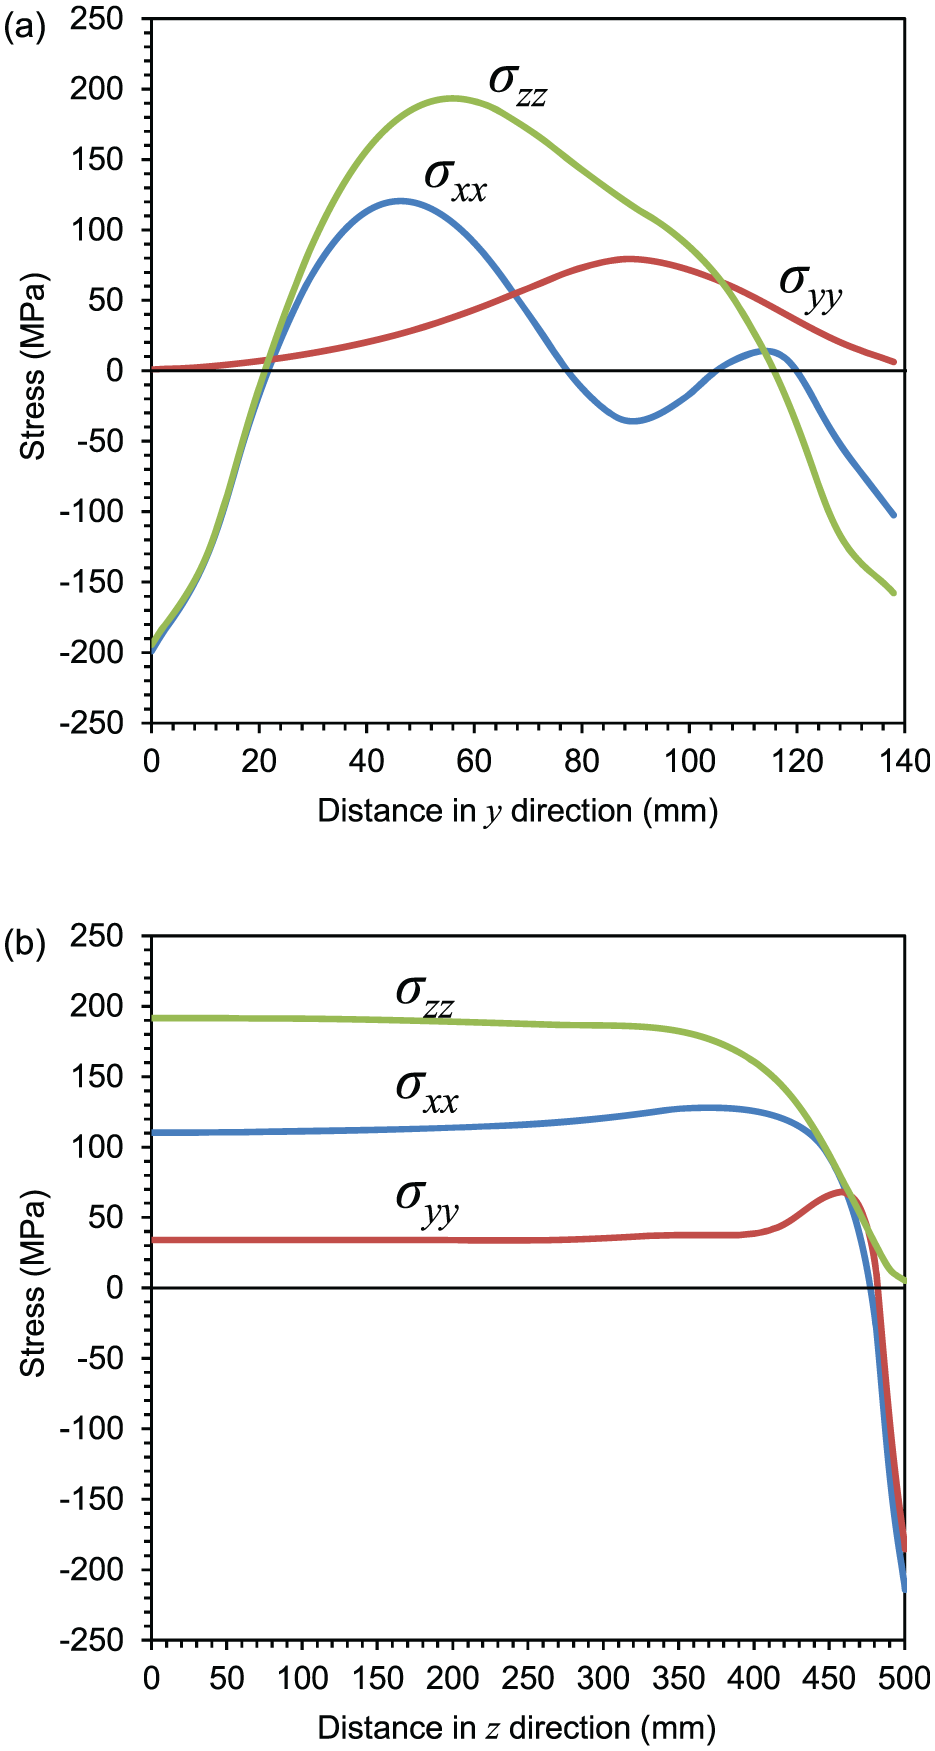
Quenching residual stresses profile in the T-section component along the (a) y- and (b) z co-ordinate direction.
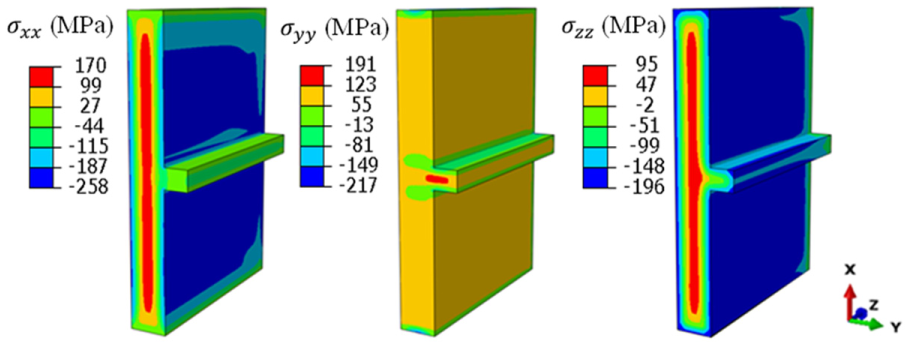
Contour plots of the post-quench residual stress distribution in the three co-ordinate directions.
The expected trends are seen in Figures 7 and 8. Residual stresses of up to 0.55 times the uniaxial yield stress have been developed due to quenching. As shown in Figures 7(b) and 8, the components of residual stress post-quenching in the transversal and through thickness directions, σxx and σyy, respectively, are compressive at the surface of the T-section component. At 10 mm from the surface, they become tensile and become approximately constant at 150 mm from the surface with peak values of 111 and 34 MPa, respectively. The longitudinal direction stress, σzz, is however tensile throughout and attains a peak value of 191.5 MPa at the centre and diminishes to zero at the surface, as necessary. Neglecting edge effects (150 mm from the sample surface), the longitudinal stress is relatively uniform along the length of the component.
Through the thickness (y) direction, Figure 7(a) shows that σxx and σzz are compressive at the top and bottom surfaces and are tensile towards the centre, while the σyy stress remains tensile and tends to zero at both ends, as required. In addition, it can be seen from Figure 8 that the stresses are relatively symmetric about the y-z plane (Symmetry Plane I in Figure 1(a)) which implies that the fact that Point 1 enters the water before Point 5 has limited effect on the overall residual stress distribution of this T-section component. This justifies the use of a quarter geometry model in the compression forging model, thus reducing computational time.
Residual stress reduction by cold compression
The effectiveness of the cold compression residual stress reduction technique has been evaluated by comparing the stress distributions in the T-section component before and after cold compression. To quantify the level of residual stress reduction, the percentage stress reduction, at the point of peak residual stresses prior to compression, has been calculated. The peak reduction in both tensile and compressive residual stresses has been evaluated to assess the influence of the cold compression on residual stress relaxation.
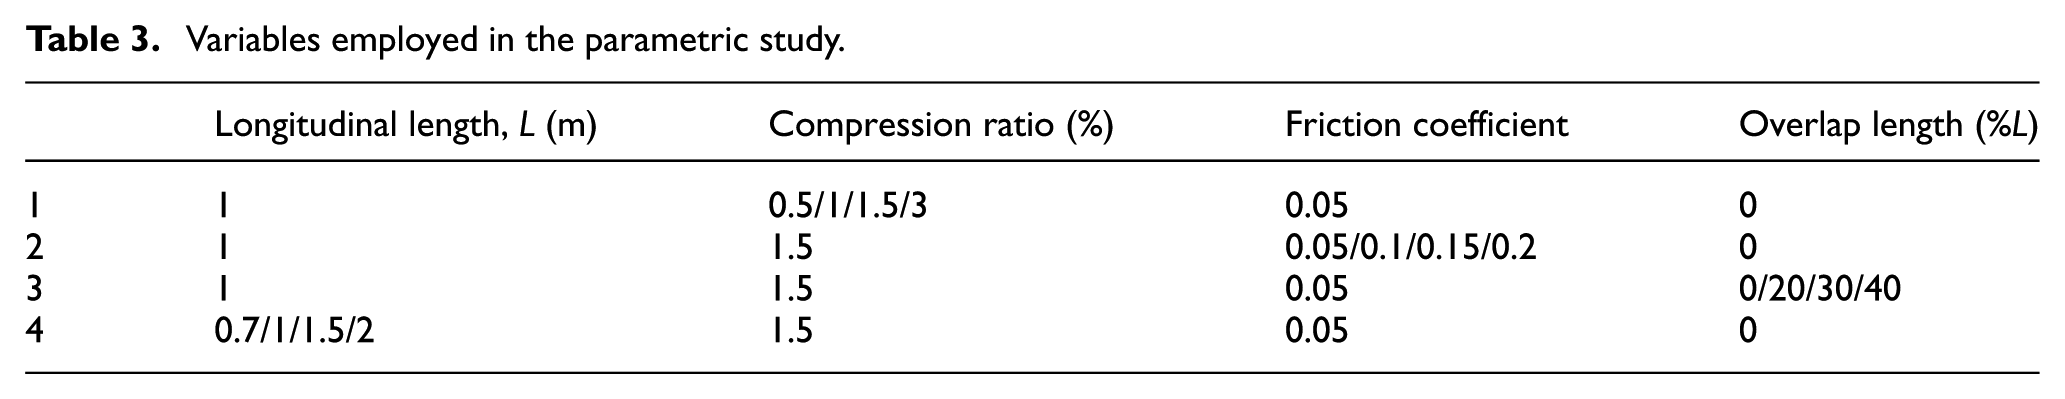
The residual stress distribution in the T-section component may be influenced by many factors during forging operation, such as compression ratio, friction coefficient, length of overlap and its longitudinal length. Table 3 identifies the variables in the parametric study that has been performed. In order to study the influence of these factors on residual stress evolution during the compression process, path AA′ identified in Figure 3 was examined.
Variables employed in the parametric study.
Compression ratio effects
Contour plots of the residual stress distribution after 1.5% and 3% compression are presented in Figures 9 and 10, respectively, assuming a friction coefficient of 0.05. Compared to the post-quench residual stress distribution shown in Figure 8, it can be seen from Figure 9 that after 1.5% compression, the residual stresses experience a marked decrease in the three co-ordinate directions, with the percentage peak stress reduction in the range of 88.4%–96.2%. Clearly with both compression ratios, the residual stresses have been markedly reduced. The results also show that there is no advantage in applying 3% compression to the cold forging for reducing residual stresses in T-section component compared to 1.5% compression ratio. In fact, residual stress levels for 3% compression show a slight increase over those for 1.5%. In addition, it can be seen from Figure 10 that tensile stresses exist in the rib at the centre of top surface after 3% compression.
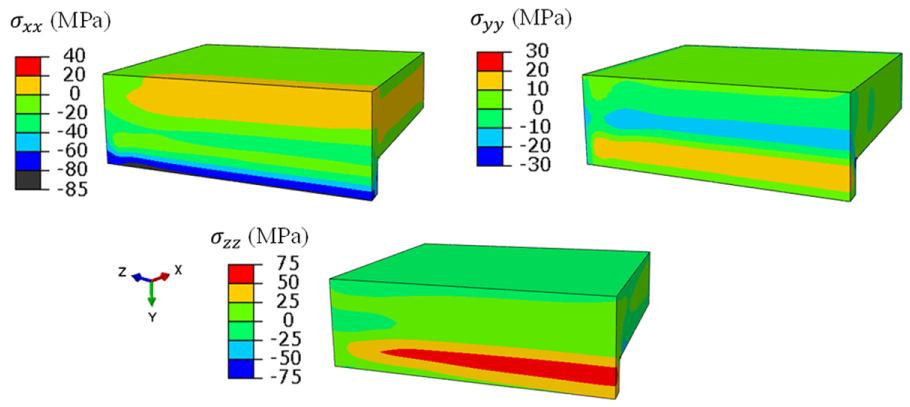
Residual stresses distribution after 1.5% compression.
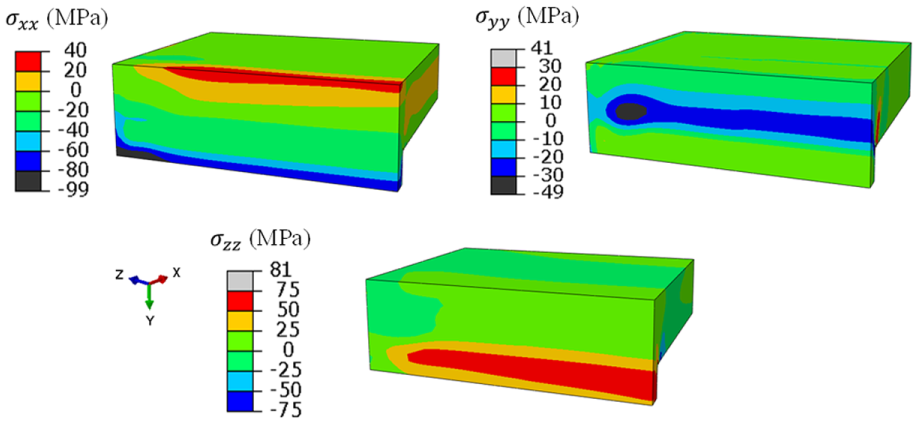
Residual stresses distribution after 3% compression.
Figure 11 indicates the residual stress profiles along the path AA′ (Figure 3), where 0% represents the profiles before compression. It also shows that the stress relaxation trend is more prominent at low compression ratios, that is, at 0.5% and 1%. While for higher compression ratios (>1.5%), further decrease in residual stress with increasing compression ratio becomes less remarkable. Therefore, the residual stresses in the T-section component can be effectively removed with compression ratio of around 1.5% and friction coefficient of 0.05.
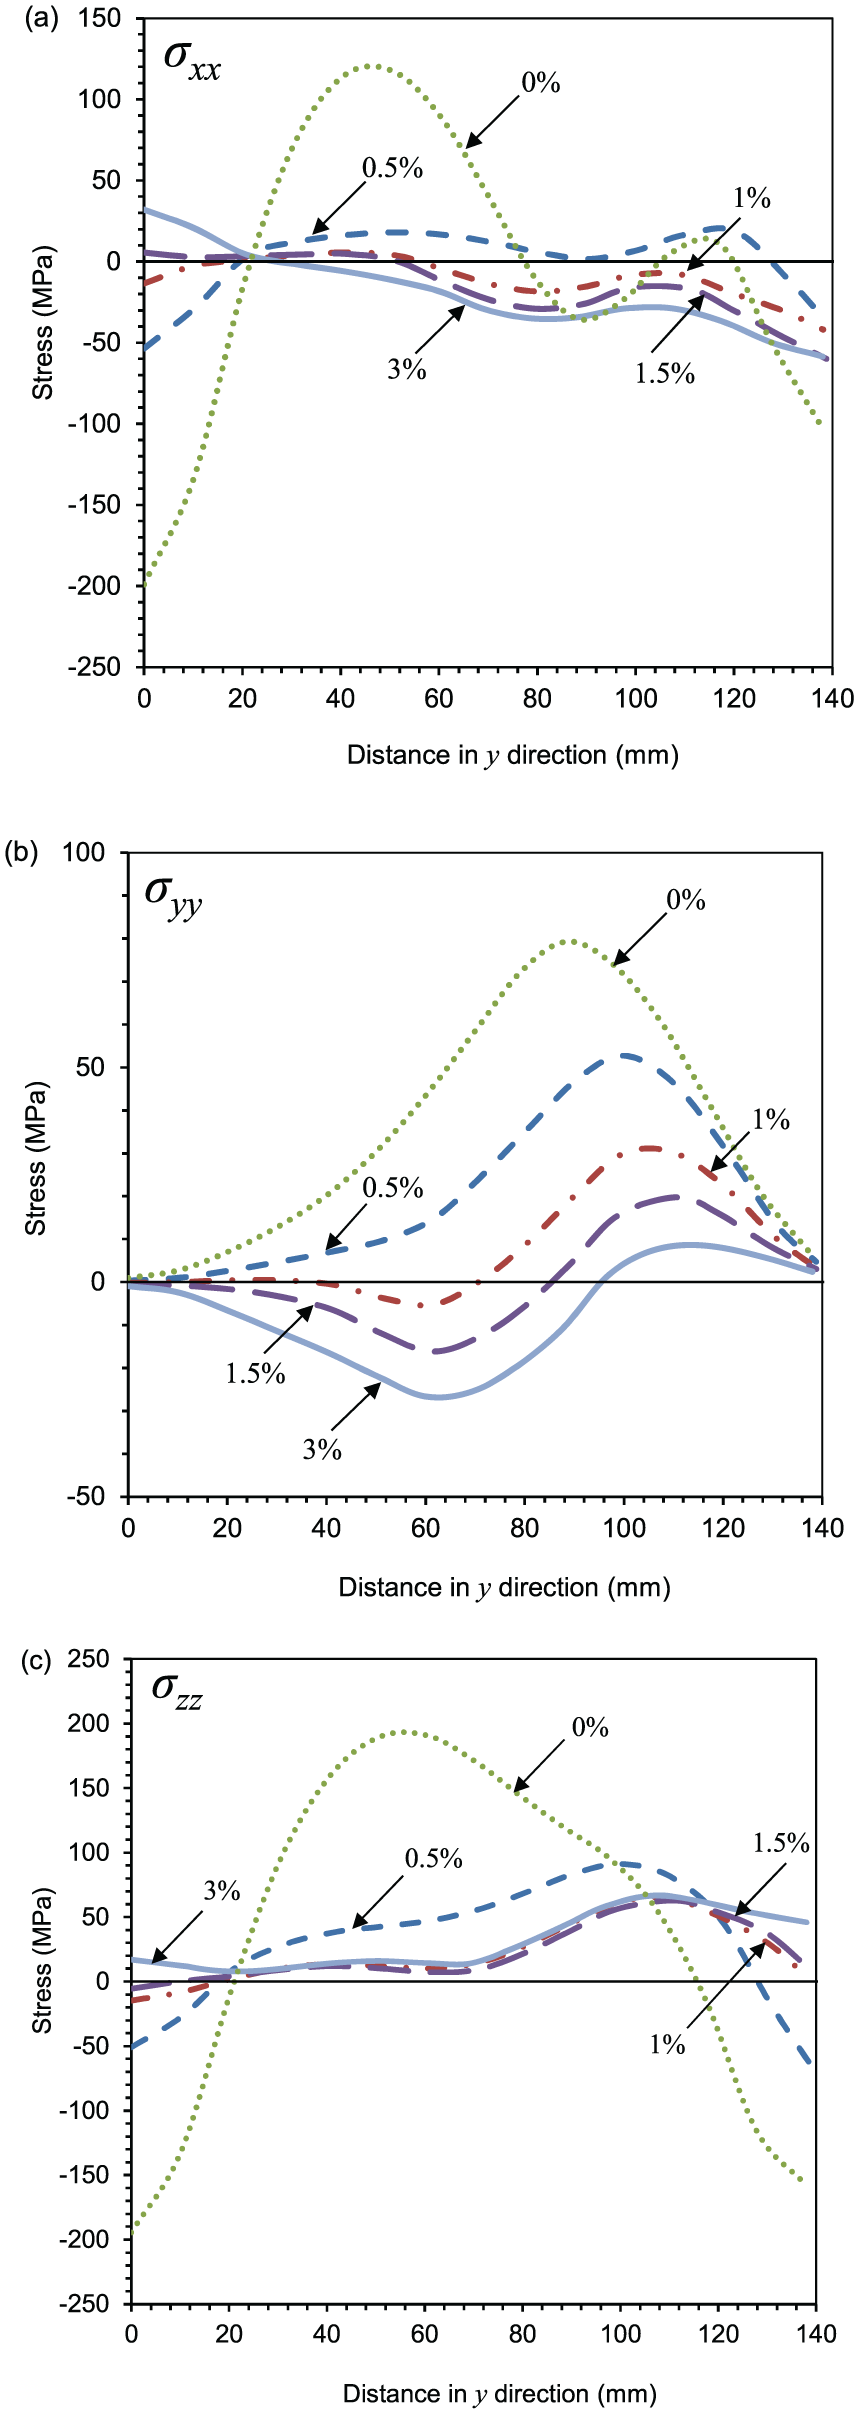
(a)
Friction coefficient effects
Simulation results for the percentage reduction of residual stresses after uniform (no overlap) 1.5% compression are presented in Table 4, where a lubricated condition and a friction coefficient of 0.05 were assumed. For the point of peak stress identified prior to compression, the percentage stress reduction ranges from 91.1% to 96.5%, except the compressive stress in x-direction (which occurs at the corner of T-junction) which is slightly less at 88.4%.
Percentage peak stress reduction in the T-section component (1 m length) after lubricated cold compression without overlap (
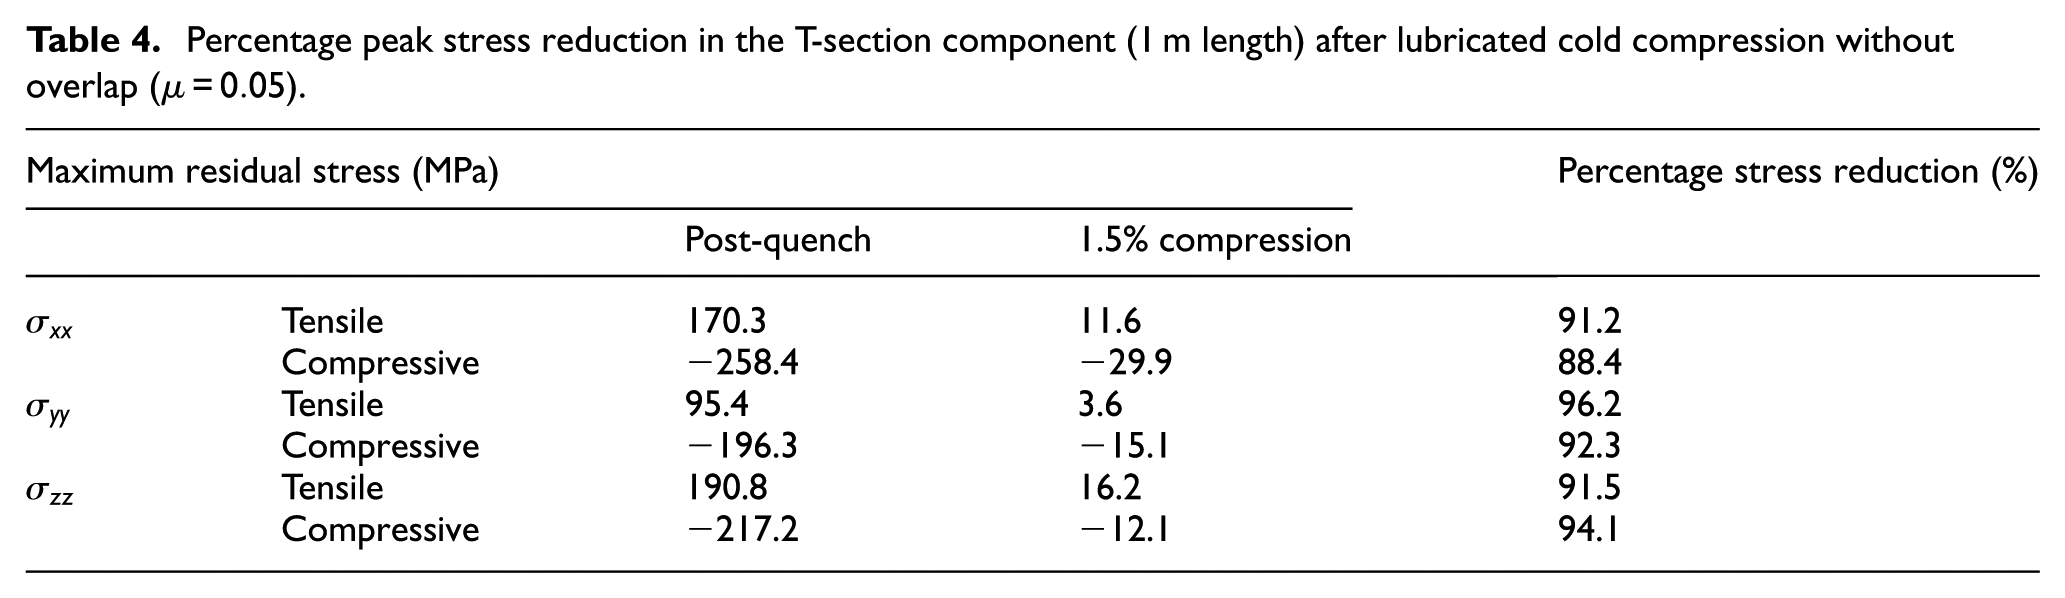
The level of friction between the die and the component can also affect the resultant residual stress distribution post-compression. As discussed above, Figure 9 shows the residual stress distribution of the component with a lubricated surface and subject to 1.5% compression. In comparison, a contour plot of the residual stresses employing a friction coefficient of 0.15 between the component and the die, which represents semi-dry lubrication conditions, is presented in Figure 12. At this friction coefficient, all residual stress components have been reduced post-compression, but less than those obtained using a friction coefficient of 0.05. Comparing Figures 9 and 12, it can be deduced that high levels of friction can lead to less residual stresses reduction. More importantly, with an increasing friction coefficient, relatively large tensile residual stresses, σxx and σzz, appear near and at the surface. Therefore, a low friction coefficient is preferred. In practice, lubrication is applied between the die and the component.
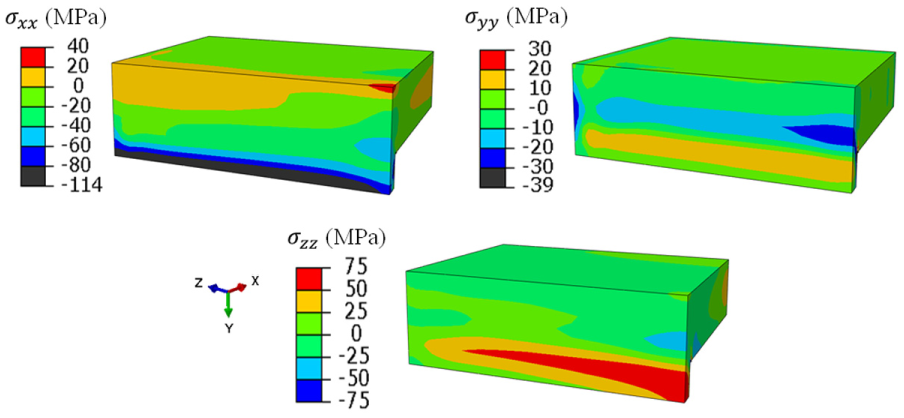
Residual stresses distribution after 1.5% compression (
Figure 13 shows the residual stress distribution after compression along the path AA′ for various friction coefficients. The importance of lubrication to reduce residual stresses by cold forging is evident from this figure. An increase in friction coefficient leads to progressively higher magnitude residual stresses, as expected.
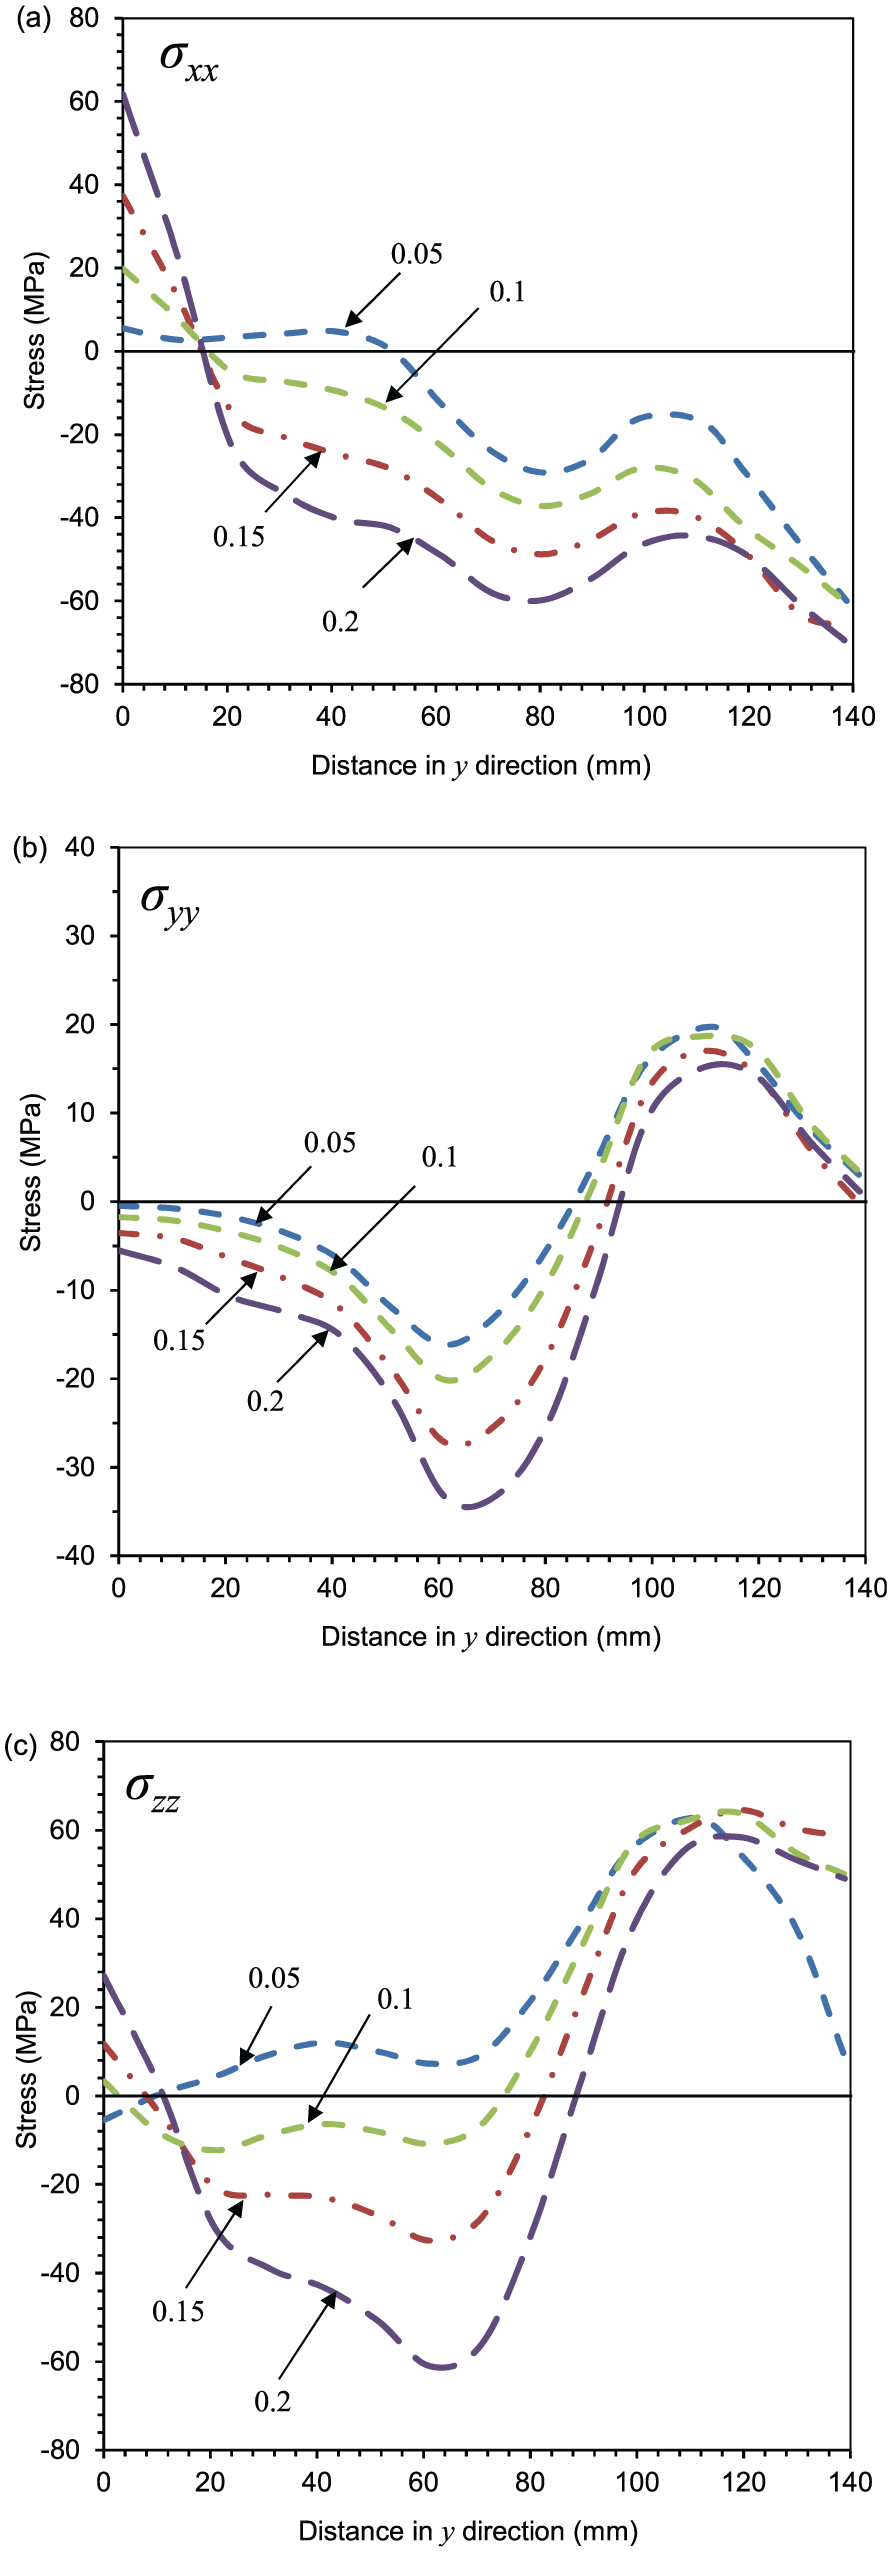
Influence of friction coefficient on the residual stress profiles along path AA′, through the thickness of plate and rib.
Effect of overlap length
The overlap length between two consecutive forging operations also influences the residual stresses distribution of the component. Contour plots of the residual stress distribution with overlap lengths of 20%L, 30%L and 40%L are shown in Figure 14(a)–(c), respectively. The position of the end of the die in contact with the component during compression can be clearly identified in Figure 14 as, for example, the two blue lines on the surface of the plate for the σxx stress contour plot, etc. These blue lines indicate a region of intensified compressive stress, due to the stress concentration feature effects of the corner of the die. Comparing Figures 9 and 14 shows that, compared with the component compressed without overlap, the compression with overlap not only leads to the growing area of undesired stress fluctuation in the three co-ordinate directions, but also increases the magnitude of residual stresses in all directions. The maximum σxx tensile residual stress after compression with overlap increases markedly from 15 to about 76 MPa, while the maximum compressive stress changes from −85 to −121 MPa. The σyy stress component shows similar tendencies. There is not much influence seen in multi-step cold compression on the tensile σzz stress, but the compressive σzz stress changes from −37.1 to around −124 MPa. However, as shown in Figure 14, variations in overlap length of 20%L, 30%L and 40%L have little effect on the overall values of the residual stresses.
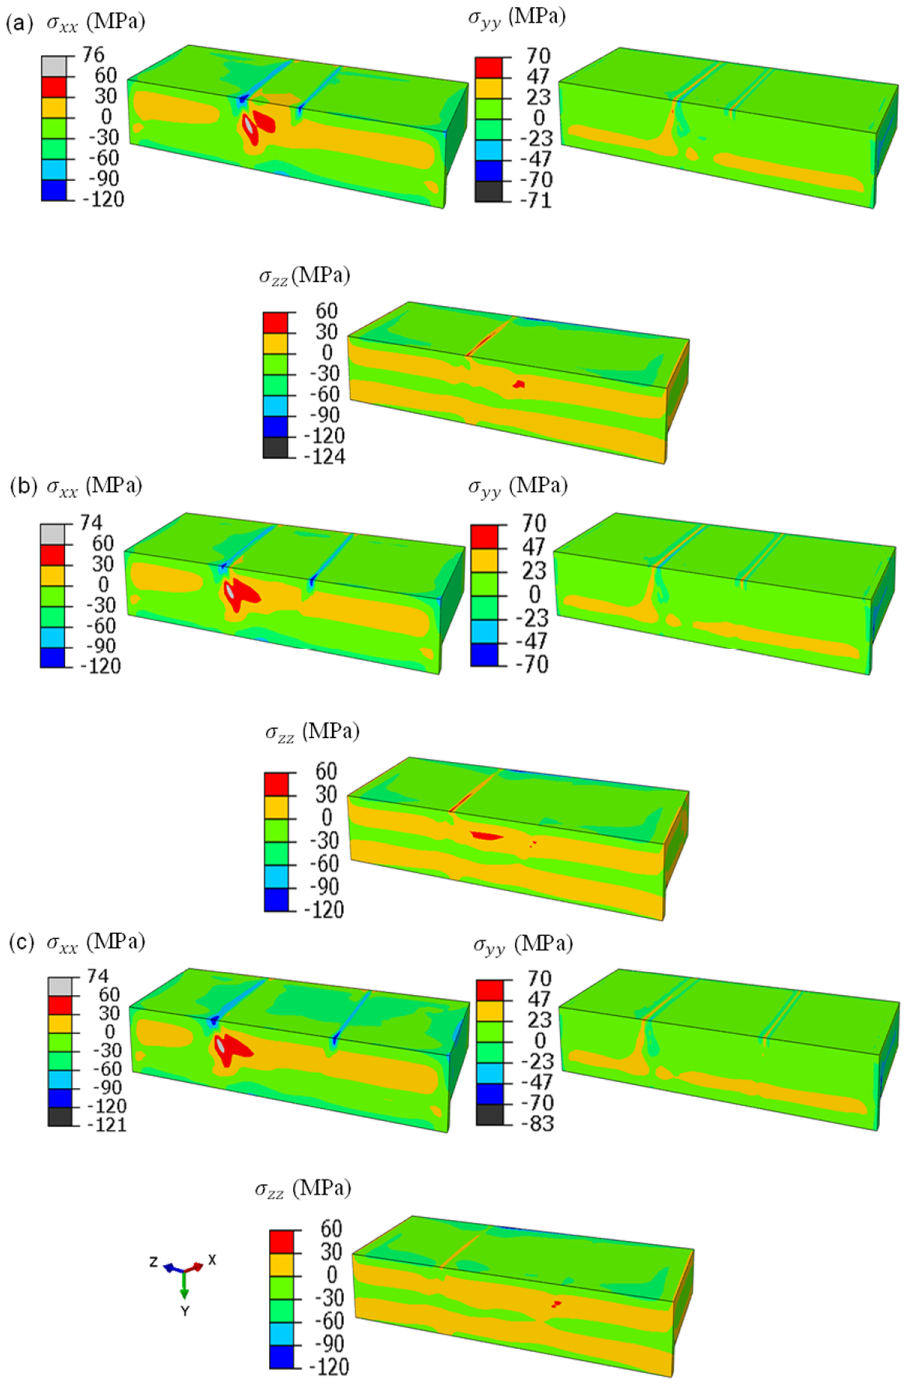
Effect of overlap length on residual stress distribution: (a) 20%L, (b) 30%L and (c) 40%L.
Component length effects
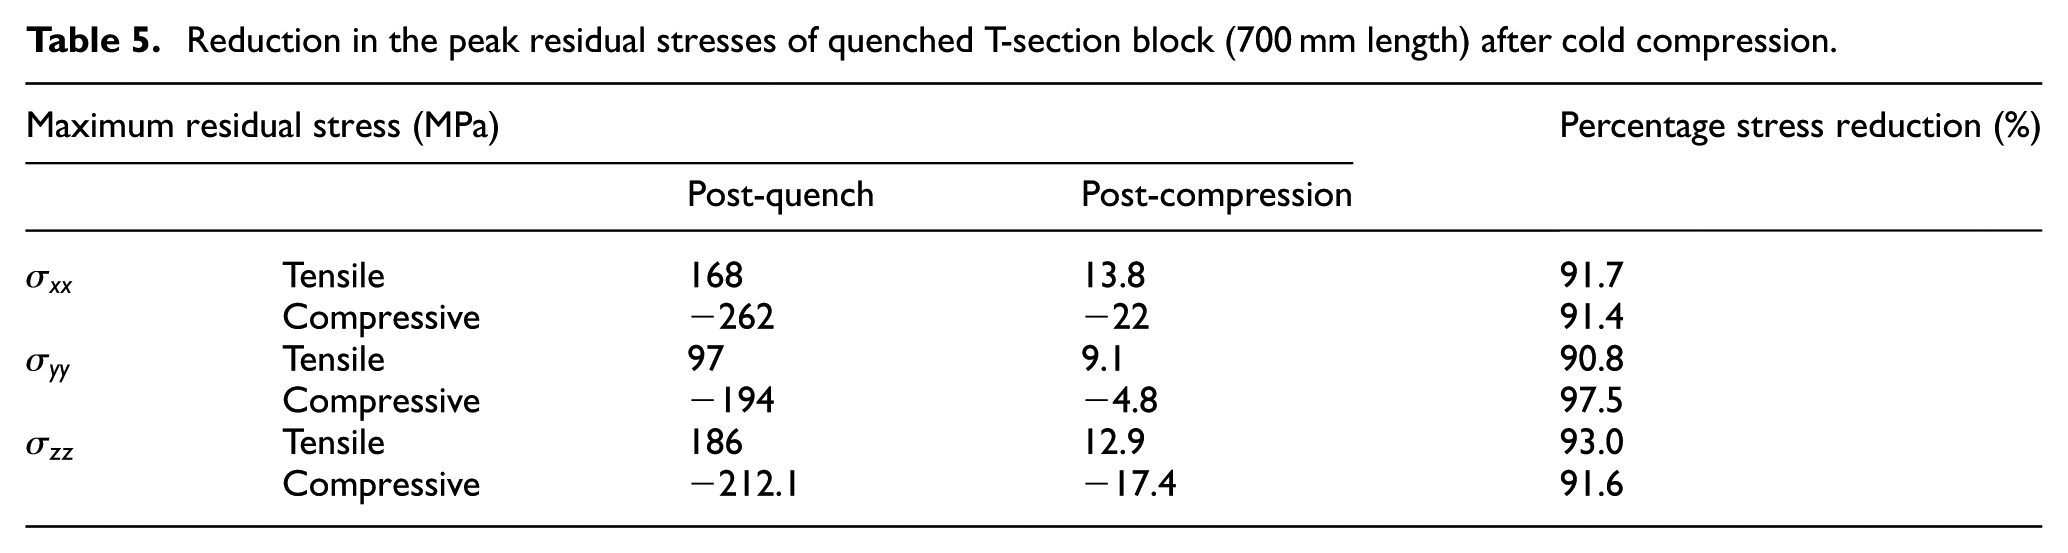
For an extra-large component, longitudinal length is an essential factor on residual stresses. Four longitudinal lengths, namely, 700, 1000, 1500 and 2000 mm were simulated to investigate its effect. Tables 5 and 6 state the value and percentage reduction of residual stresses, at the point in the T-section component identified with the peak stress value prior to compression, for the longitudinal lengths, 700 and 2000 mm, respectively, which are the extreme values considered in this study. The corresponding values for 1000 mm are previously shown in Table 4. From these tables, it can be seen that increasing longitudinal length of the T-section component has no clear influence on residual stresses in the
Reduction in the peak residual stresses of quenched T-section block (700 mm length) after cold compression.
Residual stresses of quenched T-section block (2000 mm length) after cold compression.

Conclusion
An integrated FE modelling method, incorporating a calibrated dislocation-based material model, has been developed to simulate SHT and subsequent water quenching of AA7050 T-section components. Subsequently, processing routes have been simulated that aim to remove the residual stresses generated during the quenching process. The effectiveness of a multi-step cold compression technique to remove residual stresses has been examined, and a sensitivity study performed to determine the influence of key parameters including compression ratio, friction coefficient between the plate and die, component length and overlap length. The influence of different parameters on residual stresses in different directions has been studied and the optimised cold forging conditions are suggested for the reduction of residual stresses.
Quenching of large AA7050 T-section components results in large residual stresses. The maximum tensile residual stress exceeds 190 MPa at the core of the component and the compressive stress exceeds −250 MPa at the surface, which is approximately 40% and 50% of the yield stress of AA7050, respectively. Cold compression has been found to greatly reduce these residual stresses, with the percentage residual stress reduction reaching 88.4%–97.5%. The optimal compression ratio for reducing residual stress in the T-section component is around 1.5% under lubricated condition. Cold compression with deformation ratio above 3% does not provide any additional benefit. Lubrication has a strong effect on the effectiveness of cold compression process for residual stress reduction. A high level of friction between the component and die effectively limits the success of compression and leads to relatively large σxx and σyy near surface tensile residual stresses.
During multi-step compression, a region of overlap between successive operations significantly affects the residual stress distribution in the vicinity of the overlap region. A notable increase in the final residual stress distribution was found compared to those compressed without overlap, for example,
Footnotes
Appendix 1
Declaration of conflicting interests
The author(s) declared no potential conflicts of interest with respect to the research, authorship, and/or publication of this article.
Funding
The author(s) disclosed receipt of the following financial support for the research, authorship, and/or publication of this article: Financial support for the research is acknowledged. This work was supported by the Aviation Industry Corporation of China (AVIC) the First Aircraft Institute (FAI). The research was performed at the AVIC Centre for Structural Design and Manufacture at Imperial College London. Dr Catrin M. Davies acknowledges the Engineering and Physical Sciences Research Council (EPSRC), UK, for the support under grant EP/I004351/1.