
Abstract
This article presents a systematic approach for assessing the maturity of manufacturing technologies. A methodology is proposed that is based on modelling the capability of the individual processes and technology interfaces between them. It is inspired by a capability maturity model which has been applied successfully in the field of software engineering. The methodology was developed to assess the maturity levels of individual processes and the combined maturity of pairs or chains of processes. To demonstrate its validity, it was applied for assessing the maturity of technologies in the micro and nano manufacturing domain. The results demonstrated its applicability as a tool for evaluating the maturity of micro and nano manufacturing pairs and their constituent processes. Also, it was shown that the methodology can be employed for identifying process pairs, suitable for integration in process chains, together with their potential weaknesses.
Keywords
Introduction
The global market for miniaturized products has been increasing continuously in the last decade. 1 This demand for micro-products and components has risen rapidly across many industrial sectors, especially in the electronics, optics, medical, biotechnology, automotive, communication and avionic industries.2,3 Examples of specific applications/products are medical implants, micro-scale pumps, valves and mixing devices, micro-fluidic systems, micro-optics, micro-nozzles and micro-molds.
This trend towards product miniaturization has brought with it a number of associated product development trends. In particular, designers aim and tend to develop new products that integrate a variety of functions, thus broadening the products’ application areas, while simultaneously significantly reducing cost, size, material usage and power consumption. To satisfy specific functional and technical requirements, single components in such devices often integrate micro- and nano-scale structures. 4 Consequently, such a trend for ‘function integration’ necessitates the creation of manufacturing capabilities for ‘length scale integration’ at component and product levels. For example, the development of new devices that require the manufacture of parts incorporating three-dimensional (3D) functional features covering the whole range of sizes from few 100 µm to sub-100 nm. 5 In addition, function integration relies on and necessitates the introduction of new specially developed materials6–9 in order to benefit from their ‘optimized’ properties for micro- and nano-scale processing.
At the same time, individual micro and nano manufacturing technologies (MNTs) that underpin the development of such products have their limitations/constraints and cost-effective processing windows with regard to the length scale of features and materials that can be processed, complexity of the structures and the production rates that can be achieved. 10 Therefore, in practice, miniaturized devices with a complex geometry, which incorporate different length scale features, cannot be produced by employing a single fabrication technology. An integration of several compatible and at the same time complementary MNTs in process chains is required to produce such devices in required quantities cost effectively. Thus, it is not surprising that the design and validation of such process chains have attracted the attention of researchers, and some successful implementations have been reported to address specific functional and technical requirements of emerging multi-material products.11–16
However, the manufacture of micro-products using such process chains is still in its infancy, and thus, further research is required to characterize existing process chains and also to develop new ones for the fabrication of miniaturized multi-material products. This prompts the research community to look for systematic approaches to assess such process chains at the technology and platform levels. At the technology level, the interfaces between component manufacturing technologies in such process chains should be analysed in order to assess both their individual and combined capabilities and also their compatibility and complementarity. While at the platform level, it is important to develop a tool for evaluating the ‘maturity’ of process chains as potential manufacturing platforms for producing miniaturized products. Both types of analyses will also lead to ideas for new process chains and will represent an objective means for assessing the risks associated with the adoption and implementation of these technologies and the manufacturing platforms underpinned by them. 17 In addition, the ability to assess the ‘maturity’ of the technologies in process chains will also provide a means for benchmarking them. 18 Such benchmarking could be used for ranking purposes and therefore could eventually be applied for process chain selection when there are alternative competing solutions for the fabrication of a given micro component. 18 In this context, the objective of this research is to develop and validate a systematic approach for assessing the maturity of technologies in the micro and nano manufacturing (MNM) domain.
The article is structured as follows. After reviewing a number of maturity assessment techniques, a method for assessing the maturity of MNM processes and process chains is presented. Then, a pilot application of this methodology on a set of MNM processes is described to demonstrate its capabilities. Finally, the results from this pilot application are discussed, and conclusions are made about the viability of the proposed methodology.
A review of technology maturity assessment approaches
A popular concept for assessing the maturity of technologies is the Technology Readiness Level (TRL). The TRL concept represents a systematic metric/measurement system that is designed to assess the maturity of a given evolving technology and also to compare the maturity of different technologies. 19 The assessment is based on a scale from 1 to 9, and generally, if a technology is more developed, the higher is its TRL. The TRL concept and the associated scale were developed over two decades, in particular, from mid-1970s to the mid-1990s by the National Aeronautics and Space Administration (NASA).20,21 Since their inception, the TRLs have been used within organizations such as NASA, the U.S. Department of Defense, the Air Force Research Laboratory, the European Space Agency and the Turkish defence industry20–23 for measuring the maturity of technologies utilized in military and aerospace systems. In addition, it was proposed to use the TRL concept for monitoring the maturity of emerging technologies 24 and also for evaluating the readiness of software products. 23 Recently, Brousseau et al. 17 proposed a methodology inspired by the TRL concept that utilizes a common scale composed of seven ‘maturity phases’ for assessing the MNM processes’ maturity. This approach was designed to overcome some of the limitations of the TRL concept. Especially, the proposed methodology was developed to simplify the maturity evaluation procedure by combining a large number of inputs from rich and validated knowledge repositories, for example, in the form of portfolios of R&D projects. Furthermore, Reinhart and Schindler 25 proposed an approach for evaluating the maturity of a manufacturing technology by combining the technology maturity assessment approach proposed by Brousseau et al. 17 with the technology life cycle concept of Ford and Ryan. 26 However, these two approaches do not provide a means for assessing the maturity of process chains that integrate more than one constituent manufacturing technology.
Other maturity assessment approaches find their origins in the field of quality management. One of the earliest of these is Crosby’s Quality Management Maturity Grid, 27 which was designed to evaluate the status and evolution of an organization’s approach to quality management at five levels of maturity. One of the best-known derivatives from this approach is the Capability Maturity Model (CMM) in software engineering. The software CMM was introduced by Humphrey 28 and subsequently elaborated further by the Software Engineering Institute (SEI) at Carnegie Mellon University. 29 It is a comprehensive model for a continuous software development that describes an evolutionary improvement path for software organizations from an ad hoc, chaotic and immature process to a mature and disciplined one. In particular, it classifies processes and organizations into five levels of maturity based on the underlying engineering and management practices that characterize them, namely, (1) Initial, (2) Repeatable, (3) Defined, (4) Managed and (5) Optimized. This SEI CMM has been applied by thousands of organizations 30 and also has inspired the development of other models that address the specific capabilities required for specialized applications. These multiple models have been consolidated into the Capability Maturity Model Integration (CMMI) approach which is a process improvement maturity model for the development of products and services. 31 The concepts of process or capability maturity are increasingly being applied to a range of activities, both as a means of assessment and also as part of a framework for improvements. In particular, CMM/CMMI-based maturity models were proposed for a diverse range of activities such as assessment of electronic products’ reliability, knowledge management, product development collaborations, risk management in complex product development projects and manufacturing engineering and project management.32–37 However, the existing body of literature reveals that to date, there are no CMM-based maturity models for assessing manufacturing processes and process chains despite the potential benefits that this approach can offer in this domain.
In this context, the focus of this research is to propose and validate a methodology for systematic assessment of the maturity of individual MNM processes and process chains inspired by the CMM approach. 29 The proposed methodology can be utilized as a platform for assessing systematically the maturity of both individual MNTs and also their combinations into process chains. The proposed methodology can be used also as a tool for identifying factors affecting the uncertainty associated with the implementation of MNM processes and process chains in manufacturing platforms and also for defining strategies to manage it.
Methodology
The proposed methodology represents a combination of top-down and bottom-up approaches for assessing maturity of technologies/processes, as depicted in Figure 1. It is a tool to model the maturity of component technologies and their possible integrations in process pairs and chains. The methodology provides a means to assess such process chains at the technology and platform levels.
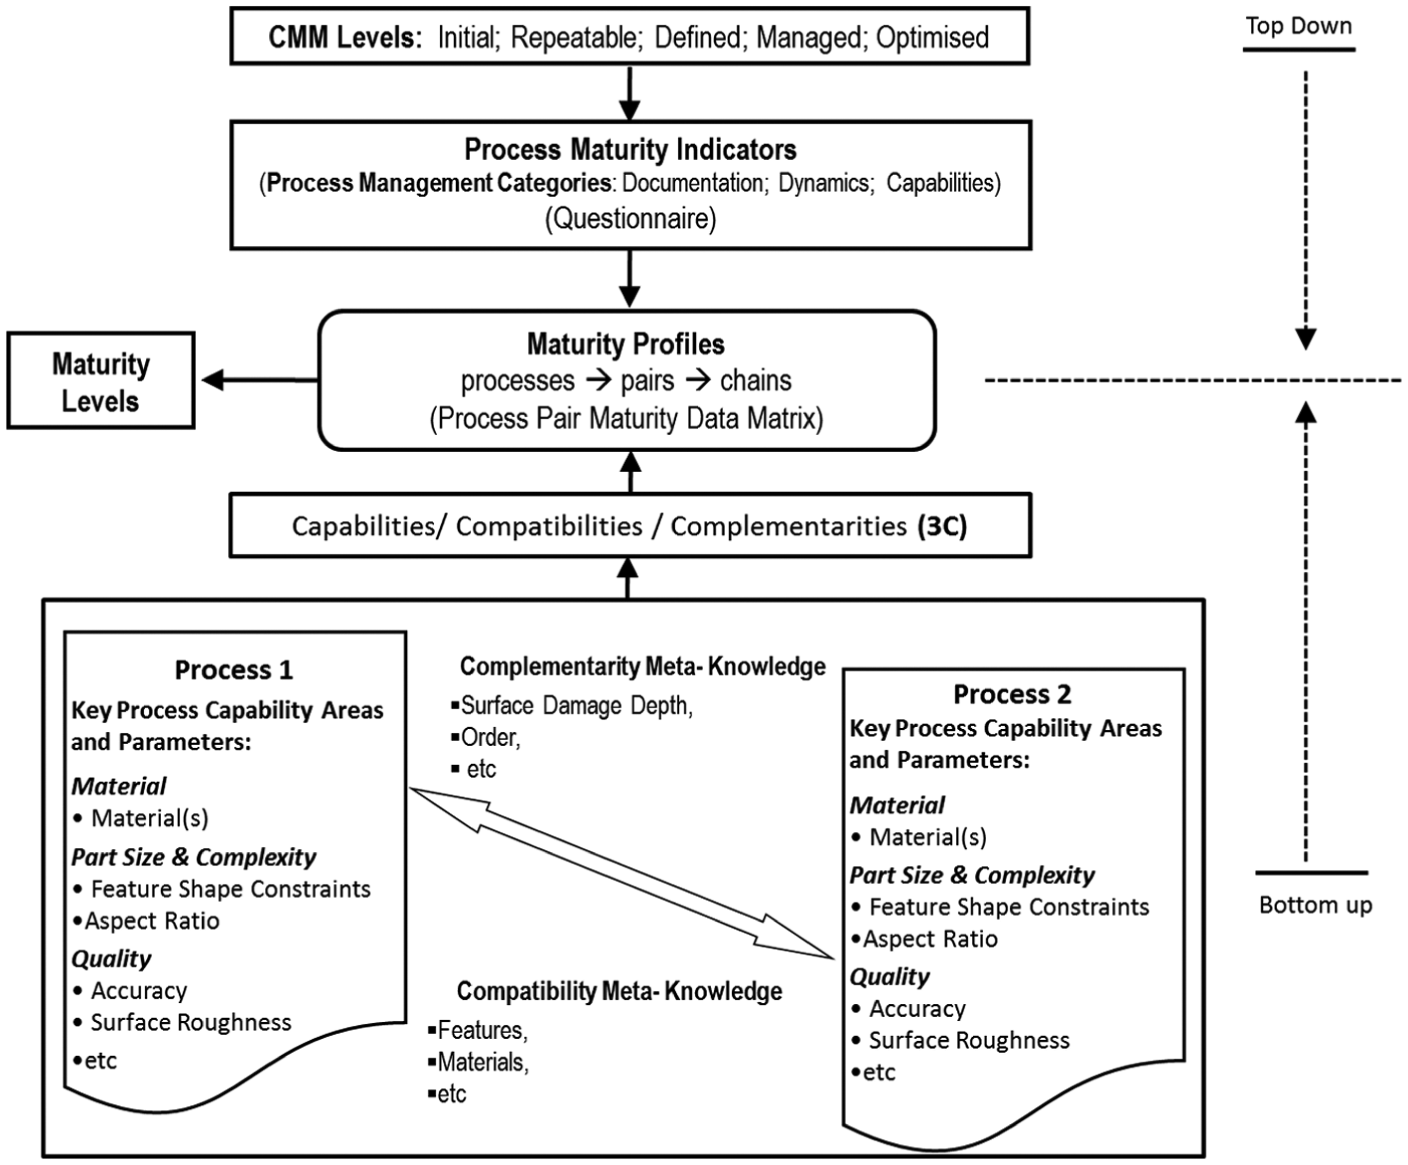
Schematic representation of the overall methodology.
At the technology level, the component technologies in process chains are modelled as process pairs, as shown in Figure 2. The ‘process chains’, ‘individual processes’, ‘process pairs’ and ‘technological interface’ between individual processes are the four major paradigms of the proposed approach. Each individual process in a pair or a chain executes a specific manufacturing operation and represents a basic ‘component’ technology (e.g. ‘micromilling’) in satisfying the technical requirements of a product. Thus, process chains include a number of process pairs, and each pair combines the capabilities of two component technologies, with a specific interface between them. In each process pair, the output of the first process becomes the input of the second one, which creates complex interdependencies that define the so-called technological interface between the component technologies.38,39 By implementing the concept of technological interfaces between two consecutive processes, a link between the processes is established, and the effect of their combined set of capability parameters on the performance of a process pair can be modelled and assessed. Thus, at the technology level, the interfaces between component manufacturing technologies in such process chains are systematically analysed in order to assess both their individual and combined capabilities and also their compatibility and complementarity. At the same time, at the platform level, this modelling approach allows the ‘maturity’ of process chains to be assessed as potential manufacturing platforms for producing miniaturized products. Finally, the methodology allows informed inputs from MNM process experts to be utilized in assessing the maturity of processes and pairs. A detailed description of the proposed methodology is given in the subsequent sections.
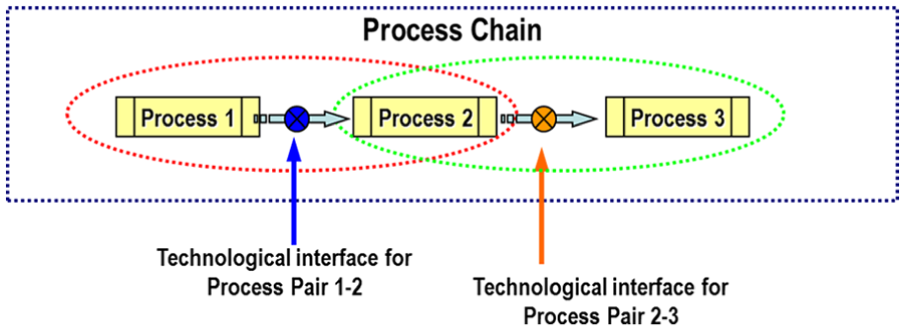
Process pairs and process pair technological interfaces.
Top-down approach
The top-down approach for assessing manufacturing processes is based on the CMM in software engineering. Maturity is defined as ‘a state of being fully grown or developed’. 40 From a manufacturing view point, maturity implies that a process is well understood, documented and formal training is available while it is consistently applied in practice and is continuously monitored and improved. So, it is possible to state that the performance and the overall behaviour of such a process are highly predictable. Therefore, the maturity assessment of a process or process pair provides a means to estimate the likelihood of achieving particular process outcomes when it is used to fabricate a given part or feature.
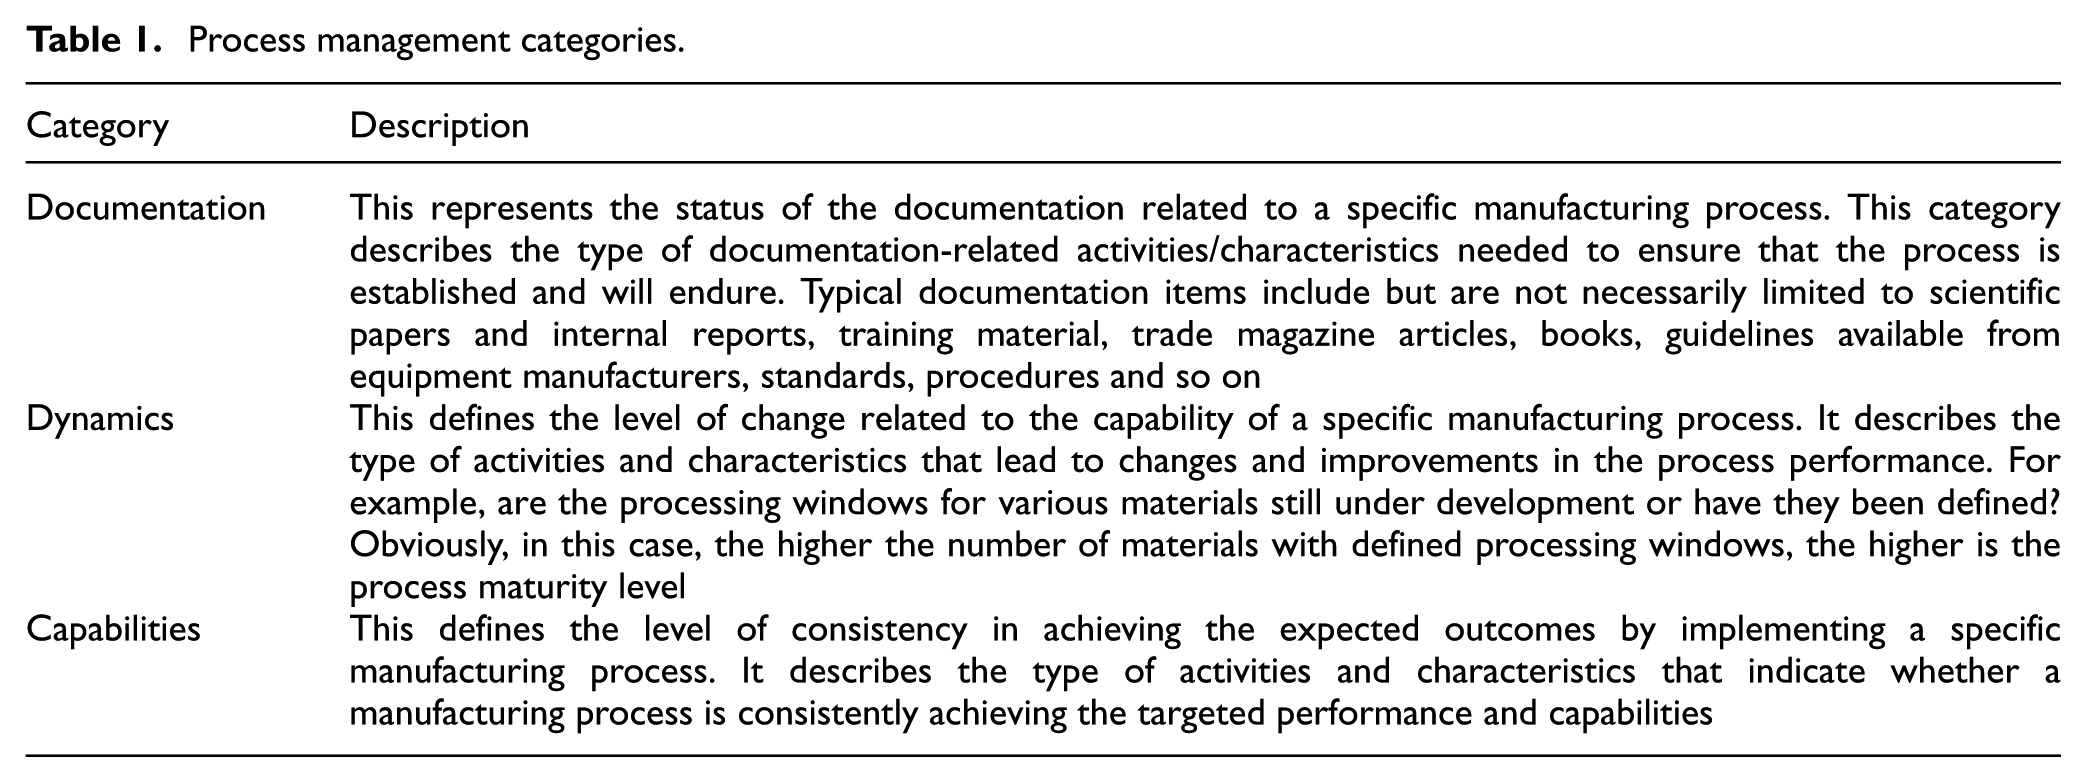
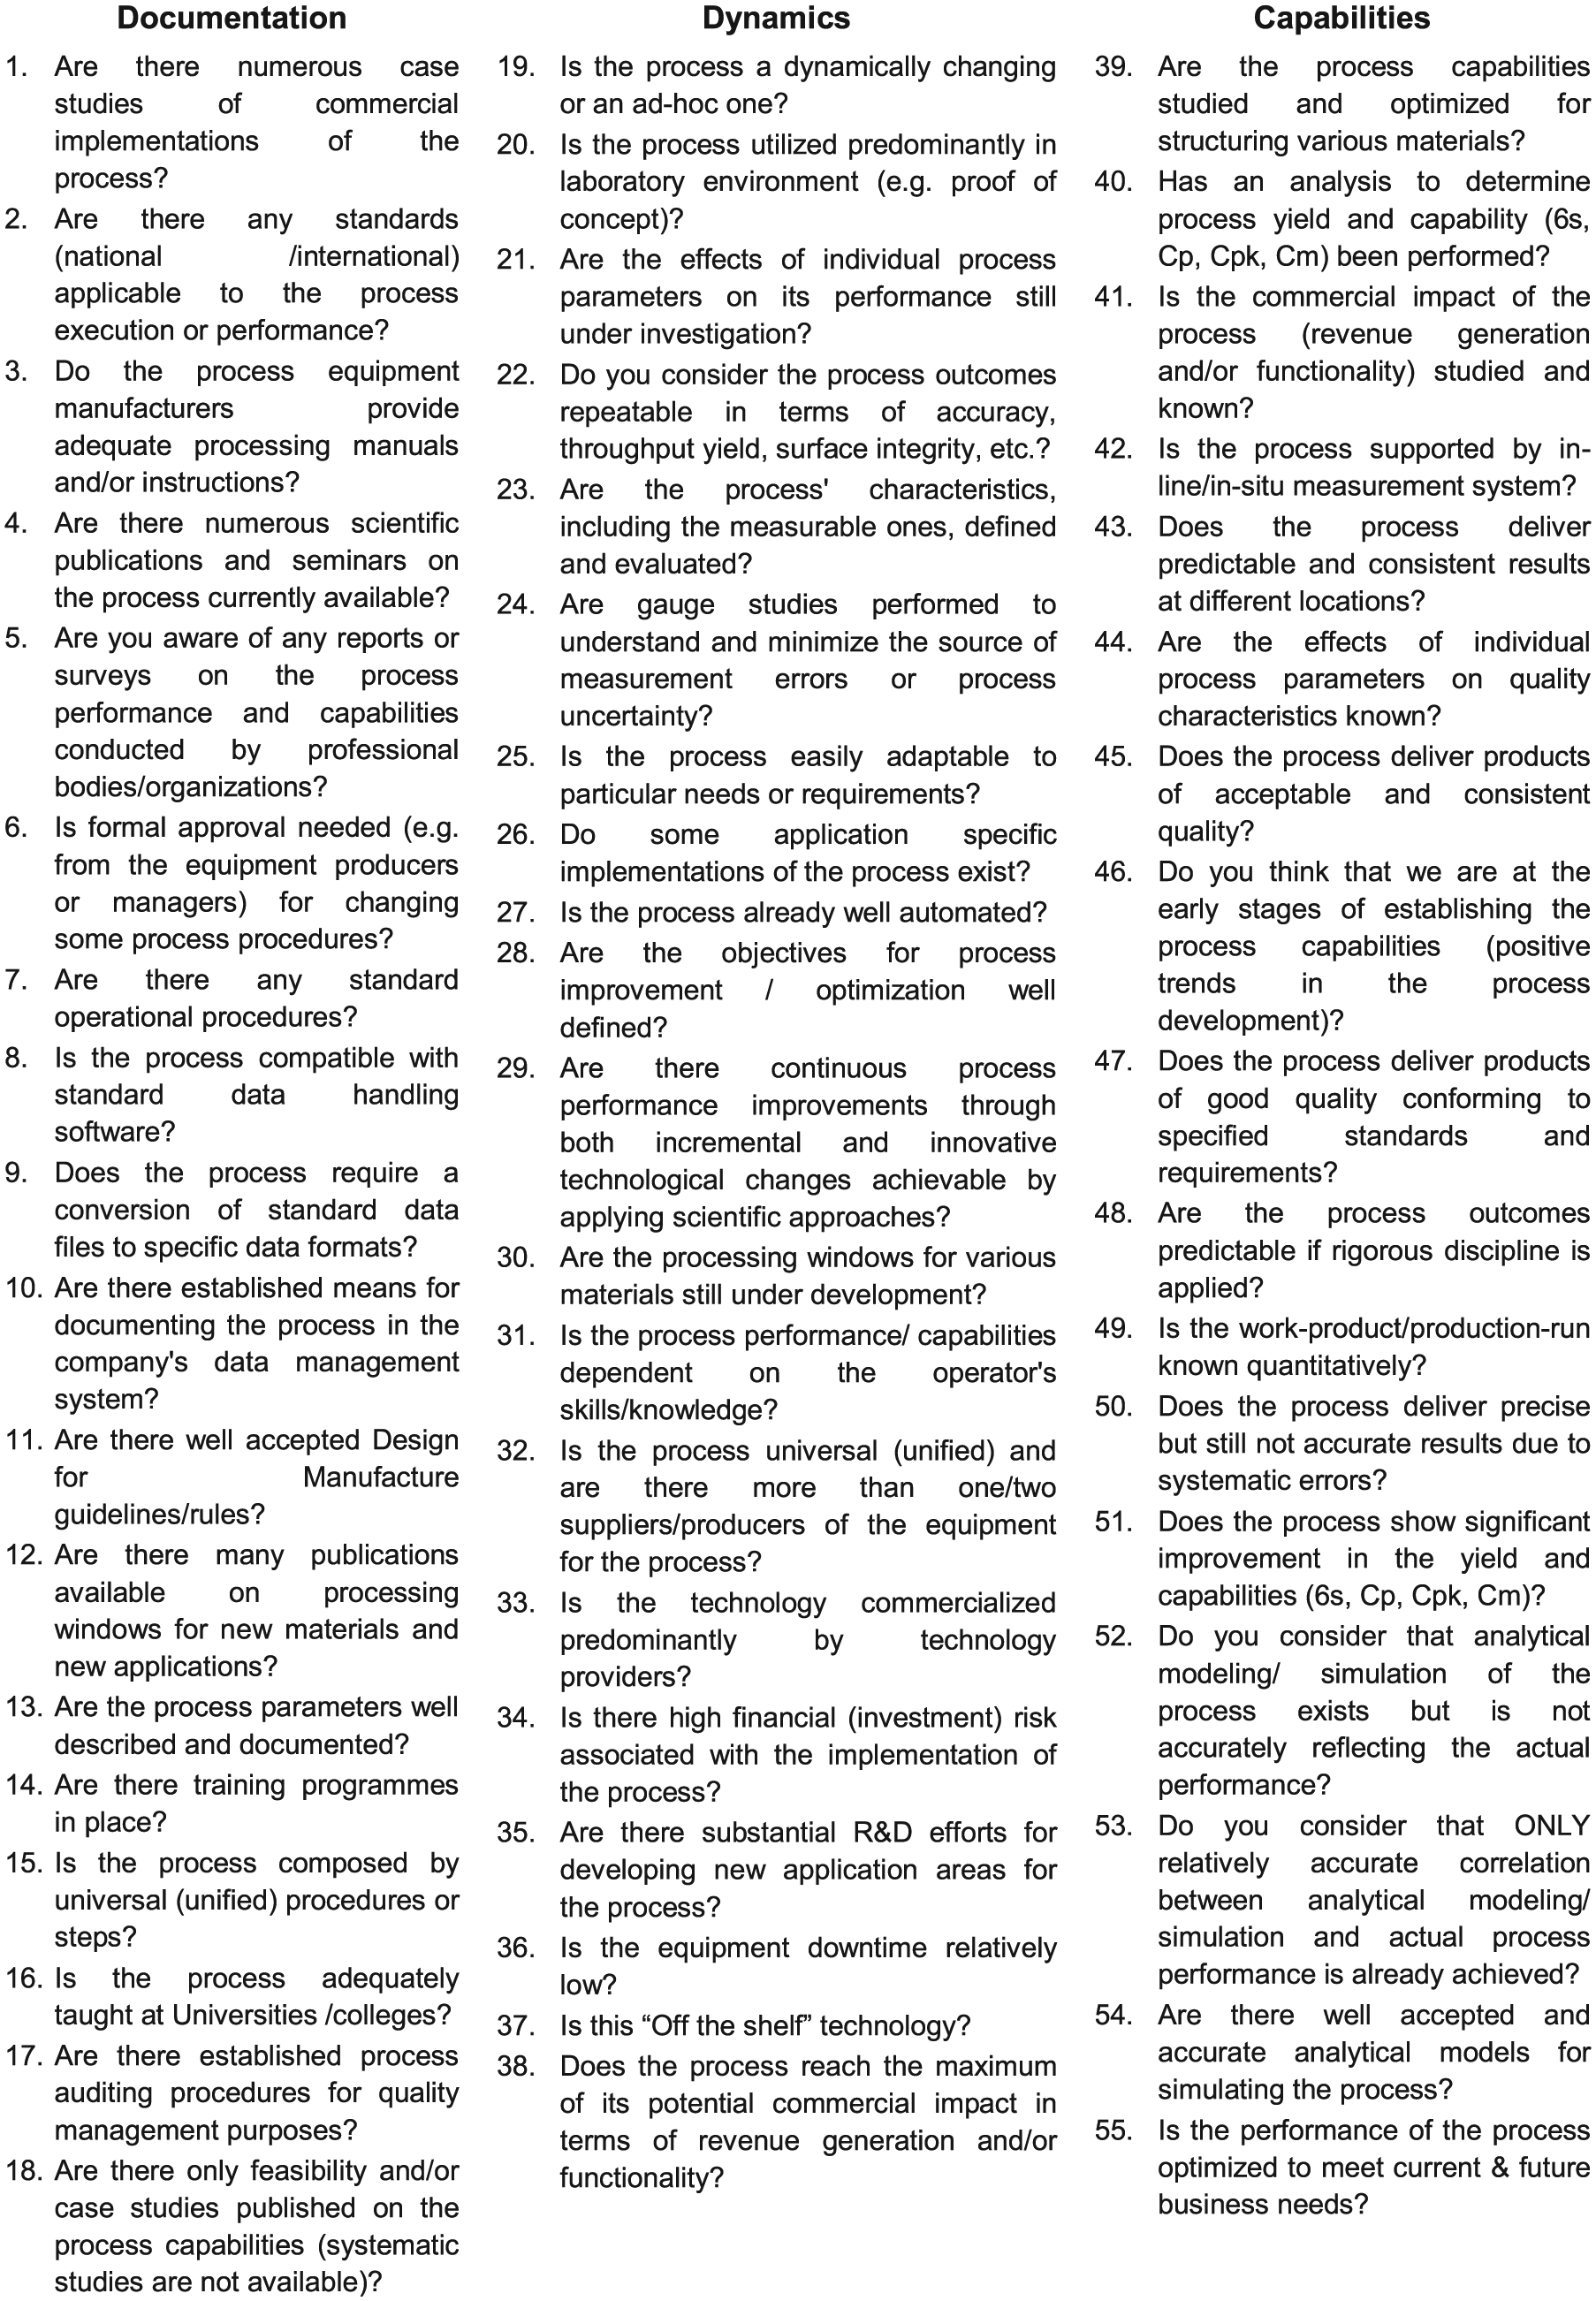
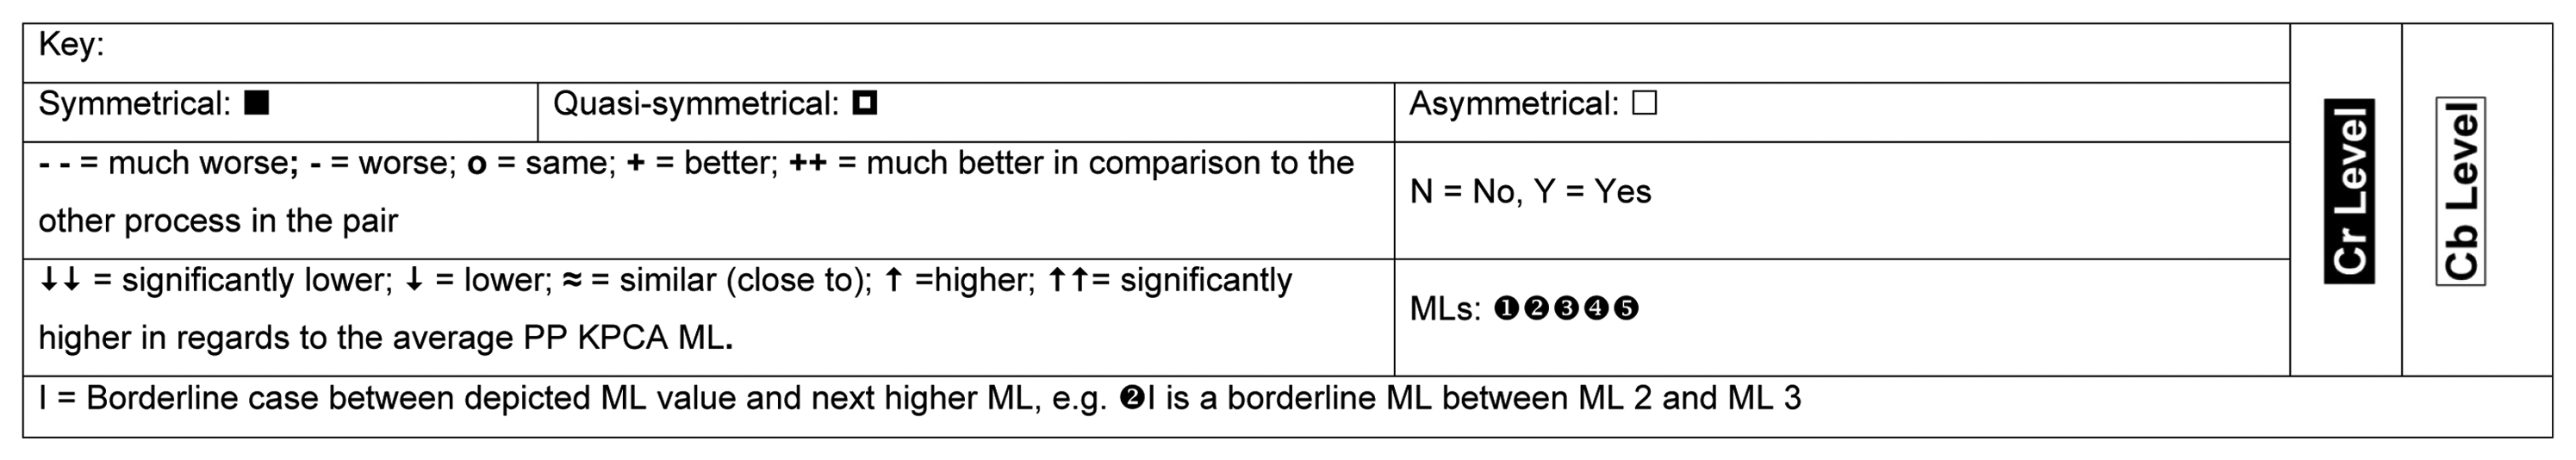
This definition of maturity conveys the notion of development from some initial state to some more advanced states as a result of continuous process improvements. Also, implicit in this is the notion of evolution, suggesting that a manufacturing process or process pair may pass through a number of intermediate states on the way to maturity. Thus, maturity levels (MLs) are well-defined evolutionary stages towards achieving a mature manufacturing process or process pair. Therefore, the CMM’s five-level maturity structure was adopted in the proposed methodology. Each ML can be scrutinized from abstract summaries down to a more detailed operational description in the form of process maturity indicators (PMIs) (see Figure 1). These are specific indicators which describe typical benchmarking activities, characteristics and performance metrics that a process should achieve or exceed for each ML. In addition, PMIs can be associated with process management categories, in particular, Documentation, Dynamics and Capabilities, as they are defined in Table 1. An example of a PMIs in the context of manufacturing processes is the existence of a good agreement between modelling/simulation results and the actual process performance in a given environment.
Process management categories.
To apply the proposed top-down approach, it is necessary to identify sets of specific PMIs associated with the three process management categories in Table 1. In particular, such sets of PMIs can be identified through brainstorming or Delphi-type workshops with experts in a given manufacturing domain. Then, these sets of PMIs are used to create maturity assessment questionnaires with Documentation, Dynamics and Capabilities subsections that can be used to obtain expert judgements about the most representative characteristics of processes in any considered manufacturing domain. In particular, the goal of each question in such a survey is to verify whether a specific PMIs has been achieved or otherwise, and therefore, can be used to describe the current process state. Thus, in practice, the ML reached by a given process in the top-down approach is determined by PMIs characterizing its current state with regard to its overall behaviour, performance and operational environment.
Bottom-up approach
In the proposed methodology, the top-down approach is complemented by a bottom-up approach for assessing component technologies in process chains. More specifically, it is necessary to analyse the compatibility and complementarity of component technologies in such process chains. 6 In this context, the proposed approach to model the technological interface of a given process pair takes into account the capabilities of its two component technologies, their dependencies and also the overall capabilities of the pair in producing a part with its technical requirements.
To implement the bottom-up approach, a new modelling structure (see Figure 1) is necessary to represent with sufficient depth the technological interfaces between any two processes. In particular, the structure should store a set of key process capability parameters (KPCPs) that characterize the component technologies in any process pair. For example, in this research, 32 KPCPs have been identified as the most important factors in determining the manufacturing capabilities of the MNM processes, such as positional accuracy, aspect ratio, minimum feature size, side wall angle, material, removal/deposition rate, manipulation technique and work holding method. An example of a structure/table to capture these 32 KPCPs is shown in Figure 3, where the parameters are grouped under six key process capability areas (KPCAs), namely, Quality and Accuracy, Part Size and Complexity, Material, Efficiency, Processing and Fixturing and Set-up.
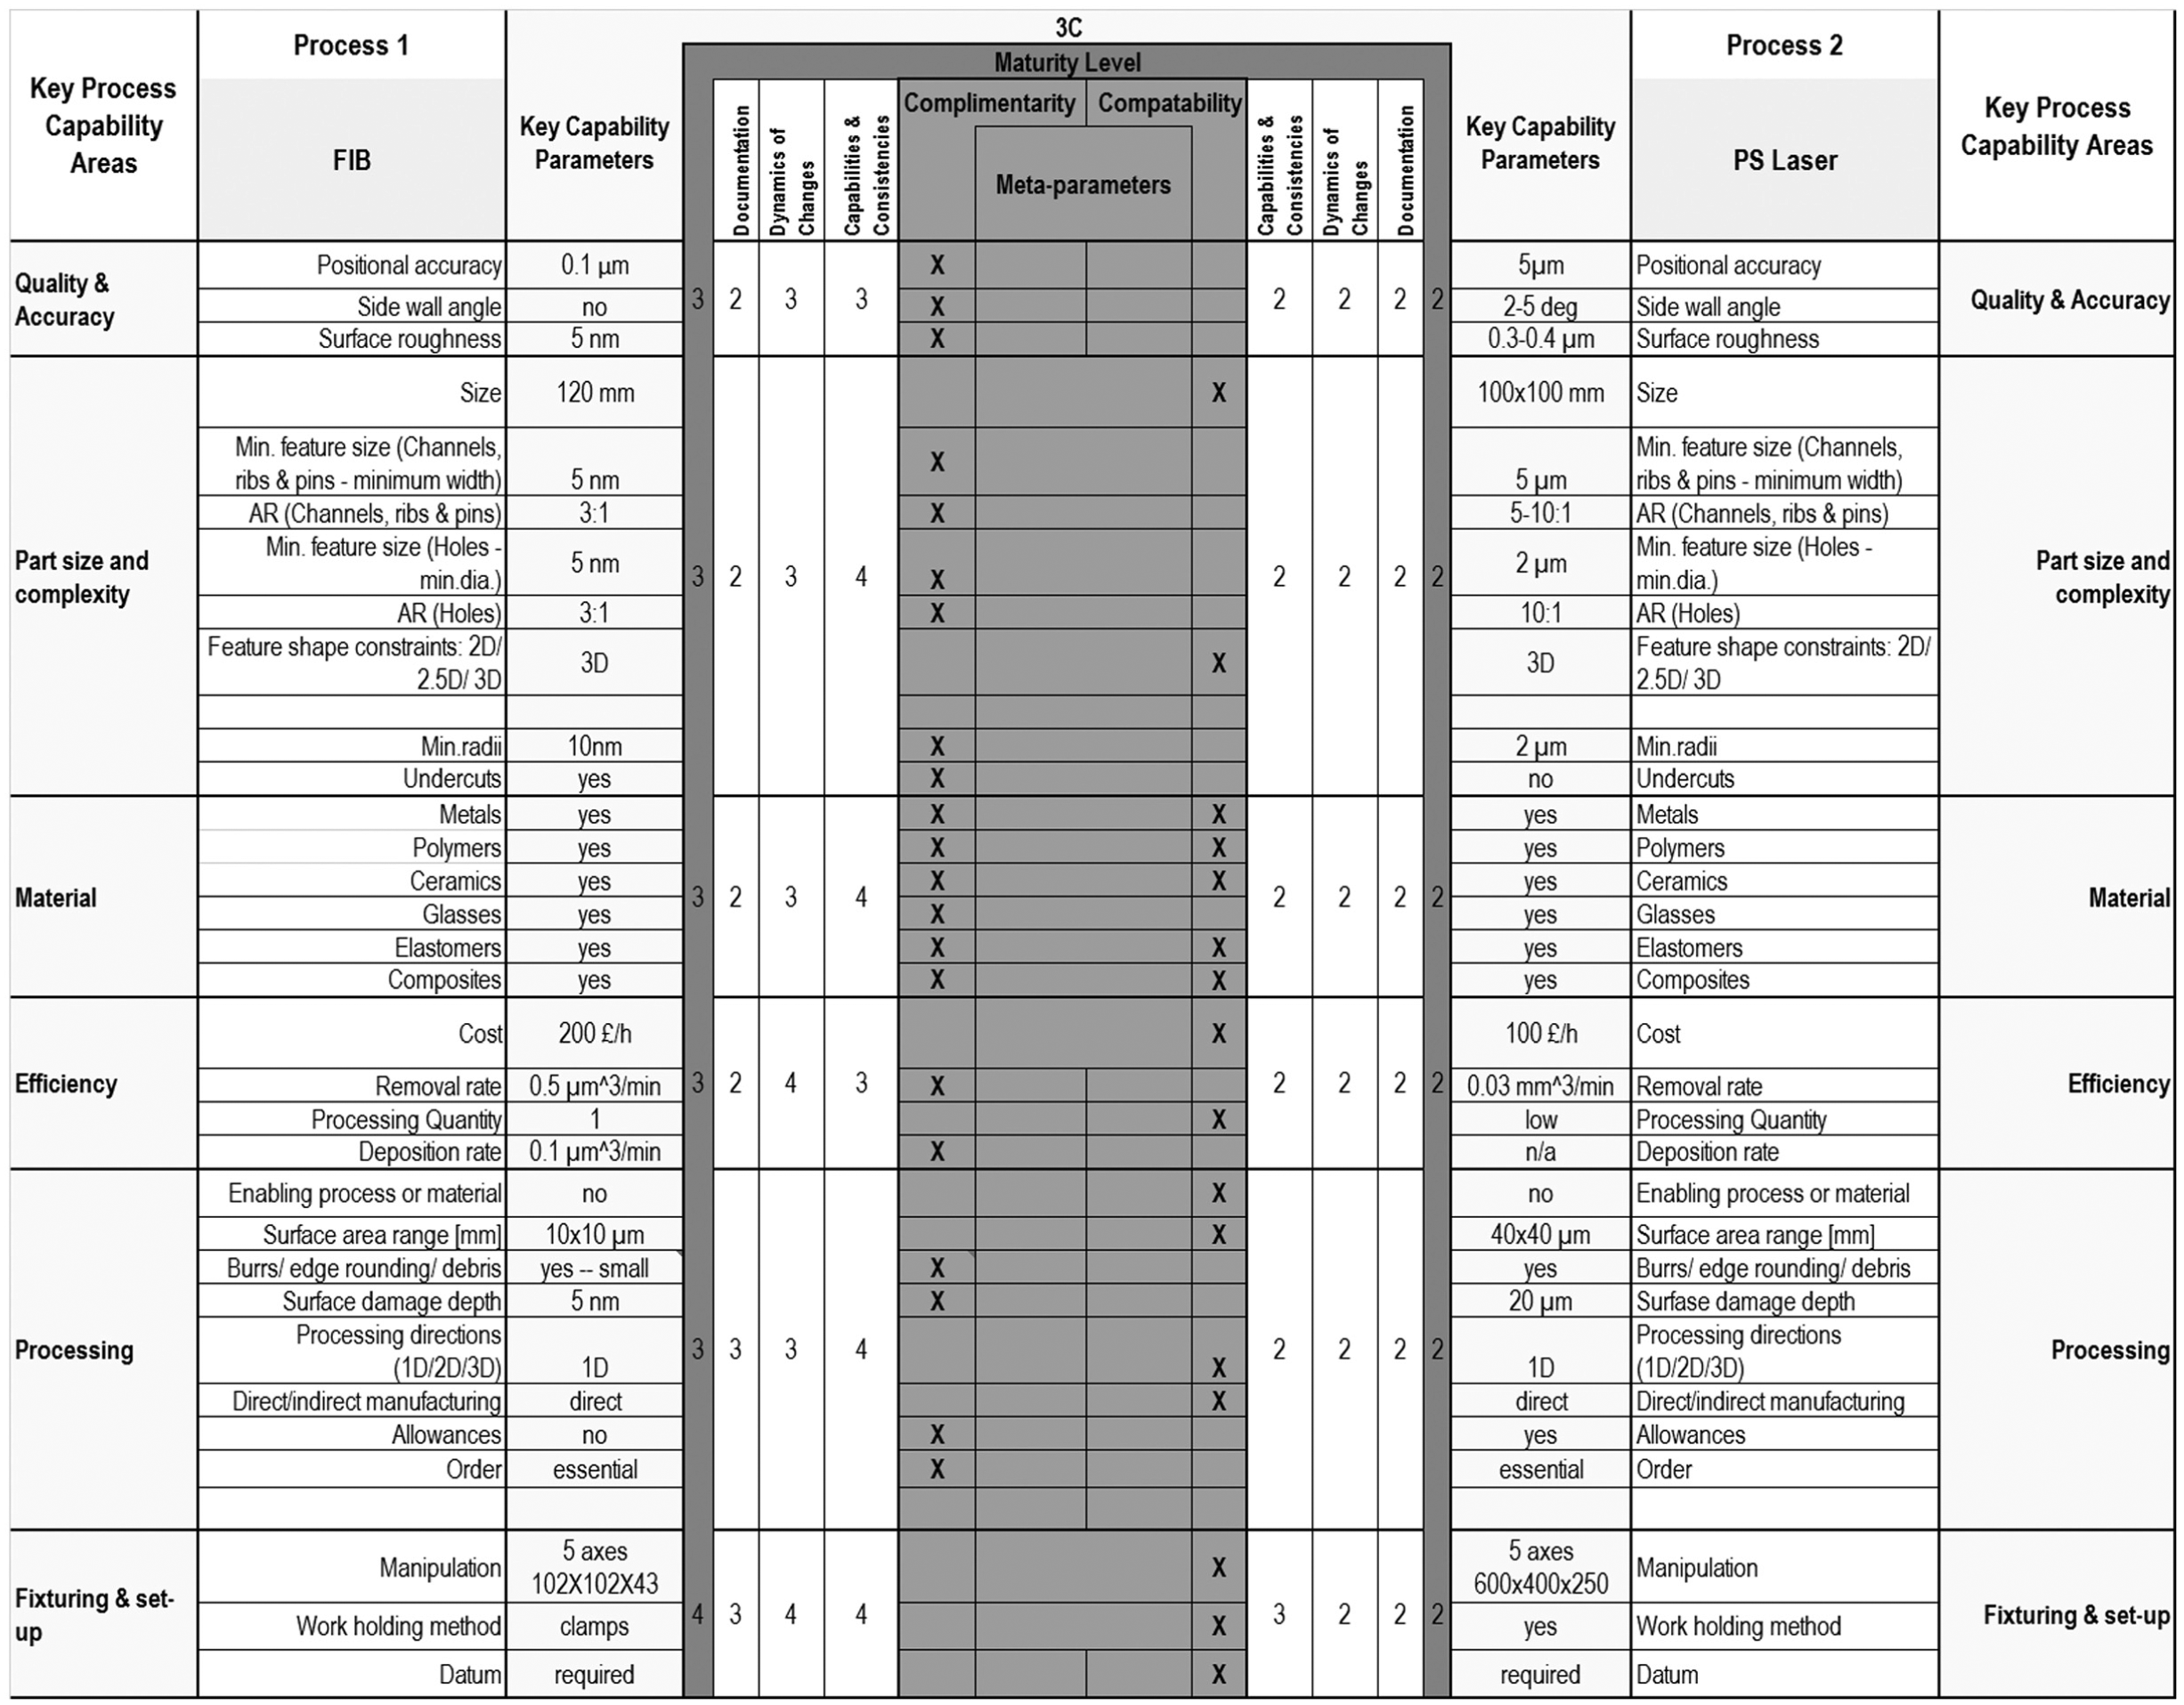
Process pair maturity matrix.
When process pairs are analysed, in addition to the KPCPs of their component technologies, it is necessary to take into consideration their overall technological capabilities. In the proposed methodology, the process pairs’ capabilities are referred to as ‘meta-parameters’ due to the combined effects of their two constituent processes in achieving the technical requirements of a given part or product. 41 In particular, the meta-parameters are additional attributes associated with the process pairs that facilitate the mapping and integration of KPCPs related to the two component technologies in each pair. The values of the meta-parameters are determined by the KPCPs of process pairs and reflect the level of their compatibility and complementarity. KPCPs and prior experience with the constituent processes in any given pair are used to make a qualitative (expert) judgement about their compatibility and complementarity. In particular, two processes are considered compatible only if they can be combined successfully in a process pair, but there is a higher level of overlapping between their capabilities. Thus, the technical requirements of a part or product can be achieved by either of them. For example, if both component technologies in a pair can process the same types of materials and can generate feature sizes within the same length scales, their associated KPCPs are mapped as compatible. Conversely, KPCPs of two processes are mapped as complementary if using them in a sequence brings added value or other potential benefits, and thus, the overall capabilities of a given process pair are enhanced. For example, the capabilities associated with the achievable ‘minimum feature sizes’ by picosecond (PS) laser ablation and focused ion beam (FIB) machining are complementary because these two processes can be used for structuring different scale features, and thus, their associated KPCPs can be mapped as complementary. In particular, the minimum feature sizes achievable with FIB machining are an order of magnitude smaller than those in PS laser ablation. Thus, it is possible to produce nano-scale structures with FIB after the machining of micro-scale features with the PS laser, and as a result, be able to achieve the so-called length scale integration by pairing these two direct-write technologies.
In applying the bottom-up approach, the compatibility/complementarity meta-parameters of process pairs are created by applying a set of rules. For example, the rule for ‘minimum feature size’ that is one of the ‘Part Size and Complexity’ KPCPs’ sub-sets is as follows: if the ‘minimum feature size’ achievable with constituent processes 1 and 2 in a process pair (pp) is not of the same order of magnitude, for example, process 1 has much higher resolution than the follow-up process, then this KPCP should be mapped as complementary. So using this rule to analyse the FIB+PS laser process pair, their ‘minimum feature size (channels, ribs and pins)’ KPCPs will be mapped as complementary as their achievable minimum feature sizes are 5 nm and 5 µm, respectively. The results of this ‘meta-analysis’ of KPCPs associated with process pairs are stored in Process Pair Maturity Matrixes (PPMMs), an example is given in Figure 3, that can be used to assess the capability, compatibility and complementarity (3C) of component technologies in process pairs (see Figure 1). Then, these PPMM spreadsheets are required to estimate the MLs of process pairs and their constituent process.
The next section presents the five MLs considered in the proposed methodology and also how the top-down and bottom-up approaches described in this section are integrated in a model to assess MLs of process pairs and their constituent processes.
Model design
Maturity Levels
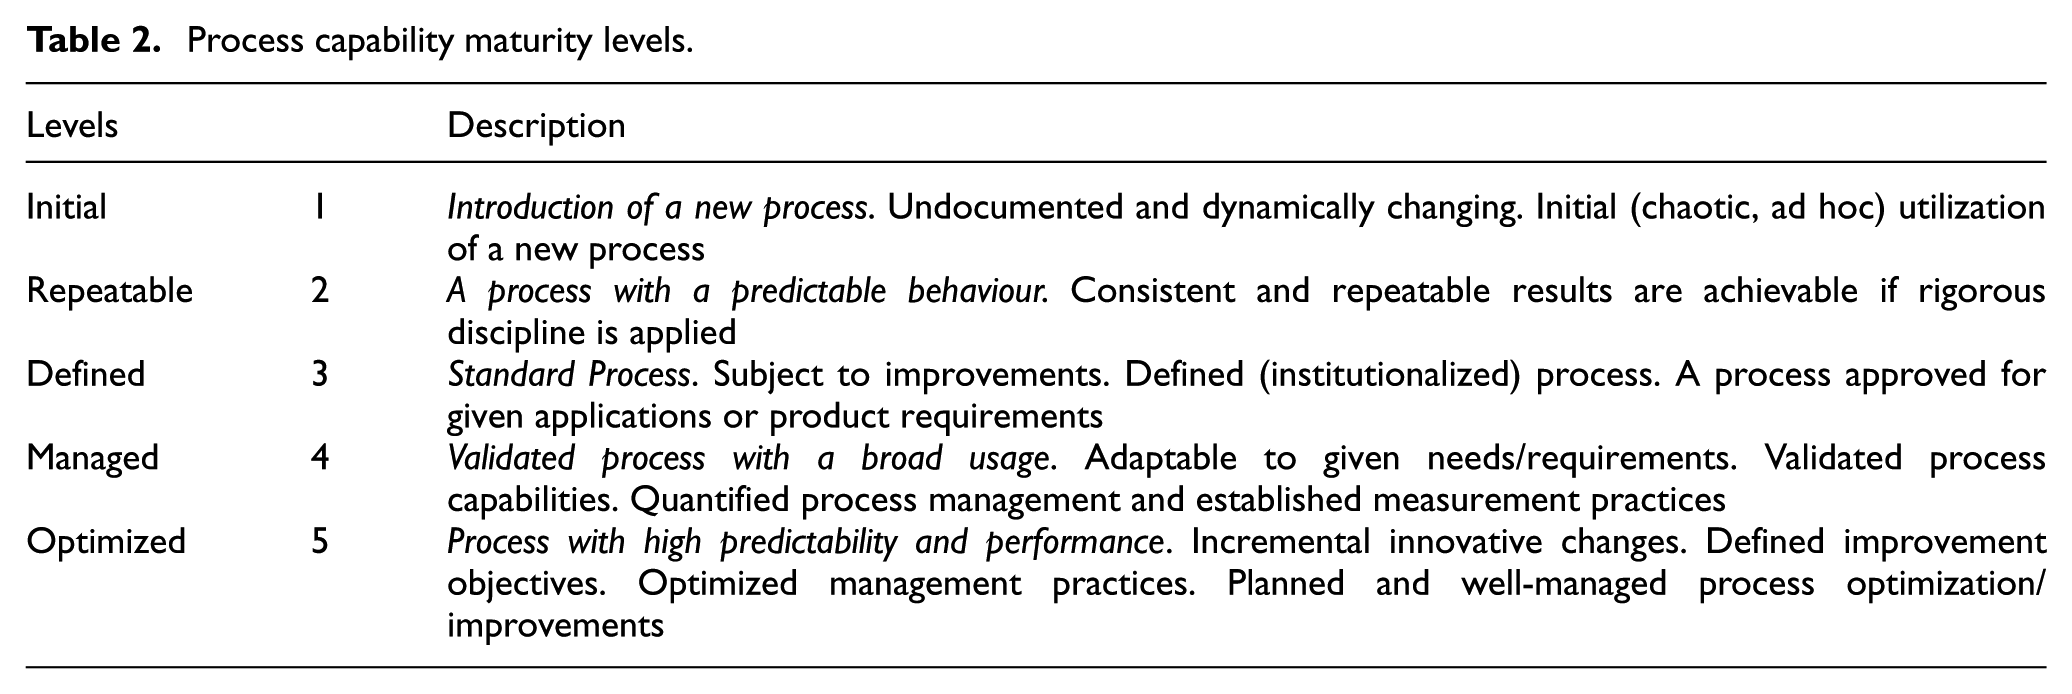
As stated earlier, MLs are well-defined evolutionary stages towards achieving mature manufacturing processes or process pairs. The five MLs considered in the proposed methodology are provided in Table 2. Each level represents a stage in the development and the implementation of any given process pair or its constituent processes.
Process capability maturity levels.
Integration of top-down and bottom-up approaches
As can be seen in Figure 1, the top-down and bottom-up approaches are applied simultaneously to carry out expert- and KPCP-based assessments of the MLs of processes and process pairs. Figure 4 illustrates the four steps required to perform these ML assessments.
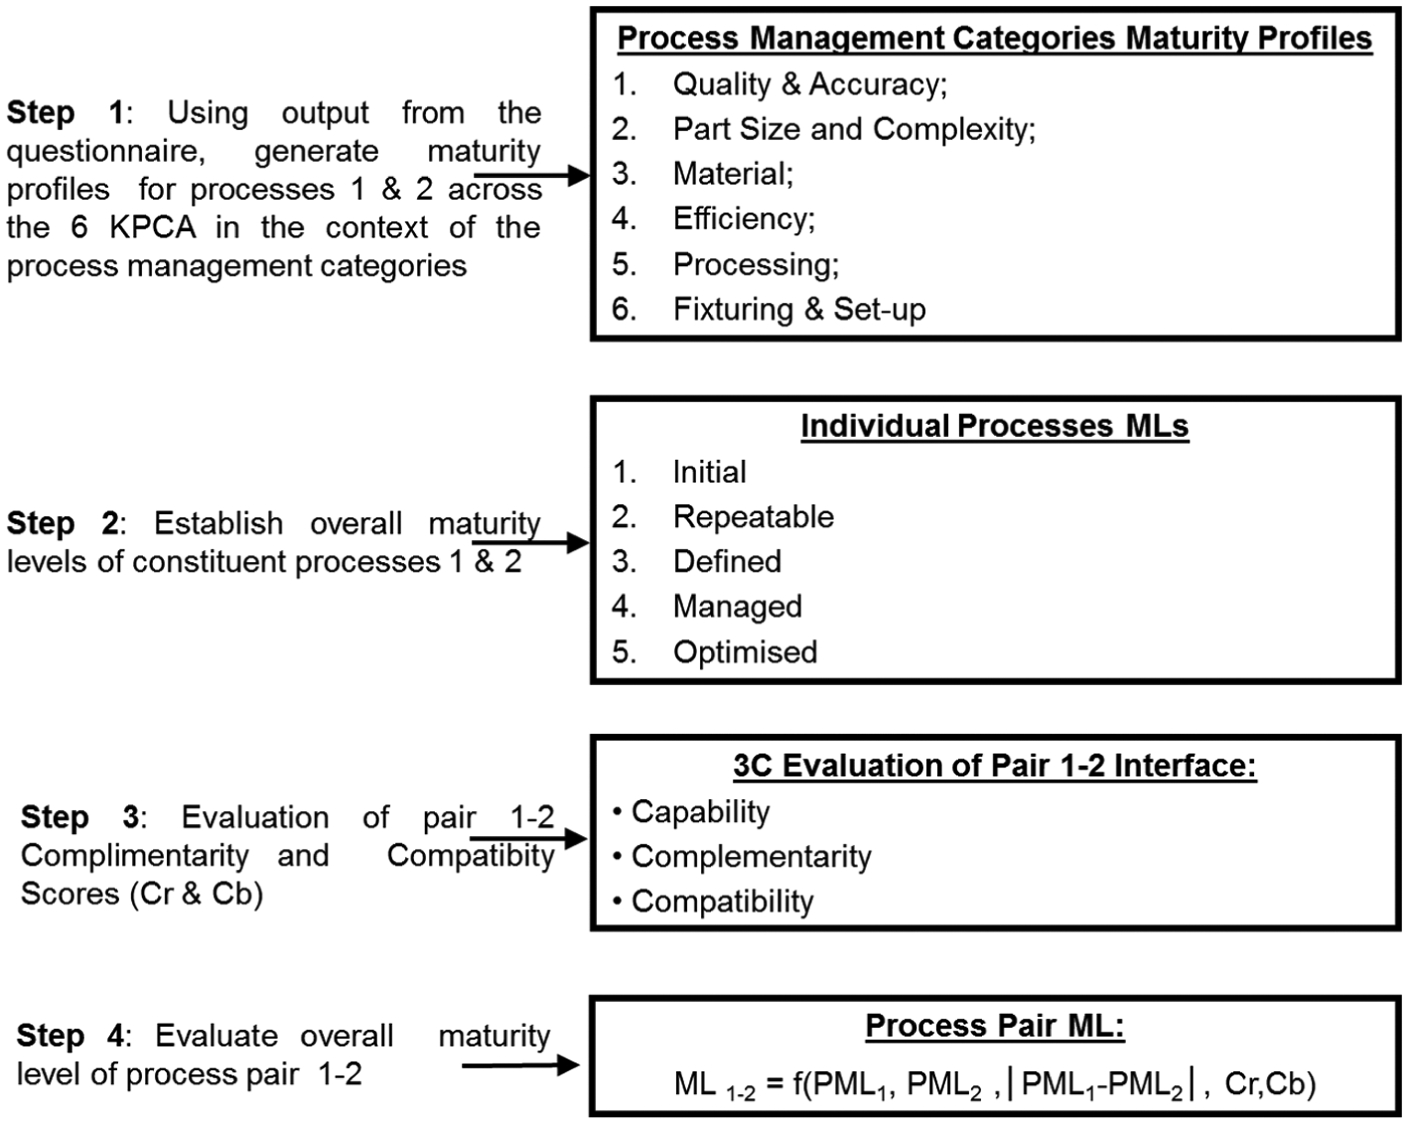
Individual process and process pair maturity level assessment.
The maturity assessment of constituent processes in pairs is carried out in steps 1 and 2. As discussed earlier, in practice, the ML reached by a given process is determined based on experts’ judgements through structured questionnaires employing key indicators for each level in the process evolution. The outputs of the questionnaires allow the processes to be positioned objectively on the maturity scale irrespective of their applications. Each ‘yes’ or ‘no’ answer given to the maturity assessment questions relates to a specific maturity indicator and thus to determine MLs of the associated KPCAs and process management categories. For example, an indicator within the ‘Capabilities’ process management category for the maturity of the ‘Part Size and Complexity’, ‘Material’ and ‘Processing’ KPCAs could be the existence of a correlation between modelling/simulation results and actual process performance in a given environment. This approach allows not only the overall maturity of a process to be assessed but also that of its KPCAs and process management categories. The practical implementation of this maturity assessment methodology for a single MNM process is illustrated in Figure 5 and it includes the following steps:
Experts’ questionnaire with binary questions with regard to processes’ maturity indicators;
Determining processes’ MLs or range of levels by employing the CMM’s five-level maturity structure;
Assessing processes’ KPCAs across the three process management categories;
Determining the overall ML of a process and its maturity profile across the six KPCAs.
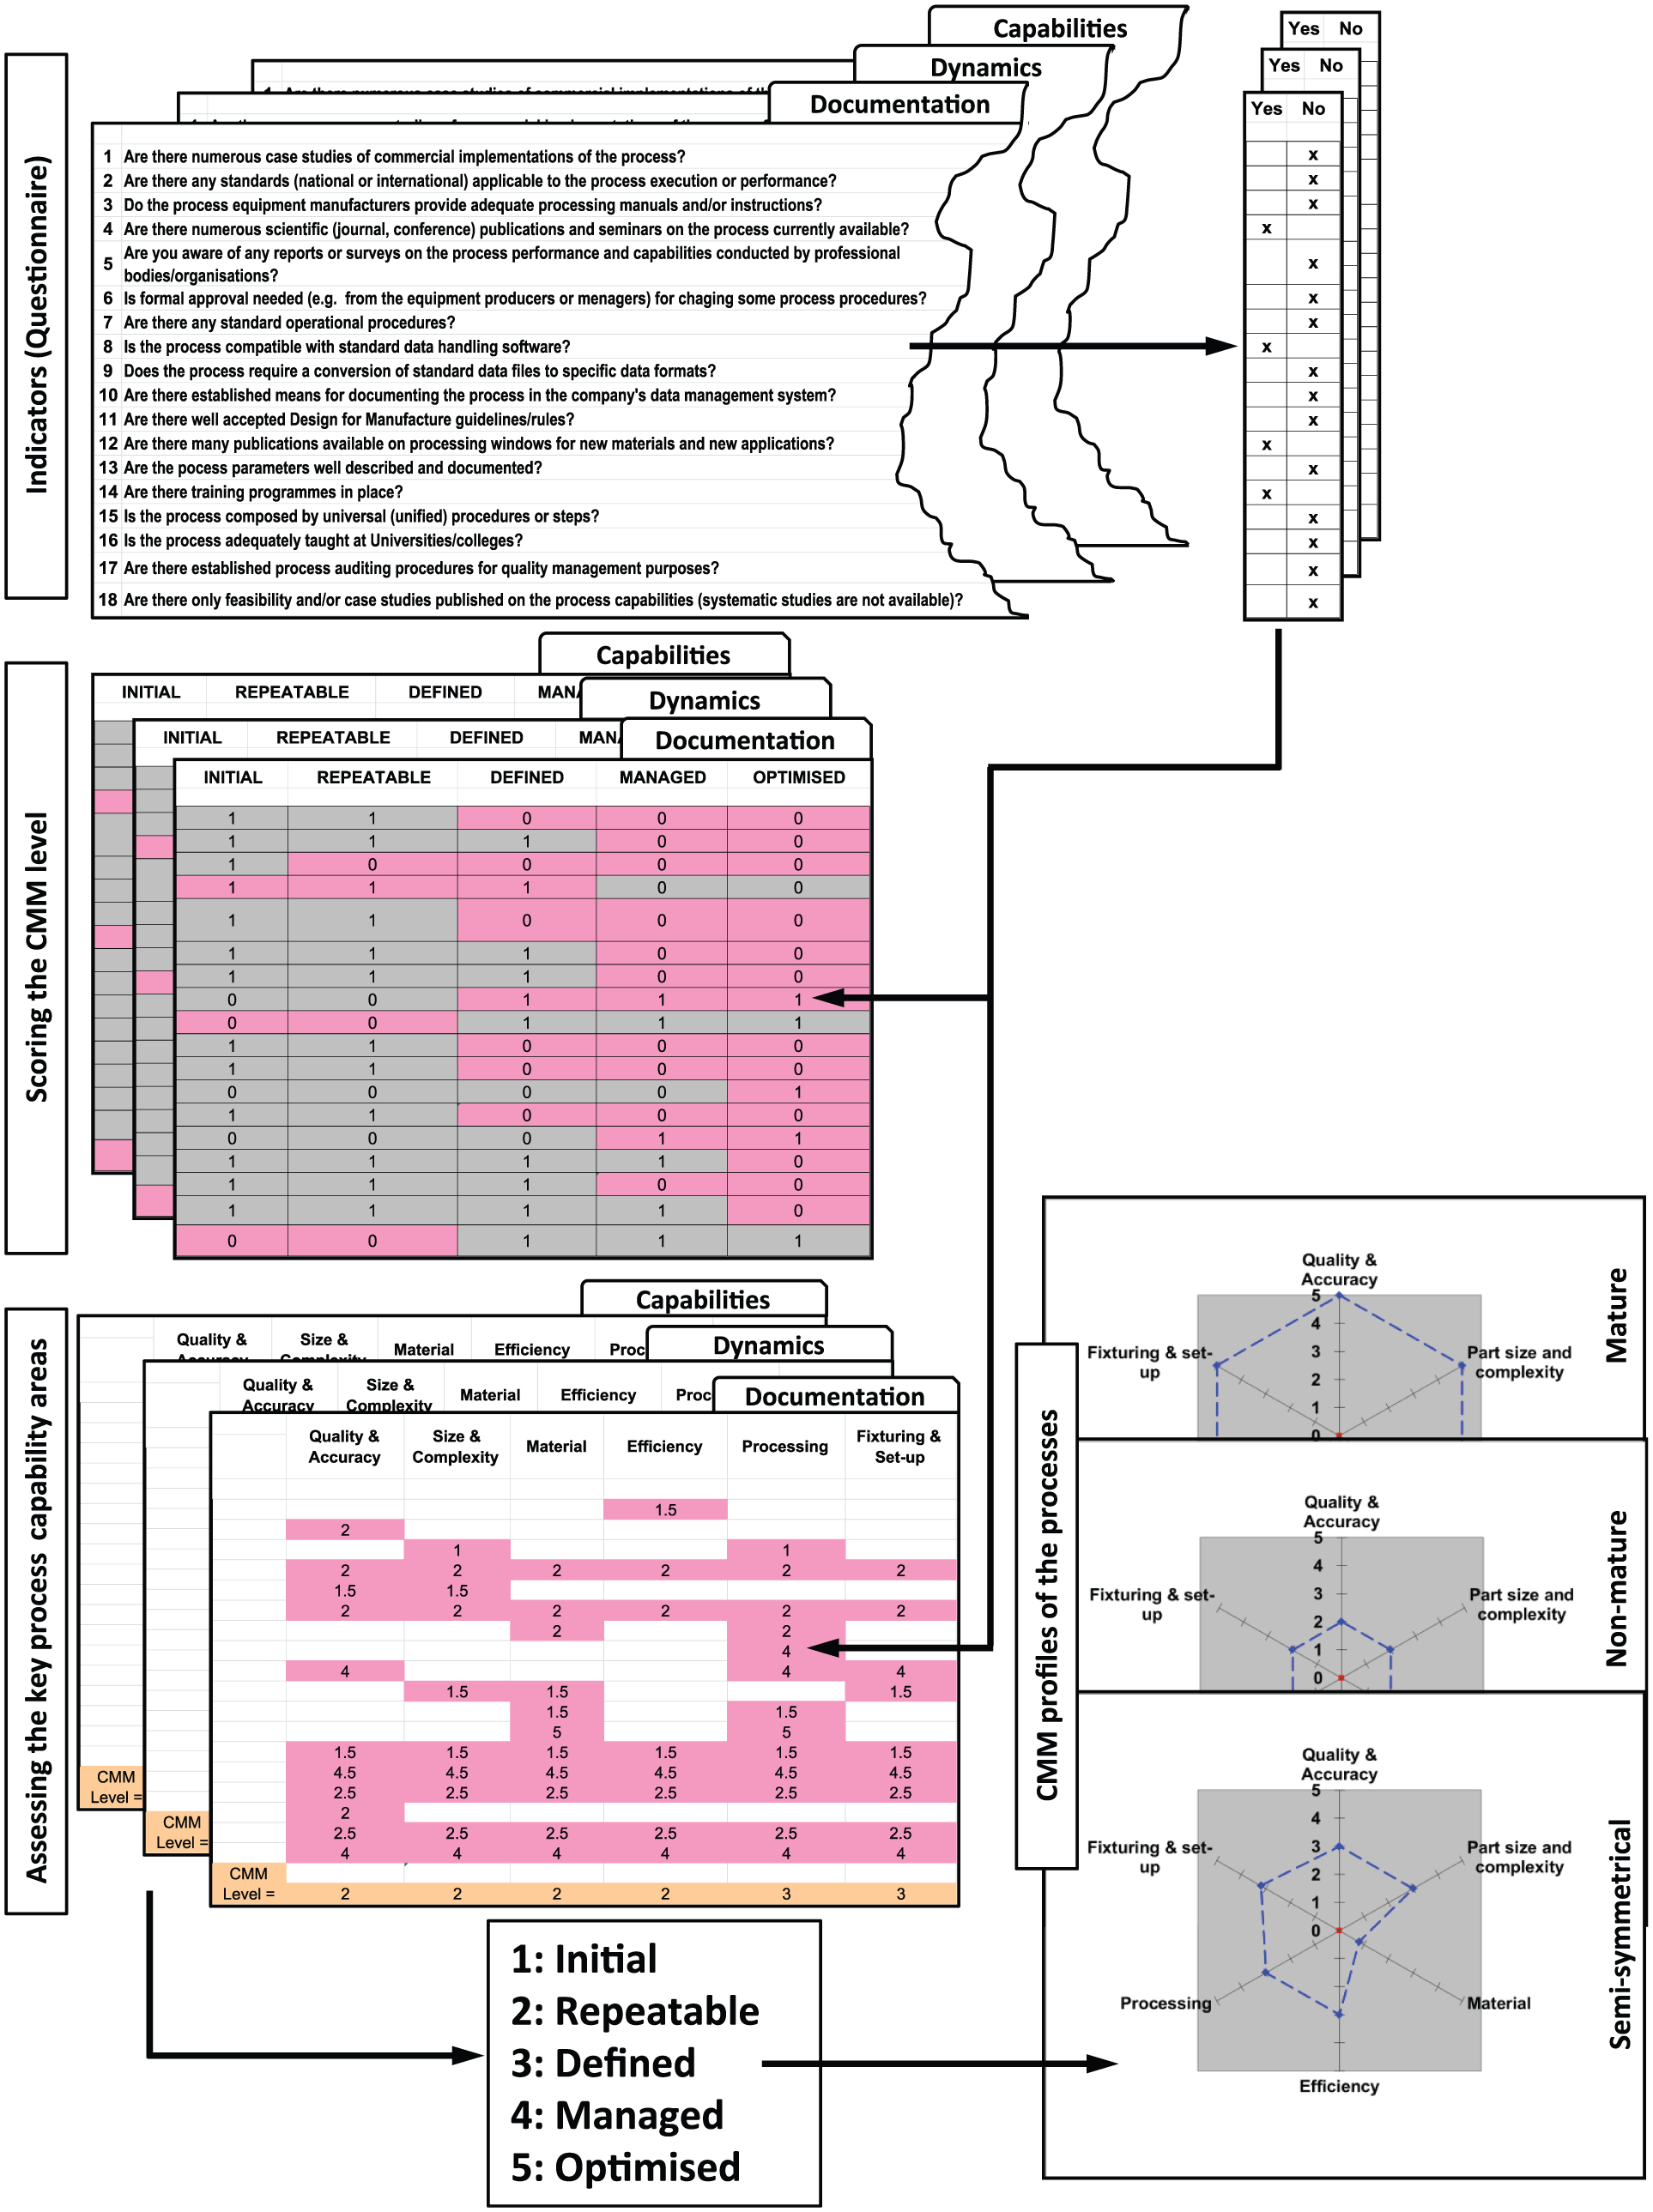
Methodology for the maturity level evaluation of a single MNM process.
Next, steps 3 and 4 in Figure 4 involve the maturity assessment of process pairs. The ML of a process pair is dependent on ML of its constituent processes, and also it depends on their compatibility and complementarity. Thus, the assessment should reflect the maturity of both technologies in a pair and accounts for the pair’s meta-parameters. The objective is to define a measure to estimate the likelihood of achieving a particular outcome when the pair is used to fabricate a part or a set of features. Such a measure should take into account various factors affecting the Process Pair Maturity Level (PP_ML), in particular, the ML of the first constituent process (PML1), the ML of the second process (PML2) and also their complementarity (Cr) and compatibility (Cb).
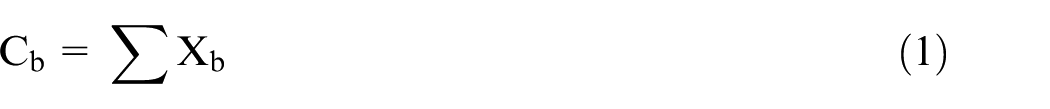
Cb is used as an overall metric to assess the input–output compatibility of two processes when they can be combined in a pair and estimates any ‘value-added’ functional or economic advantages. Thus, if two processes are entirely compatible, they would be just alternative or competing technologies, and hence, they can have even negative effects on a process chain because without gains leads to increased complexity, higher cost and a likelihood for reliability issues. Cb can be estimated using the following formula
where
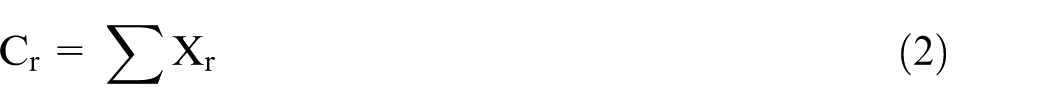
At the same time, Cr of a process pair is a metric for assessing whether by combining two processes, ‘value-added’ (synergetic) functional or economic benefits can be gained. Thus, it is an overall measure of the perceived complementarity of two processes in enhancing each other’s capabilities. A simple formula for estimating Cr should take into account the whole set of KPCPs (Xr) mapped as complementary (meta-parameters), in particular
The methodology was implemented into an excel-based PPMM model. By applying it, not only the PP_MLs can be obtained, but also the maturity profile across the six KPCAs in the context of the Documentation, Dynamics and Capabilities categories can be analysed. The pilot application of this model on a set of MNM processes is presented and discussed in the following sections.
Pilot implementation
As highlighted earlier, to implement the proposed methodology, first it is necessary to identify generic indicators that can be used to characterize the current state of a given manufacturing process, preferably in the context of the targeted MNM domain. In the proposed modelling approach, expert judgements obtained through a Delphi-type workshop are used to identify them. Then, these indicators are utilized to develop a questionnaire for characterizing and positioning the MNM processes along the adopted maturity scale. The proposed modelling approach was applied to assess the maturity of 10 different state-of-the-art MNM processes integrated within a European infrastructure programme, EUMINAfab. 42 The processes considered in this study could be clustered into four groups, namely, micro and nano patterning, thin film deposition, replication and characterization technologies.
Identification of process maturity indicators and questionnaire design
To identify the PMIs, a workshop was organized that brought together more than 40 MNM experts in all four process groups. There were three main steps in defining the questionnaire:
Identification and Classification of PMIs. The maturity assessment methodology was presented at the workshop, and its objectives were discussed and agreed with the experts. Then, the experts were split in two parallel groups with one moderator each to discuss and then come up with generic indicators in the context of their specific technology areas. The discussion that proceeded was very important in order for the experts to understand what kind of process characteristics could be used as indicators in the context of the whole set of considered MNM technologies and their various possible MLs. Then, the participants were asked to provide a set of such generic indicators that were both informative about the current state of a given process and also meaningful across the various considered MNM processes. For example, one of the key indicators identified by the experts to characterize a given process as ‘Managed’ (ML 4) was ‘process yield >80%’.
Semantic clustering of the PMIs. To be able to first group the indicators and subsequently the structured questionnaire, the experts were asked in a follow-up session to discuss the previously identified indicators and then to group them under the adopted three common process management categories, ‘Documentation’, ‘Dynamics’ and ‘Capabilities’, while considering their relevance to each of the five MLs along the proposed maturity scale. In particular, for the example given above, the key indicator ‘process yield >80%’ was classified under the ‘Capabilities’ category, while being indicative of ML 4.
Development of a maturity assessment questionnaire. Finally, the identified indicators were used to design the questionnaire, and the questions were grouped under the ‘Documentation’, ‘Dynamics’ and ‘Capabilities’ categories, as shown in Figure 6. In addition, as the indicators were also classified along the considered five MLs, each question was used to position the MNM processes, along the adopted maturity scale. When completing the developed questionnaire, the experts had to give a binary answer to each question, and thus, the necessary information was derived for assessing MLs of a given MNM process. Then, the PML for a given MNM process was obtained by averaging the individual MLs associated with each KPCA under the three semantic categories (Documentation, Dynamics and Capabilities). Face-to-face interviews were the preferred mode to complete the questionnaire for the following reasons: Some of the questions included complex concepts, which are difficult to interpret consistently through a self-administered questionnaire.
43
The facilitators were able to assess how respondents reacted to the questionnaire, and if necessary, they clarified or explained the meaning of particular questions in order to obtain more accurate and representative responses.
Questionnaire subdivided into the three process management categories.
Assessment of MLs
The proposed methodology was also applied to analyse a set of process pairs that bring together 3C technologies and thus can constitute the building blocks of various process chains. In particular, a maturity assessment of the following eight process pairs and their constituent processes was carried out:
Ultraviolet (UV) laser and projection maskless ion beam patterning (PMLIBP); 44
FIB and PS laser ablation;
E-beam lithography and deep reactive ion etching (DRIE);
Micromilling (µMilling) and PS laser ablation;
X-ray lithography and electroforming;
FIB and hot embossing (HE);
FIB and micro-injection moulding (µIM);
µMilling and HE.
These eight pairs were selected because they are either building blocks of existing process chains or are considered as viable combinations of 3C technologies for integration into new manufacturing routes within the EUMINAfab infrastructure.
To assess the MLs of these pairs, experts in respective component technologies were asked to do the following:
To complete the maturity assessment questionnaire for the component processes in these pairs;
To provide the required data to complete the PPMMs for the considered process pairs.
In this way, the required data were collected to assess MLs of the considered process pairs. It should be stated that the representativeness of such an analysis is highly dependent on the experts’‘unbiased’ knowledge of the constituent processes in the pairs.
The first step in implementing the methodology was to generate maturity profiles of the constituent processes across the defined KPCAs based on the collected data and therefore to create ‘snapshots’ of their current state of development. Next, the PP_ML of each pair was estimated taking into account the factors affecting it as discussed in section ‘Model design’. In particular, the ML of a process pair (PP_ML(1, 2)) could be assessed by accounting for the MLs of its constituent processes (PML1 and PML2) and meta-parameters (Cr and Cb). The assessment model is based on the rationale that the PP_ML increases when the following conditions occur:
The difference in MLs (PML1−PML2) decreases and is as low as possible;
The individual MLs, PML1 and PML2, increase and are as high as possible;
Cr increases and is as high as possible;
Cb increases but with a marginal/lower impact in comparison with Cr.
In this pilot implementation, after discussing the above interdependences with experts, the formula, equation (3), was adopted
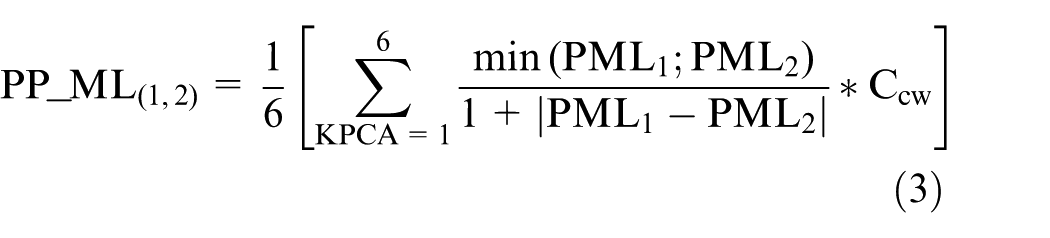
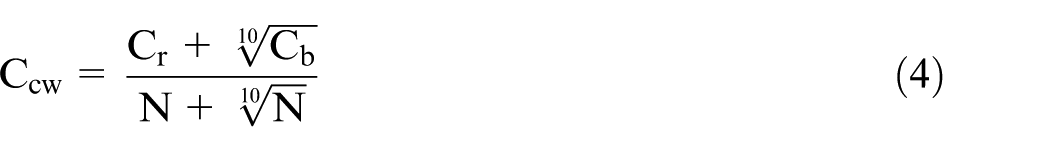
where Ccw is the normalized combined complementarity- and compatibility-weighted score. Ccw takes into account that a higher Cb means that the two processes in a pair while being compatible have a marginal added value. For example, the processes can be considered alternative or competing technologies, and thus, one of them could be omitted to reduce the complexity of a process chain and thus the risk and costs associated with its implementation. At the same time, Cr should have a higher impact on Ccw because by combining two complementary processes, a higher ‘added value’ can be gained in a functional and/or economic sense. Therefore, the impact of Cb is marginalized using the m root of Cb in the formula for computing Ccw while the score increases linearly with the increase in Cr. In this pilot implementation, based on expert feedback, m was set to 10, and thus, Ccw can increase up to 27% with the increase only in Cb, while the impact of Cr on Ccw cannot be less than 73% when all KPCPs are mapped as complementary. In particular, the formula for Ccw used in this study is given in equation (4)
Based on the obtained PMLs and PP_ML values, the pairs and their constituent processes were positioned along a normalized scale, from 0% to 100%, covering all five MLs: (1) Initial, 0%–20%; (2) Repeatable, 20%–40%; (3) Defined, 40%–60%; (4) Managed, 60%–80%; and (5) Optimized, 80%–100%. Based on this ML assessment, it was possible to conduct the following:
A comparison of MLs of the processes with regard to the three process management categories;
A comparison of MLs of constituent processes in the pairs with regard to their KPCAs;
The identification of strengths and weaknesses associated with the process pairs taking into account the current state of their constituent processes;
An assessment of the complementarity and compatibility of technologies with regard to their respective KPCAs.
Discussion of results
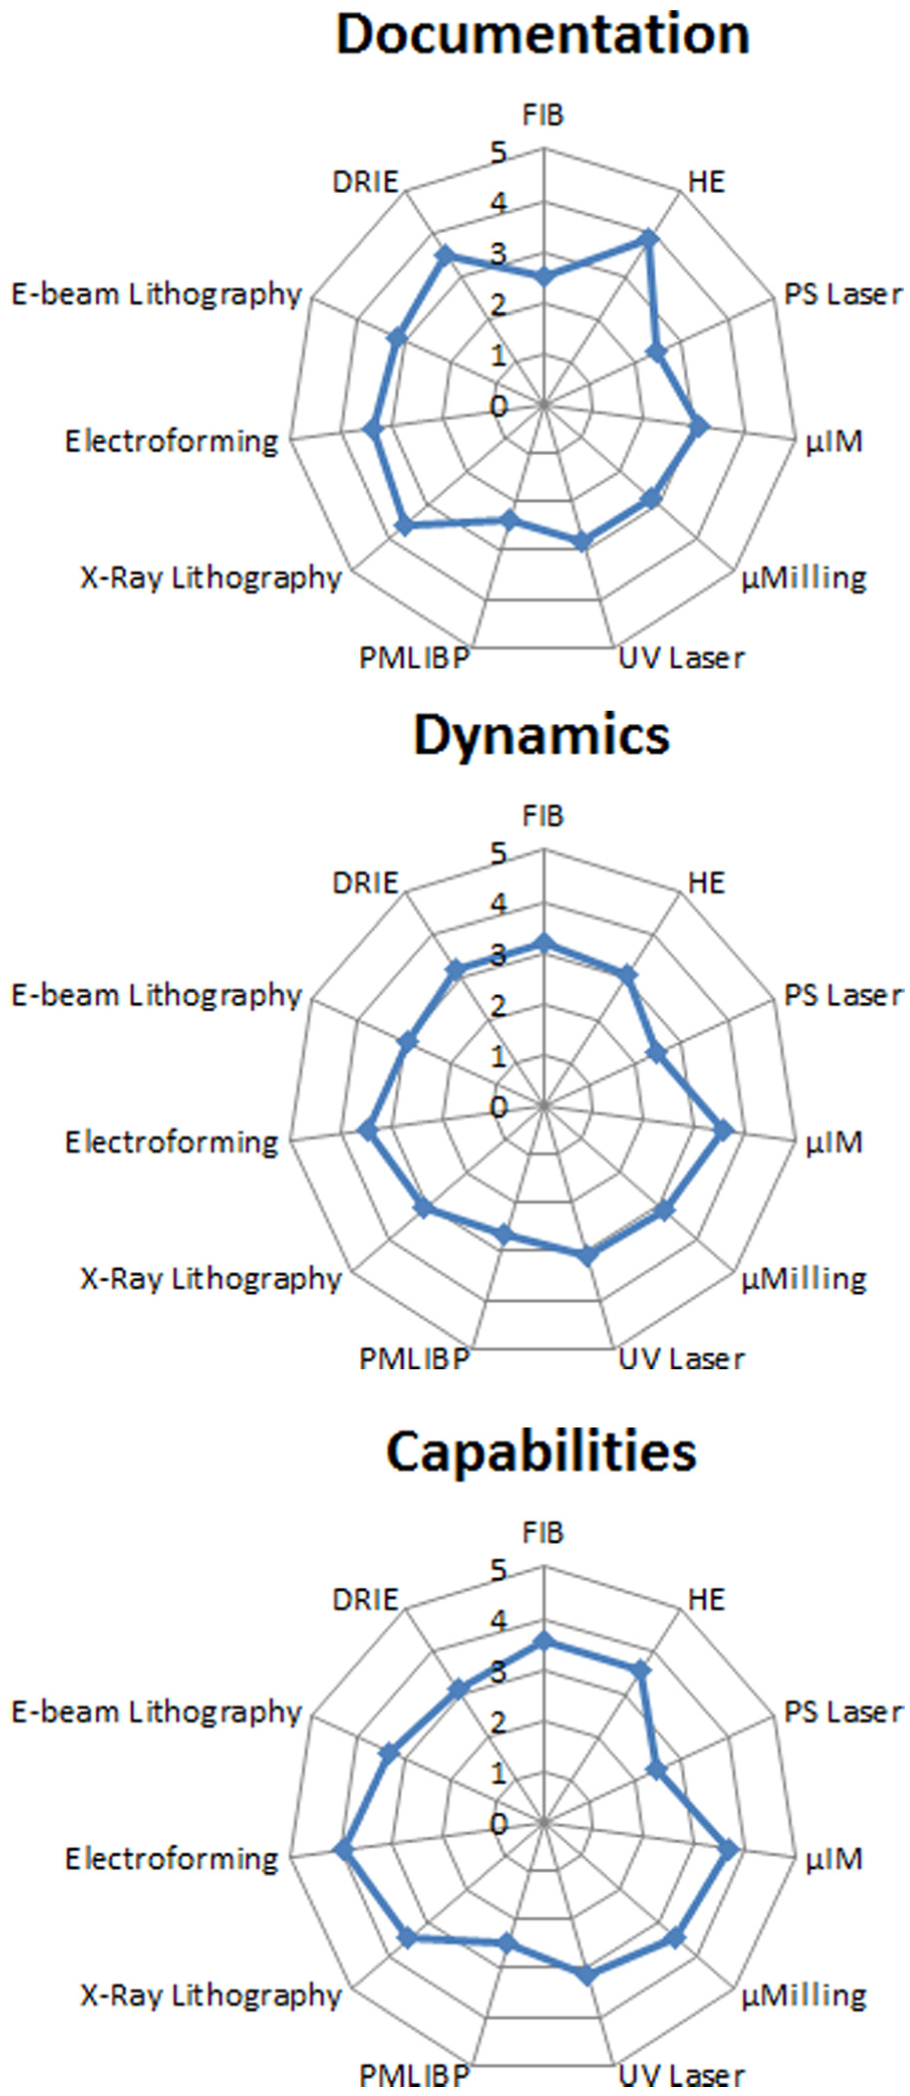
MLs of the process pairs and their constituent processes considered in this pilot implementation of the methodology are reported and discussed hereunder to illustrate its analytical potential. Figure 7 presents MLs of the analysed component technologies across the three process management categories. Figures 8–15 present the overall MLs and the ML profiles across the six KPCAs for the considered pairs and their constituent processes.
Maturity levels of component technologies across the three process management categories.
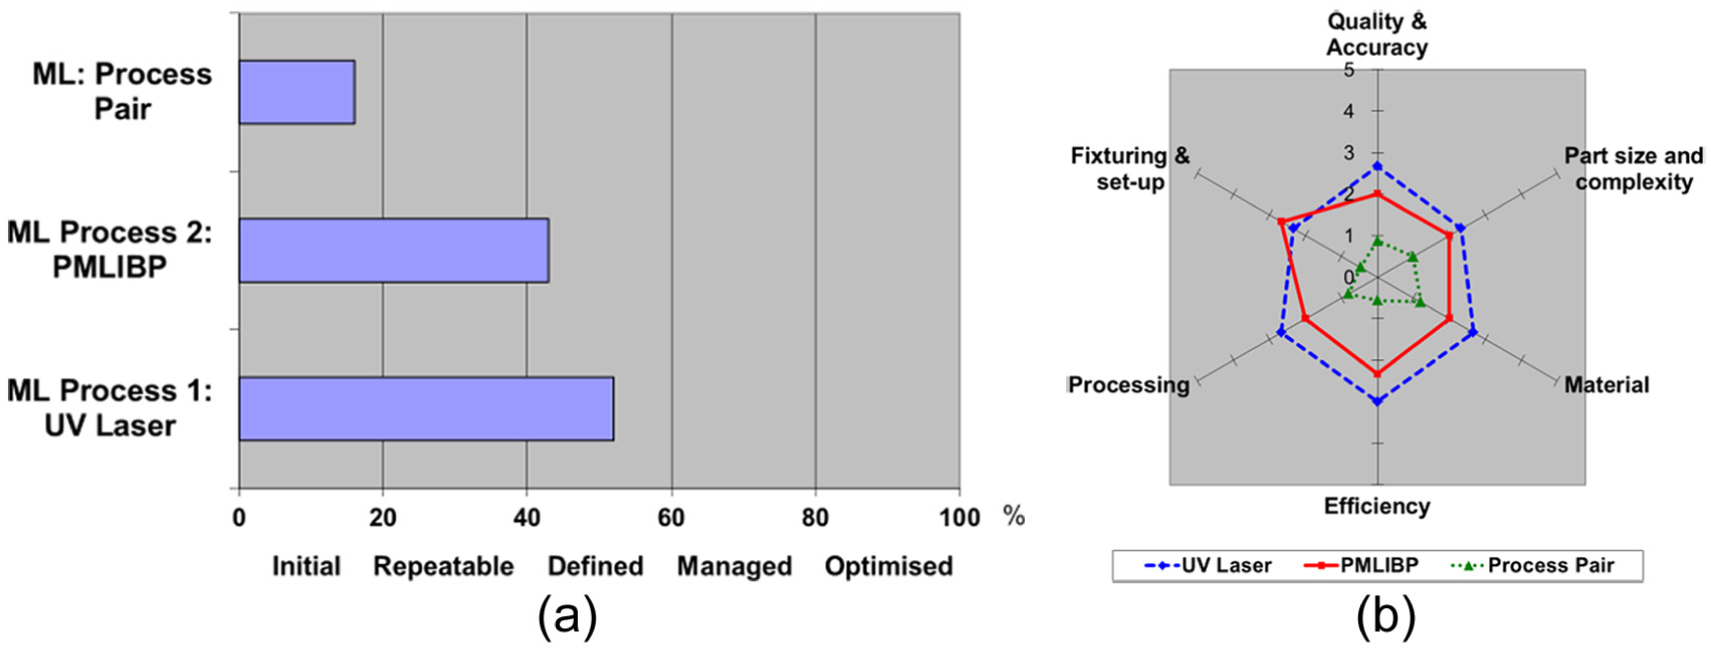
UV laser and projection maskless ion beam patterning: (a) overall MLs of the pair and its constituent processes and (b) KPCA chart of the pair and its constituent processes.
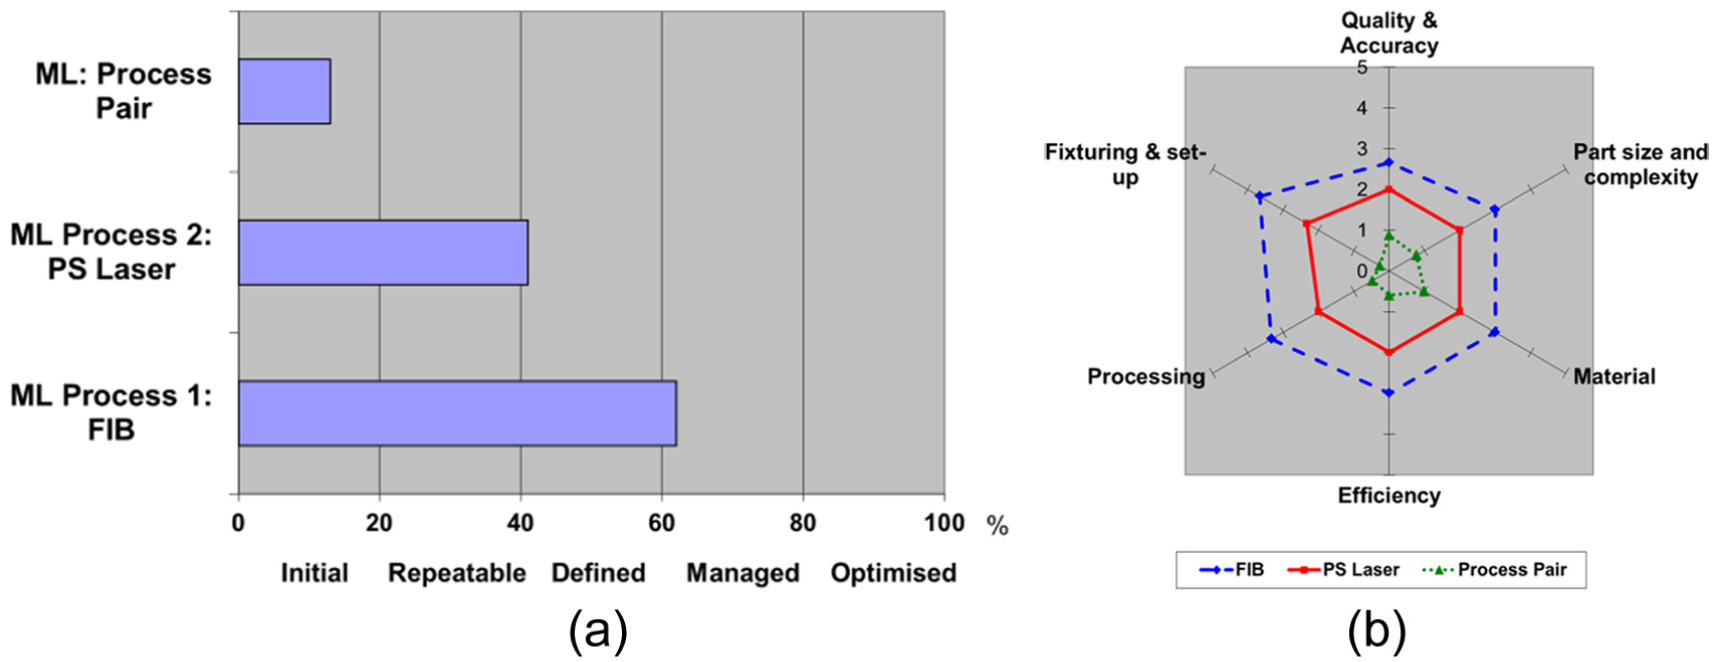
FIB and PS laser ablation: (a) overall MLs of the pair and its constituent processes and (b) KPCA chart of the pair and its constituent processes.
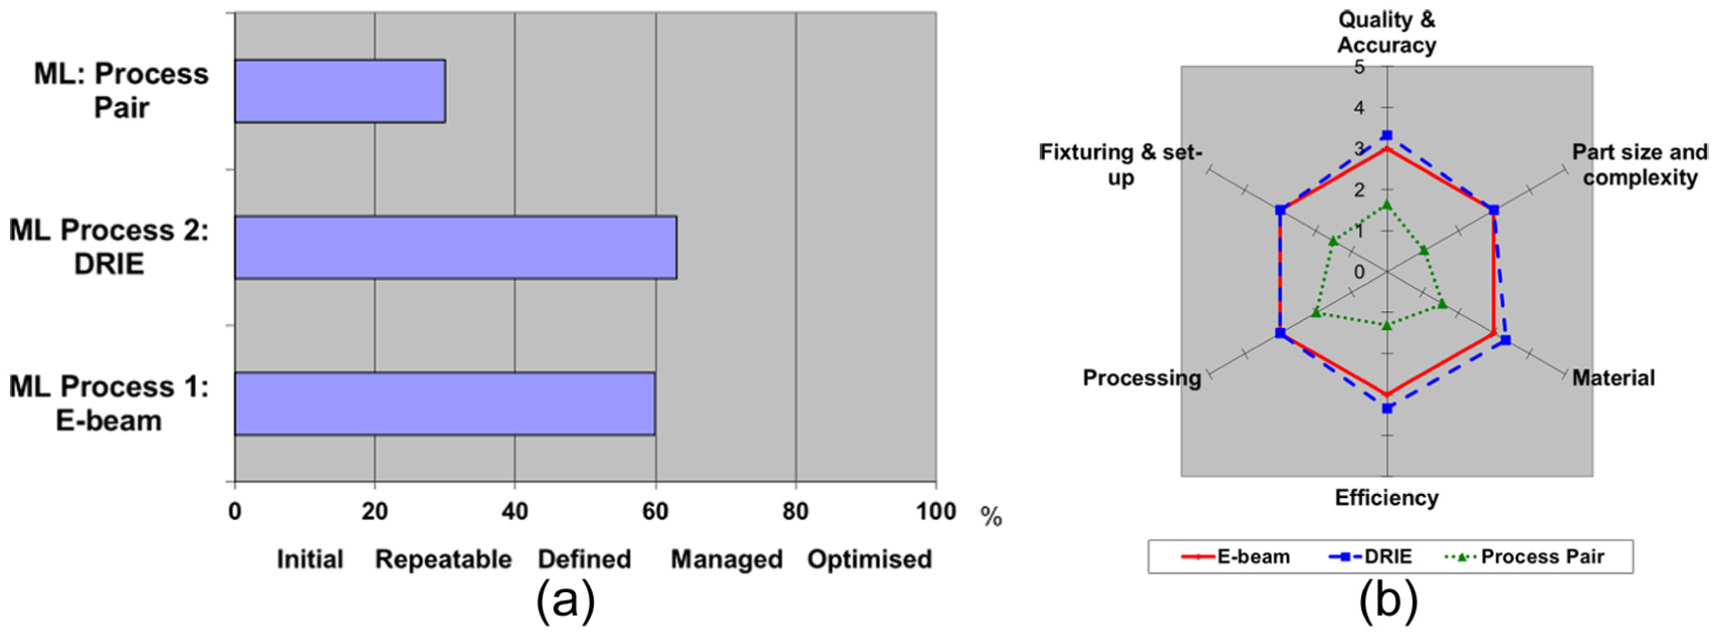
E-beam lithography and deep reactive ion etching: (a) overall MLs of the pair and its constituent processes and (b) KPCA chart of the pair and its constituent processes.
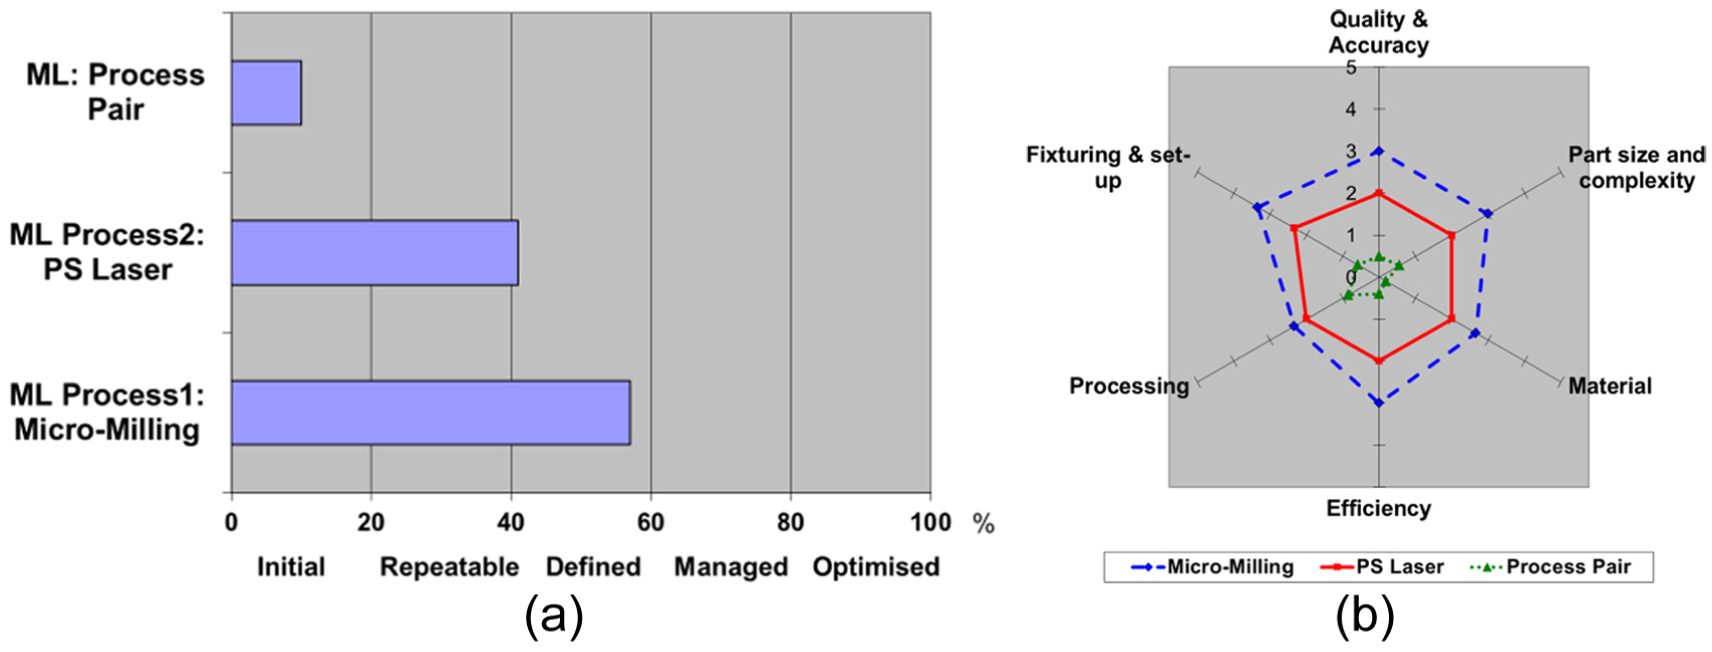
Micromilling and picosecond laser ablation: (a) overall MLs of the pair and its constituent processes and (b) KPCA chart of the pair and its constituent processes.
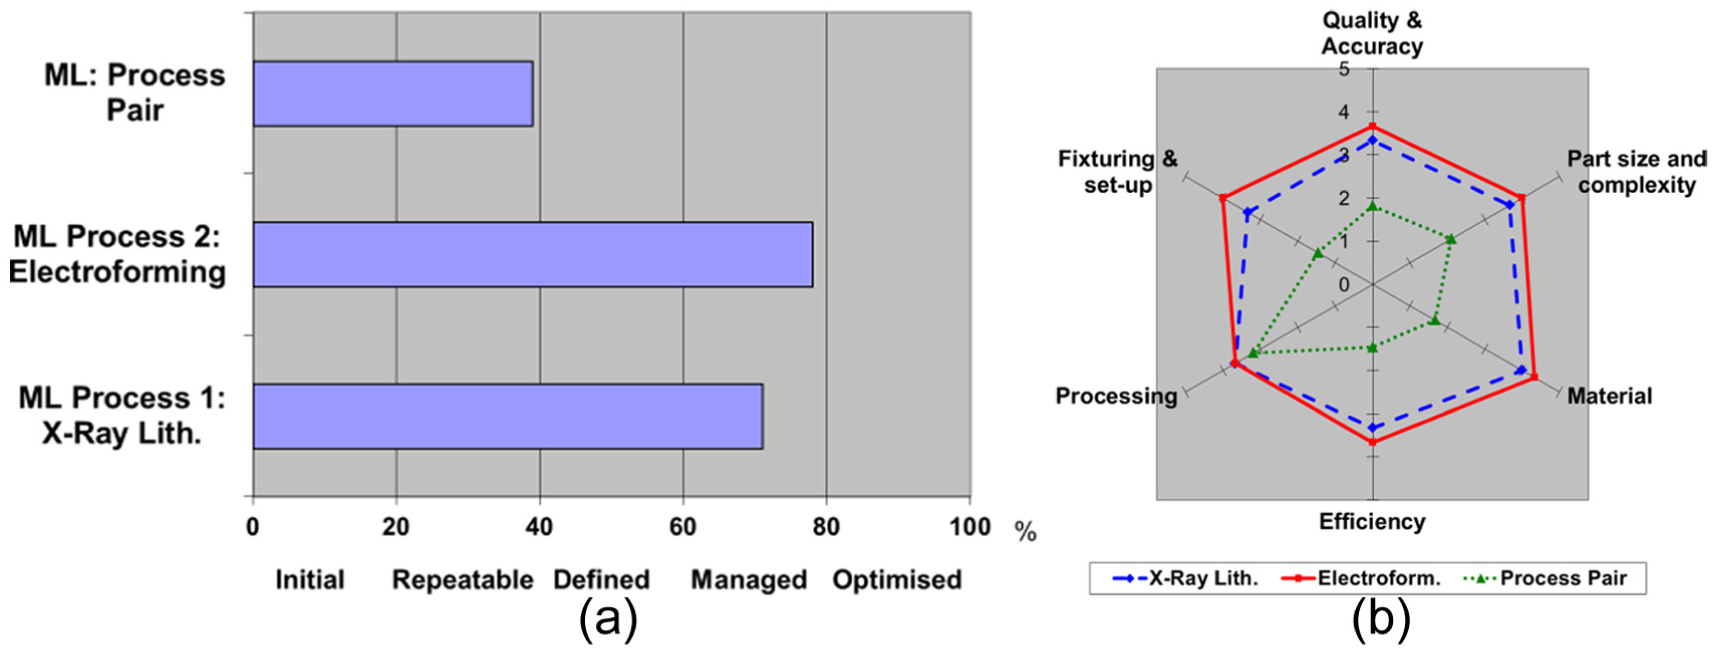
X-ray lithography and electroforming: (a) overall MLs of the pair and its constituent processes and (b) KPCA chart of the pair and its constituent processes.
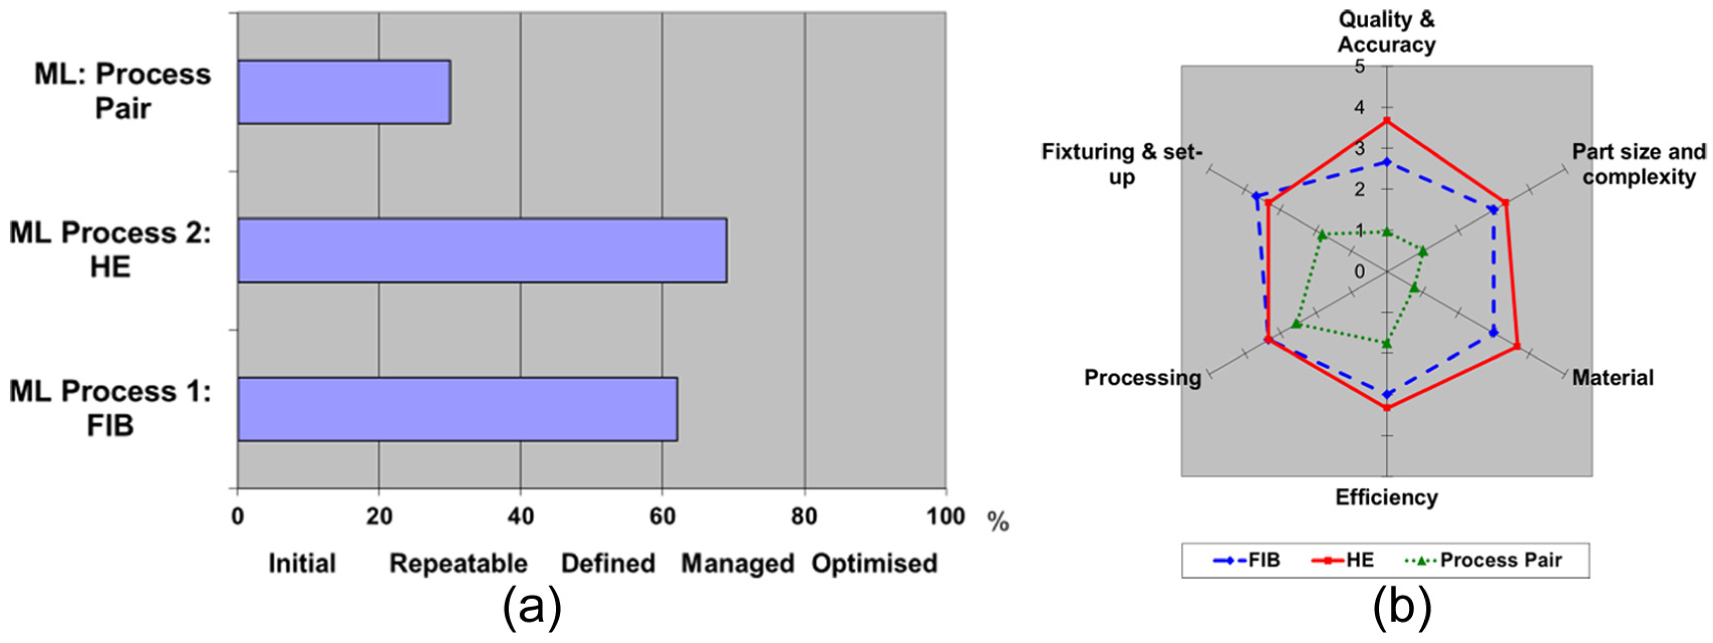
FIB and hot embossing: (a) overall MLs of the pair and its constituent processes and (b) KPCA chart of the pair and its constituent processes.
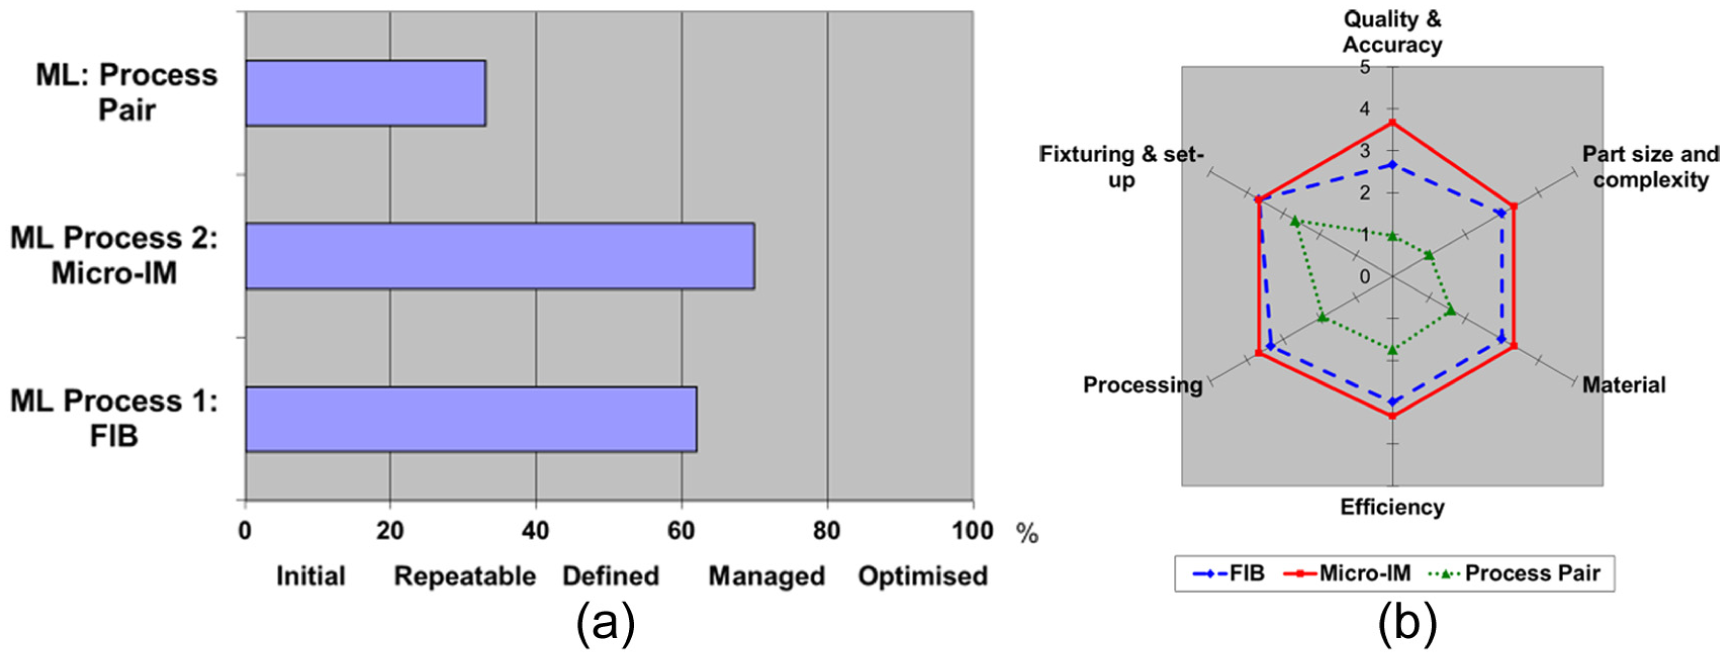
FIB and micro-injection moulding: (a) overall MLs of the pair and its constituent processes and (b) KPCA chart of the pair and its constituent processes.
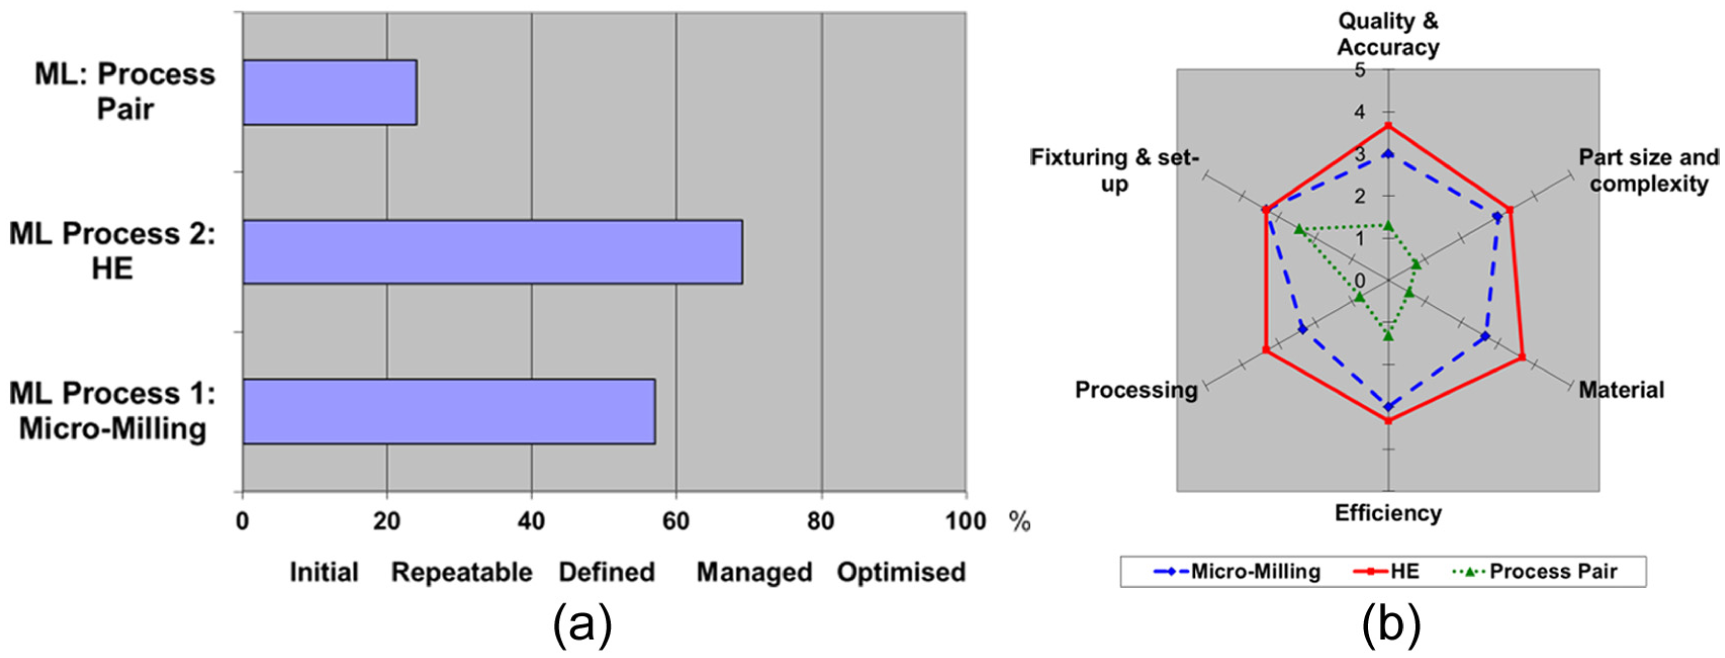
Micromilling and hot embossing: (a) overall MLs of the pair and its constituent processes and (b) KPCA chart of the pair and its constituent processes.
Component technology MLs across the process management categories
Analysing the component technologies in Figure 7, it is observed that:
Any similarities in MLs are reflected in the scale of differentiation between the component technologies’ values across the three process management categories. In particular, the Dynamics radar chart depicts less differentiation and therefore indicates that the processes are quite similar in their maturity with regard to this process management category.
Studying the radar chart for the Documentation category, it can be observed that MLs of the MNM processes show a higher differentiation, and the MLs vary from ‘Repeatable’ to ‘Managed’. HE has the highest ML, while PS-Laser and PMLIBP have the lowest value.
With regard to the Capabilities radar chart of the considered MNM component technologies, the MLs are not consistent, and they again vary from ‘Repeatable’ to ‘Managed’. The capabilities of electroforming are judged to be the most validated in comparison with other processes, while again PS laser and PMLIBP are the most underdeveloped.
In all three categories (Documentation, Dynamics and Capabilities), the overall status of the PMLIBP technology is due to the novelty of the process which is only existing as a proof-of-concept tool. Thus, this process is under development to fulfil the industry’s need for a high productivity, flexible and cost-effective structuring technology for large (i.e. over 6 in) surfaces with a resolution better than 10 nm.
KPCA charts
The results of the analysis of the ML profiles in Figures 8(b)–15(b) across the six KPCAs of the pairs and their constituent processes are shown in Table 3. In particular, the table depicts the results for the constituent processes on the left and for the pairs to the right, in terms of their overall ML, profiles’ consistency and MLs across the six KPCAs. At the process level, the MLs of the six KPCAs are compared to each other, while the pairs’ KPCAs are judged with regard to the average PP KPCA ML taking into account the specific KPCA’s compatibility and complementarity scores. Furthermore, the pairs’ overall compatibility and complementarity scores provide another assessment of the constituent processes’ suitability for combining them into pairs. Thus, the table shows clearly the strengths and weaknesses of the process pairs while taking into account the perceived current capabilities of their constituent processes. For example, taking the UV laser+PMLIBP pair, it can be stated for the component processes that the UV laser process has ML 3, while it is borderline between ML 2 and ML 3 for the PMLIBP process. At the same time, their capability hexagons are quite symmetrical. With the exception of ‘Fixturing and Set-up’, the MLs of all the UV laser KPCAs are higher than those for PMLIBP. At the same time, as the pair’s MLs are highly dependent on the consistency and magnitude of the constituent process’ MLs, the magnitude of the difference between the MLs and the compatibility and complementarity scores across all KPCAs (the capability hexagons’ symmetricity), the pair has a low ML of 1. It can also be observed that the pair’s ‘Fixturing and Set-up’ and ‘Efficiency’ KPCAs have low MLs due to the fact that the considered KPCPs are predominantly more compatible rather than complementary. Furthermore, overall, the KPCPs of the constituent processes are only marginally more complementary than compatible. Collectively, the results show that these two processes are alternatives rather than a process sequence that can lead to added value and thus to broaden the pair’s capabilities.
Assessment of the KPCA maturity profiles of the pairs and their constituent processes.
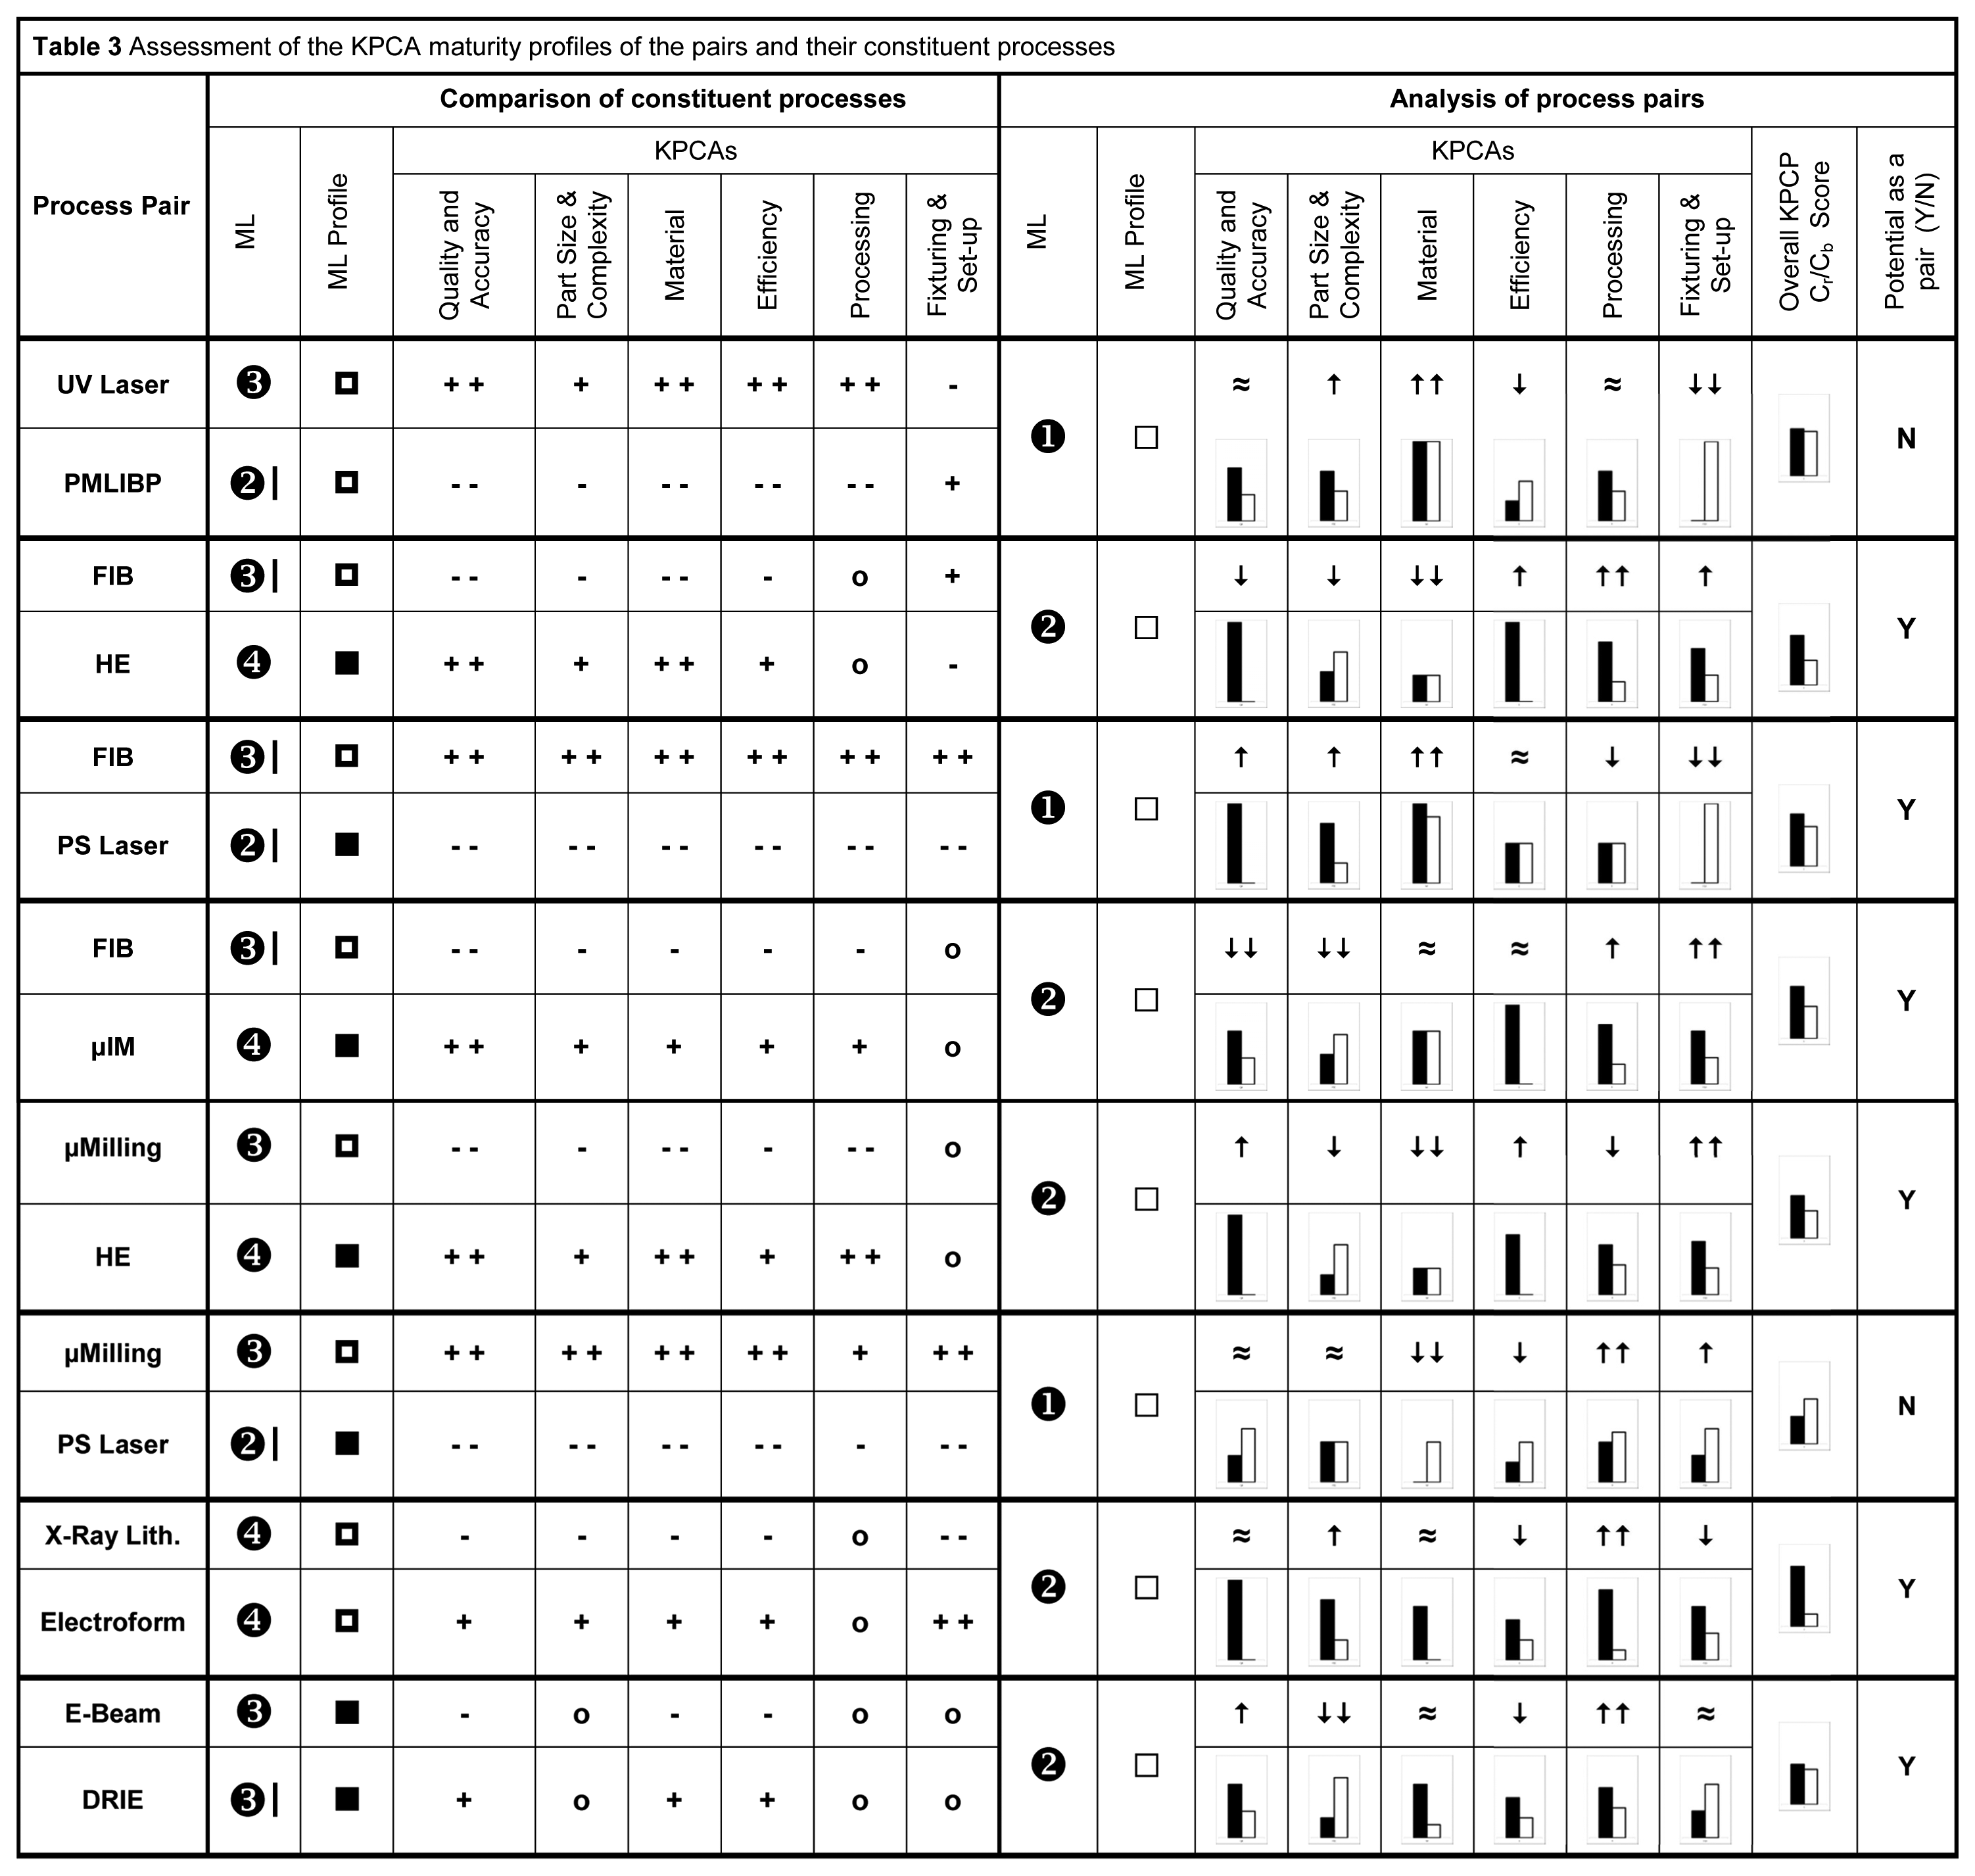
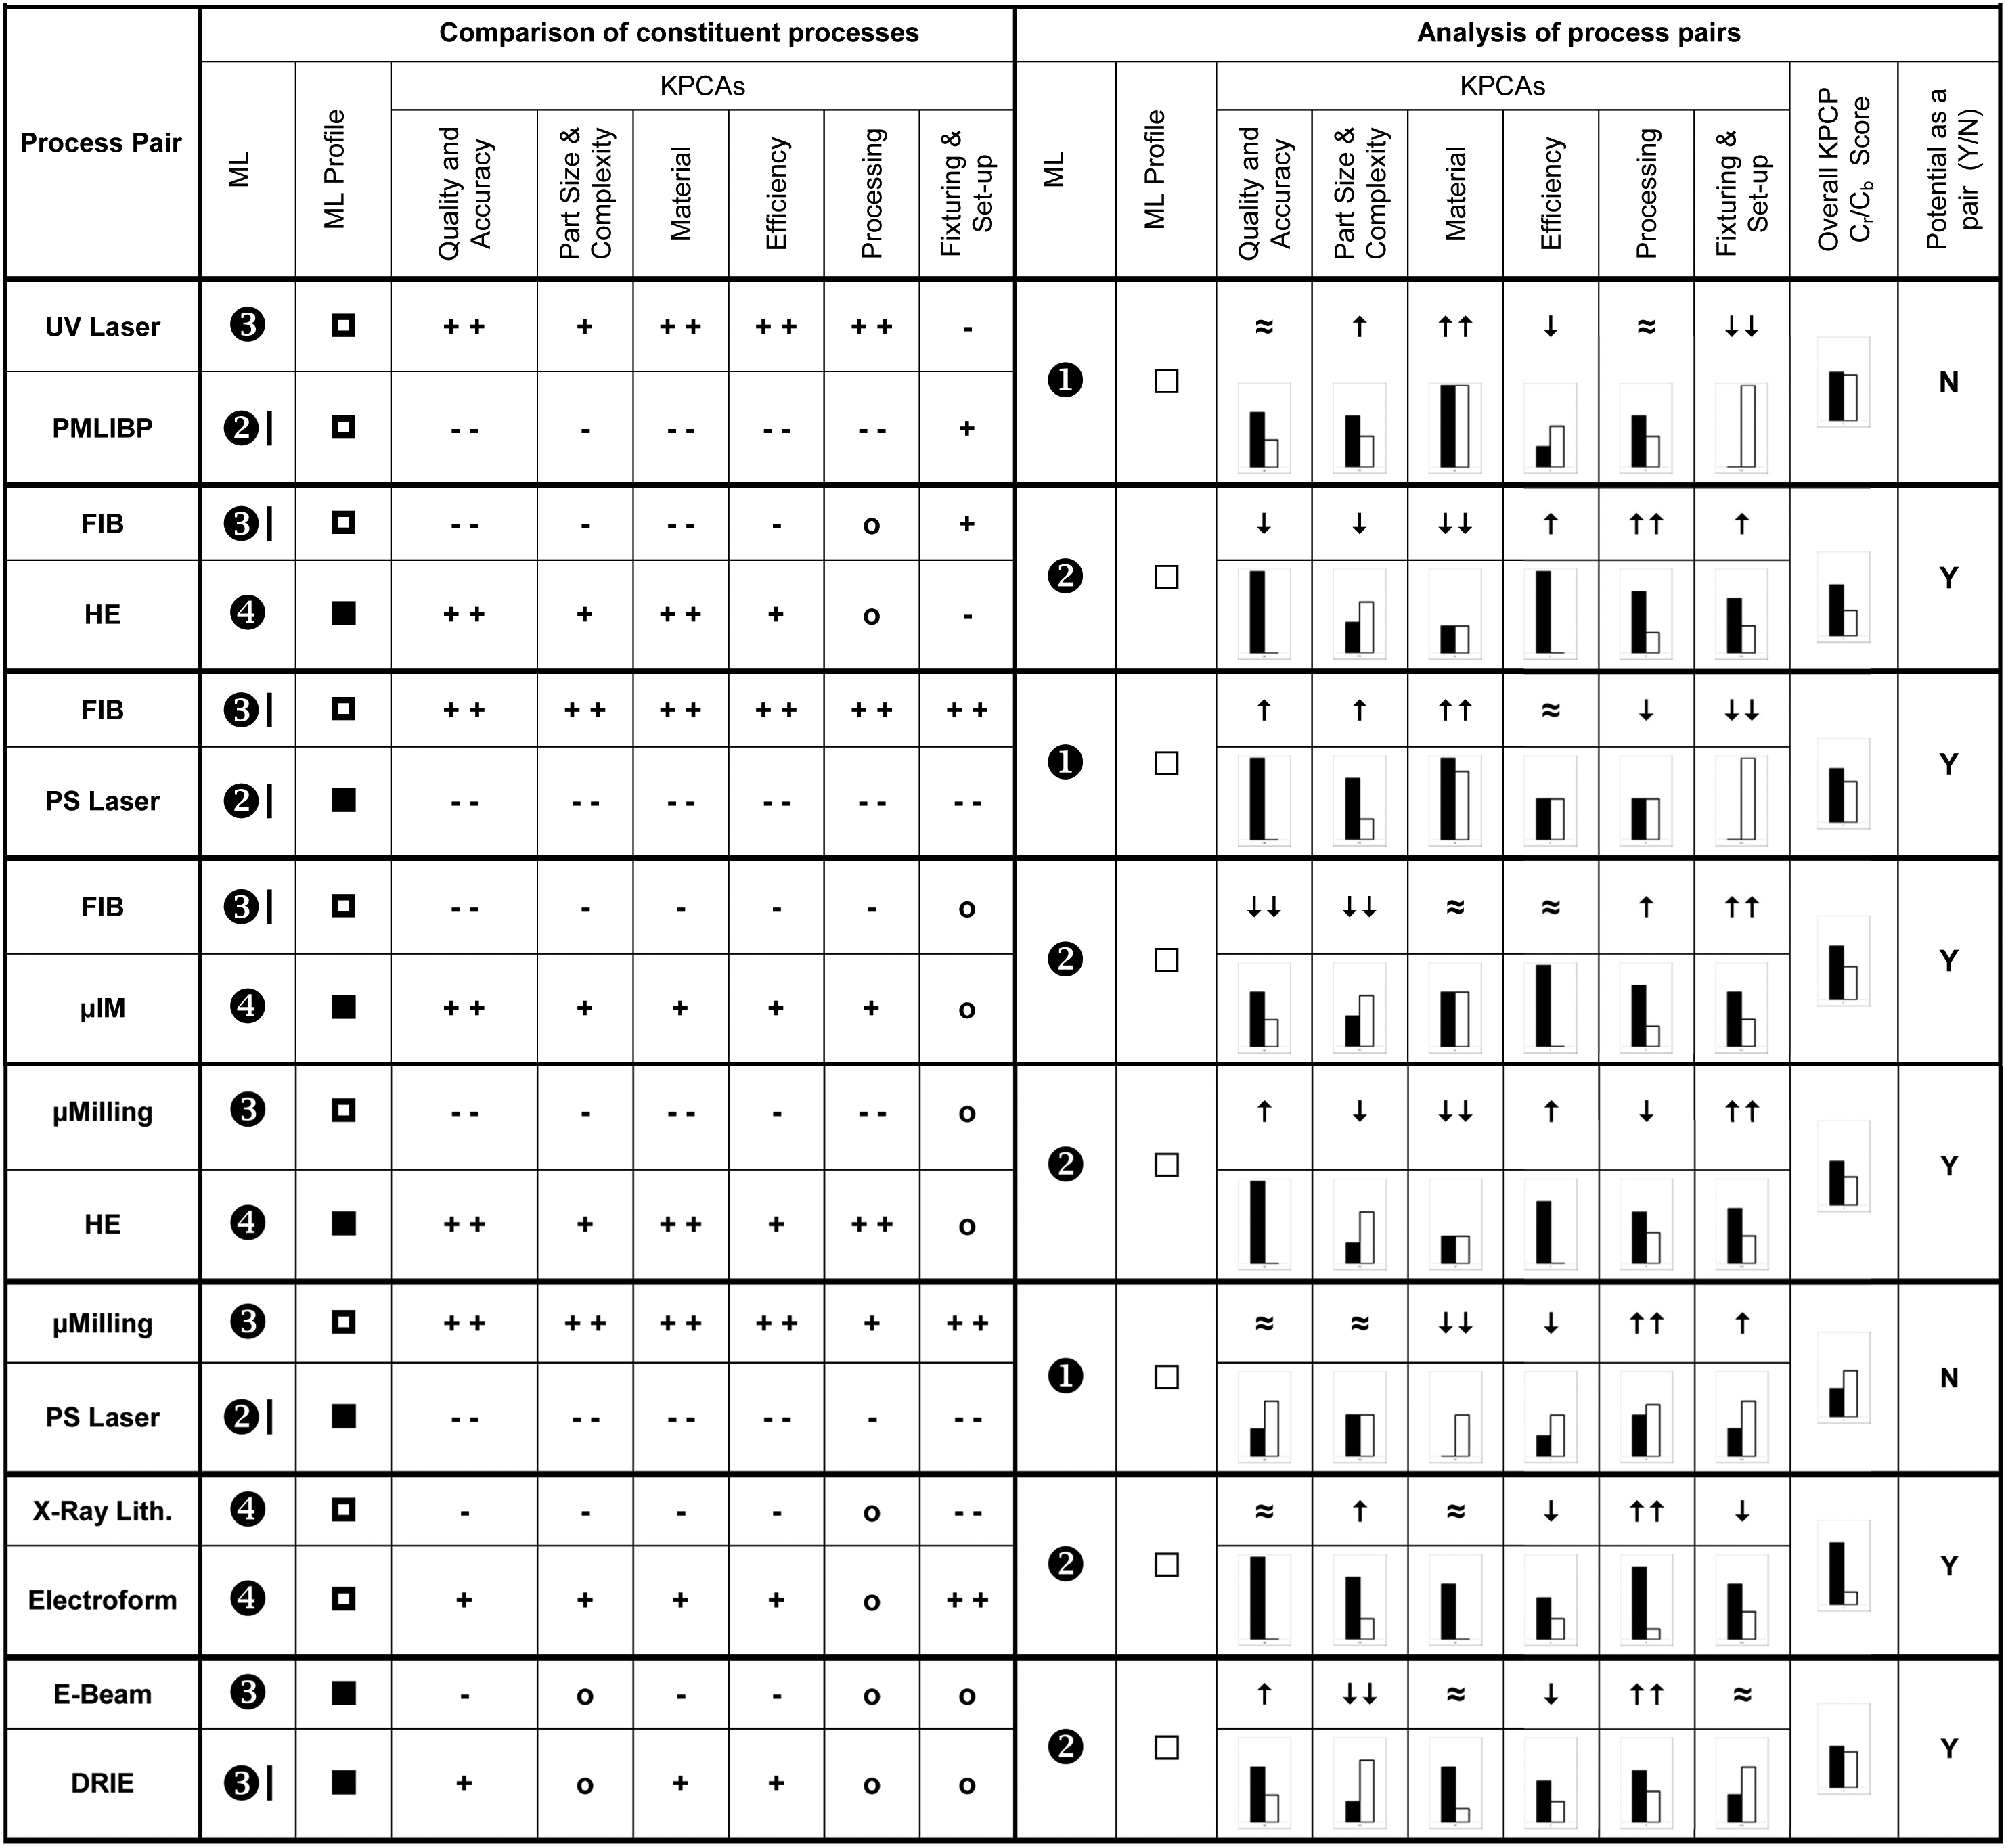
As depicted in Table 3, a similar analysis of the other pairs may be conducted based on the results and thus to make conclusions about their strengths and weaknesses. In particular, the analysis indicates that six of these pairs can be suitable for integration in process chains, and the conclusions for some of them are also supported by results obtained in feasibility studies. For example, in the case of the X-ray lithography and electroforming process pair, both technologies have been applied successfully in the LIGA process chain. Regarding FIB+PS laser and FIB+µIM pairs, their suitability as building blocks for process chains was experimentally investigated by Vella et al. 45 In this feasibility study, they were combined to form the PS laser+FIB milling+µIM process chain, which was successfully applied for the production of replication masters incorporating different length scale functional features for serial fabrication of thermoplastic polymer parts.
Overall MLs
The overall MLs of the analysed MNM technologies and their pairs are shown in Figures 8(a)–15(a) and Table 3. Thus, the range of MLs of the individual technologies is from Level 2, ‘Repeatable’, to Level 4, ‘Managed’, while that of the pairs is from Level 1, ‘Initial’, to Level 2, ‘Repeatable’. The results were discussed with the experts in MNM, and it was concluded that they reflect adequately the perceived current MLs of the considered processes and their pairs.
Looking at MLs of the processes, it is not surprising that µMilling is considered a ‘Defined’ process, ML 3 (57%), taking into consideration that (1) a lot of R&D effort was put in its development in recent years, (2) the technology is currently being exploited commercially by mould and watchmaking industries, while at the same time, (3) the research community recognizes that further fundamental investigations are still needed to understand and especially to model the machining mechanics at micro-scale.46,47 Furthermore, µMilling is ranked higher than PS laser ablation, and this reflects well the industrial impact of these technologies in context of their use as master making processes.
With regard to PS laser ablation, it is rated as a borderline case (41%) between a ‘Repeatable’ process, ML 2, and a ‘Defined’ process, ML 3, in spite of the fact that it is currently commercially exploited and significant R&D efforts have been put in its development. 48 Nevertheless, it is generally accepted that for this process, various open issues remain with respect to the following: the modelling and simulation of laser–material interactions,48,49 the empirical character of the process optimization, the predictability of the process performance and the necessity for further optimization of material removal strategies. 50 Therefore, within this context, the PS laser’s overall ML appears to be a realistic judgement of its current state of development.
Both X-ray lithography and electroforming were judged to be ‘Managed’ processes, ML 4, having normalized values of 71% and 78%, respectively. This result was considered true by the MNM experts and is also supported by the fact that significant efforts have gone in the development of these technologies. Furthermore, both processes have been studied extensively in the development of the LIGA process chain that has been widely used to fabricate micro-electro-mechanical systems (MEMS), micro-opto-electro-mechanical systems (MOEMS) and micro-fluidic devices.51–53 In addition, it should also be noted that X-ray lithography ‘is still being used as a mature lithography technology for small batch production of VLSI and other micro and nano technology application areas’. 51
E-beam was judged to be a ‘Defined’ process, ML 3 (60%), while DRIE with a normalized value of 63% is considered as a borderline case between a ‘Defined process’, ML3, and a ‘Managed’ process, ML 4. These results seem to be on the conservative side when taking into account their application areas and the significant investment in the development of these technologies. In particular, both E-beam lithography and DRIE have been used in process chains for mass production of integrated circuits (ICs) and also MEMs,51,54 while DRIE has also been utilized to fabricate silicon-based tooling for HE and µIM processes. 51 Furthermore, in the last decade, substantial work was carried out to improve the performance of these two technologies.51,55
The FIB process has a normalized ML of 62% and thus is also considered as a borderline case between a ‘Defined process’, ML 3, and a ‘Managed’ process, ML 4. This appears to be a realistic judgement when one considers the technology advances in the last two decades to make it an important MNM tool and an indispensable technology in semiconductor IC manufacturing and R&D.51,56 In particular, recent promising research work concerning the optimization of the FIB milling process for micromachining applications57–59 and the use of the FIB milling process to manufacture replication cavities in various materials7,60–62 has also been published.
Both replication processes, namely, HE and µIM were judged to be ‘Managed’ processes, ML 4, with normalized values of 69% and 70%, respectively. These results were judged as representative by the experts and are also supported by the facts that (1) substantial efforts have been aimed at the development of these technologies over the years and (2) these processes are utilized by industry successfully for serial production of polymer micro parts in a range of application areas, such as micro/nano optics, precision micromechanics, micro/nano-fluidics and CD/DVD replication.13,53,63–68
Finally, a close look at MLs of the UV laser and PMLIBP processes reveals that PMLIBP is a borderline case residing between a ‘Repeatable’ process, ML 2, and a ‘Defined’ process, ML 3, (43%) and thus has an equivalent ranking to that of PS laser. However, this result should be taken with a certain amount of precaution given the fact that it is based on the experience with only one pilot installation, and thus, it is considered premature to judge about the PMLIBP maturity. In contrast, ML 3 (52%) for the UV laser appears to be a conservative judgement when considering its broad use for direct writing or mask-based patterning.51,69–77 Furthermore, it was successfully integrated with other technologies, such as electroforming, µIM and HE, into a LIGA-like process chain called Laser-LIGA.51,69,74 Finally, from an application point of view, it was also demonstrated that UV lasers are suitable to fabricate microstructures for applications in microfluidics, micro-optics and biomedical devices.70–72,74,75
Conclusion
The work reported in this article aims at reducing the risks associated with the adoption and integration of manufacturing technologies, for example, MNM processes, into process chains underpinning existing and emerging miniaturized products. It presents a new methodology for assessing technology maturity of processes and process pairs. The proposed methodology was applied on eight MNM process pairs to assess their maturity and also to judge about their respective KPCAs. This pilot implementation revealed both strengths and limitations.
Strengths
The proposed methodology can be used to unify the maturity assessments of process chains by taking into consideration their constituent manufacturing technologies and by paying special attention to their interfaces, especially their input–output relationships.
The qualitative and quantitative information used for the process pairs and their constituent technologies can be considered representative because it is obtained through structured interviews of experienced process experts.
The results provide a valuable insight into the current state of manufacturing technologies and their potential integration into new process chains and thus to assist in their design taking into account the requirements for any given product.
It utilizes an expert-based qualitative framework to determine MLs of any given technology, and the obtained results were judged as representative and in line with the current state of their development.
It reveals the ‘limitations’ and ‘strengths’ of these technologies and their respective process pairs and thus to make an informed judgement about any open issues associated with their current state of development.
It provides ML ‘snapshots’ that can be utilized in follow-up studies to judge about the technology advances over given time periods.
Limitations
The inputs of the experts consulted can be biased to given equipment and machines and their specific applications, and thus, the results may not be sufficiently generic and representative for the capabilities of any particular technology. This could explain the MLs of E-beam, DRIE and UV laser processes obtained in the pilot implementation that were on the conservative side. A possible way to address this issue is to rely on a bigger pool of experts.
The pilot implementation of the methodology relied on inputs from face-to-face-type questionnaires that limit the number of interviewed experts. Other techniques such as a self-administered on-line or mail questionnaires can be considered in possible future implementations of the proposed methodology. 43
The methodology can be used for assessing process pairs and their constituent technologies; however, further development is necessary to apply it for assessing more complex process chains.
It will be beneficial if the proposed expert-based approach can be complemented by empirical assessments of technologies and process chains’ maturity, for example, by conducting round robin tests. The results from such research should also be used to find a more evidence-based way for combining pairs’ complementarity and compatibility scores.
Although the experts in MNM concluded that the ML values of the considered pairs reflect adequately the current level of their development and industrial take-up, ML 2 for the X-ray lithography+electroforming pair seems to be on the conservative side taking into consideration that both technologies have been applied successfully in the LIGA process chain. To some extent, this result can be attributed to the formula used to calculate the pair’s MLs, and thus, it is necessary to look at and improve it to reflect better the perceived MLs of pairs.
Footnotes
Acknowledgements
The authors gratefully acknowledge the assistance given by colleagues at Cardiff University and also by the partners in the EUMINAfab project in preparing and completing the questionnaire.
Declaration of conflicting interests
The author(s) declared no potential conflicts of interest with respect to the research, authorship and/or publication of this article.
Funding
The author(s) disclosed receipt of the following financial support for the research, authorship, and/or publication of this article: The research reported in this article was funded by the Engineering and Physical Sciences Research Council (GR/S75505, EP/F056745/1) and the EC FP7 projects: ‘Integrating European research infrastructures for the micro-nano fabrication of functional structures and devices out of a knowledge-based multi-materials repertoire’ (EUMINAfab), ‘High throughput integrated technologies for multi-material functional micro components’ (HINMICO) and ‘Advanced Manufacturing of Multi-Material Multi- Functional Products Towards 2020 and Beyond’ (4M2020).