
Abstract
Aluminum has been increasingly used in automotive and aerospace applications due to its beneficial specific strength and chemical properties. Due to its extensive use, machining of aluminum parts has become specifically significant in recent years. One important aspect of machining is the surface quality represented by the surface roughness values. In this article, the effect of equal-channel angular pressing on the surface roughness (Ra, Rq, Rt and Rz) of commercial purity aluminum machined by turning was studied. Five starting material conditions, defined as the annealed and equal-channel angular pressing processed up to four passes, were investigated. The independent variables were the cutting speed, depth of cut and feed rate. The fourth parameter (number of equal-channel angular pressing passes) was considered as categorical factor and, hence, was not included in the mathematical model. A full central composite circumscribed design matrix was built to allow the optimization of surface roughness using response surface methodology. The significance of process parameters and their interactions in estimating surface roughness was investigated using analysis of variance. The two parameters, with significant effect on surface roughness, were found to be the feed rate and number of equal-channel angular pressing passes. Minimum depth of cut (0.15 mm) and minimum feed rate (0.05 mm/rev) are needed to achieve minimum surface roughness parameters: Ra (0.06 µm), Rq (0.057 µm) and Rz (0.71 µm) and Rt (1.2 µm). The cutting speed, for these optimum roughness values, ranged from 207.5 m/min for Ra to 193 m/min for Rz. The optimum roughness values were generally achieved with the higher strength materials. Optimum values for Ra, Rq and Rz happened at the four equal-channel angular pressing passes–processed material, while the optimum value of Rt happened at the three equal-channel angular pressing passes–processed material.
Introduction
In order to synthesize ultrafine grain (UFG) materials from a coarse-grained material, it is imperative to subject the coarse-grained material to severe plastic deformation that induces remarkably high strains. Recently, the “top-down approach” with equal-channel angular pressing (ECAP) technique being the most prominent, has been widely used for producing UFG metals and alloys. ECAP induces severe plastic deformation by pressing a sample in a die that contains two intersecting perpendicular channels of equal cross section.1–5 This allows the samples to retain their cross-sectional area, so multiple pressings are feasible. During severe deformation, the materials develop subgrains and high dislocation density that allow for the cellular structure boundaries to evolve into high-angle grain boundaries. It is becoming vital that modern production tools should provide procedures whereby high surface quality products with novel mechanical properties can be produced while reducing the environmental impacts related to machining processes. Many studies have been carried out to minimize cutting energy, reduce machining time and maximize tool life. Nevertheless, the response variables mentioned before did not take into account the surface roughness values. Surface irregularities can produce a rough surface that is usually associated with high rates of wear and high coefficients of friction; they can even create sites for corrosion or cracks. Chen et al. 6 have shown that corrosion resistance in titanium is raised by lowering the surface roughness.
Shah and George 7 proposed a mathematical model to predict surface roughness for aluminum machined by turning, using polycrystalline diamond (PCD) tool on a computer numeric control (CNC) turning center, via response surface methodology technique. The process parameters investigated were workpiece rotation speed, feed and depth of cut, while surface roughness is the response variable measured. The model showed that the depth of cut exhibited a great effect on surface roughness in a proportional manner. The study also revealed that feed had significant effect on surface roughness, and that workpiece rotation speed had minimum effect.
Kumar and Rajmohan 8 investigated the turning of nanostructured Al 5083 produced by consolidation of milled chips by hot ECAP process. A factorial design of experiments was implemented to relate the process parameters defined as speed, feed, depth of cut and tool angle to the response variables defined as maximum chip length, tool wear and material removal rate (MRR). The model developed by analysis of variance (ANOVA) concluded that metal removal rate is most significantly affected by depth of cut.
Horvath and Dregelyi-Kiss 9 reported a study on the turning of an AlMgSi alloy with a chemical vapor deposition (CVD) diamond tool through employing design of experiments. A reduced empirical equation was developed that related surface roughness to cutting parameters. The equation was useful in estimating the average surface roughness for the range of optimal cutting conditions investigated. It was concluded that the dependence of surface roughness on cutting speed was quite small, and the feed rate had the greatest impact on the resulting roughness.
Morehead et al. 10 compared the machinability of ultrafine-grained and regular coarse–grained titanium using PCD cutting tools. The process variables included surface roughness, cutting forces, tool wear, chip morphology and various cutting conditions of cutting speed, feed rate and depth of cut. Cutting forces and chip morphology were very similar between the two metals, while UFG Ti possessed superior surface quality and tool life when compared to those of its coarse-grained counterpart.
Kadirgama et al. 11 explored the surface roughness of milled 6061-T6 Aluminum alloys with carbide-coated inserts. Response surface method–based optimization approach was used to develop a model that relates surface roughness to the most dominant cutting variables (cutting speed, feed rate, axial depth and radial depth). It was seen from the first-order model that the feed rate was the most influencing factor for surface roughness. Second-order model revealed that there was no interaction between the processing parameters and response variable.
Horvath and Dregelyi-Kiss 12 investigated the fine turning of two types of aluminum through design of experiments methodology. Multi-objective optimization was presented so as to maximize productivity and minimize surface roughness. Combined models were developed to relate the Ra and Rz surface roughness values to the cutting parameters, workpiece material and tool shape as input data. Among the examined workpiece materials, the harder hyper-eutectic alloy had better finish turning (lower roughness values).
Kumar and Chauhan 13 investigated the effect of cutting speed, feed rate and approach angle on the surface roughness of two Al 7075 composites. The two composites were classified as hard composite (10 wt% SiC) and hybrid composite (7 wt% SiC and 3 wt% graphite). The turning machining was conducted by PCD tool. The cutting parameters were varied for two levels and response surface methodology (RSM) and artificial neural networking (ANN) were applied to relate surface roughness to the cutting parameters. They concluded that feed rate had significant contribution for both materials than speed and approach angle. They, also, inferred that surface roughness of the hybrid composite is lower than that of the hard ceramic composite for all combinations of process parameters.
Krallics et al. 14 studied the evolution of mechanical properties in terms of strength and ductility of ECAP-processed 6082 AA (Al-Mg-Si). ECAP processing was conducted to eight passes and concluded that after four passes, the material attained high strength but on the expense of reduced ductility. The strength almost saturated after 8 ECAP passes by route C, while the ductility increased dramatically. This was interpreted through the texture and anisotropy developed. Machining by turning of the samples processed to eight passes yielded high surface quality. It was reported that the surface roughness reduced by a factor of 5 for this particular sample compared to the surface roughness achieved in the raw material under similar cutting conditions.
El Hossainy 15 investigated the effect of two-pass turning on the surface roughness of 6082 aluminum alloy, high-strength low-alloy (HSLA) steel and 60/40 brass. It was concluded that the best (minimum) surface roughness was achieved for HSLA steel followed by brass and finally aluminum, and this was attributed to the fact that higher hardness results in better surface quality. It was also concluded that the two-pass technique results in improved surface roughness, straightness and roundness.
Gupta et al. 16 studied the surface roughness and profile accuracy for Nickel–silicon–chromium–copper alloy through varying four machine and cutting tool parameters, namely, tool node radius, feed rate, spindle speed and depth of cut. It was concluded that tool nose radius exhibited the largest effect on surface roughness and profile error. With larger tool nose radius, the surface roughness improved; however, the profile accuracy deteriorated. Feed rate and spindle speed also affected the roughness and profile error, while depth of cut had little or no effect.
Bhardwaj et al. 17 investigated surface roughness in end milling operation using carbide inserts on AISI 1019 steel. The work focused on establishing empirical relationships between the machining parameters and average surface roughness using RSM. A first-order and quadratic models have been developed in terms of feed, cutting speed, depth of cut and nose radius. Furthermore, the Box–Cox transformation was employed to improve the prediction ability of the first-order model. Cutting speed, feed and nose radius were reported to have the significant effect on surface roughness.
Bhardwaj et al. 18 developed an accurate surface roughness prediction model using RSM based on center composite rotatable design with Box–Cox transformation in turning of AISI 1019 steel. An improved prediction model has been developed by improving the normality, linearity and homogeneity of the data using a Box–Cox transformation. This improved model has been found to yield good prediction accuracy. The result showed that the feed is the main influencing factor on the surface roughness, while the depth of cut has no significant influence.
Ucun et al. 19 studied the effect of cutting parameters, coating material and the built-up edge phenomenon on the surface roughness in micro-end milling process of Inconel 718 using a white light interferometer and scanning electron microscopy. A micro-end mill coated with five separate coating materials was used in this study. They reported that the mean surface roughness values of surfaces machined with a diamond-like carbon-coated and AlTiN-coated cutting tool were the lowest. They concluded that the formation of built-up edge causes chips to be smeared on machined surfaces, which has a negative impact on the surface quality.
The current work primarily focuses on studying the synergistic effect of different cutting conditions of feed rate, cutting speed and depth of cut with different starting material conditions of strength and grain structure produced by ECAP processing on the surface quality for commercial purity aluminum machined by turning. RSM and a mathematical model will be developed to optimize the cutting conditions for minimum surface roughness. AA1050 commercial purity aluminum was selected, for this study, as it is an ideal lightweight material that can be strengthened by the ECAP process which is capable of inducing significant grain refinement and increase in strength.
Materials and methods
Commercial purity aluminum was received as cold rolled plates of 15 mm thickness. ECAP samples were machined parallel to the rolling direction and then annealed at a temperature of 600 °C for 8 h, to give an average grain size of about 600 µm. The ECAP die angles were machined to be Ψ = 0 and ϕ = 90°. This geometry induces an equivalent strain of 1.2 on the material processed by ECAP for each pass. The samples were ECAP processed using Route BC (where the sample is rotated by 90°, in the same sense, between subsequent passes) to four passes. The particularity of ECAP is in the way of deforming the material by simple shear through extruding it in a die containing two perpendicular channels of equal cross-sectional area. This means that the sample retains its cross-sectional dimensions which allows for multiple pressing in the die. The accumulation of plastic strain is capable of breaking down the grain size to the submicron level. A schematic of the die can be seen elsewhere.1,2
EMCO Concept Turn 45 CNC lathe equipped with Sinumeric 840-D was used to conduct the experimental work. The specification for tool holder and insert is SVJCL2020K16 and VCGT160404 FN-ALU, respectively. The clearance angle, cutting edge angle and nose radius are maintained at 5°, 35° and 0.4 mm, respectively. All cutting parameters were controlled via CNC part program and all the experiments were conducted in wet conditions. The surface roughness was evaluated using surface roughness tester TESA. The test specimen drawing is shown in Figure 1, while the test rig for machining the test specimens is shown in Figure 2. The test rig for measuring surface roughness is shown in Figure 3.
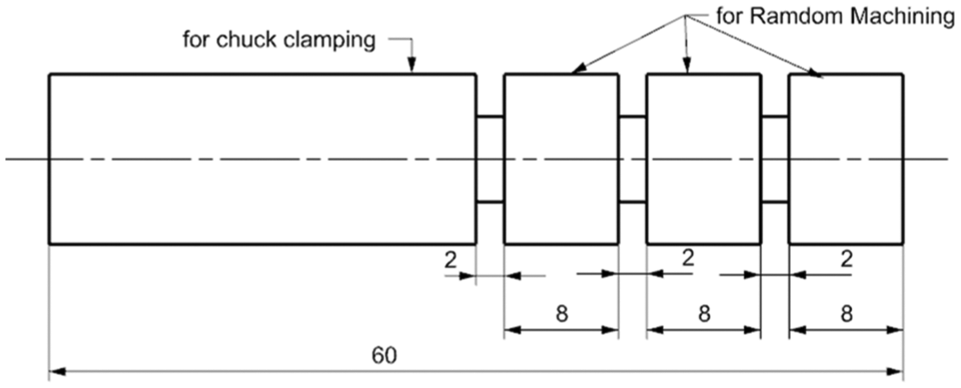
Test specimen drawing.
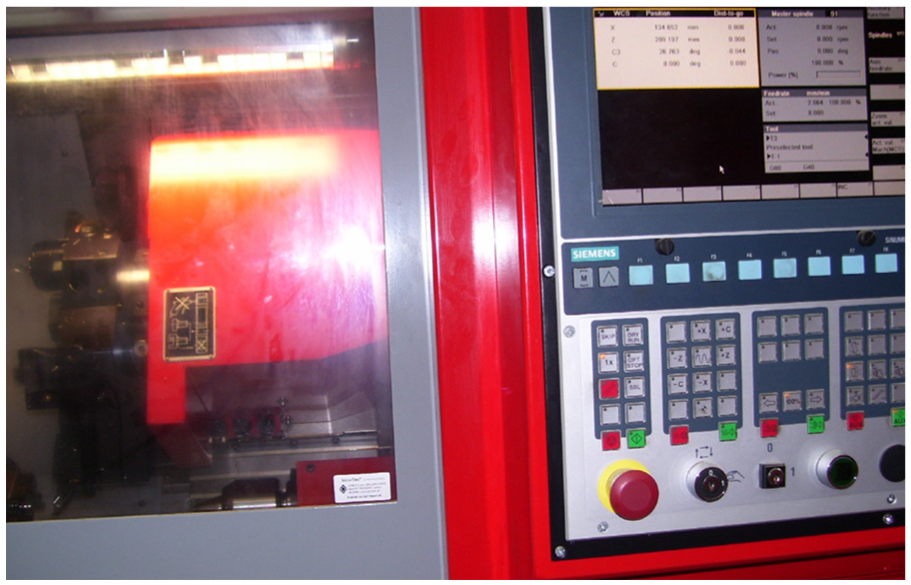
Test rig for machining workpieces.
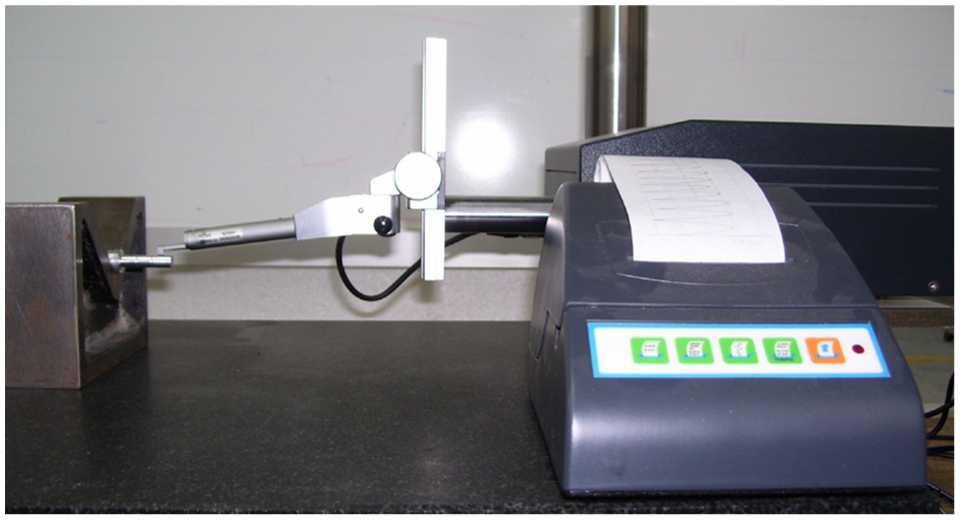
Test rig for measuring surface roughness.
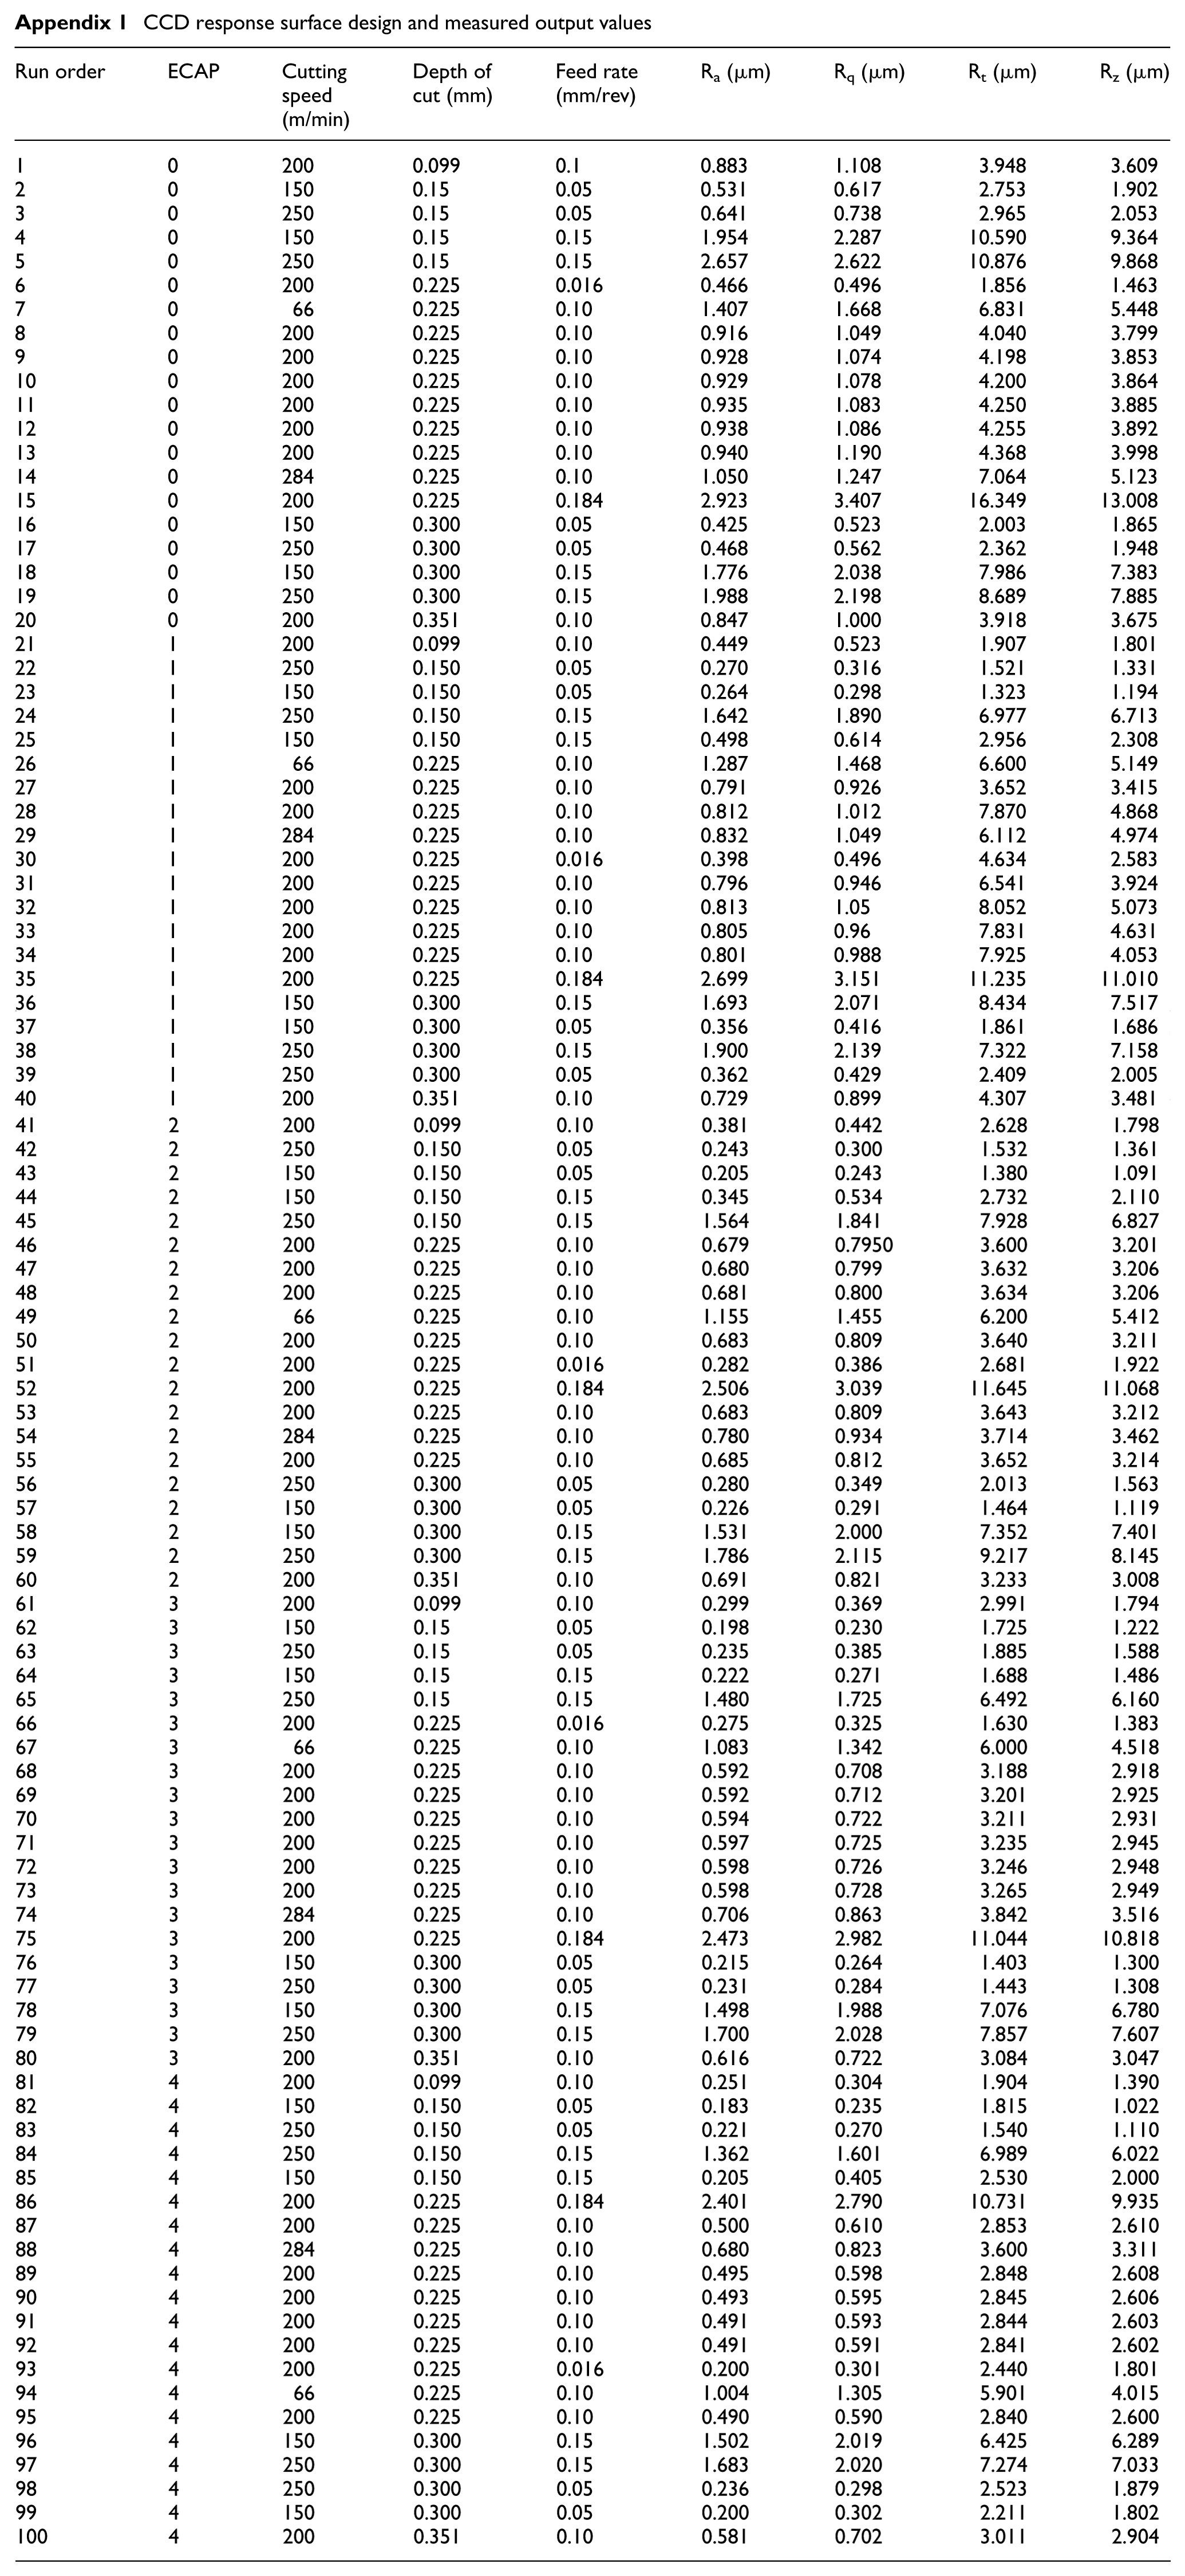
The test specimens had an initial diameter of 12 mm and a length of 60 mm. The test specimens were divided into four areas. The first area with a length of 30 mm was used for chuck clamping, and the other three areas with 8 mm for each and separated by a groove of 2 mm were used for machining with different feed rates as shown in Figure 1. The test specimens had five different starting conditions; annealed and ECAP processed to 1, 2, 3 and 4 passes. The cutting parameters and values of surface roughness (Ra, Rq, Rt and Rz) were recorded in Appendix 1. where Ra is the arithmetic average deviation of the assessed profile (µm), Rq is the root mean square deviation of the assessed profile (µm), Rt is the maximum height of the profile (µm) and Rz is the average maximum height of the profile (µm).
RSM is a collection of statistical and mathematical techniques used to optimize a considered output variable, or response (represented in the model by the dependent variable), that is influenced by a set of controllable input variables, or factors (represented in the model by the independent variables). 20 The relation between the response (y) and the factors (x1, x2, x3,…, xk) can be represented by the following equation

where ε represents the error or noise exists in the measured response y. If the expected response E(y) is = f(x1, x2, x3, …, xk) = η, then the response surface is the surface represented by η. 21 To find an approximation to the relation between y and x’s, a low-order polynomial is usually used. In the context of surface roughness optimization, a second-order model in the form of equation (2) is usually applied22–24
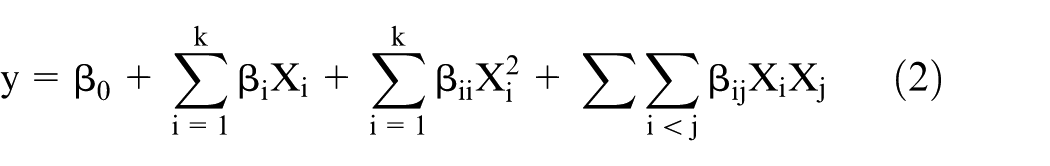
where βo is the constant term, βi represents the linear effects, βii represents the pure quadratic effects and βij represents the second-level interaction effects. Minitab software uses the method of least squares to estimate the values of βs. As a general rule, the quadratic model described by equation (2) is unlikely to represent the relation between a response and its input factors over the entire factors’ domains. However, the quadratic model proved a reliable representation of this relation over a limited part of these domains. In the case of relating surface roughness to machining parameters, as in this research, only a small relevant range of cutting parameters’ values is investigated.
A full rotatable central composite circumscribed (CCC) design was used to plan the experimental work. Central composite design (CCD) is the most popular design used to fit response surface models. 20 The CCC design is the original form of the CCD and is represented as given in Figure 4. 24 The corners of the inner square represent the basic factorial design for a simple two-factor case (i.e. 22 factorial design). The outer circle represents the new extremes for the studied factors, with extra four points (i.e. four extra cases) to run. These extra points with the added center point in the middle of the circle allow depicting the quadratic terms in the model. The distance between the inner square and the outer circle is adjusted as to guarantee full readability of the design.
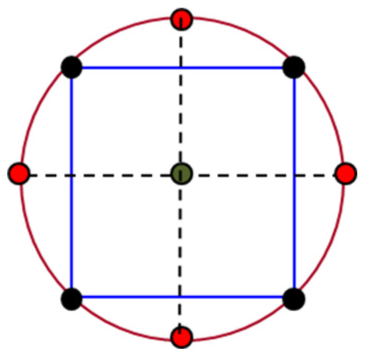
Central composite circumscribed design for two factors.
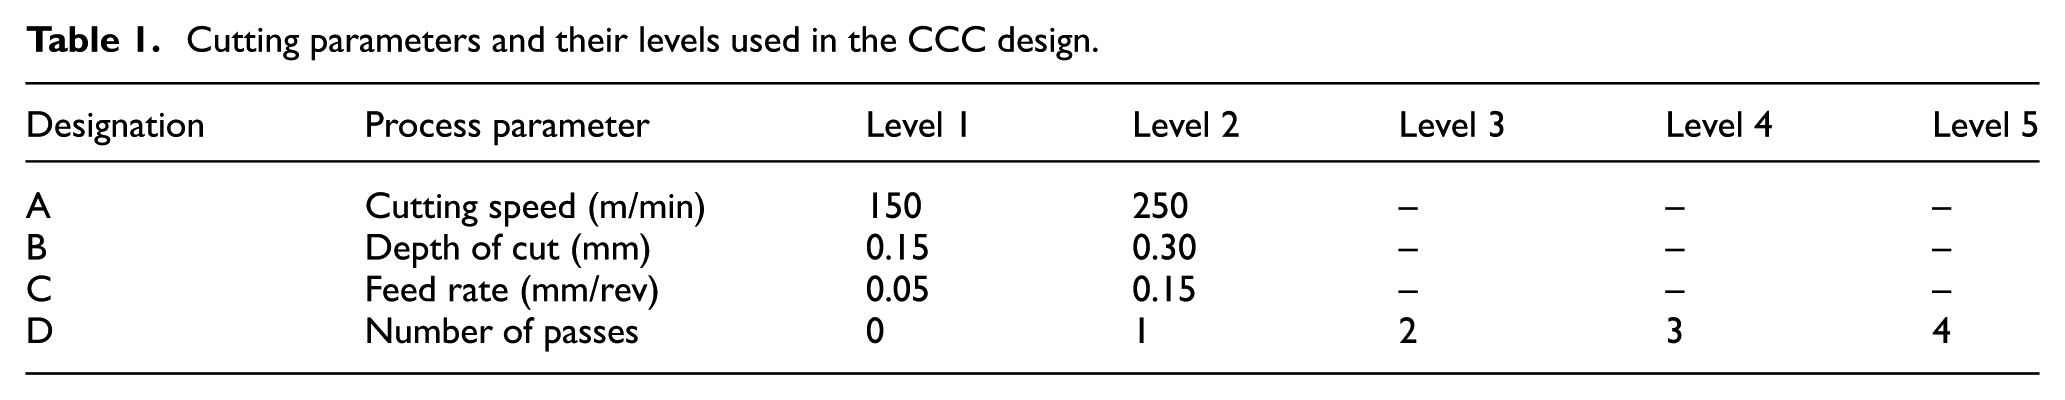
Table 1 summarizes the studied factors and their levels in the basic factorial design. The number of ECAP passes was treated as a categorical factor, while the other factors (cutting speed, depth of cut and feed rate) were treated as continuous variable. The design was conducted using Minitab 17, with total of 100 experiments. Appendix 1 illustrates the full list of experiments with measured response values (Ra, Rq, Rt and Rz) in micrometers.
Cutting parameters and their levels used in the CCC design.
Results and discussion
The mechanical properties in terms of hardness and yield strength values, as well as the microstructure characteristics reflected in the grain size, average misorientation angle and percentage of high-angle grain boundaries are summarized in Table 2. These depicted values are from a previous work1,2 that was conducted on the commercial purity aluminum used in the current study.
Mechanical and microstructure characteristics of commercial pure aluminum.
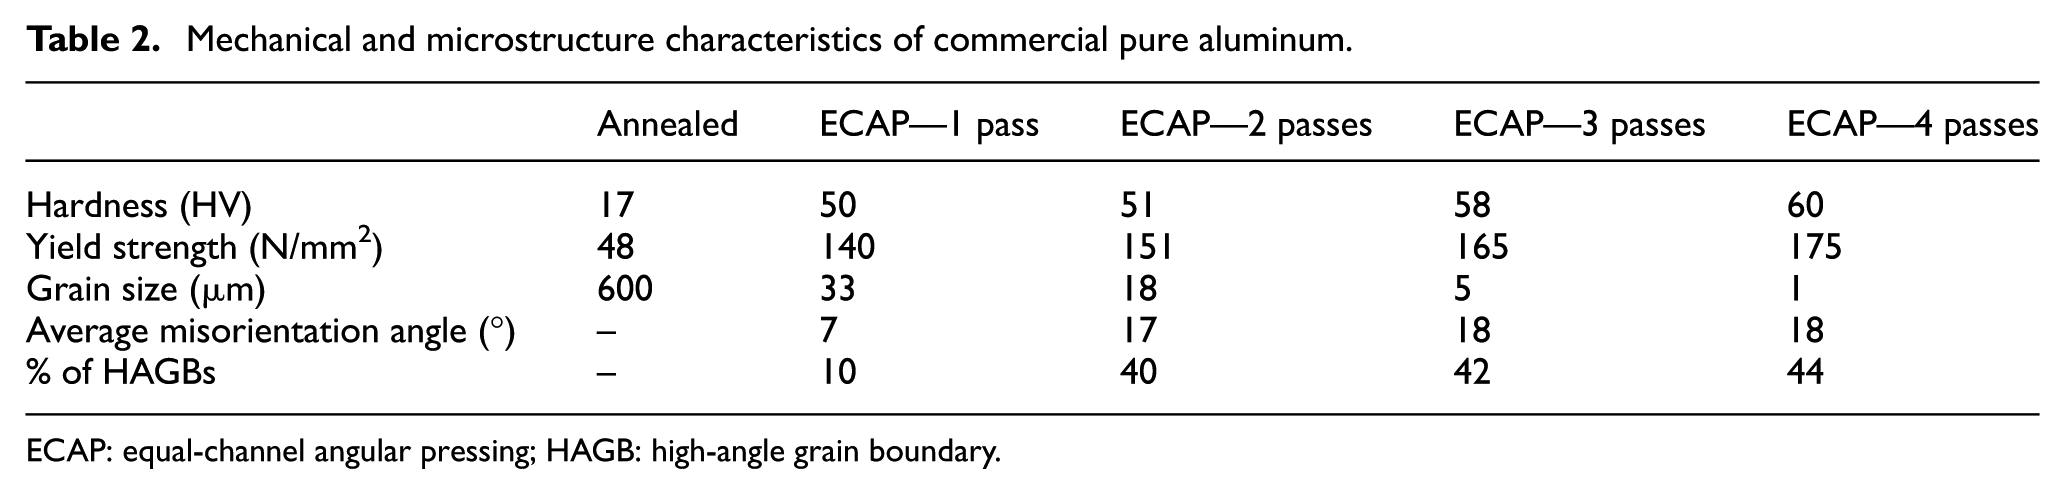
ECAP: equal-channel angular pressing; HAGB: high-angle grain boundary.
Figure 5(a) represents the variation of Ra with number of ECAP passes for a cutting speed of 200 m/min, depth of cut of 0.225 mm and feed rate of 0.1 mm/rev. These cutting conditions were selected because there were four replicates for each number of ECAP pass, and thus, the average value presented in Figure 5 would be more representative to give accurate indication of the trend. It is obvious that the Ra is reduced markedly with number of ECAP passes. Figure 5(b) presents the variation of Ra with feed rate for the annealed sample and ECAP-processed sample to four passes for the cutting conditions of 200 m/min and 0.225 mm. Figure 5 captures, again, the lower Ra values for the ECAP-processed sample and the significant effect of feed rate in either reducing or increasing the Ra values tremendously.
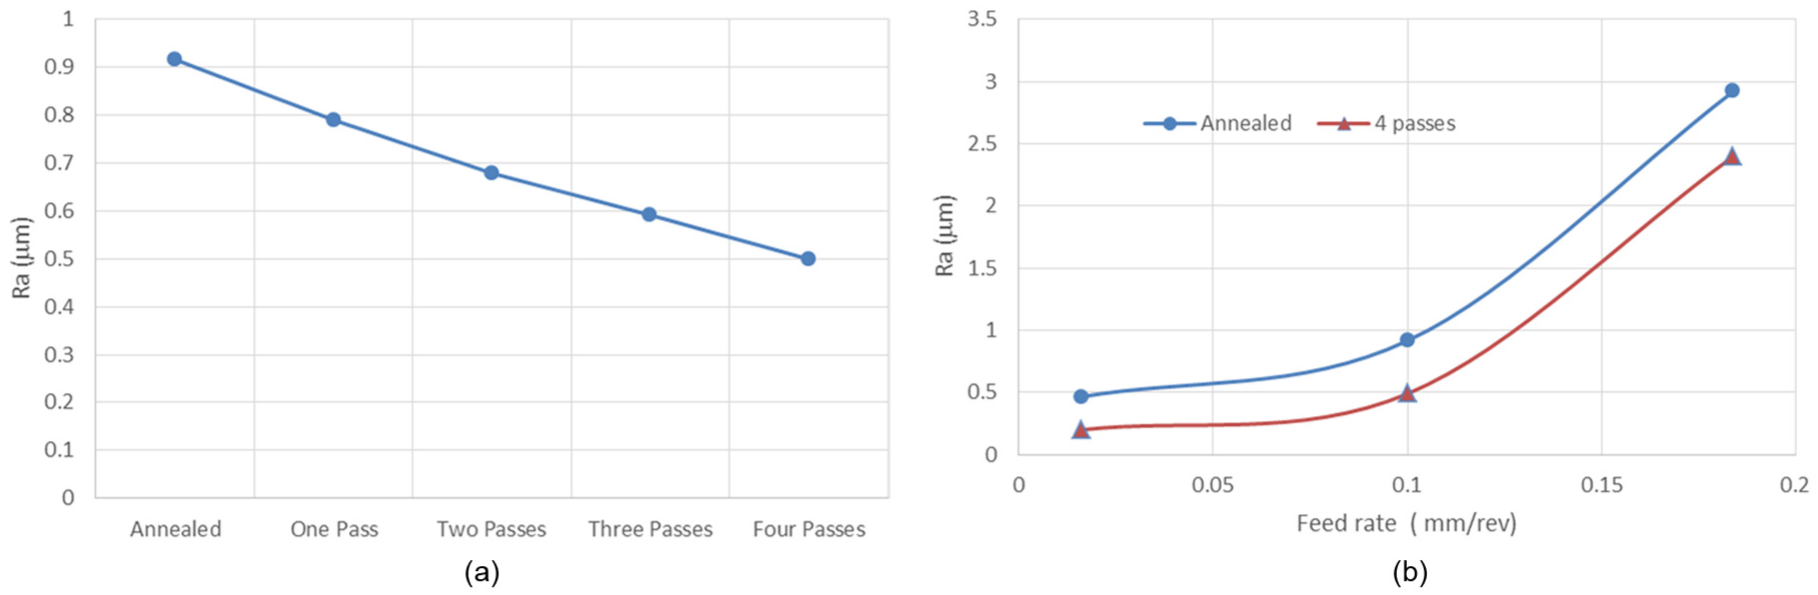
(a) Variation of Ra with number of ECAP passes for the cutting conditions of 200 m/min, 0.225 mm and 0.1 mm/rev and (b) variation of Ra with feed rate for annealed and ECAP-processed sample to four passes, for cutting conditions of 200 m/min and 0.225 mm.
Stepwise technique was used to reduce the model into significant terms only. Stepwise is an automated technique that adds terms to the model one by one. The added term is kept in the model if it has a significant effect (p value < 0.05); otherwise, it is removed. The process is repeated until the model includes only all of the significant terms.
The model was then refined through removing readings with very large standardized residuals (SRs) from the data.25–27 SR equals to the value of a residual divided by an estimate of its standard deviation. Six readings with |SR| > 2.75 were removed from the analysis and the model was subsequently refitted.
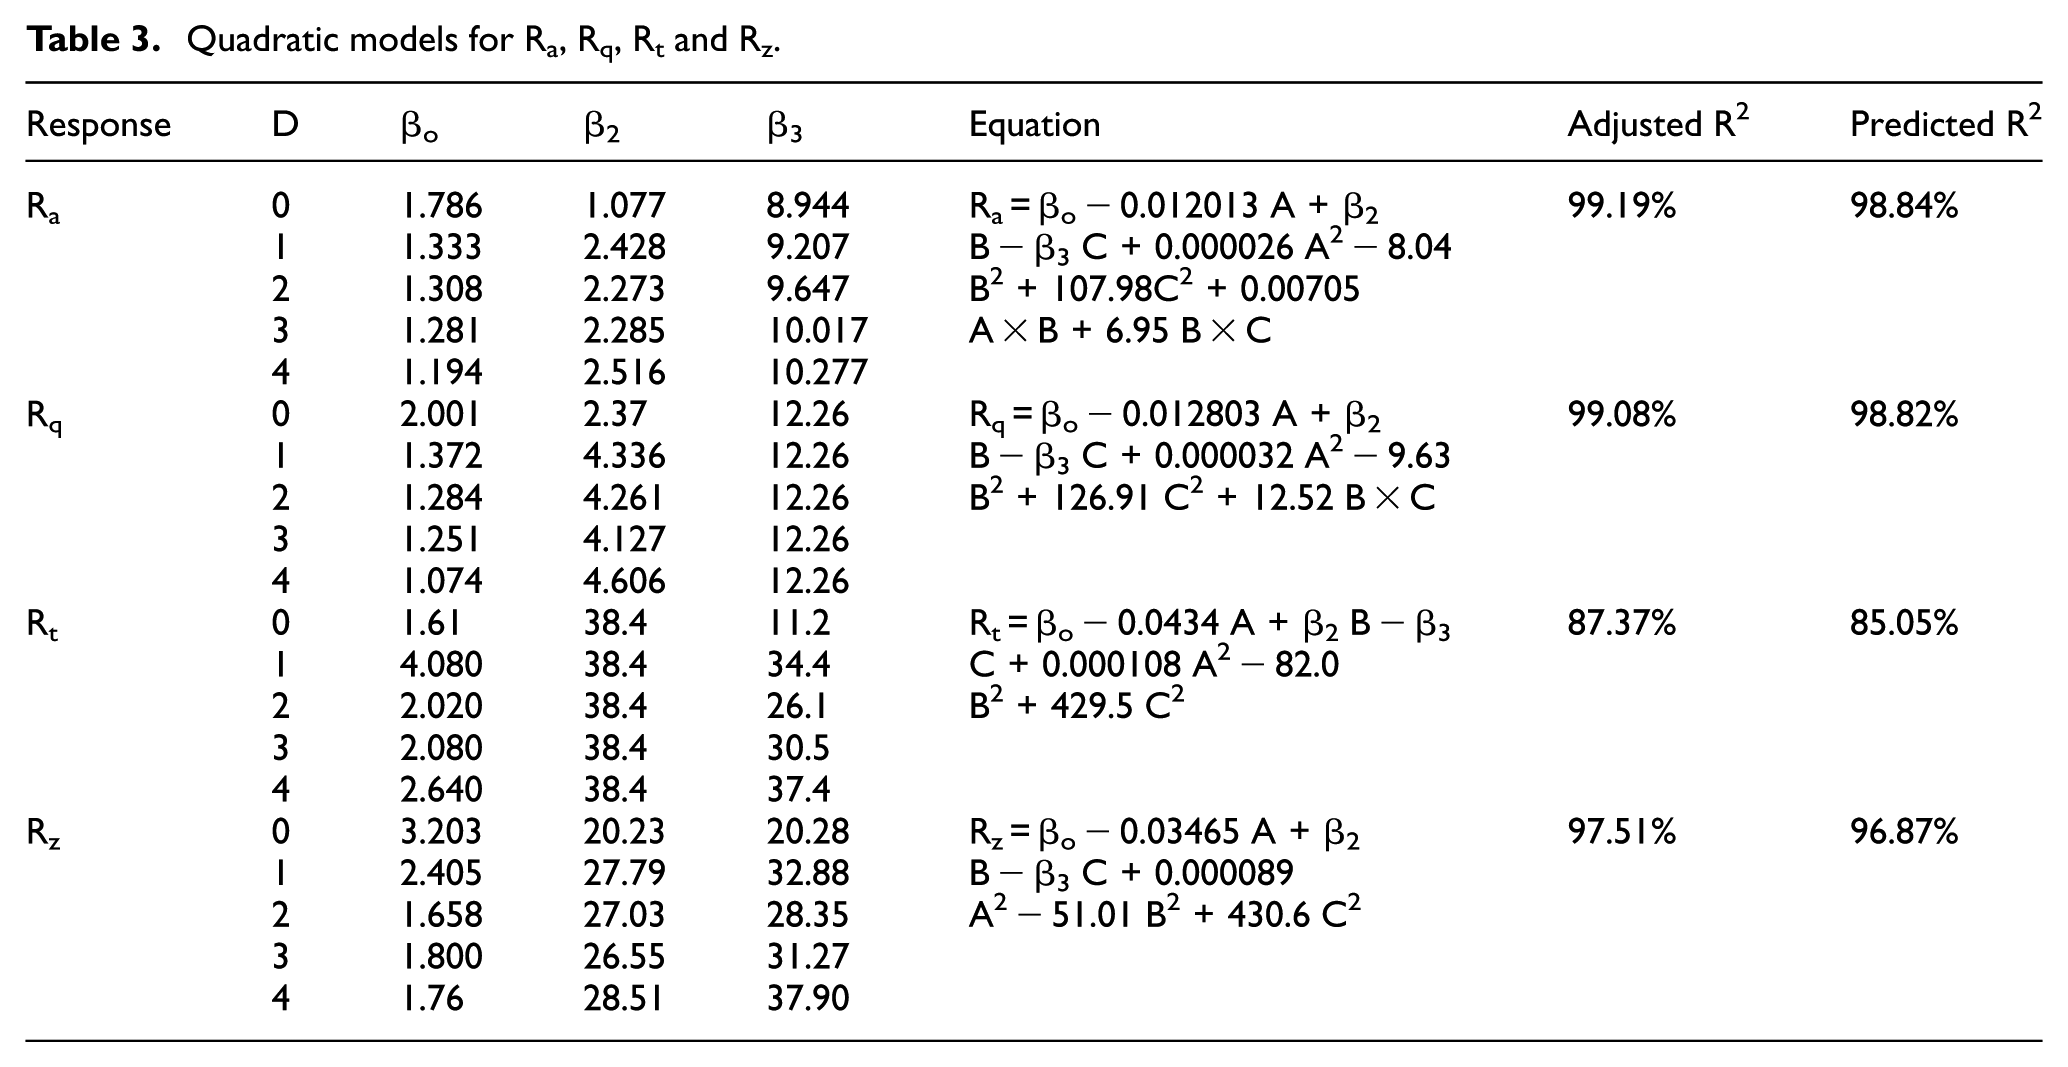
Table 3 illustrates the quadratic models developed for Ra, Rq, Rt and Rz. Only significant terms are included in the equation. The values of adjusted and predicted R2 are also given. The number of passes (factor D) and its significant interactions are not included in the equation since it is treated as a categorical factor as mentioned before. The adequacy of the quadratic models, measured by the coefficient of determination (adjusted R2), are higher than 97% (except for Rt where adjusted R2 = 87%) showing that above 97% of the variability in Ra, Rq and Rz readings are explained by the fitted models. The predicted R2 is very close to the adjusted R2, proving that the models are not over-fitted and have good predictability. Figure 6 shows a scatter plot for the predicted responses versus the measured responses. It is clear from Figure 6 that the relation between them is almost linear.
Quadratic models for Ra, Rq, Rt and Rz.
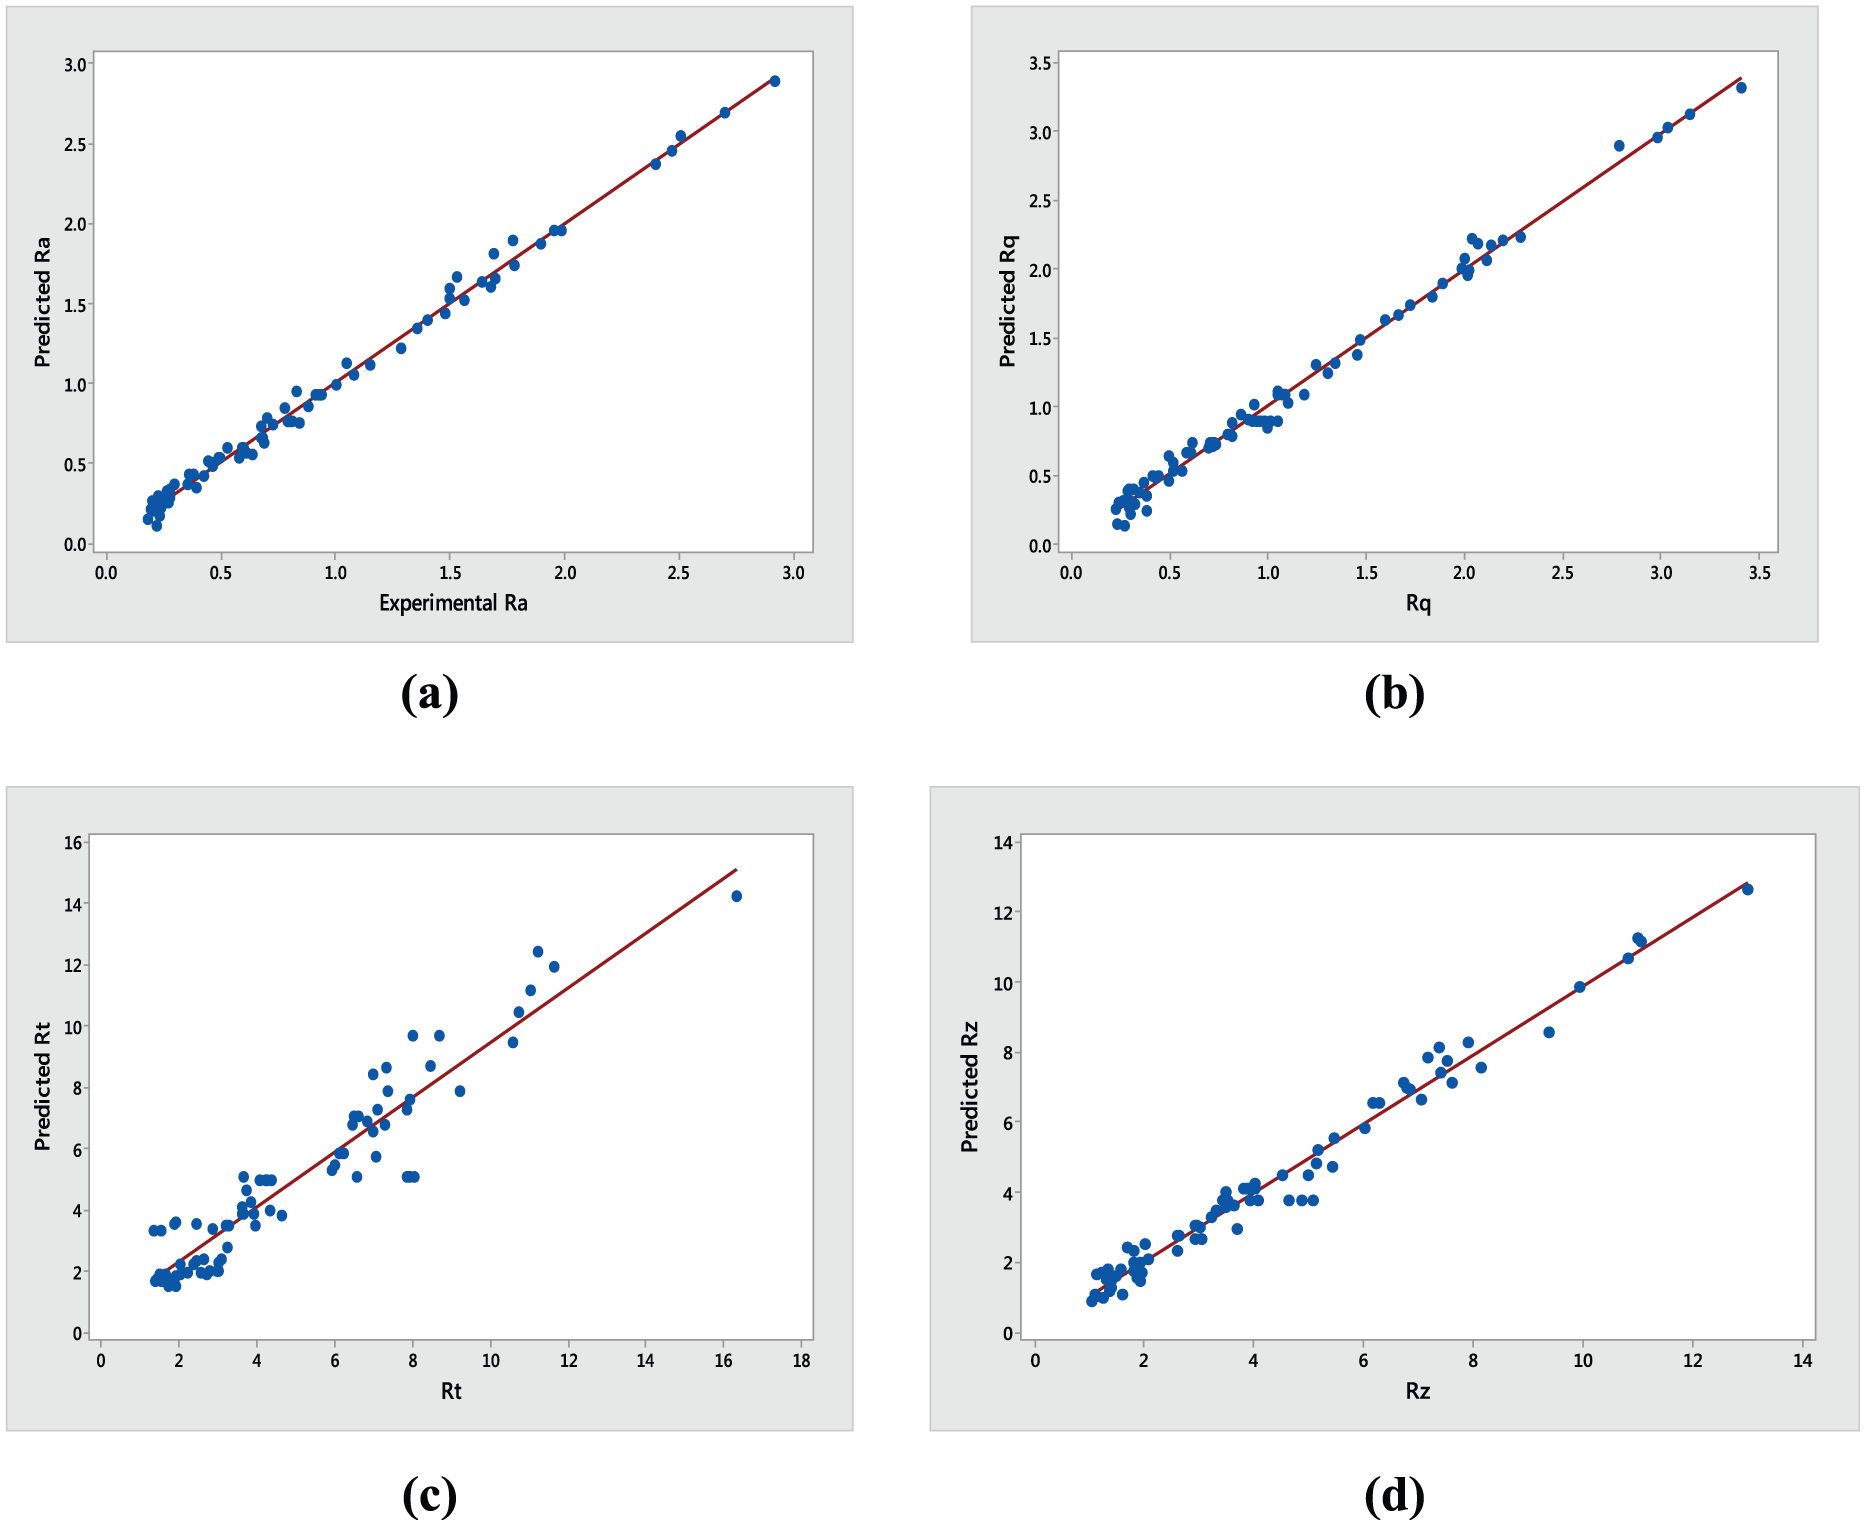
Comparison of surface roughness parameters between predicted and actual values for (a) Ra, (b) Rq, (c) Rt and (d) Rz.
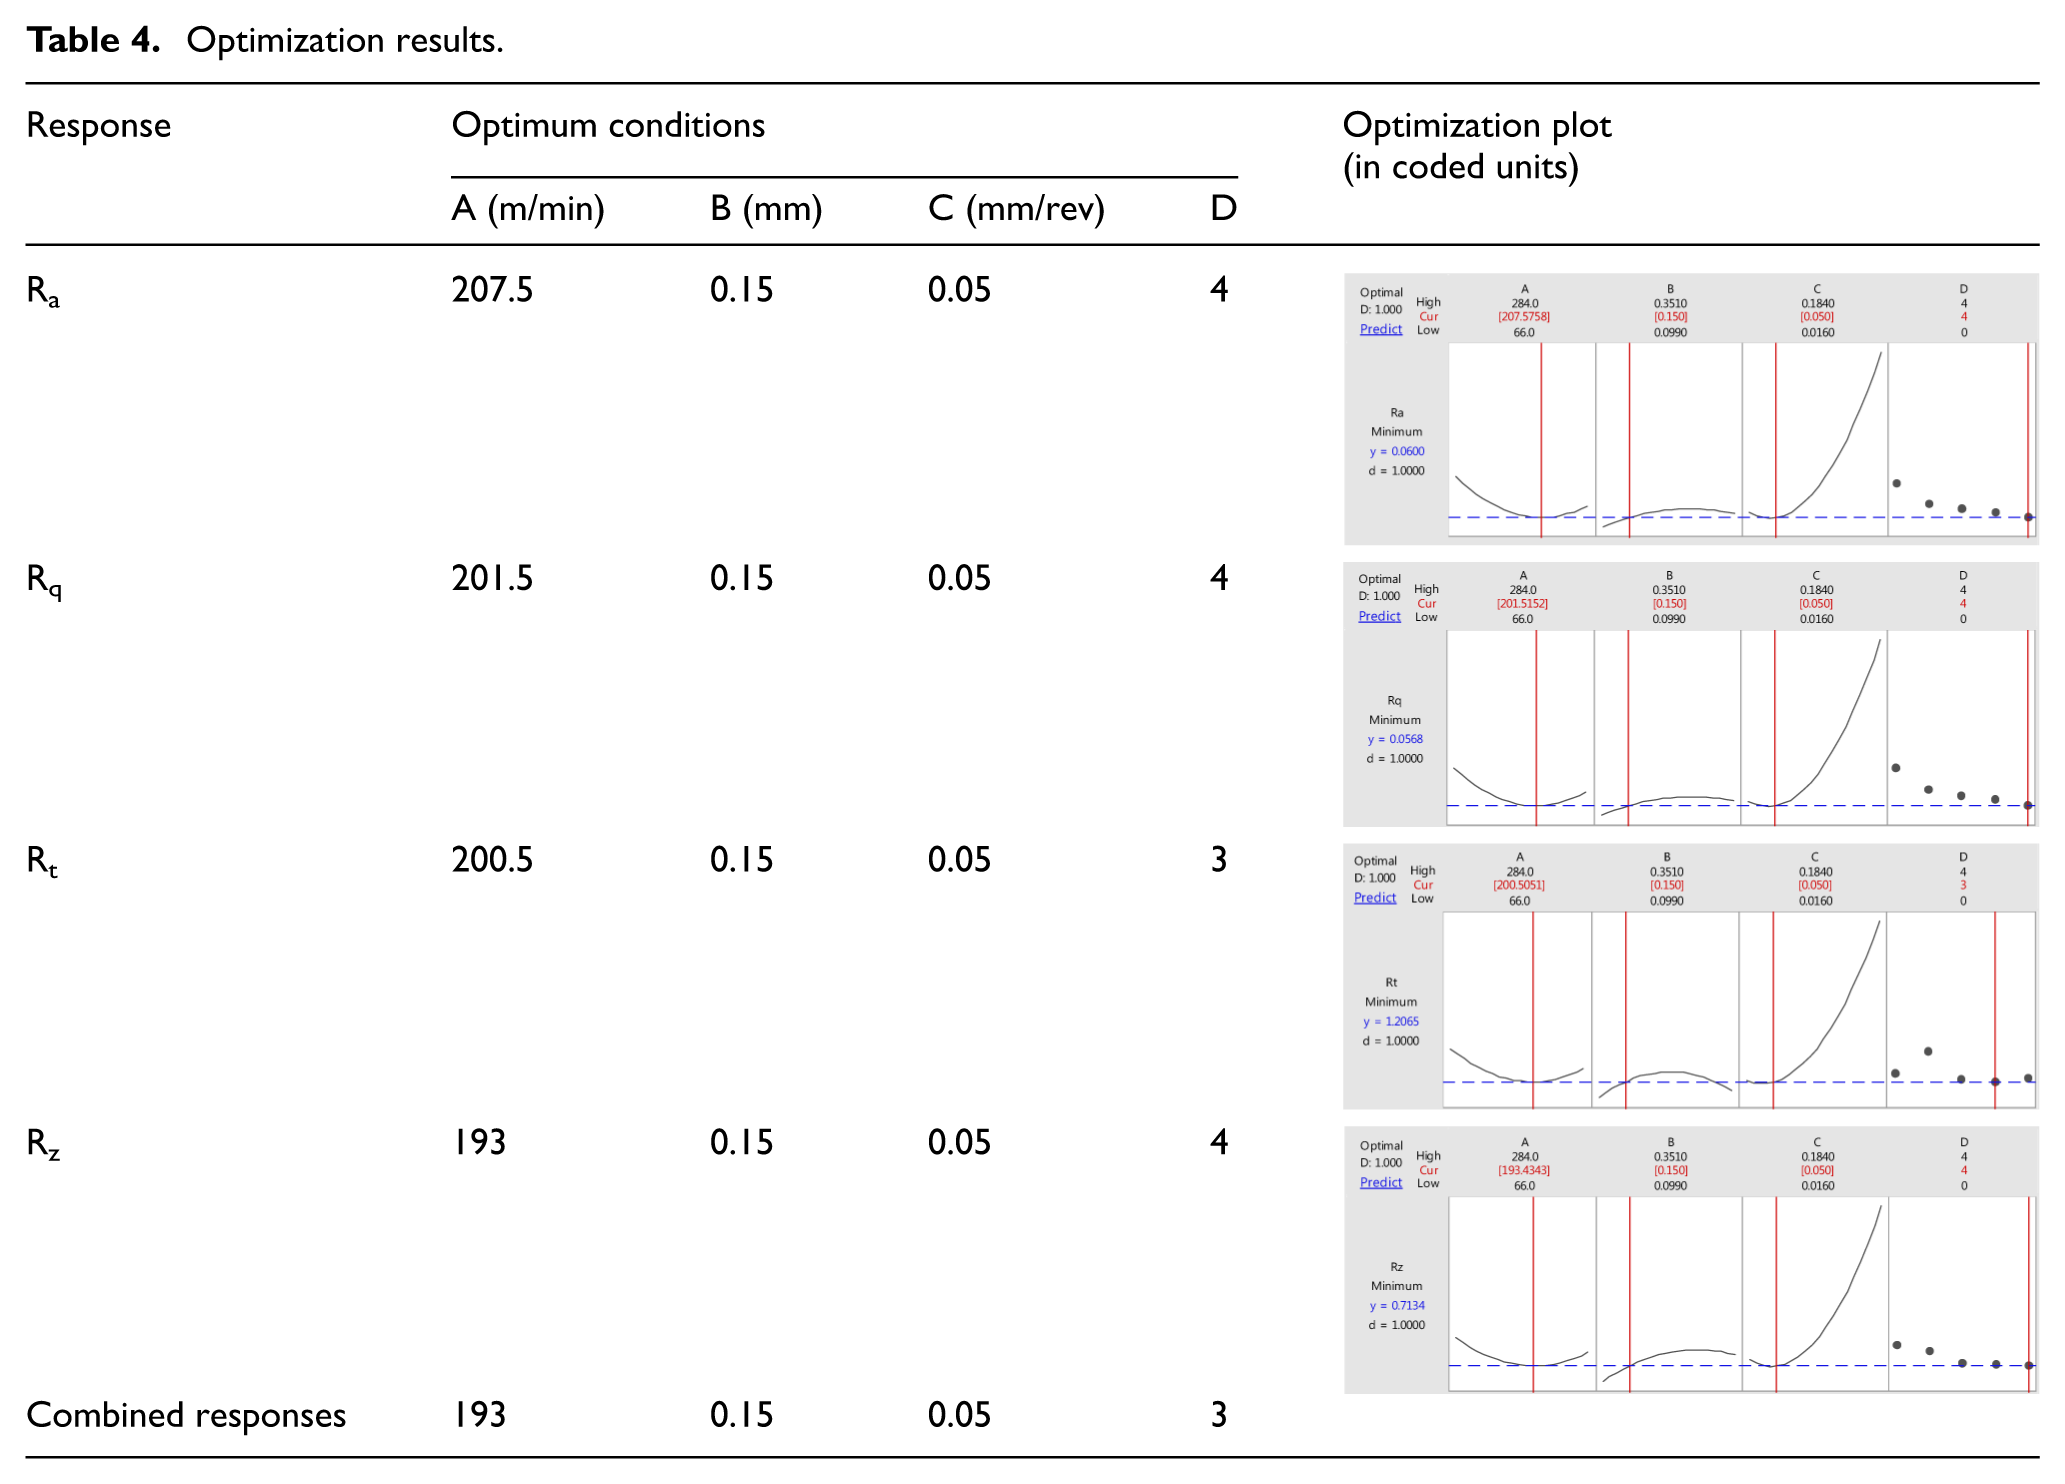
Table 4 summarizes the optimum operating conditions for Ra, Rq, Rt and Rz. The optimization process was run over the original range of factors’ levels given in Table 1. The results show that optimum (minimum) surface roughness parameters (Ra, Rq, Rt and Rz) happen at minimum depth of cut (0.15 mm) and minimum feed rate (0.05 mm/rev) with slightly different cutting speeds ranging between 193 m/min for Rz and 207.5 m/min for Ra. Optimum values for Ra (0.06 µm), Rq (0.057 µm) and Rz (0.71 µm) happen at the four ECAP passes–processed material, while the optimum value of Rt (1.2 µm) happens at the three ECAP passes–processed material.
Optimization results.
The ECAP process resulted in refining the grain size from about 600 µm in the annealed structure to about 1 µm for the sample ECAP processed to four passes. Besides, the average misorientation angle evolved to about 18° for the same sample as seen from the results presented in Table 1. This is accompanied by an increase in hardness from 17 to 60 and an increase in the yield strength from 48 to 175 MPa, with ECAP processing. The higher hardness results in improved surface roughness; this is due to the harder material possessing low plastic flow capability which results in better surface finish. 6 This is attributed to the brittle nature of the interaction between the cutting tool and the workpiece surface, for the hard materials, that leads to material separation rather than plastic flow that would result in surface irregularities. Surface roughness was found to increase with increasing feed rate and depth of cut which both result in bigger cut areas that are consequently associated with higher cutting forces and higher friction. This, again, results in a poor surface finish. It was noted from the surface roughness profile that high feed rates were associated with lager roughness marking horizontal spacing. Also, with higher depth of cuts, the vertical spacing between peaks and troughs of the surface irregularities was larger. Thus, higher feed rates and depth of cuts led to higher surface roughness.
ANOVA is used to specify the significance of each term (linear, quadratic or interaction) in the model. A standard confidence level of 95% was used to judge the significance. Terms with p value < 0.05 are significant. Table 5 illustrates the ANOVA results for Ra. The results in Table 5 show that all linear terms and quadratic terms have a significant effect on the variation of the data. Also four two-way interactions have significant effect and these are as follows: speed/depth of cut, depth of cut/feed rate, depth of cut/number of ECAP passes and feed rate/number of ECAP passes. Other two-way interactions and all three-way interactions are not significant.
ANOVA results for Ra.
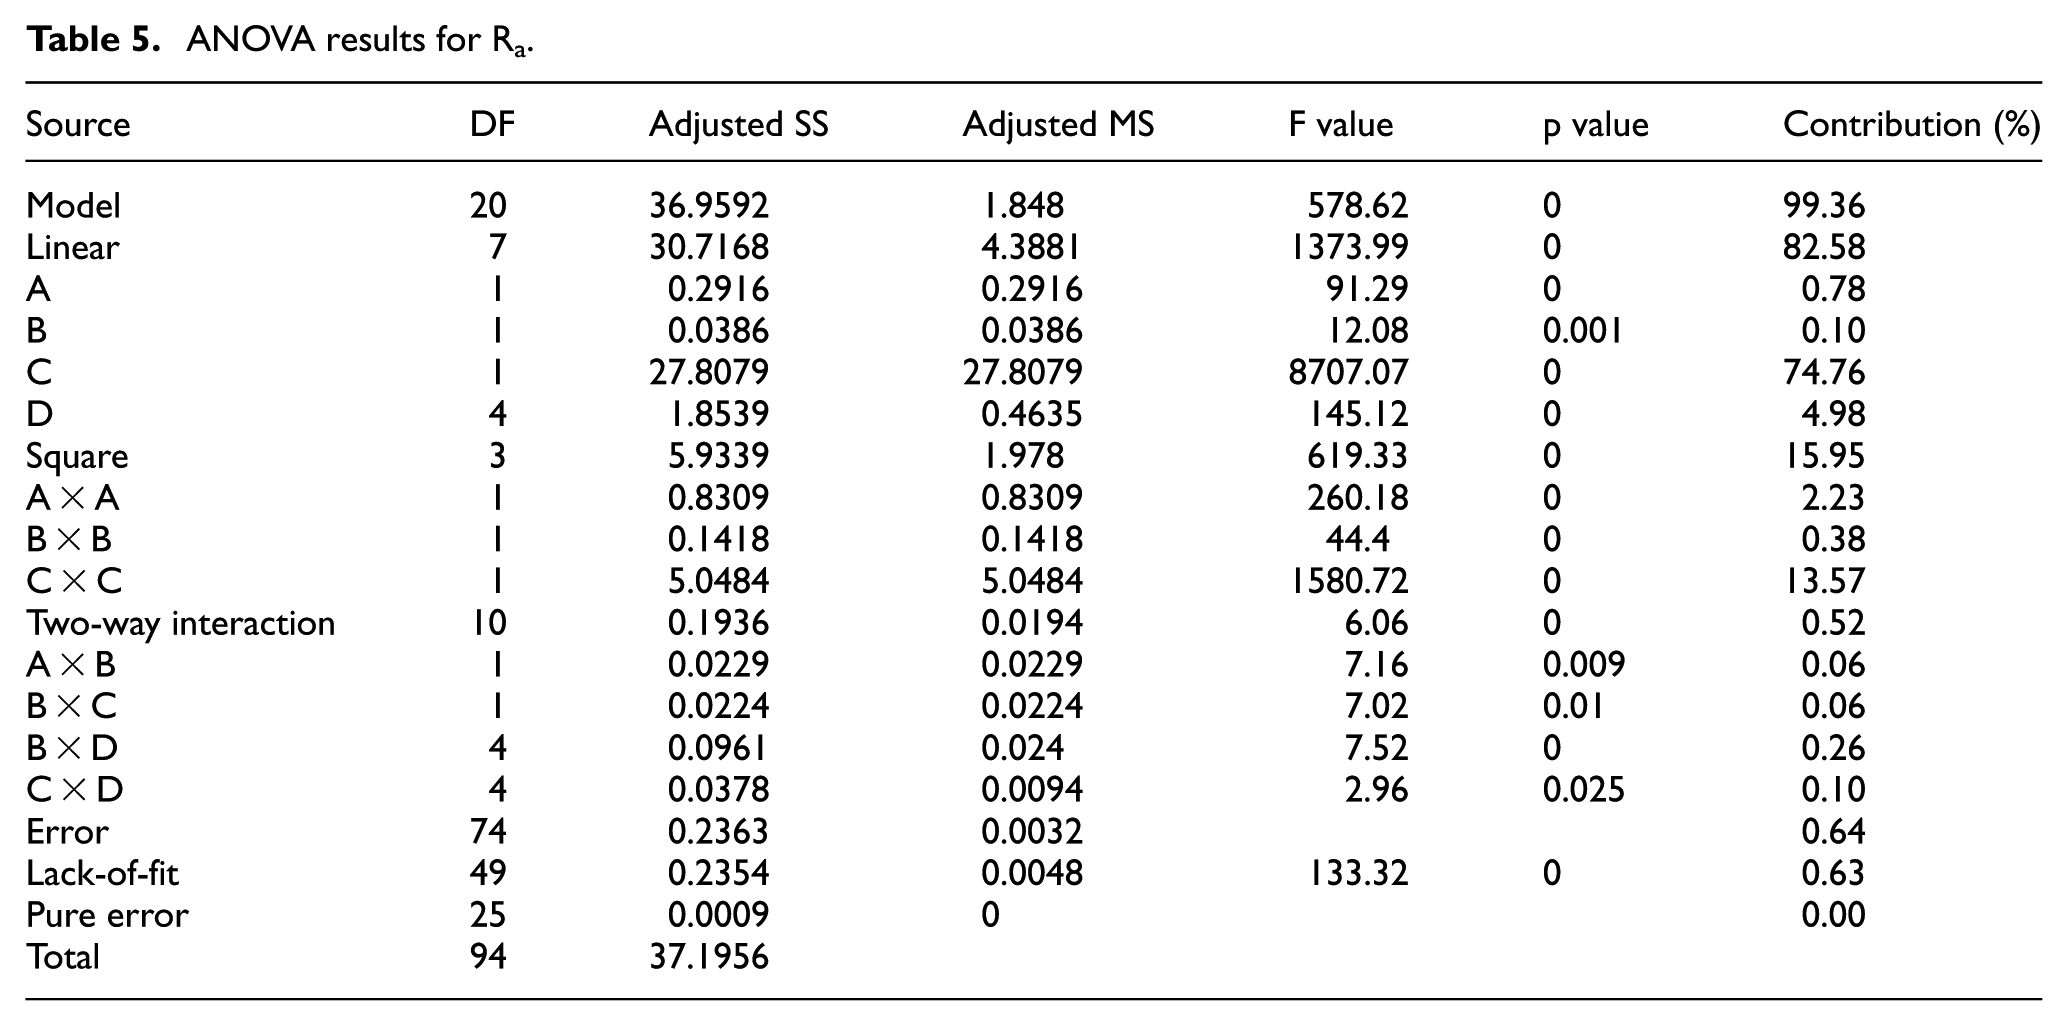
Investigating the relative weight of each term—represented roughly by the contribution column in Table 5, it is clear that the feed rate (C) has a dominant role on the surface roughness with contribution of about 89% through its linear and quadratic terms followed by the number of ECAP passes (about 5%). The contribution of other terms is very small and could be neglected. This is in agreement with the work of Yashar et al., 28 in which they reported that a significant improvement in surface roughness was achieved in 6061 aluminum alloy by ECAP processing. Similar observation was made by Morehead et al. 10 for ECAP-processed commercially pure titanium. The significant effect of feed rate is also in agreement with other published work. 8
Figure 7 shows the residual plots for Ra. The plots indicate the randomness of the residual with respect to both fitted value and run order. The assumption of normality of the residuals is also valid as the points are very close to the line in the normal probability plot. As a mean of statistical proof of the residual normality, Anderson–Darling test was run with a p value of 0.131. The null hypothesis of such a test is that the data are normal and a p value < 0.05 proves non-normality.
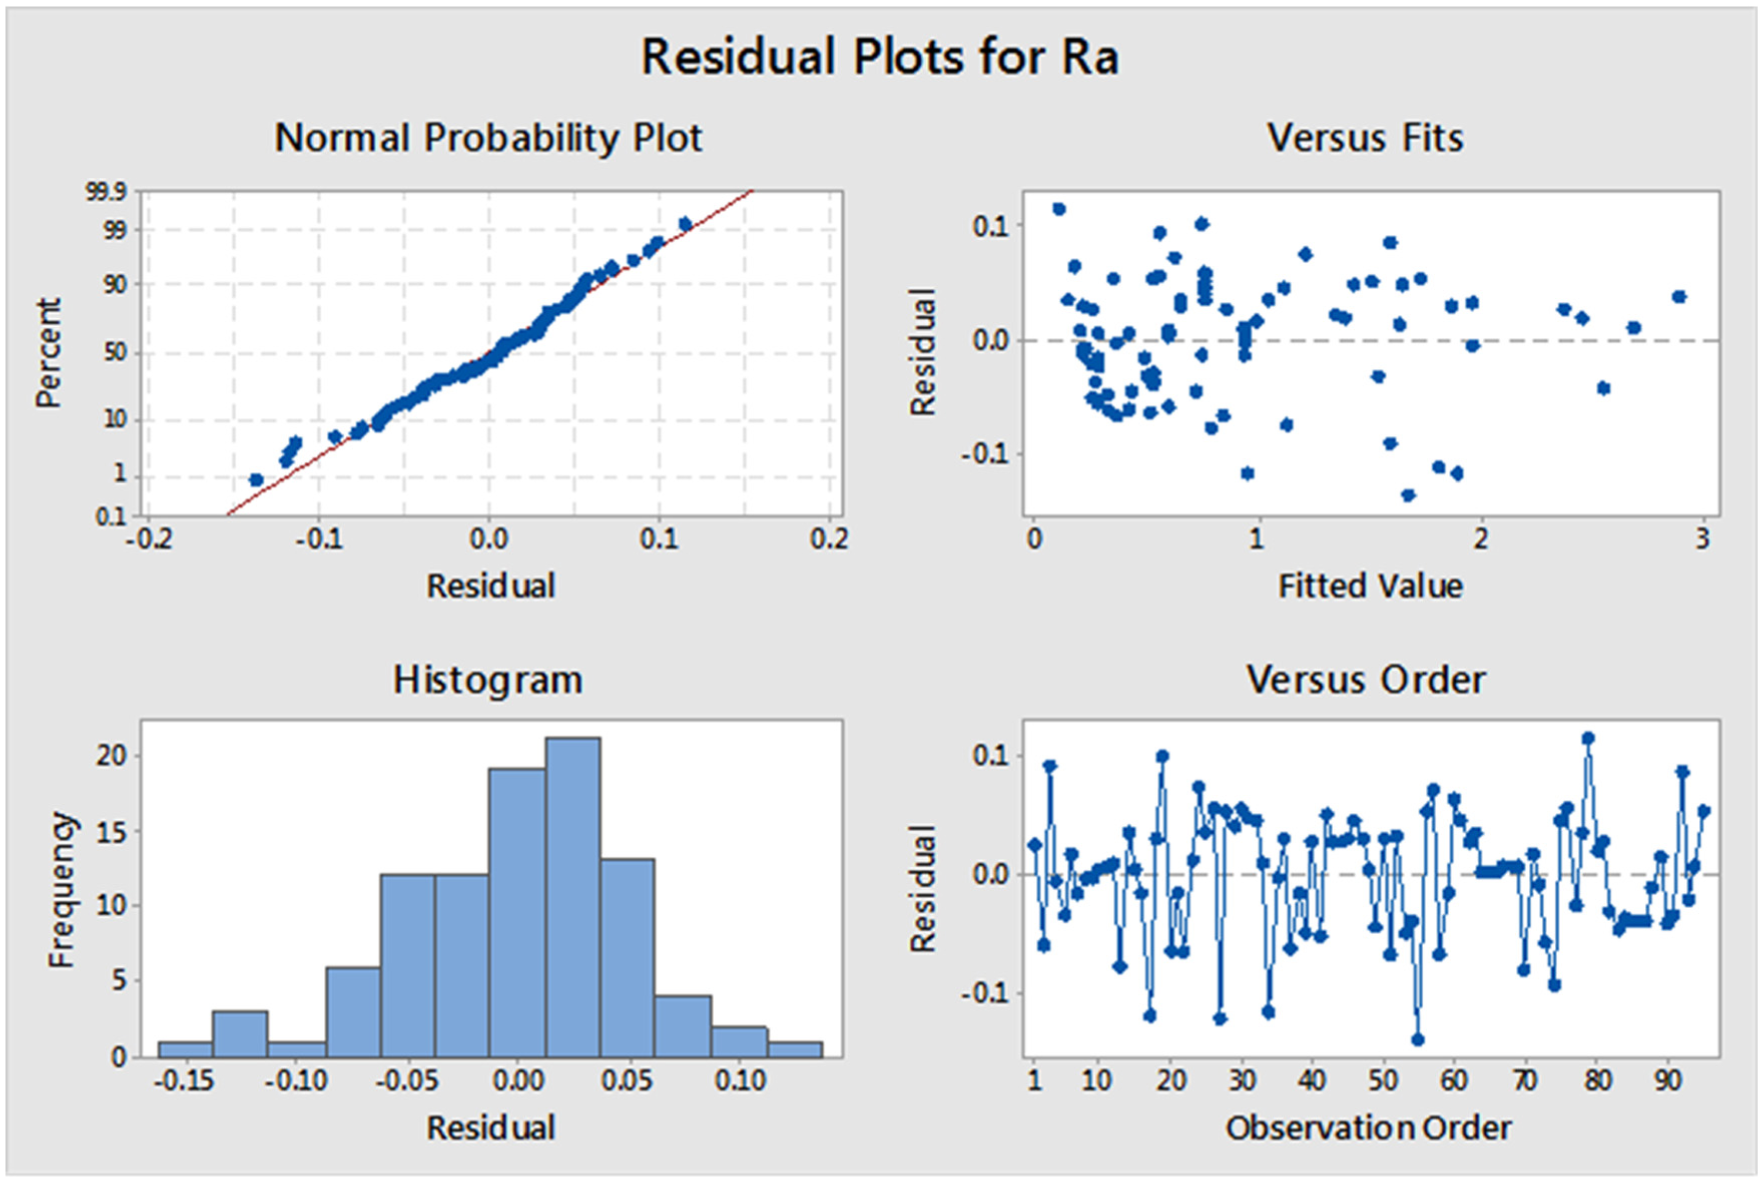
Ra residual plots.
The surface graphs of Ra versus two of the studied processing parameters while fixing the third parameter at its mean value for the annealed alloy are plotted in Figure 8. Figure 9 shows the same output as Figure 8 for the alloy after four ECAP passes. Figures 8 and 9 show the curvature nature of the relationship between Ra and the studied factors as a result of significant interaction and quadratic terms.
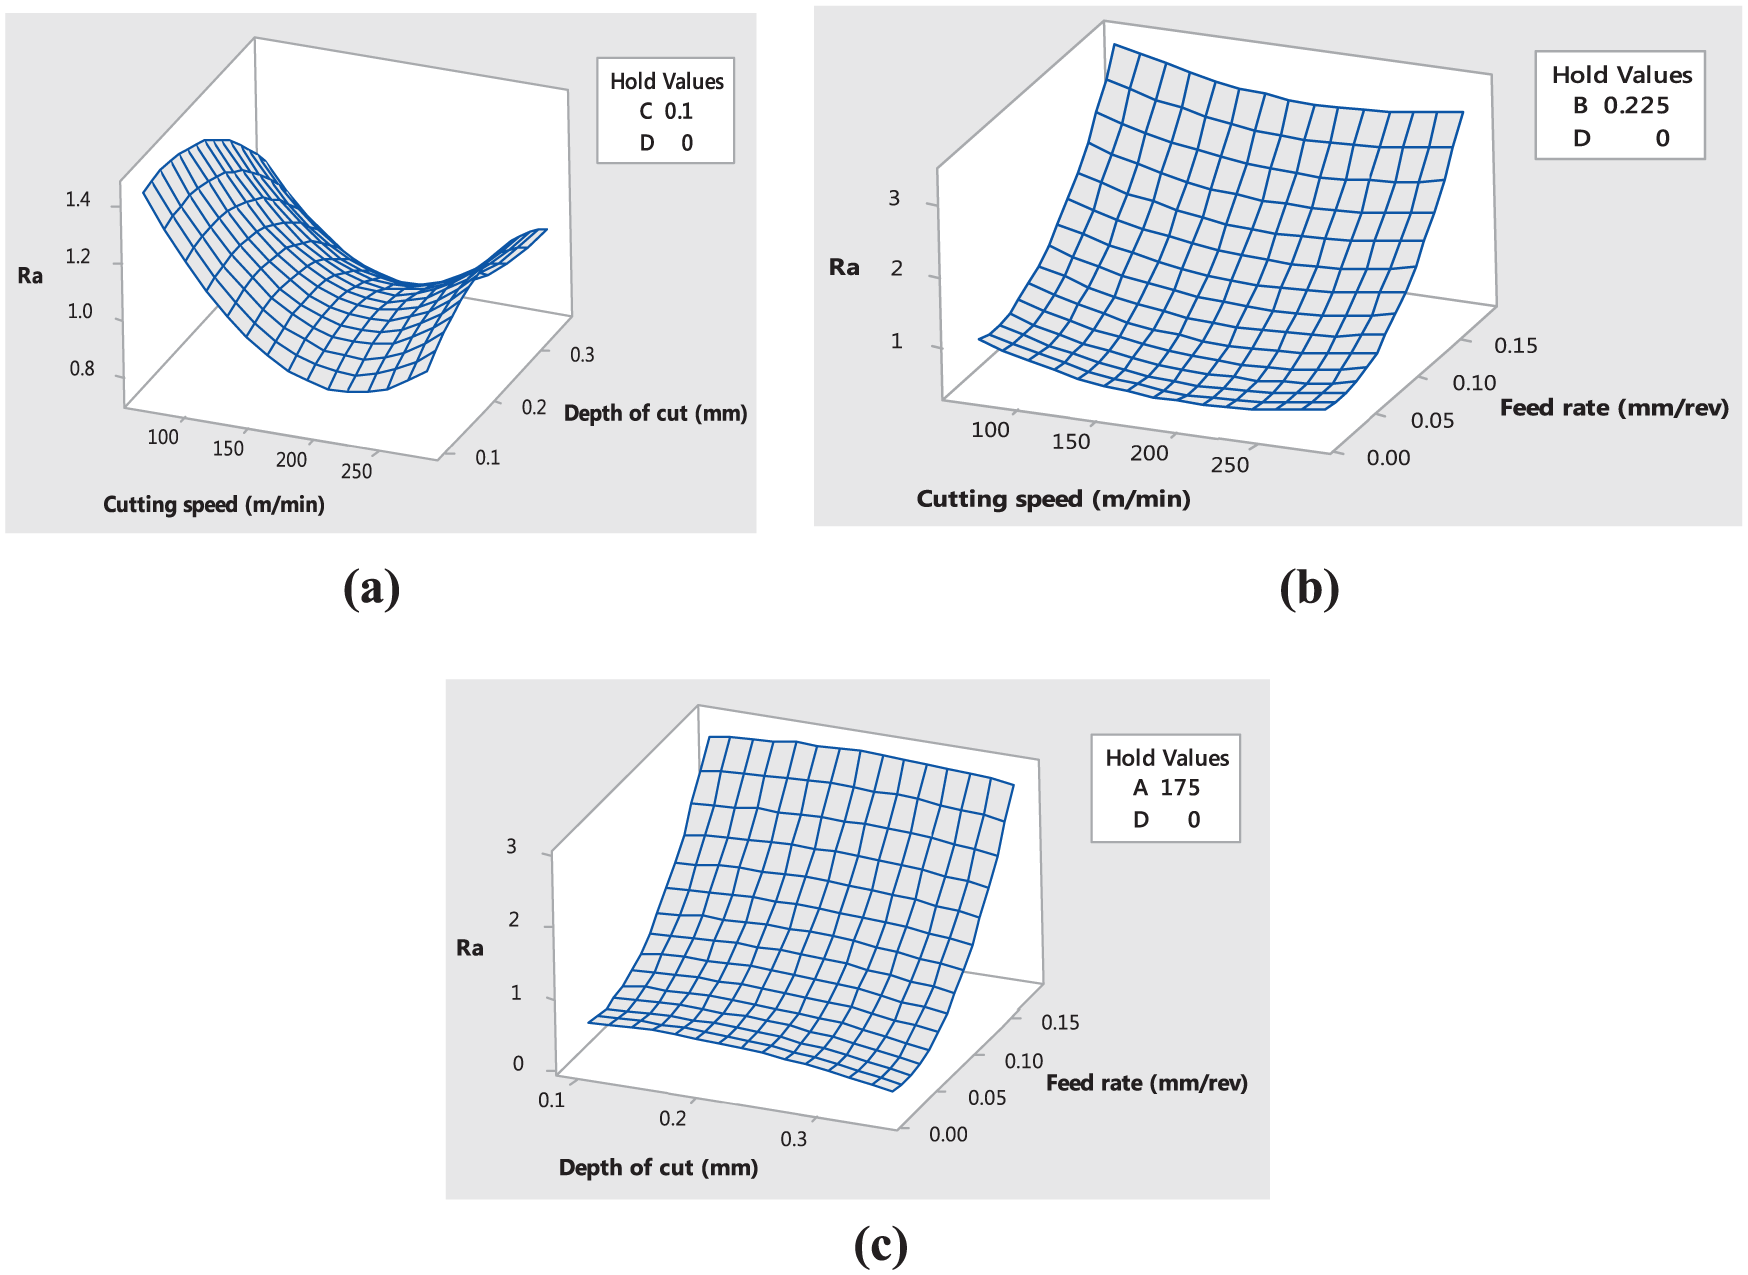
Surface graphs, at raw material: (a) Ra versus cutting speed and depth of cut, (b) Ra versus cutting speed and feed rate and (c) Ra versus depth of cut and feed rate.
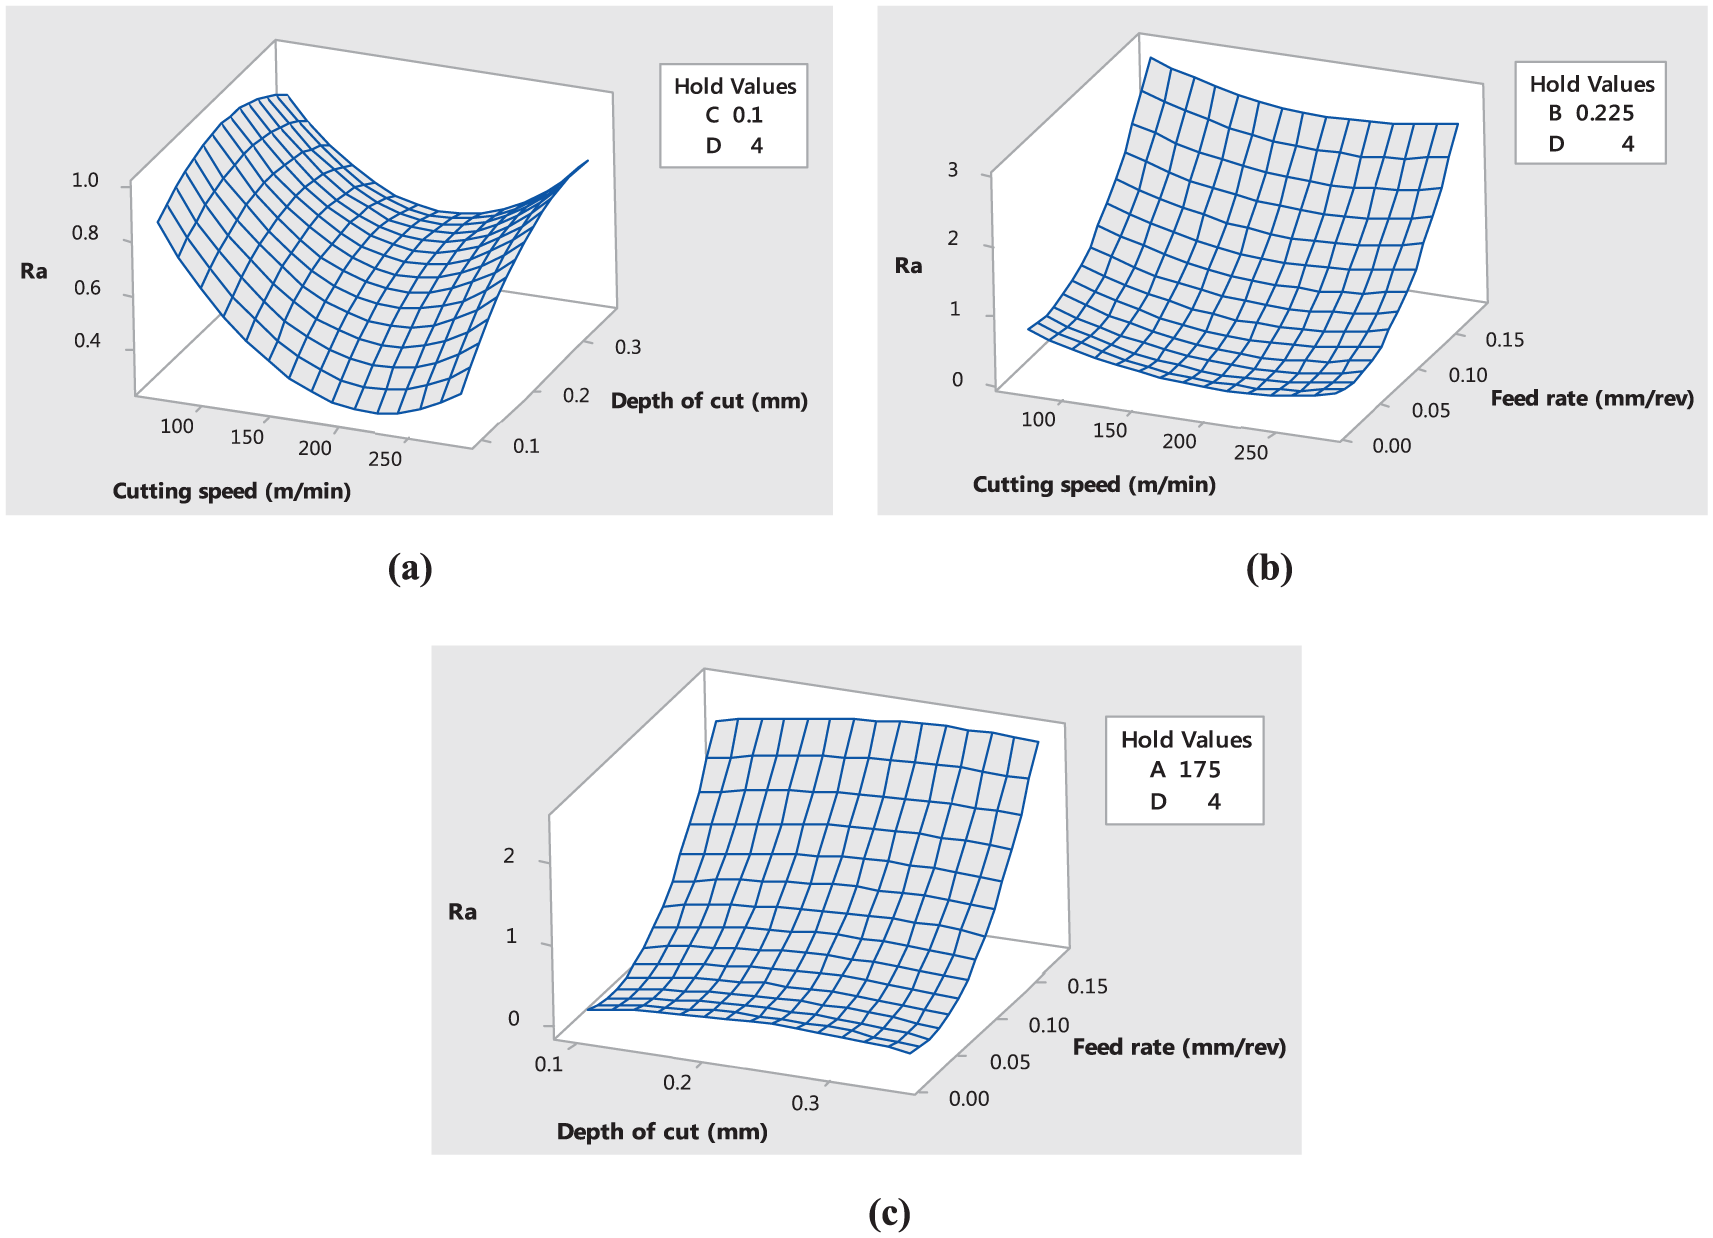
Surface graphs after four passes: (a) Ra versus cutting speed and depth of cut, (b) Ra versus cutting speed and feed rate and (c) Ra versus depth of cut and feed rate.
Conclusion
Commercial purity aluminum was severely deformed by ECAP up to four passes. The achieved mechanical properties and microstructure characteristics are summarized. The surface roughness for five starting material conditions (annealed and ECAP processed to 1, 2, 3 and 4 passes) are investigated. Quadratic models that relate the four surface roughness values to the three cutting parameters (cutting speed, feed rate and depth of cut) were developed, while the fourth parameter (number of ECAP passes) was considered as categorical factor. The results showed that optimum (minimum) surface roughness parameters (Ra, Rq, Rt and Rz) happened at minimum depth of cut (0.15 mm) and minimum feed rate (0.05 mm/rev) with slightly different cutting speeds that ranged between 193 m/min for Rz and 207.5 m/min for Ra. Optimum values for Ra (0.06 µm), Rq (0.057 µm) and Rz (0.71 µm) happened at the four ECAP passes–processed material, while the optimum value of Rt (1.2 µm) happened at the three ECAP passes–processed material. The surface quality of the ECAP-processed material was found to be much superior compared to its annealed counterpart, for the same cutting conditions.
Footnotes
Appendix
CCD response surface design and measured output values
| Run order | ECAP | Cutting speed (m/min) | Depth of cut (mm) | Feed rate (mm/rev) | Ra &x40;µm) | Rq (µm) | Rt &x40;µm) | Rz &x40;µm) |
|---|---|---|---|---|---|---|---|---|
| 1 | 0 | 200 | 0.099 | 0.1 | 0.883 | 1.108 | 3.948 | 3.609 |
| 2 | 0 | 150 | 0.15 | 0.05 | 0.531 | 0.617 | 2.753 | 1.902 |
| 3 | 0 | 250 | 0.15 | 0.05 | 0.641 | 0.738 | 2.965 | 2.053 |
| 4 | 0 | 150 | 0.15 | 0.15 | 1.954 | 2.287 | 10.590 | 9.364 |
| 5 | 0 | 250 | 0.15 | 0.15 | 2.657 | 2.622 | 10.876 | 9.868 |
| 6 | 0 | 200 | 0.225 | 0.016 | 0.466 | 0.496 | 1.856 | 1.463 |
| 7 | 0 | 66 | 0.225 | 0.10 | 1.407 | 1.668 | 6.831 | 5.448 |
| 8 | 0 | 200 | 0.225 | 0.10 | 0.916 | 1.049 | 4.040 | 3.799 |
| 9 | 0 | 200 | 0.225 | 0.10 | 0.928 | 1.074 | 4.198 | 3.853 |
| 10 | 0 | 200 | 0.225 | 0.10 | 0.929 | 1.078 | 4.200 | 3.864 |
| 11 | 0 | 200 | 0.225 | 0.10 | 0.935 | 1.083 | 4.250 | 3.885 |
| 12 | 0 | 200 | 0.225 | 0.10 | 0.938 | 1.086 | 4.255 | 3.892 |
| 13 | 0 | 200 | 0.225 | 0.10 | 0.940 | 1.190 | 4.368 | 3.998 |
| 14 | 0 | 284 | 0.225 | 0.10 | 1.050 | 1.247 | 7.064 | 5.123 |
| 15 | 0 | 200 | 0.225 | 0.184 | 2.923 | 3.407 | 16.349 | 13.008 |
| 16 | 0 | 150 | 0.300 | 0.05 | 0.425 | 0.523 | 2.003 | 1.865 |
| 17 | 0 | 250 | 0.300 | 0.05 | 0.468 | 0.562 | 2.362 | 1.948 |
| 18 | 0 | 150 | 0.300 | 0.15 | 1.776 | 2.038 | 7.986 | 7.383 |
| 19 | 0 | 250 | 0.300 | 0.15 | 1.988 | 2.198 | 8.689 | 7.885 |
| 20 | 0 | 200 | 0.351 | 0.10 | 0.847 | 1.000 | 3.918 | 3.675 |
| 21 | 1 | 200 | 0.099 | 0.10 | 0.449 | 0.523 | 1.907 | 1.801 |
| 22 | 1 | 250 | 0.150 | 0.05 | 0.270 | 0.316 | 1.521 | 1.331 |
| 23 | 1 | 150 | 0.150 | 0.05 | 0.264 | 0.298 | 1.323 | 1.194 |
| 24 | 1 | 250 | 0.150 | 0.15 | 1.642 | 1.890 | 6.977 | 6.713 |
| 25 | 1 | 150 | 0.150 | 0.15 | 0.498 | 0.614 | 2.956 | 2.308 |
| 26 | 1 | 66 | 0.225 | 0.10 | 1.287 | 1.468 | 6.600 | 5.149 |
| 27 | 1 | 200 | 0.225 | 0.10 | 0.791 | 0.926 | 3.652 | 3.415 |
| 28 | 1 | 200 | 0.225 | 0.10 | 0.812 | 1.012 | 7.870 | 4.868 |
| 29 | 1 | 284 | 0.225 | 0.10 | 0.832 | 1.049 | 6.112 | 4.974 |
| 30 | 1 | 200 | 0.225 | 0.016 | 0.398 | 0.496 | 4.634 | 2.583 |
| 31 | 1 | 200 | 0.225 | 0.10 | 0.796 | 0.946 | 6.541 | 3.924 |
| 32 | 1 | 200 | 0.225 | 0.10 | 0.813 | 1.05 | 8.052 | 5.073 |
| 33 | 1 | 200 | 0.225 | 0.10 | 0.805 | 0.96 | 7.831 | 4.631 |
| 34 | 1 | 200 | 0.225 | 0.10 | 0.801 | 0.988 | 7.925 | 4.053 |
| 35 | 1 | 200 | 0.225 | 0.184 | 2.699 | 3.151 | 11.235 | 11.010 |
| 36 | 1 | 150 | 0.300 | 0.15 | 1.693 | 2.071 | 8.434 | 7.517 |
| 37 | 1 | 150 | 0.300 | 0.05 | 0.356 | 0.416 | 1.861 | 1.686 |
| 38 | 1 | 250 | 0.300 | 0.15 | 1.900 | 2.139 | 7.322 | 7.158 |
| 39 | 1 | 250 | 0.300 | 0.05 | 0.362 | 0.429 | 2.409 | 2.005 |
| 40 | 1 | 200 | 0.351 | 0.10 | 0.729 | 0.899 | 4.307 | 3.481 |
| 41 | 2 | 200 | 0.099 | 0.10 | 0.381 | 0.442 | 2.628 | 1.798 |
| 42 | 2 | 250 | 0.150 | 0.05 | 0.243 | 0.300 | 1.532 | 1.361 |
| 43 | 2 | 150 | 0.150 | 0.05 | 0.205 | 0.243 | 1.380 | 1.091 |
| 44 | 2 | 150 | 0.150 | 0.15 | 0.345 | 0.534 | 2.732 | 2.110 |
| 45 | 2 | 250 | 0.150 | 0.15 | 1.564 | 1.841 | 7.928 | 6.827 |
| 46 | 2 | 200 | 0.225 | 0.10 | 0.679 | 0.7950 | 3.600 | 3.201 |
| 47 | 2 | 200 | 0.225 | 0.10 | 0.680 | 0.799 | 3.632 | 3.206 |
| 48 | 2 | 200 | 0.225 | 0.10 | 0.681 | 0.800 | 3.634 | 3.206 |
| 49 | 2 | 66 | 0.225 | 0.10 | 1.155 | 1.455 | 6.200 | 5.412 |
| 50 | 2 | 200 | 0.225 | 0.10 | 0.683 | 0.809 | 3.640 | 3.211 |
| 51 | 2 | 200 | 0.225 | 0.016 | 0.282 | 0.386 | 2.681 | 1.922 |
| 52 | 2 | 200 | 0.225 | 0.184 | 2.506 | 3.039 | 11.645 | 11.068 |
| 53 | 2 | 200 | 0.225 | 0.10 | 0.683 | 0.809 | 3.643 | 3.212 |
| 54 | 2 | 284 | 0.225 | 0.10 | 0.780 | 0.934 | 3.714 | 3.462 |
| 55 | 2 | 200 | 0.225 | 0.10 | 0.685 | 0.812 | 3.652 | 3.214 |
| 56 | 2 | 250 | 0.300 | 0.05 | 0.280 | 0.349 | 2.013 | 1.563 |
| 57 | 2 | 150 | 0.300 | 0.05 | 0.226 | 0.291 | 1.464 | 1.119 |
| 58 | 2 | 150 | 0.300 | 0.15 | 1.531 | 2.000 | 7.352 | 7.401 |
| 59 | 2 | 250 | 0.300 | 0.15 | 1.786 | 2.115 | 9.217 | 8.145 |
| 60 | 2 | 200 | 0.351 | 0.10 | 0.691 | 0.821 | 3.233 | 3.008 |
| 61 | 3 | 200 | 0.099 | 0.10 | 0.299 | 0.369 | 2.991 | 1.794 |
| 62 | 3 | 150 | 0.15 | 0.05 | 0.198 | 0.230 | 1.725 | 1.222 |
| 63 | 3 | 250 | 0.15 | 0.05 | 0.235 | 0.385 | 1.885 | 1.588 |
| 64 | 3 | 150 | 0.15 | 0.15 | 0.222 | 0.271 | 1.688 | 1.486 |
| 65 | 3 | 250 | 0.15 | 0.15 | 1.480 | 1.725 | 6.492 | 6.160 |
| 66 | 3 | 200 | 0.225 | 0.016 | 0.275 | 0.325 | 1.630 | 1.383 |
| 67 | 3 | 66 | 0.225 | 0.10 | 1.083 | 1.342 | 6.000 | 4.518 |
| 68 | 3 | 200 | 0.225 | 0.10 | 0.592 | 0.708 | 3.188 | 2.918 |
| 69 | 3 | 200 | 0.225 | 0.10 | 0.592 | 0.712 | 3.201 | 2.925 |
| 70 | 3 | 200 | 0.225 | 0.10 | 0.594 | 0.722 | 3.211 | 2.931 |
| 71 | 3 | 200 | 0.225 | 0.10 | 0.597 | 0.725 | 3.235 | 2.945 |
| 72 | 3 | 200 | 0.225 | 0.10 | 0.598 | 0.726 | 3.246 | 2.948 |
| 73 | 3 | 200 | 0.225 | 0.10 | 0.598 | 0.728 | 3.265 | 2.949 |
| 74 | 3 | 284 | 0.225 | 0.10 | 0.706 | 0.863 | 3.842 | 3.516 |
| 75 | 3 | 200 | 0.225 | 0.184 | 2.473 | 2.982 | 11.044 | 10.818 |
| 76 | 3 | 150 | 0.300 | 0.05 | 0.215 | 0.264 | 1.403 | 1.300 |
| 77 | 3 | 250 | 0.300 | 0.05 | 0.231 | 0.284 | 1.443 | 1.308 |
| 78 | 3 | 150 | 0.300 | 0.15 | 1.498 | 1.988 | 7.076 | 6.780 |
| 79 | 3 | 250 | 0.300 | 0.15 | 1.700 | 2.028 | 7.857 | 7.607 |
| 80 | 3 | 200 | 0.351 | 0.10 | 0.616 | 0.722 | 3.084 | 3.047 |
| 81 | 4 | 200 | 0.099 | 0.10 | 0.251 | 0.304 | 1.904 | 1.390 |
| 82 | 4 | 150 | 0.150 | 0.05 | 0.183 | 0.235 | 1.815 | 1.022 |
| 83 | 4 | 250 | 0.150 | 0.05 | 0.221 | 0.270 | 1.540 | 1.110 |
| 84 | 4 | 250 | 0.150 | 0.15 | 1.362 | 1.601 | 6.989 | 6.022 |
| 85 | 4 | 150 | 0.150 | 0.15 | 0.205 | 0.405 | 2.530 | 2.000 |
| 86 | 4 | 200 | 0.225 | 0.184 | 2.401 | 2.790 | 10.731 | 9.935 |
| 87 | 4 | 200 | 0.225 | 0.10 | 0.500 | 0.610 | 2.853 | 2.610 |
| 88 | 4 | 284 | 0.225 | 0.10 | 0.680 | 0.823 | 3.600 | 3.311 |
| 89 | 4 | 200 | 0.225 | 0.10 | 0.495 | 0.598 | 2.848 | 2.608 |
| 90 | 4 | 200 | 0.225 | 0.10 | 0.493 | 0.595 | 2.845 | 2.606 |
| 91 | 4 | 200 | 0.225 | 0.10 | 0.491 | 0.593 | 2.844 | 2.603 |
| 92 | 4 | 200 | 0.225 | 0.10 | 0.491 | 0.591 | 2.841 | 2.602 |
| 93 | 4 | 200 | 0.225 | 0.016 | 0.200 | 0.301 | 2.440 | 1.801 |
| 94 | 4 | 66 | 0.225 | 0.10 | 1.004 | 1.305 | 5.901 | 4.015 |
| 95 | 4 | 200 | 0.225 | 0.10 | 0.490 | 0.590 | 2.840 | 2.600 |
| 96 | 4 | 150 | 0.300 | 0.15 | 1.502 | 2.019 | 6.425 | 6.289 |
| 97 | 4 | 250 | 0.300 | 0.15 | 1.683 | 2.020 | 7.274 | 7.033 |
| 98 | 4 | 250 | 0.300 | 0.05 | 0.236 | 0.298 | 2.523 | 1.879 |
| 99 | 4 | 150 | 0.300 | 0.05 | 0.200 | 0.302 | 2.211 | 1.802 |
| 100 | 4 | 200 | 0.351 | 0.10 | 0.581 | 0.702 | 3.011 | 2.904 |
Declaration of Conflicting Interests
The author(s) declared no potential conflicts of interest with respect to the research, authorship and/or publication of this article.
Funding
The author(s) disclosed receipt of the following financial support for the research, authorship, and/or publication of this article: This project was supported by King Saud University, Deanship of Scientific Research, College of Engineering Research Center.