
Abstract
The optical performance of lens machined by single-point diamond ultra-precision turning can be affected by both form errors and surface roughness. The former can be characterized by the spectra of lower spatial frequencies of surface variations while the latter by much higher spatial frequencies. Fast Fourier transform method is used to analyze the surface profile and to decompose the surface features in terms of relative spatial frequencies (or periods). Most of the conventional post-machining lapping processes are aimed at improving the surface finish mainly, and the form accuracy would very likely be tempered. A lapping process with very low lapping pressure is used to study the relationship between the various spatial frequency groups with various lapping process parameters. The preferred spectral group is found to change with lapping time. As the lapping time is increased beyond a certain point, the spatial period of the preferred spectral group shifts to a lower spatial frequency region. Thus, it is possible to improve the surface finish while maintaining the form accuracy. The study would have important implications in the lapping of aspheric or freeform surfaces.
Introduction
Lapping means different things to different people. It could be grinding or coarse polishing with abrasive slurry against a hard metal platen 1 and the removal of material to produce a smooth surface by rubbing two surfaces together with an abrasive between them. In this study, we refer to lapping as the generation of an optically smooth surface with minimum shape distortion. According to the previous research, lapping involves a relative motion between the lapping plate and the workpiece surface. This motion causes the abrasive grains in contact with the workpiece to move and to develop complex, dense and intervened paths against the surface of the workpiece. 2 Along every lapping path developed between the lapping plate and the workpiece, the abrasive grains roll rather than slide. Conventionally, hard plates promote rolling of the grains while soft (and/or porous) plates lead to grains being stuck to the plate. 3
Aiming at seeking common grounds while respecting the existing differences in areas of application, in this article, lapping process refers to any mechanical or chemical means to improve form accuracy and to reduce surface roughness. 4 It was impossible for the polishing processes to improve the form accuracy as the material removal is highly localized.5,6 On the other hand, the lapping process could be detrimental to the form accuracy as local curvature might be modified due to the excessive local abrasive actions. As the previous studies reported, if the lapping process was used before polishing to remove just the tool marks, form accuracy could be maintained. Also, it was reported that abrasive grain size, lapping pads and the uniformity of the lapping pressure distribution were the important factors affecting the lapping process.7,8 However, not much has been reported on lapping process, under which the compressive force is consistently maintained at a very low level.9,10
Experimental setup and materials
The lapping experimental setup
In this work, a lapping process based on the use of a lapping brush made of goat hairs was developed to reduce the lapping pressure so as to minimize the effect of lapping on the form of the diamond turned surface (Figure 1). The workpiece was immersed in a bath of abrasive slurry which was made up by mixing 10 g/100 mL cerium oxide (CeO2) slurry. 11 Because the abrasive is immersed in a liquid, it can undertake the free motion of the whole process. The average diameter of CeO2 particles was about 1.5 µm. A rotating brush driven by a programmable stirrer was used as the lapping pad.
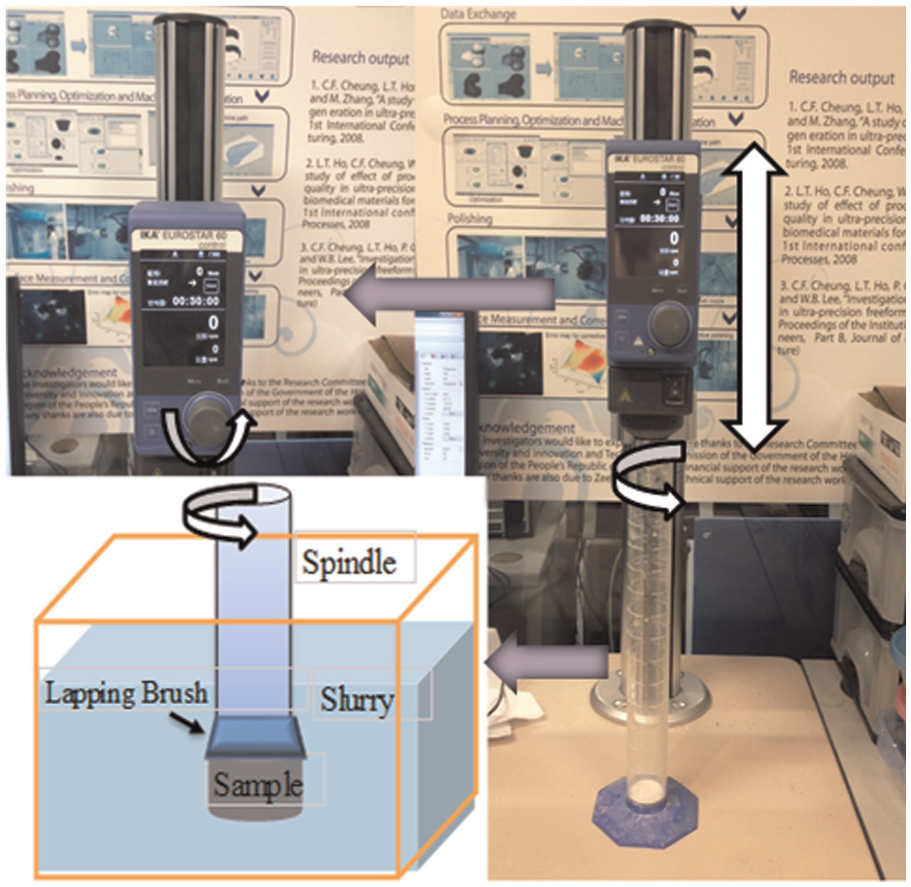
The lapping machine.
In order to preserve the shape and maintain the form accuracy, the lapping pressure must be reduced to a minimum.12,13 To this end, the brush used was made of strands of goat hair. The diameters of strands were around 30–40 µm and the tip of each strand was tapered to a fine point from 30 to 2000 r/min and for different durations. As the goat hairs did not exert any significant pressure onto the workpiece, the CeO2 particles tended to rotate rather than slide. Also, the hairs drove the CeO2 particles toward the workpiece by skin friction which could in turn induce rotation. Moreover, because of the flexibility of the hairs, neither the changes of relative position between the workpiece and the brush nor vibration of the stirrer could notably affect the lapping performance.
Experimental design
In this present experiment, it is divided into three parts designated A, B and C. In Part A, the specimen is a flat surface of Φ8 mm aluminum alloy face turned by a single-point diamond with a surface roughness of about 140 nm measured by a Talysurf PGI 1240 (Taylor-Hobson Ltd., UK). The rotational speed was fixed at 40 r/min while the lapping time was chosen as 40, 80, 160, 320 and 640 s, respectively.
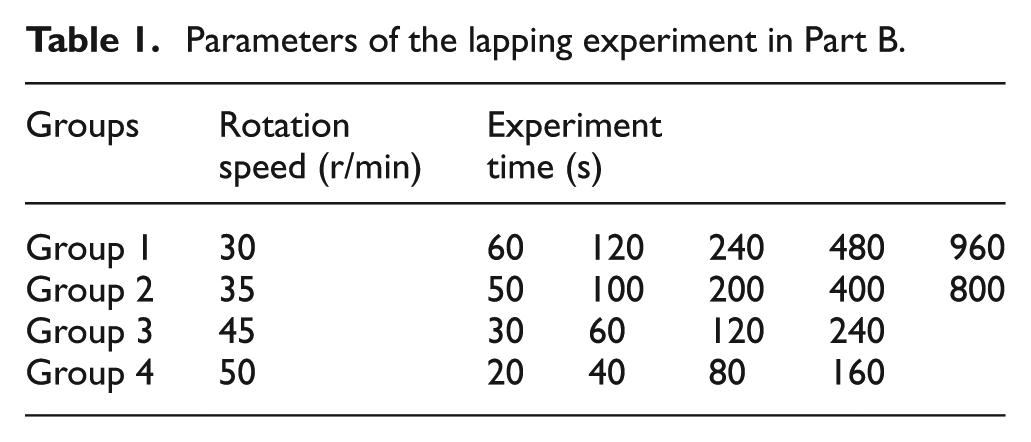
In Part B, the shape and material of specimens are as same as Part A. However, both rotation speed of the lapping brush and the experiment time are varied. The group of parameters is shown in Table 1.
Parameters of the lapping experiment in Part B.
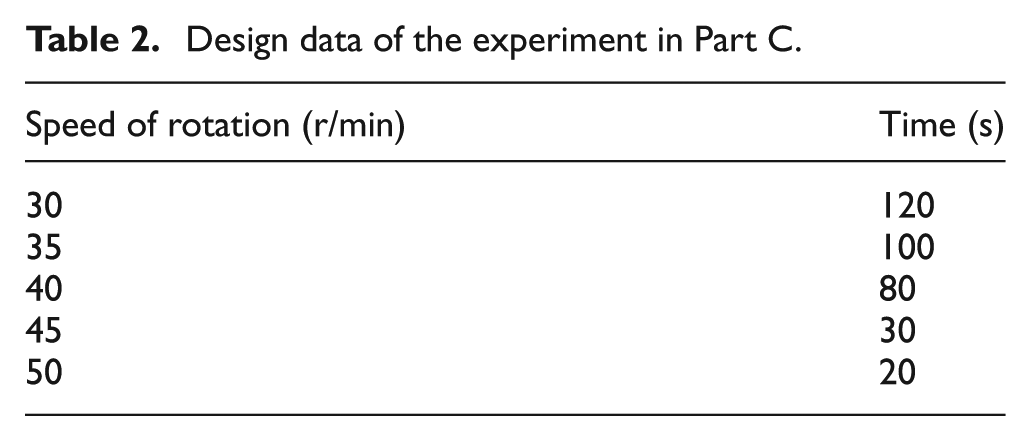
In Part C, the specimen is a concave aspheric surface lens of Φ8 mm made of nickel–copper alloy (Figure 2). The concave lens is face turned by a single-point diamond turning machine to obtain a surface roughness of 5.275 nm before lapping experiment. For this part, there are five lapping tests, each with a higher rotation speed and lower lapping time than its predecessor. Actually, the combination of the parameters is listed in Table 2.
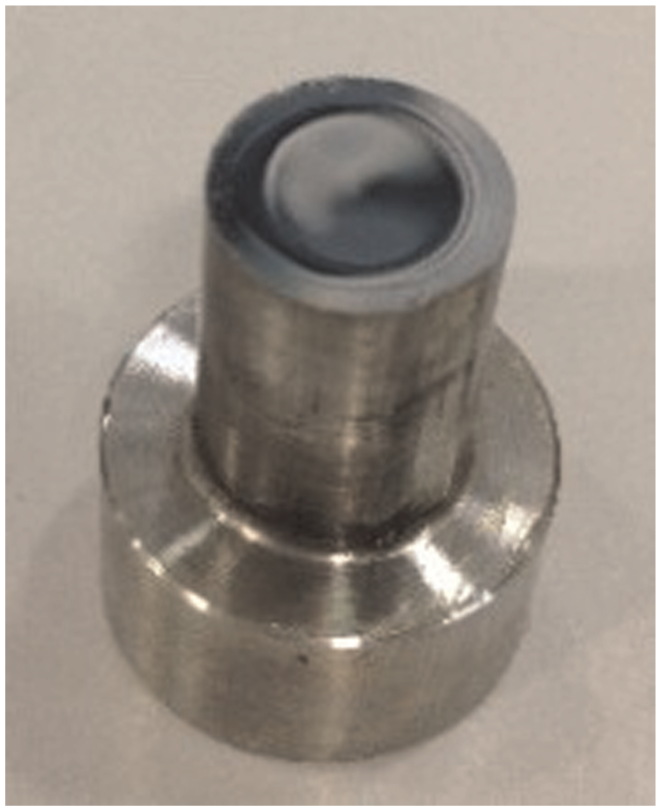
The concave aspheric surface lens used in Part C.
Design data of the experiment in Part C.
Characterization by fast Fourier transform
There are well-established methods of measuring form and surface roughness. Basically, all surfaces can be constructed from superimposition of various sine and cosine waves with varying amplitude and periods (the reciprocal of wave frequencies). Form errors are characterized by their low spatial frequencies, whereas surface roughness is mainly composed of high spatial frequencies. Fast Fourier transform (FFT) was used here as a signal transformation to the frequency domain including higher and lower spatial frequencies.14,15 It was used to convert a two-dimensional (2D) spatial function f(x,y) into the 2D spectrum F(u,v) of spatial frequencies, as well as its inverse conversion into a spatial representation without the loss of information.16,17 The spatial distribution of surface profile presented is spatial amplitudes versus spatial periods.18,19 The spatial amplitudes are expressed as the FFT signals here as shown in Figure 3; the length of this cycle, L (2π/ω), is called the spatial period, and the spatial frequency of variation is the reciprocal of the spatial period (1/L).
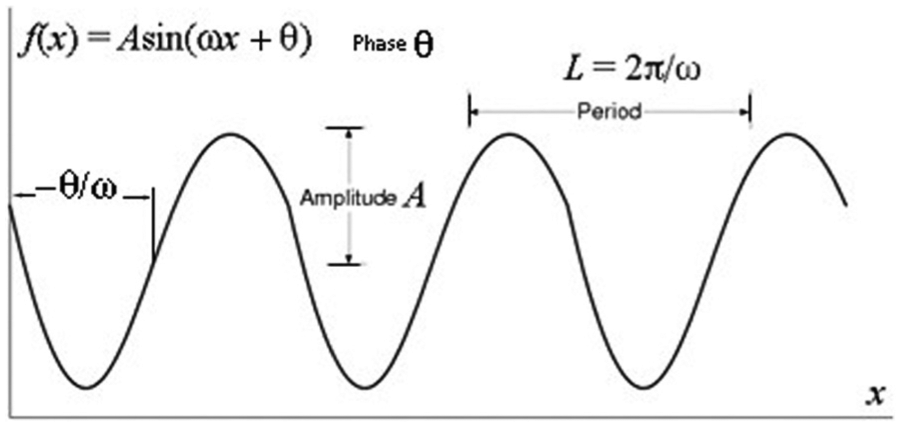
The Fourier transform of general sinusoidal function x.
The sine and cosine functions for the decomposition are called the basis functions of the decomposition. The weighted sum of these basis functions is called a Fourier series 16
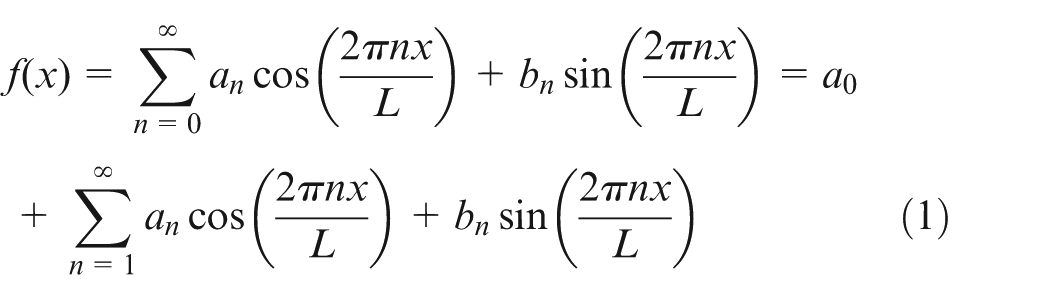
The function f(x) is a basis function in which the Fourier coefficients are the weighting factors, and the number of the sine wave is indicated as the index n during the period of L.
Results and discussion
Part A
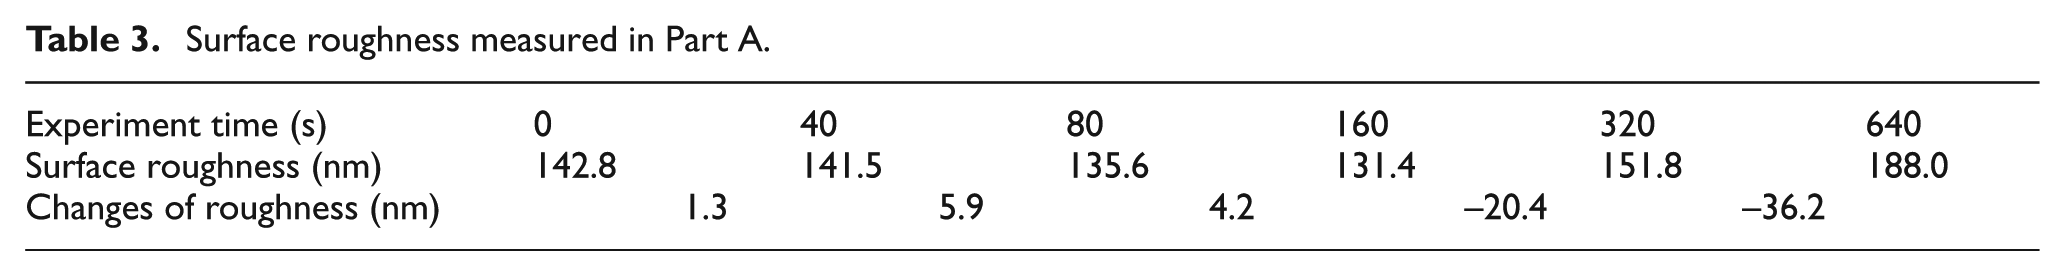
2D surface contact profiles were measured using the Talysurf as shown in Figure 4. The surface roughness of the samples in Part A is listed in Table 3. It can be observed that the surface roughness was decreased at first and then started to increase from 160 s onward. A special case of this kind of measurement is the radial measurement, in which the data of the measured profile can be readily transformed into the spatial frequency with FFT. Thus, one could imagine that lapping a surface is indeed simultaneously lapping a combination of sine waves. During lapping process, the brush used will be of different contact length, different sine wave of different spatial periods and then of course different lapping rate.
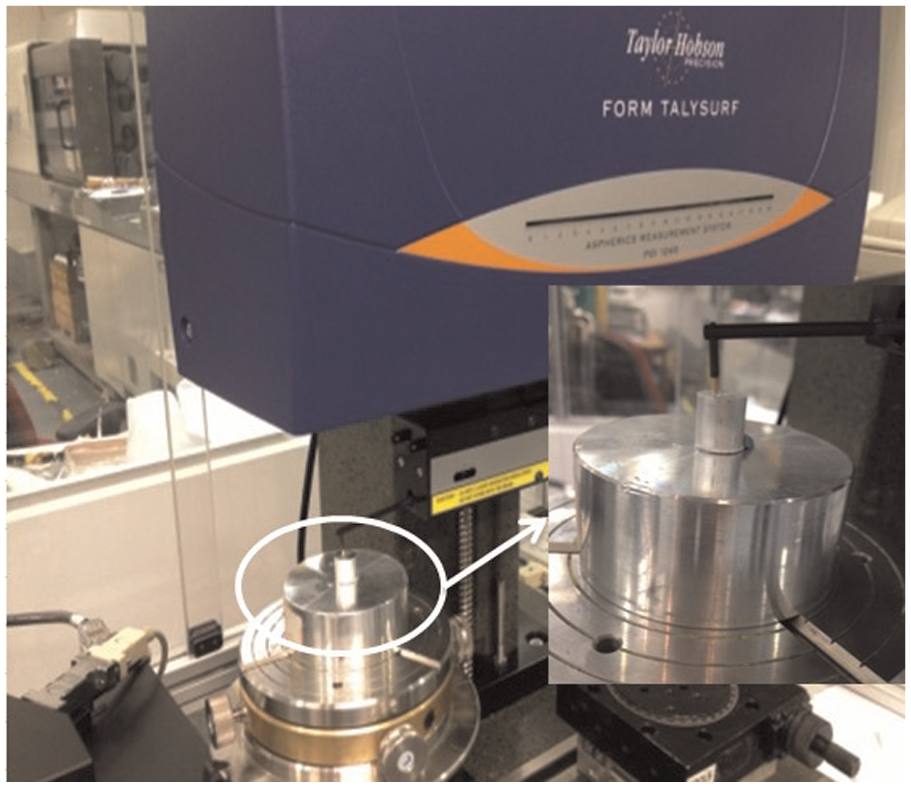
The contact-type measurement of Talysurf PGI 1240.
Surface roughness measured in Part A.
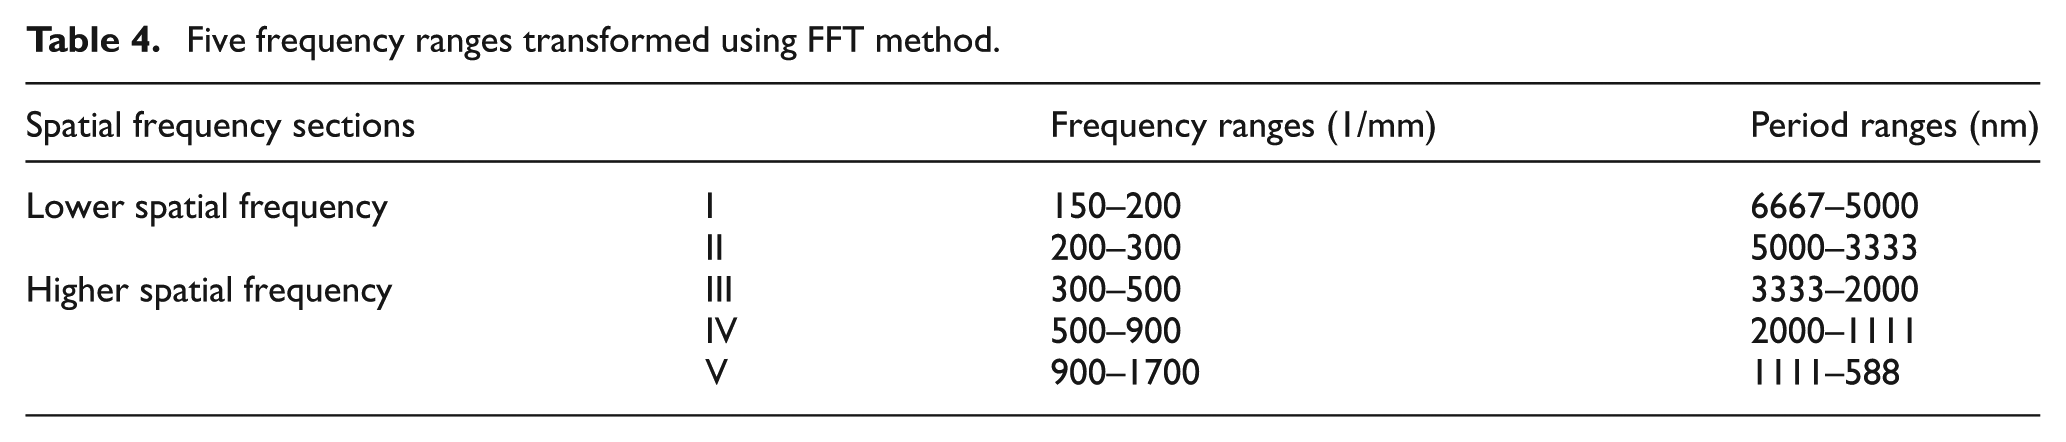
It could be roughly divided into five sections from I to V including the lower and higher spatial frequencies as shown in Table 4. The frequency and period ranges are one to one correspondence of these sections. The X-axis is the spatial period and the Y-axis is amplitude, and the amplitude spectra were extracted from the spatial spectra shown in Figure 5. Such decomposition of aerial data can also be regarded as the measurement of the surface roughness profile in a stylus mode along a predefined sampling path.
Five frequency ranges transformed using FFT method.
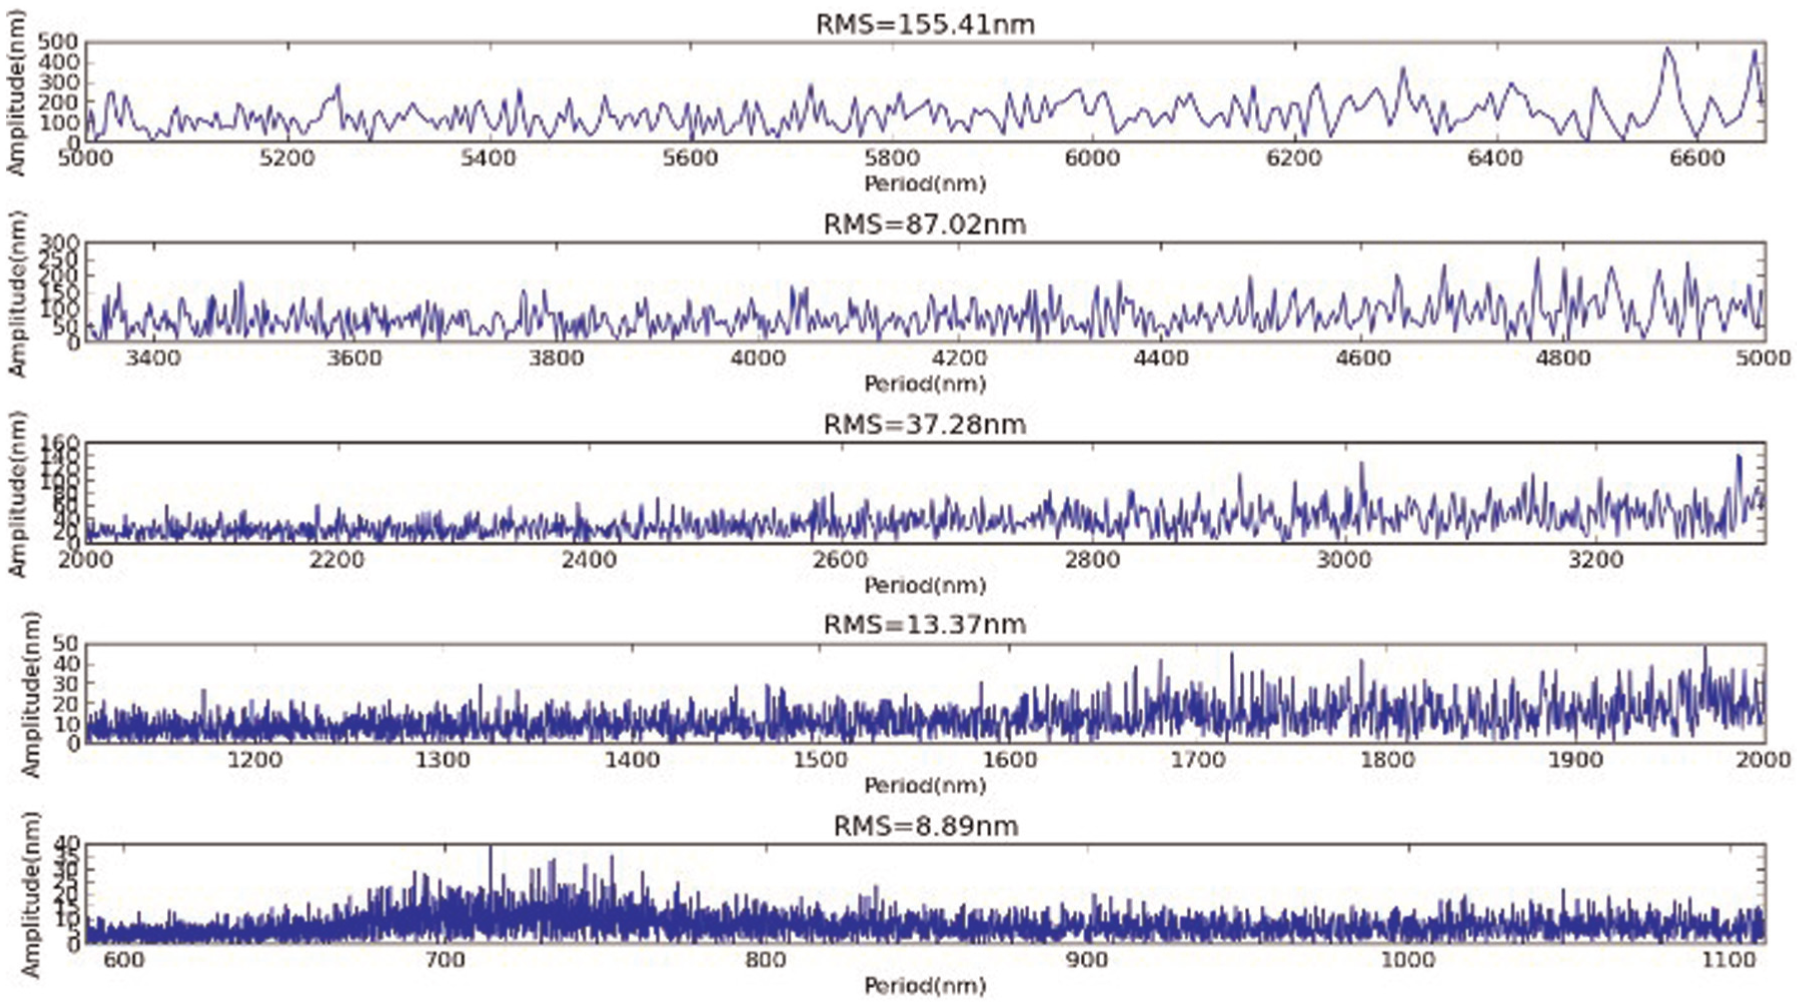
Surface roughness transformed to five parts using FFT before experiment in Part A.
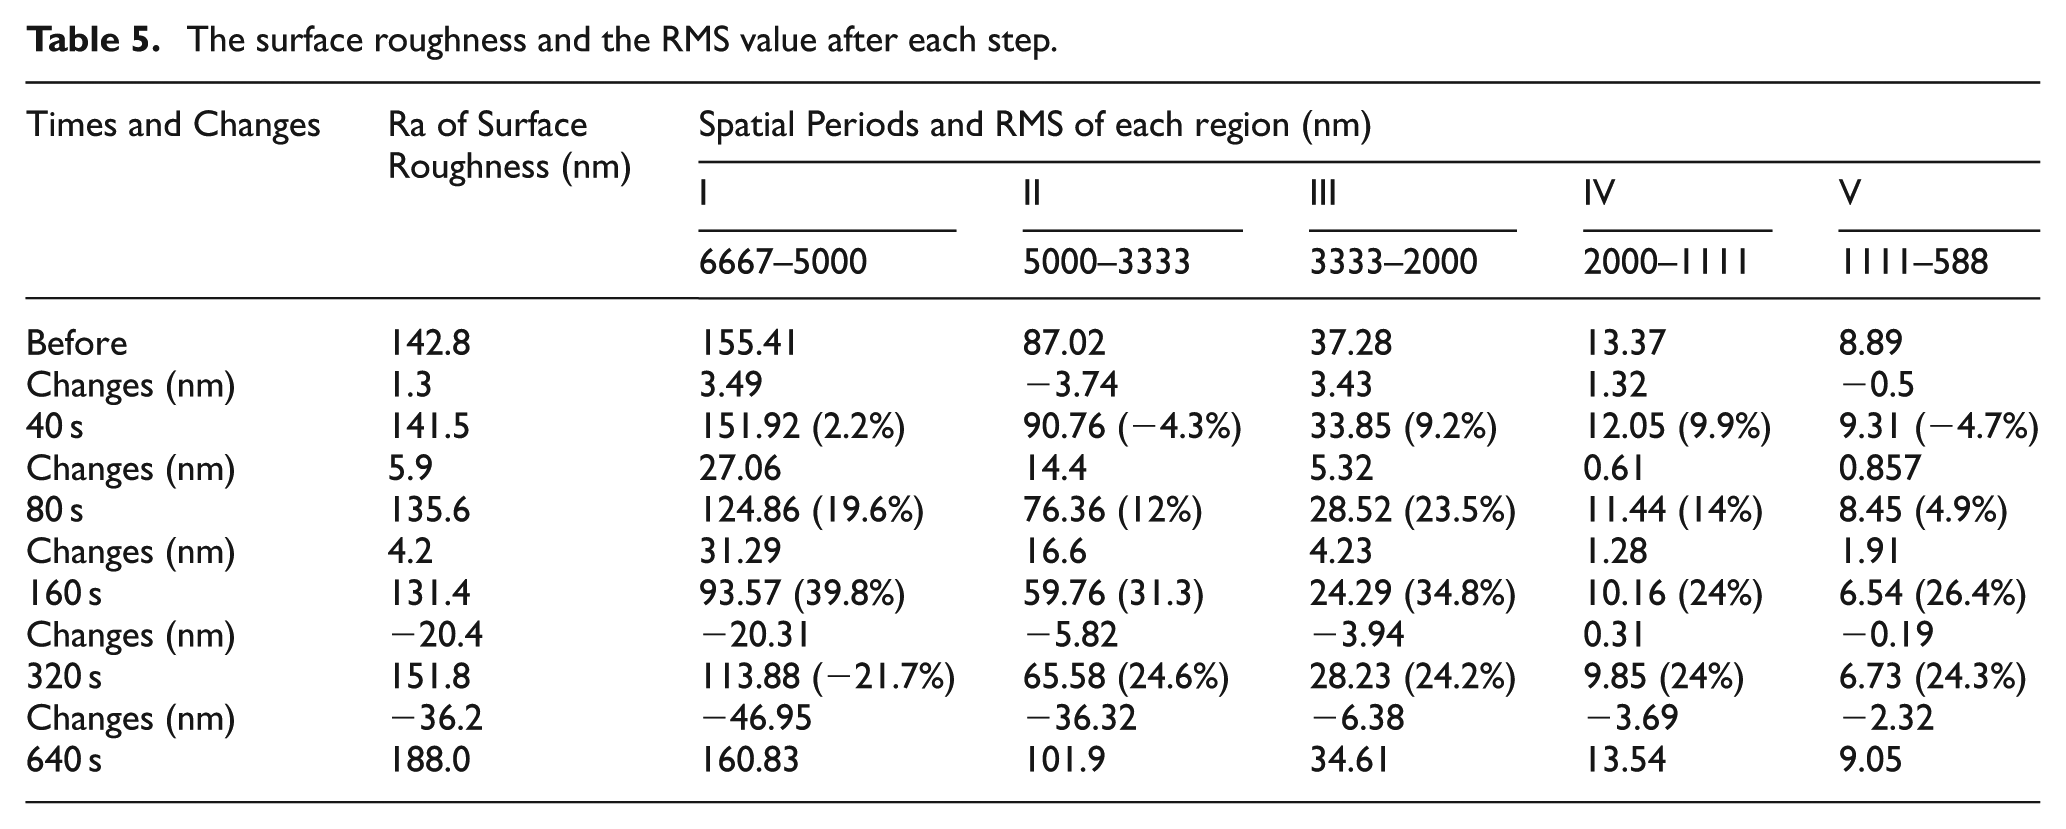
From Table 5 in Part A, the Ra result of surface roughness and the root mean square (RMS) transformed by FFT in each spatial period are shown. A term called equivalent spatial surface roughness (ESSR) for specific spatial group is introduced which is defined as RMS value of that spatial group. The rationale behind not adopting the conventional symbols is that it would facilitate the comparison of the relative changes of surface roughness measured by Talysurf. The ESSR of each section was calculated from the RMS of amplitudes of the sinusoidal surface profile. The change of ESSR was consistently very similar to the variation of surface roughness shown with Ra. Therefore, the preferred spectral group (PSG) was expected to be the dominant group preferentially lapped or removed by the abrasives. During the first 160 s of experiment process, the most significant improvement in terms of the reduction in surface roughness initially fell into the higher frequency spatial groups III and IV and then gradually shifted to lower spatial frequency groups I and II. Also, the PSG always corresponded to the group at which the maximum improvement in ESSR could be found. With increase in lapping time, the PSG shifted to groups I and II up to the point after which the detachment of debris from the workpiece could cause detrimental effect on ESSR.
The surface roughness and the RMS value after each step
However, at such an early stage of lapping experiment, the changes were expected to be the result of removing tiny irregularities. It should therefore be regarded as an improvement in form accuracy which is shown in Figure 6(b) measured by the Hitachi Tabletop Microscope TM3000 of 500× magnification. Figure 6(a) shows the surface of workpiece before experiment in Part A under the same magnification.
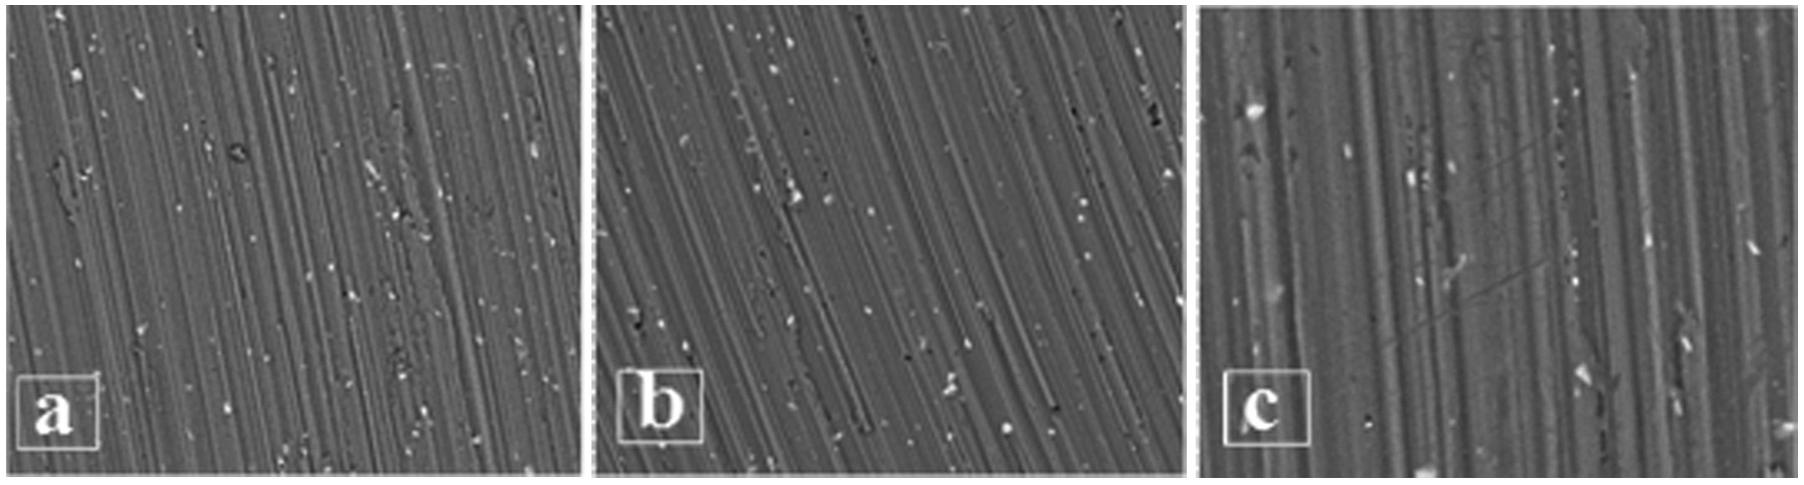
Hitachi tabletop microscope in Part A: (a) the material surface before experiment under 500× magnification, (b) the surface changed after experiment of 160 s under 500× magnification and (c) the surface changed after experiment of 640 s under 1000× magnification.
In simple terms, the lapping action did change the material surface form beyond 640 s of lapping time. Based on the microscopic examination under 1000× magnification in Figure 6(c), tiny scratch marks comparable to the spatial period group II are frequently found. Therefore, it was believed that the detachment of debris mainly from frequency spatial II caused the ESSR to decrease. Thus, the optimal experiment lapping time of 40 r/min should be somewhere between 80 and 160 s.
Part B
In Part B, the measured spatial profile was categorized by the FFT method. These data together with that from Part A are shown in Figure 7, where in Figure 7(a) the abscissa and ordinate axes are time and surface roughness, respectively. Each color corresponds to one rotation speed in Figure 7. This shows that for all speeds as lapping time increases the surface roughness first decreases to a minimum and then increases above the initial value. This means lapping can initially improve form accuracy and later degrade the form has as the peak to valley distance increases. In order to investigate the effect of rotating speed on the lapping performance, the experiment was controlled by fixing the total number of revolutions. Thus, the higher the rotating speed, the shorter the lapping time will be taken. The PSG of part B was 30 r/min: 120–240 s, 35 r/min: 100–200 s, 40 r/min: 80s–160 s, 45 r/min: 30–60 s and 50 r/min: 20–40 s.
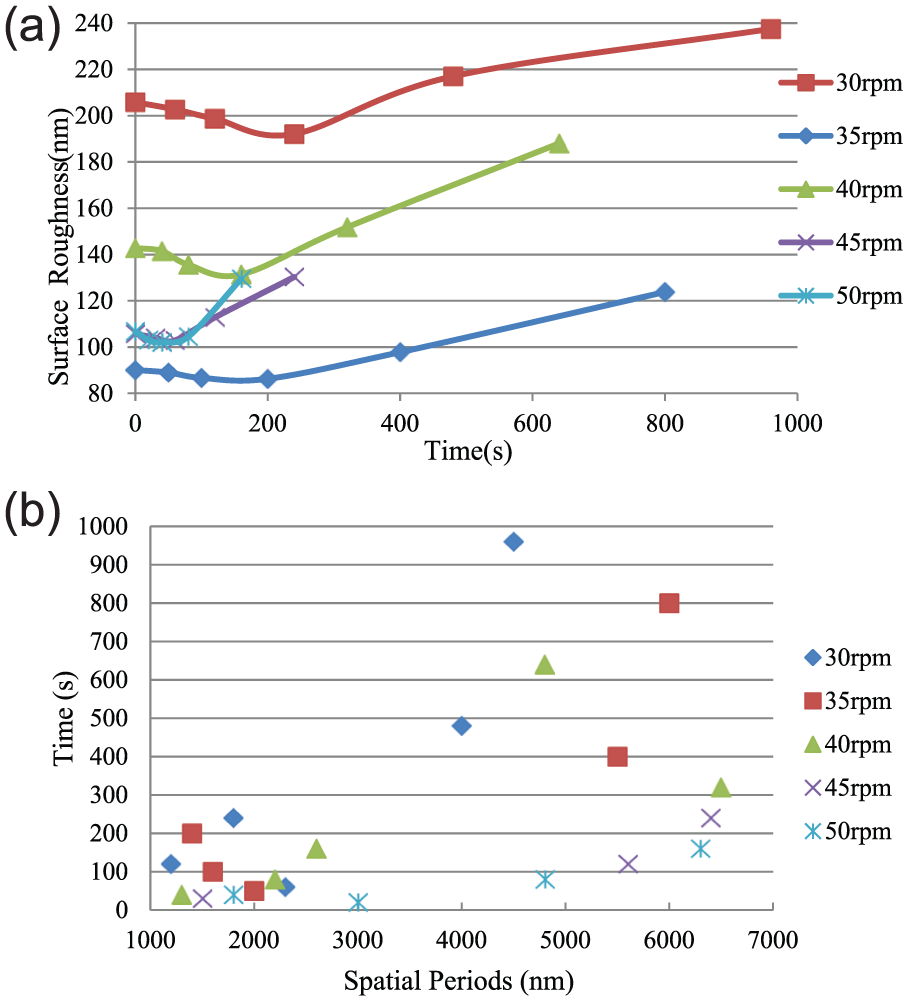
(a) The data of surface roughness and time after experiment both Parts A and B and (b) the relationship between spatial period and time using FFT.
The surface roughness variation in each group has one to one correspondence value in the FFT transform outcome as shown in Figure 7(b). The variation almost happened in the higher spatial frequency (period less than about 3333 nm) at the beginning of the process and change to the area of lower spatial frequency groups I and II (period more than 3333 nm) as the process time goes on.
In general, the longer the lapping time, the better the surface roughness. However, when the lapping time is increased to beyond their respective optimal lapping time, the surface roughness will adversely be increased. Figure 7(b) shows that shorter lapping time will pose less effect on spectral groups with higher spatial period (lower spatial frequency). This means that optimal process time of low lapping speed could protect the form from being affected by the lapping process.
Part C
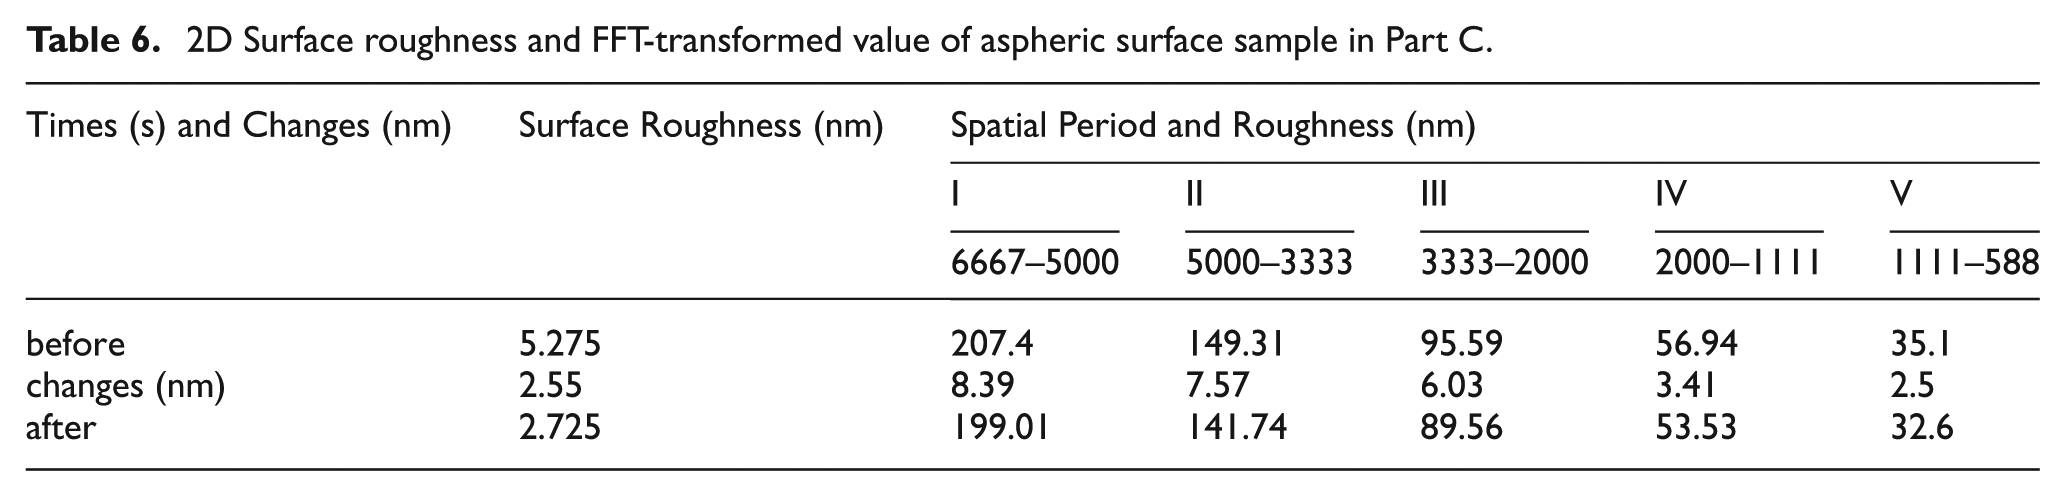
In Part C, the changes of amplitudes of each spatial group of sine waves by FFT method is tabulated in Table 6. The amplitude of each spatial group is corresponding to certain “Form” features of the surface. Thus, the changes of these amplitudes could be interpreted as “Form” changing. It was found that the surface roughness was reduced by the lapping process to about 2.725 nm measured by Talysurf as shown in Table 6. The lapping time was controlled so as to ensure that the form accuracy in the higher spatial frequencies could be maintenance. The change of ESSR is 2.5 nm in the higher spatial frequency group V. Such improvement should mainly influence the surface finish. In contrast, the changes of ESSR in lower spatial frequency groups I to III could be interpreted as a combination of changes in both surface form and roughness. Also, for lower spatial period group V, the period is so small that one could assume that they are not “Form” feature at all. Therefore, the changes of amplitude of lower spatial period group V are mostly attributed to the change in surface roughness. Another interesting point is that the lower frequency group I–III (higher spatial period) is actually lapped more severely than the higher frequency group V. The surface roughness is from 8.39 to 2.5 nm shown in Table 6. However, judging from the percentage of changes, these changing in the lower frequency group is not significant.
2D Surface roughness and FFT-transformed value of aspheric surface sample in Part C.
The surface in Part C was also characterized before and after lapping using a three-dimensional WYKO NT8000 optical profiling system (Figure 8). This instrument measures the surface form by optical interference. It can be seen directly that the interference fringe became more uniform and the surface finish smoother and brighter. Also, the Ra of the measure area reduced from 5.93 to 2.81 nm. Based on these results, the improvement in surface roughness is corresponding to the spatial period group V. Thus, the lapping process is actually lapping the high frequency (low spatial period) irregularities. The changes in ESSR in group V correspond well with the changes in surface roughness measured by Wyko (5.275–2.725 nm). It could therefore conclude that the effective contact length increases with polishing time which is again understandable because the smoother the surface, the longer the effective contact length.
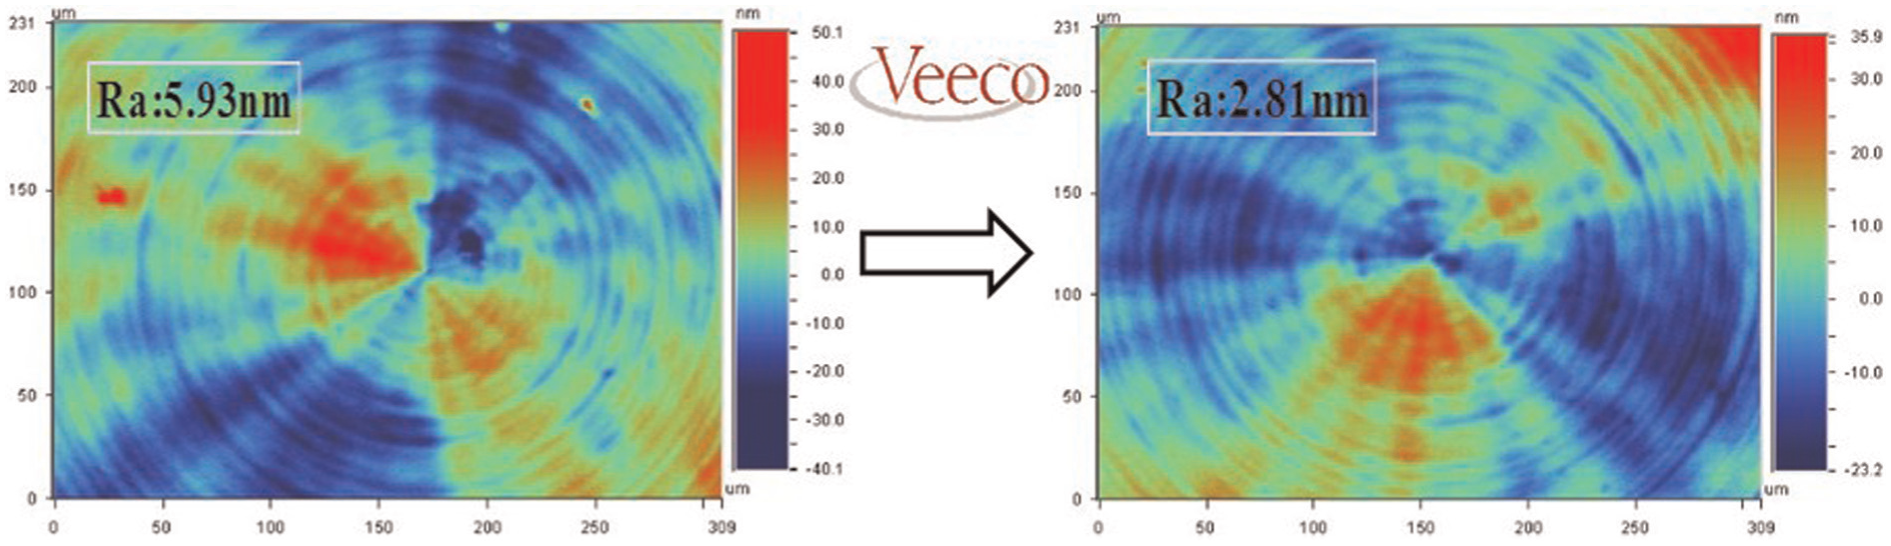
Two measured results of WYKO including before and after experiment.
In the traditional lapping process, when the surface finish is improved, the form accuracy may be sacrificed. The reduction in high spatial frequency as reflected by surface roughness measurement is often accompanied by an increase in low spatial frequency and amplifying the form error. Using a very low lapping pressure based on using a lapping brush made of goat hairs, a better surface finish can be obtained by carefully selecting the lapping process variables. There is a relationship correlation between surface roughness, spatial periods and RMS of each region, and these spatial periods change with lapping time, an understanding of which will give hints as how to further optimizing the lapping process to maintain the form accuracy. This is especially important when aspheric or freeform surfaces are lapped. The focus of this work is on spectral analysis and not on the mechanism of lapping based on using the goat hairs. The mechanism of lapping using goat hairs would be the content of another paper by the authors under preparation.
Conclusion
From Table 5 in Part A, it is demonstrated that as long as the lapping time is not excessive, there exists a PSG to change ESSR mostly corresponding to Ra value of surface roughness, and the ESSR decreased with time for spatial frequency groups III and IV. It is also demonstrated that as the lapping time increased beyond a certain point, the spatial period of the PSG shifts to a lower spatial frequency. Thus, the purpose of improvement in finish while keeping the form accuracy is achieved. With excessive lapping time, debris would be generated and then caused scratches on the workpiece surface. This damage could be revealed by the shifting of PSG to a higher spatial frequency group.
Contrary to the traditional lapping approach, when the low lapping process method is used, the workpiece would be first lapped at relatively low rotation speed before gradually increasing toward a faster one. Excessive lapping must be avoided by correctly determining the optimal process time spans for each rotation speed. This method is found to be able to achieve better surface finish and lesser damage to keep form accuracy.
Footnotes
Acknowledgements
The authors wish to acknowledge the support of the Research Committee of the Hong Kong Polytechnic University for the financial support of the Hong Kong State Key Laboratory of Ultra-precision Machining Technology (BBX7).
Declaration of Conflicting Interests
The authors declared no potential conflicts of interest with respect to the research, authorship and/or publication of this article.
Funding
The authors received no financial support for the research, authorship and/or publication of this article.