
Abstract
According to the correlation between product quality and equipment degradation state, an equipment maintenance policy is designed by integrating periodic equipment inspection and product quality control. In this policy, np-chart is used to monitor the abnormal shift of the product quality characteristic based on periodic inspection of the equipment. By considering the inspection result of the product quality shift and equipment degradation state, the corresponding maintenance action is chosen. Furthermore, the optimal maintenance model based on product quality control is proposed and is solved with genetic algorithm. The experimental results validated the feasibility of this model.
Keywords
Introduction
In the production process, product quality is the primary evaluation factor. Many factors influence product quality, such as equipment, raw material, manufacturing method, and assembly crew.1,2 Therefore, product quality can be improved by reducing process variation. In 1924, Shewhart developed the concept of statistical process control (SPC), which is a methodology for measuring and monitoring quality control. 3 The control chart is one such quality control tool that checks for process stability by determining whether the product quality is in an abnormal state. 4 Furthermore, in the modern manufacturing industry, complex manufacturing equipment can deteriorate gradually until eventual failure. To reduce the deterioration rate of the equipment, a series of equipment maintenance policies have been proposed, including time-based maintenance and condition-based maintenance.5–7 According to the maintenance policy, predetermined maintenance actions are implemented. Although maintenance management and SPC are able to ensure the quality of a production system, they are usually treated independently. In 1995, Ben-Daya and Duffuaa 8 noticed that there is a correlation with product quality and maintenance activity. Since then, industry and academia recognized the relationship between product quality and maintenance. Research increasingly focused on integrated periodic equipment inspection and product quality control.
In general, x-bar chart is used to monitor the average value of the quality characteristic of produced items.9–11 It has the advantages of simple operation and wide applicability. In addition, x-bar chart is suitable for monitoring variable data, in which each point represents the most recent data. Therefore, x-bar chart could be used to measure continuously varying quality characteristics. For counted data, attribute control charts display changes in the number of defective products, rejects, or unacceptable outcomes. Among the various types of attribute control charts, np-chart is often used as an indicator of the consistency and predictability of the level of defects in the process. It is valid as long as data are collected in subgroups that are of the same size. Recently, a few scholars introduced np-chart into the integrated research of product quality and maintenance. Wang 12 assumes that a system is in one of the three possible states, including in-control, out-of-control, and failure. Based on this assumption, he proposed three maintenance models based on np-chart.
Although the above research noted the relationship between product quality and maintenance, they assume that equipment is the key factor influencing product quality. Thus, current maintenance policy requires that the equipment is maintained as soon as the product quality is determined to be in abnormal state.13,14 Nevertheless, during real product processes, factors other than the equipment (e.g. raw material, manufacturing method) may cause an abnormal shift of product quality. 15 Because equipment is not the only reason for this result, the equipment can undergo excess maintenance. To avoid this dilemma, equipment inspection is performed to determine whether the equipment is stopped by a sudden breakdown.
In the manufacturing industry, periodic inspection is used to discover hidden failures. If the equipment breaks down before the scheduled maintenance, it causes great economic loss. Equipment deterioration is the major factor that causes defective product outputs. Meanwhile, the level of product quality can indirectly reflect the equipment’s deterioration state. Considering the correlation between the deterioration state of product quality and the equipment’s deterioration state, it is necessary to design a more rational maintenance policy based on periodic inspection and SPC. In this article, a maintenance policy that integrates periodic equipment inspection and product quality control is proposed. In this policy, np-control chart is used to monitor the shift of product quality and the deterioration state of the equipment is introduced to determine whether the equipment requires maintenance. Finally, a maintenance model based on product quality control is proposed and solved by genetic algorithm.
Assumption
A deteriorating single-equipment system is considered, and the equipment deterioration behaviour is described by a stochastic process.
Product quality inspection is performed with np-chart and n samples are taken every h hours. For np-chart, it is used to detect quality shifts by judging whether the number of defective items is larger than a specific number.
The equipment state can be detected only by inspection, which is conducted every
When the equipment breaks down, the deterioration level is greater than the corrective maintenance (CM) threshold. Then, the equipment is replaced immediately.
Maintenance policy based on product quality control
Following these assumptions, a new maintenance policy is designed based on product quality control. First, the equipment is inspected every
In addition, CM is performed immediately if the equipment undergoes an unexpected breakdown.
In the proposed policy, maintenance actions are assumed to include PM and CM. After maintenance, the equipment state will return to ‘good as new’.
According to this maintenance policy, Figure 1 shows three different scenarios in production.
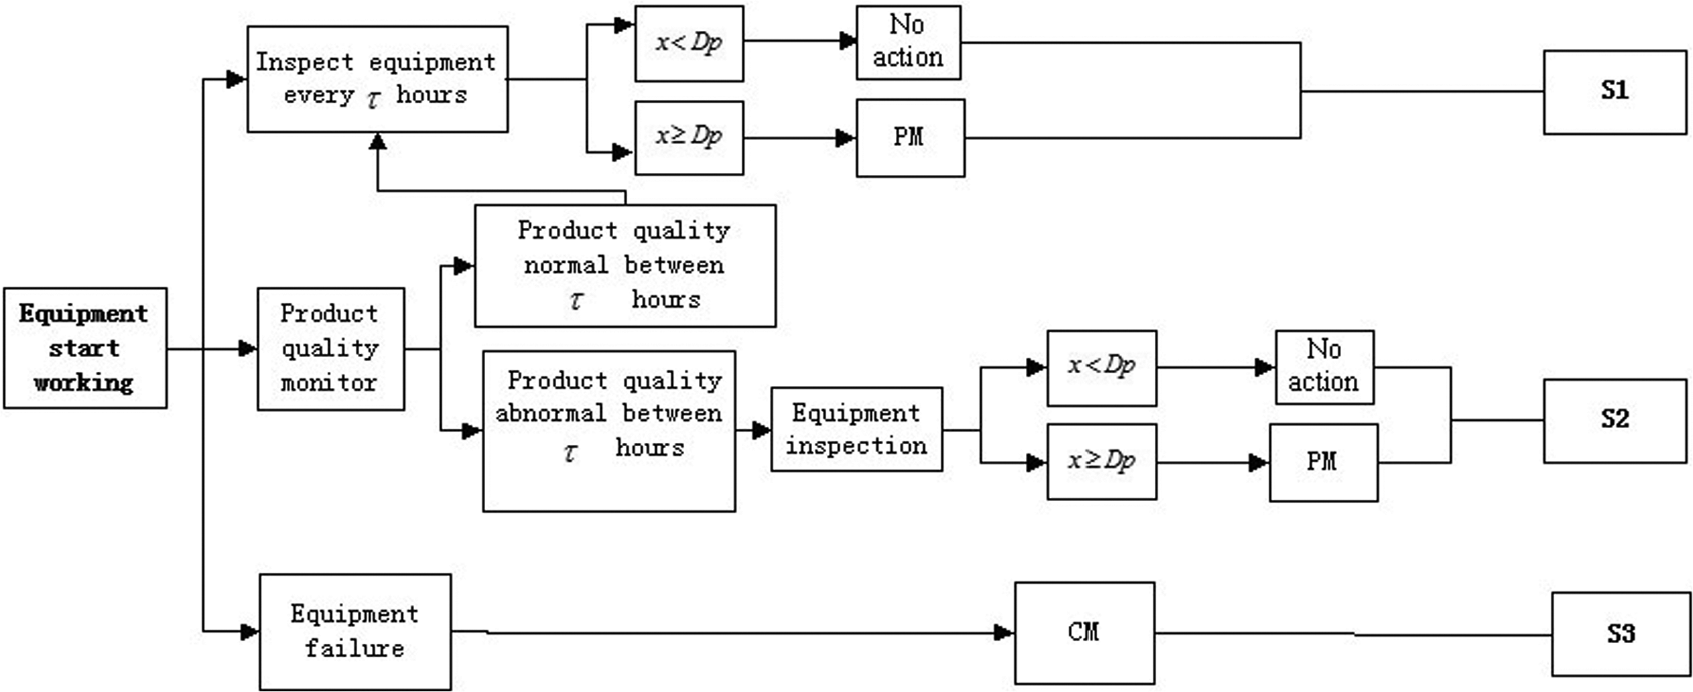
Three scenarios of the maintenance model.
Scenario 1
The equipment is inspected every
Scenario 2
If the
Scenario 3
If the equipment suddenly breaks down during the manufacturing process, CM is implemented immediately.
Optimal maintenance model based on product quality control
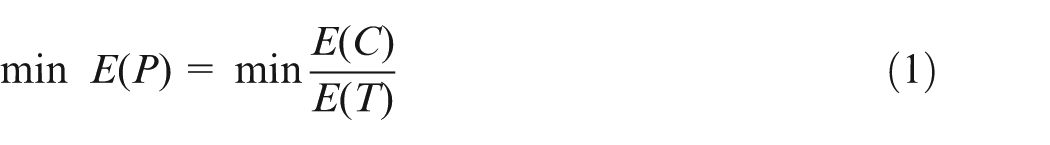
According to the above assumptions and maintenance policy, minimizing the average cost rate is made the aim of the maintenance model. Therefore, the objective function is
The value
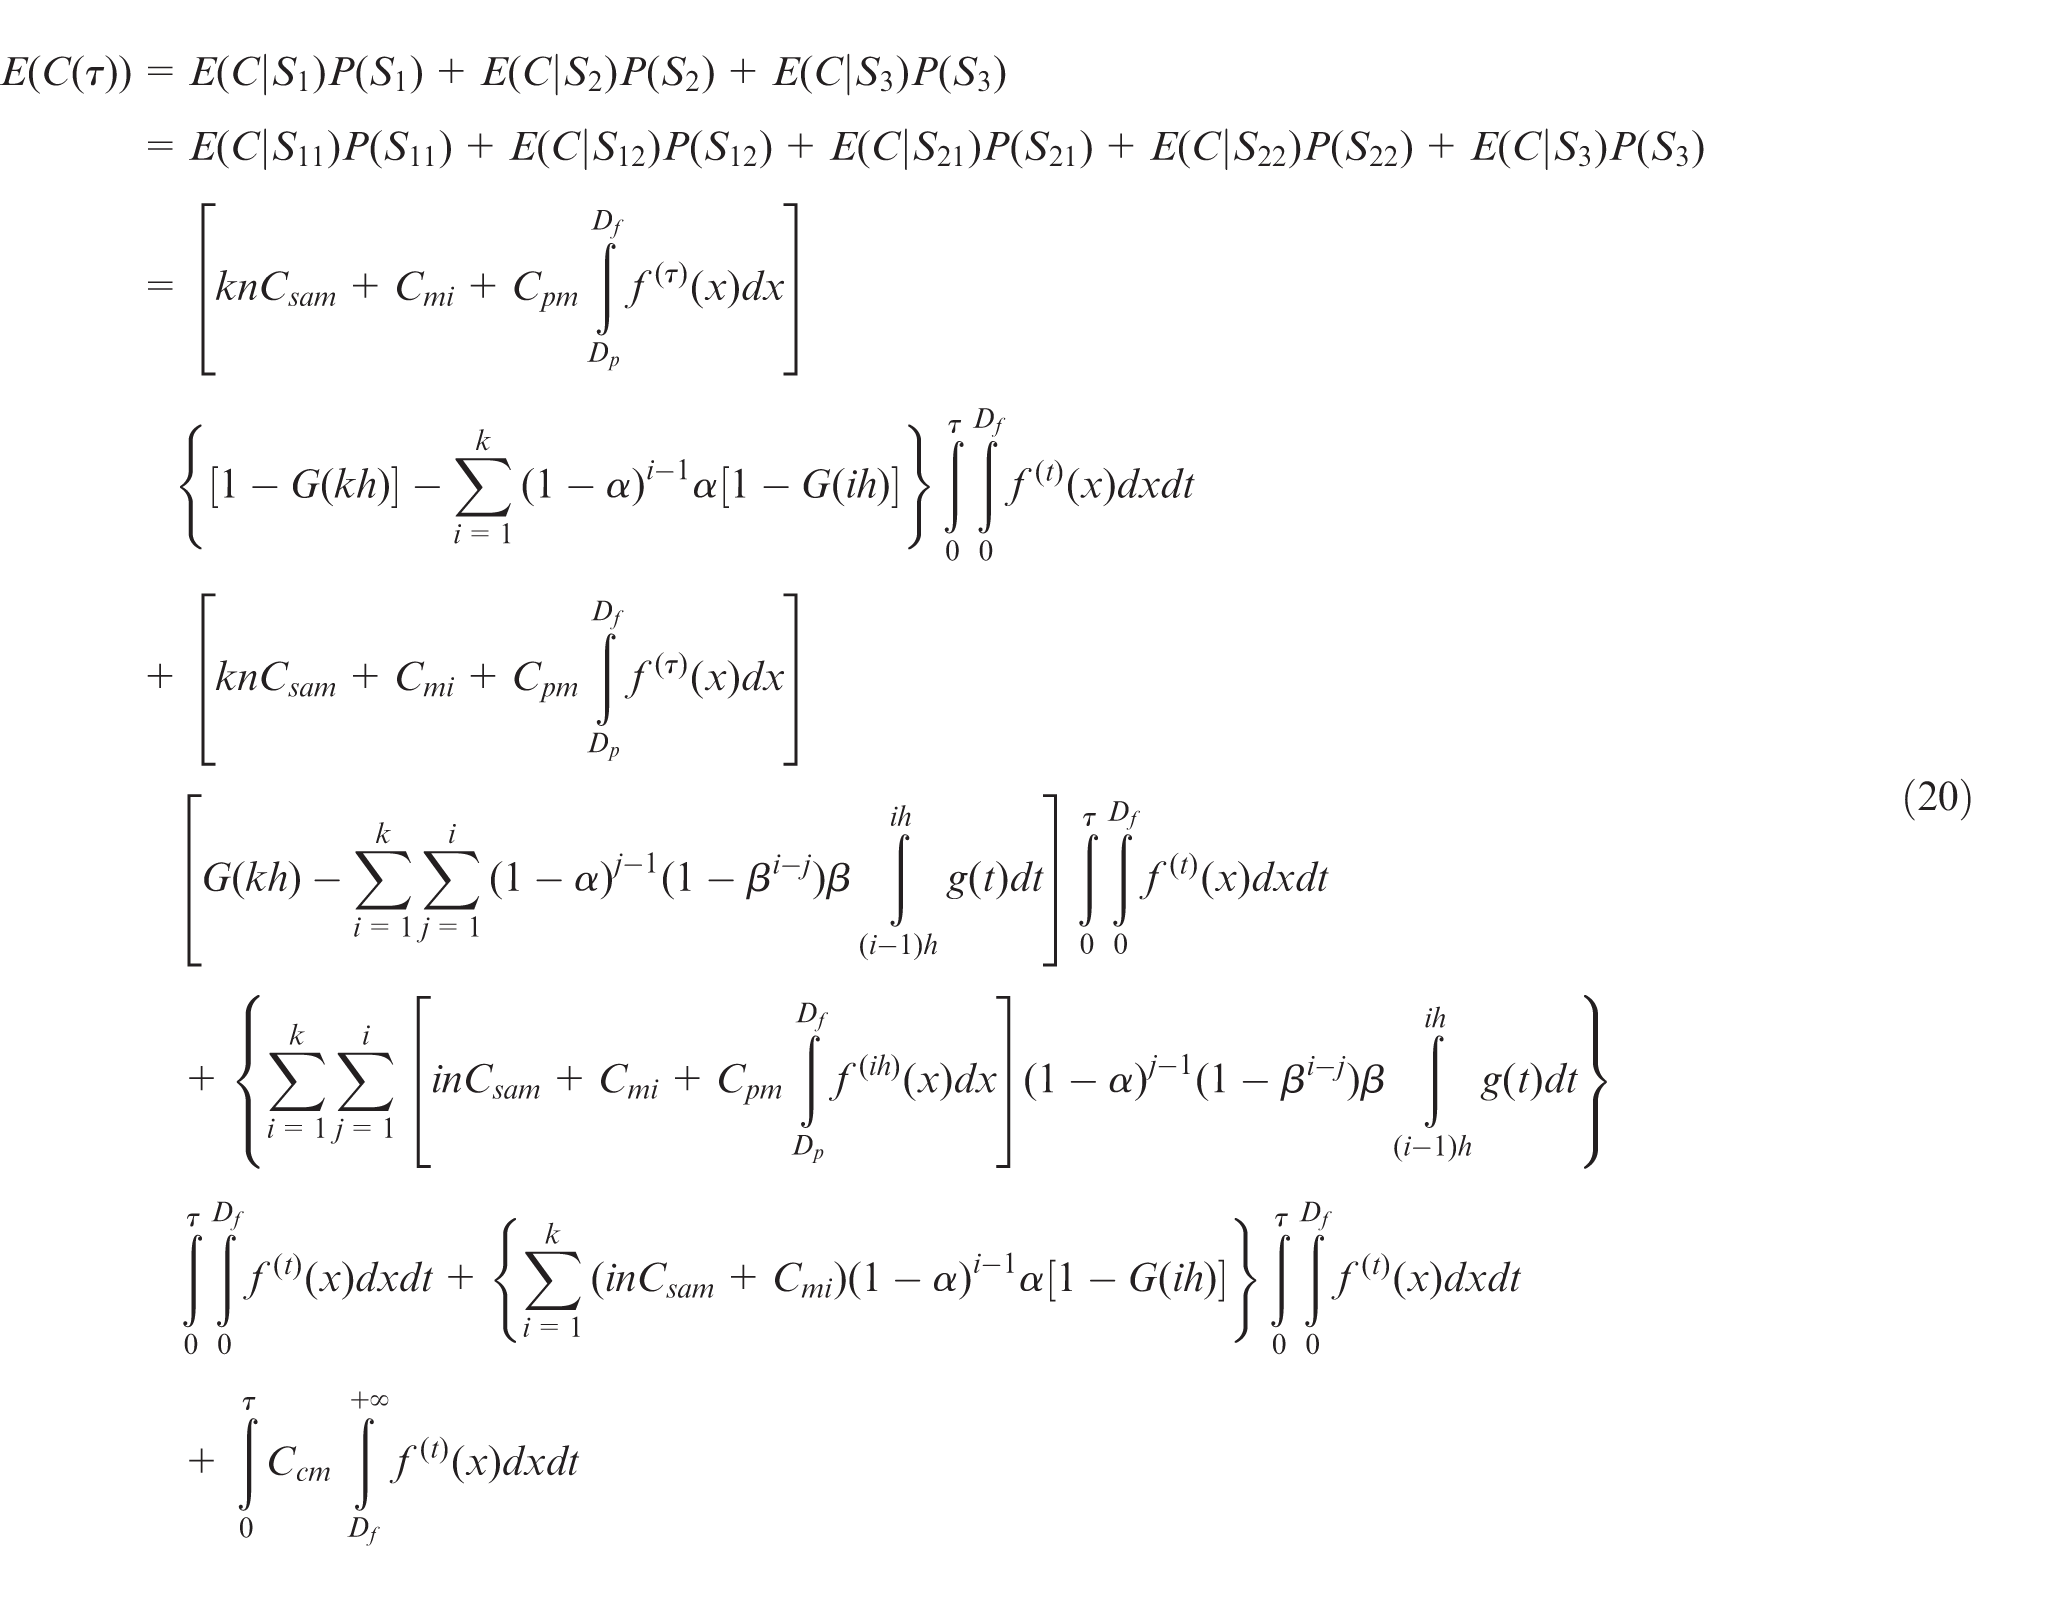
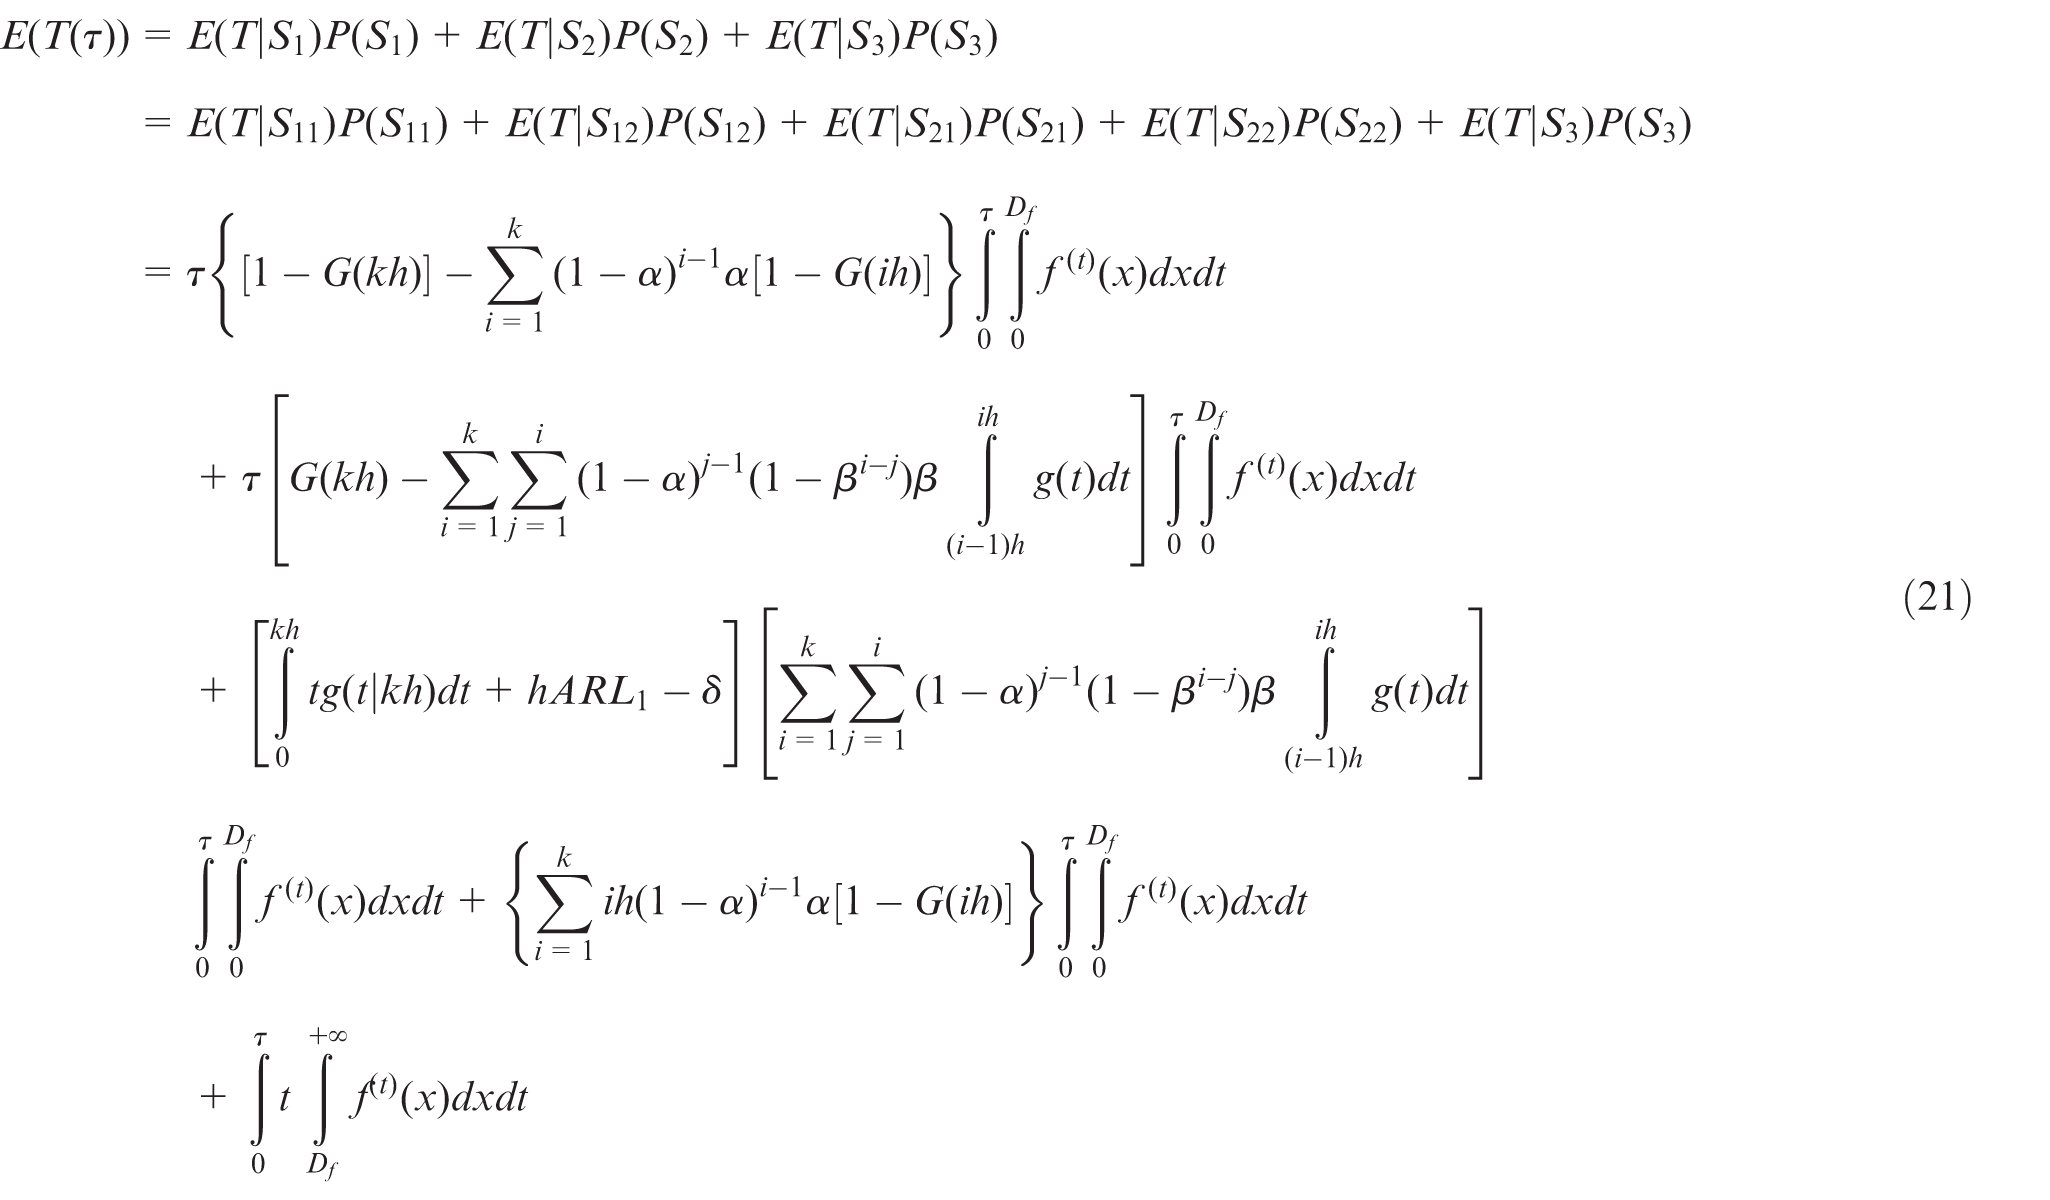
The expected cycle cost and cycle cost of each scenario are expressed as follows.
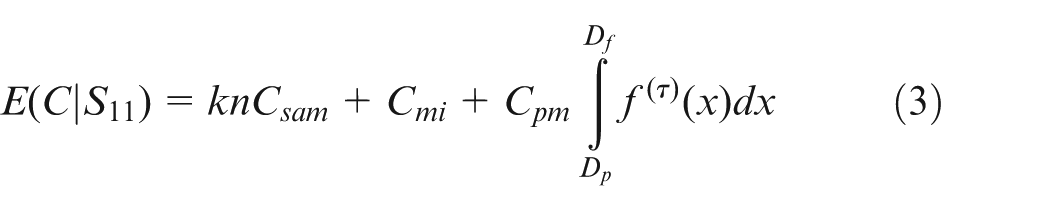
Scenario 1
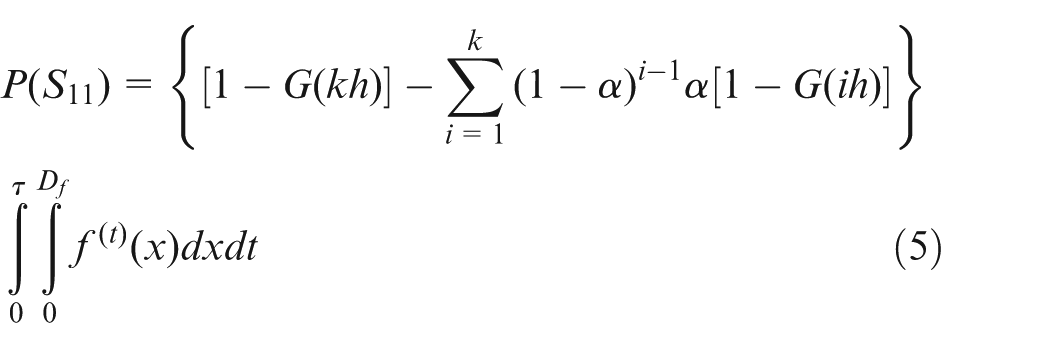
In Scenario 1, the control chart shows that product quality has not shifted to an abnormal state in
1.
In

In view of the precondition of Scenario 1, the probability of this scenario is
2.
In

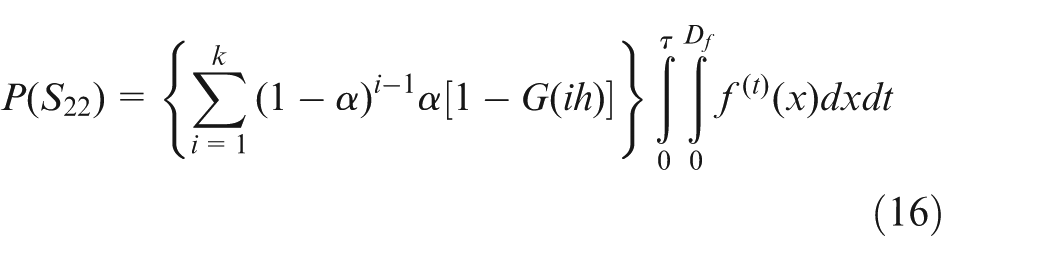
The probability of this scenario is
Scenario 2
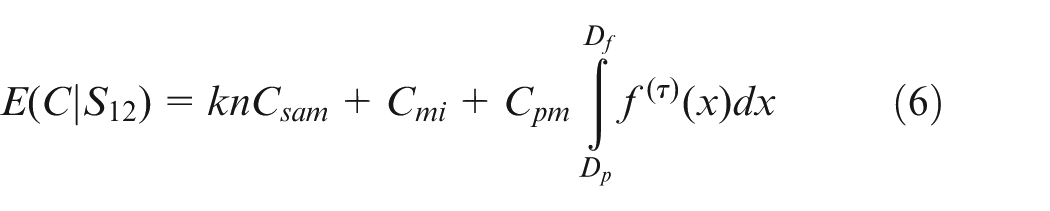
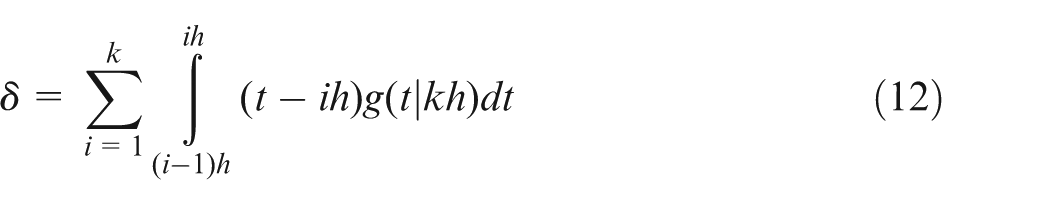
In Scenario 2, the control chart shows that the abnormal shift of product quality occurs at the
1.
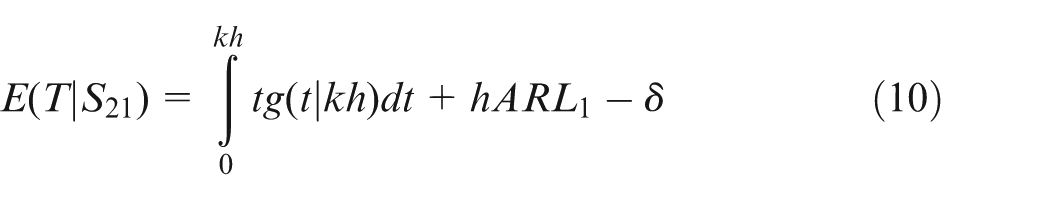
where
and
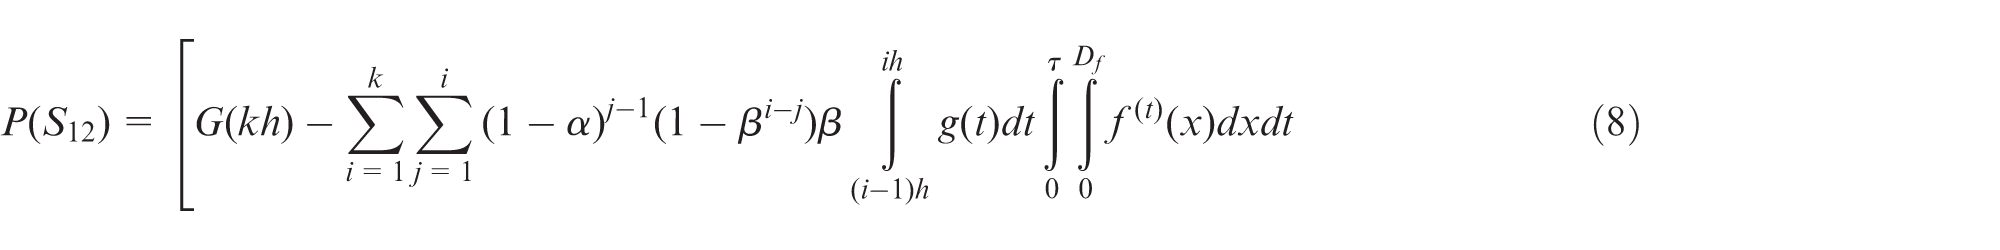
The probability of this scenario is
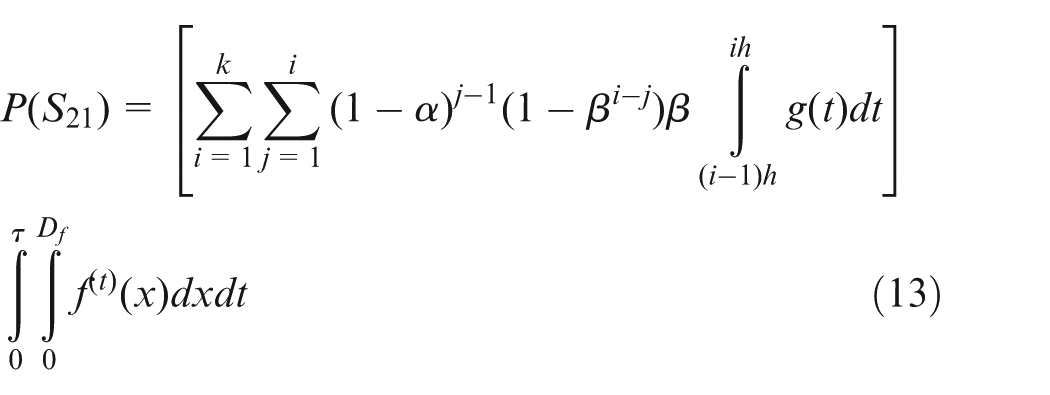
2.


The probability of this scenario is
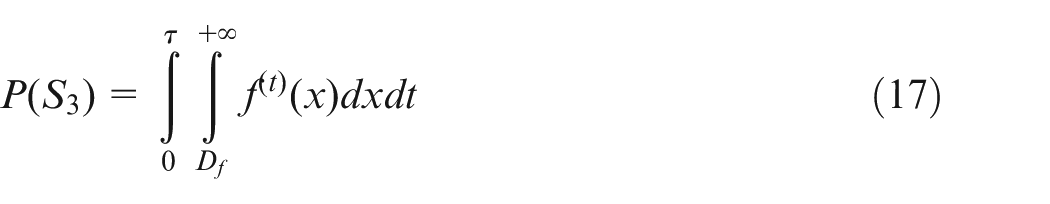
Scenario 3
In Scenario 3, the equipment has stopped because of a sudden breakdown. The probability of this scenario is
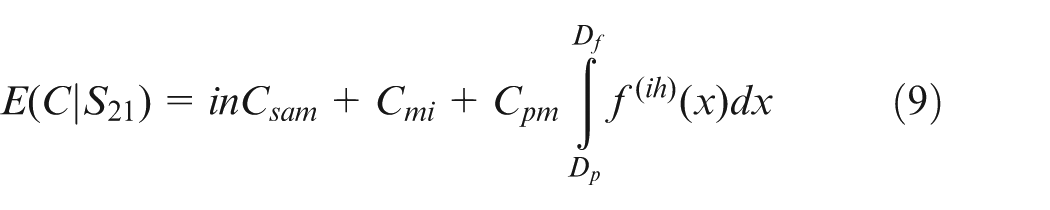
Its average cost and time are respectively


According to the cost analysis of all scenarios, the total average cost and total average time are
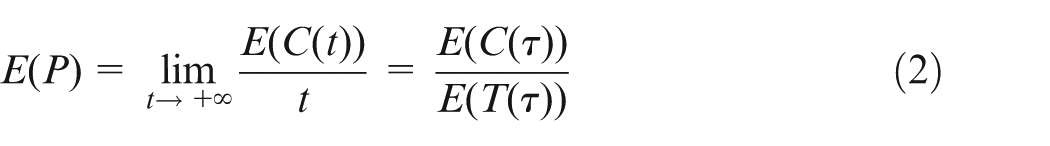
The goal of the maintenance policy is to minimize the average cost rate. The objective function is shown in equation (2). According to the defined hypothesis, there are five factors influencing the average cost rate: the quality sample size
Simulation and analysis
Deterioration is regarded as a time-dependent stochastic process. The deterioration process is assumed to evolve as a gamma stochastic process. Therefore, the random increment follows a gamma probability density, 16 with shape parameter v and scale parameter u
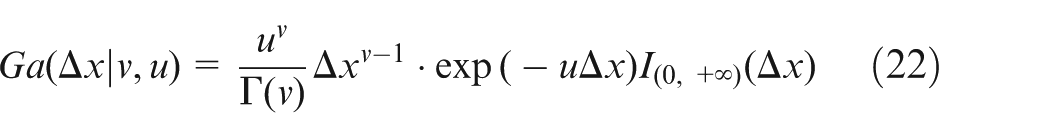
where
Let T be the time at which the deterioration level of the equipment reaches w; it is defined as
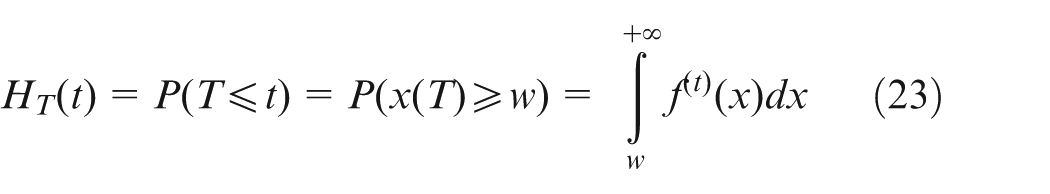
Using the gamma function, the probability distribution function becomes
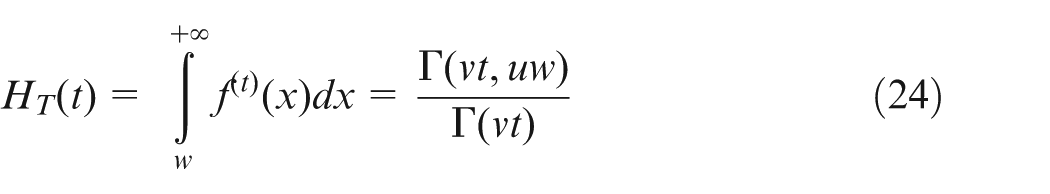
where
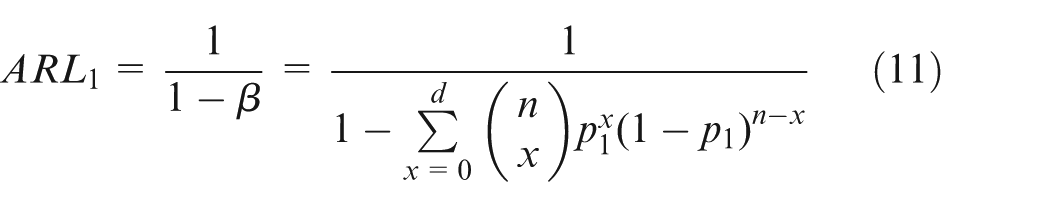
The number of defective units is assumed to follow a binomial distribution and the np-chart is applied to estimate the shift of product quality. The probability of type I error
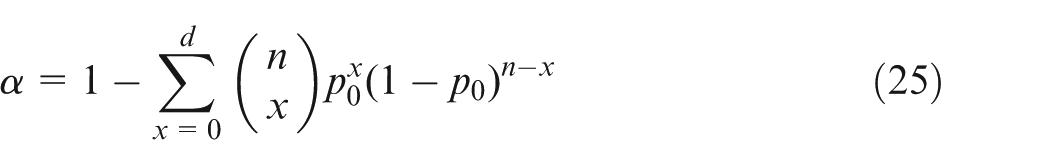
The probability of type I error β is
The time of the product quality shift follows a Weibull distribution, and its probability density function

The Weibull cumulative distribution function

Numerical simulation
To validate the feasibility of the proposed model, the range of the decision variables is given as
The following parameters are fixed. The shape parameter and the scale parameter are set as
Genetic algorithm was introduced by John Holland at the University of Michigan. Its idea is to simulate the mechanics of natural evolution and genetics.
17
It is known that genetic algorithm has the characteristic of its potential for parallelization and global optimization. Since genetic algorithm is first proposed as an optimization tool for maintenance scheduling activities by Munoz, it began to be widely applied in maintenance field. Recently, genetic algorithm has been proved to be an effective approach for maintenance optimization problems.18–20 In this article, genetic algorithm is used to solve the proposed model. Let the population size be 20, the crossover probability
Optimal objective function value and the best values of five variables.
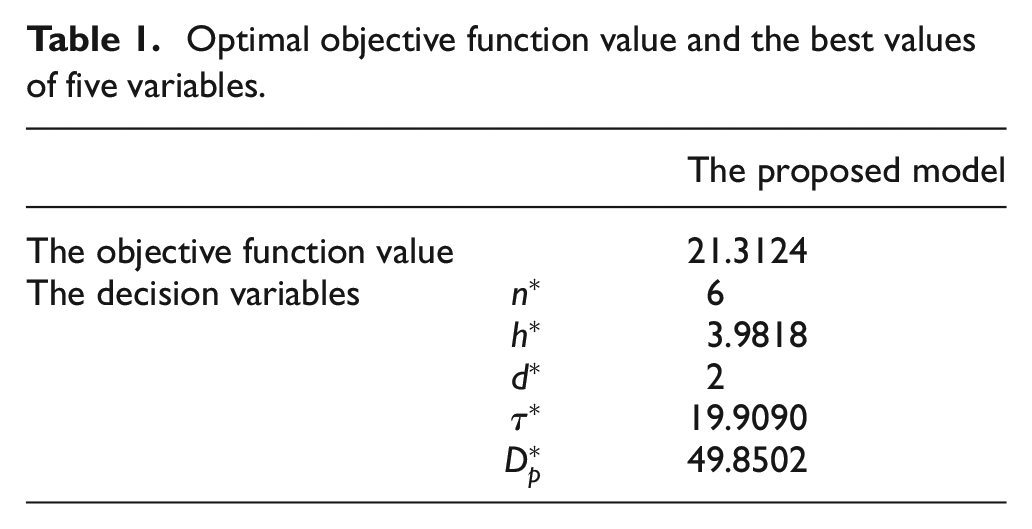
Table 1 shows the optimal objective function value and the best values of the five variables as produced by genetic algorithm.
Figure 2 shows that the average cost rate decreased as the number of generations increased. The optimal maintenance solution was found by genetic algorithm within 200 generations.
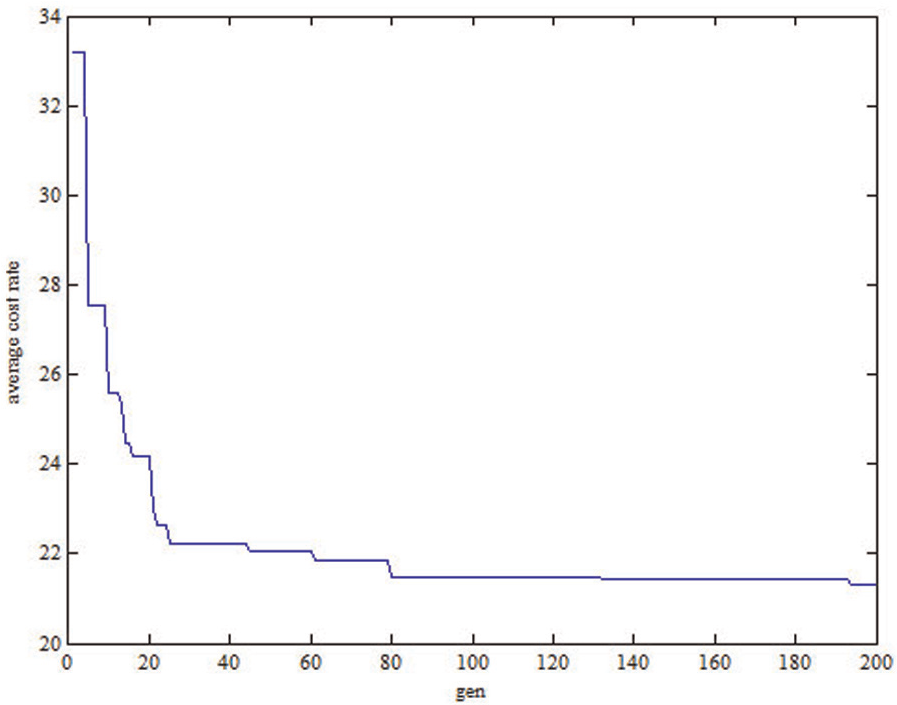
Convergence of the average cost rate over generations of genetic algorithm.
Figure 3 shows the effects of variable on the average cost rate. Figure 3(a)–(e) suggests that the five decision variables
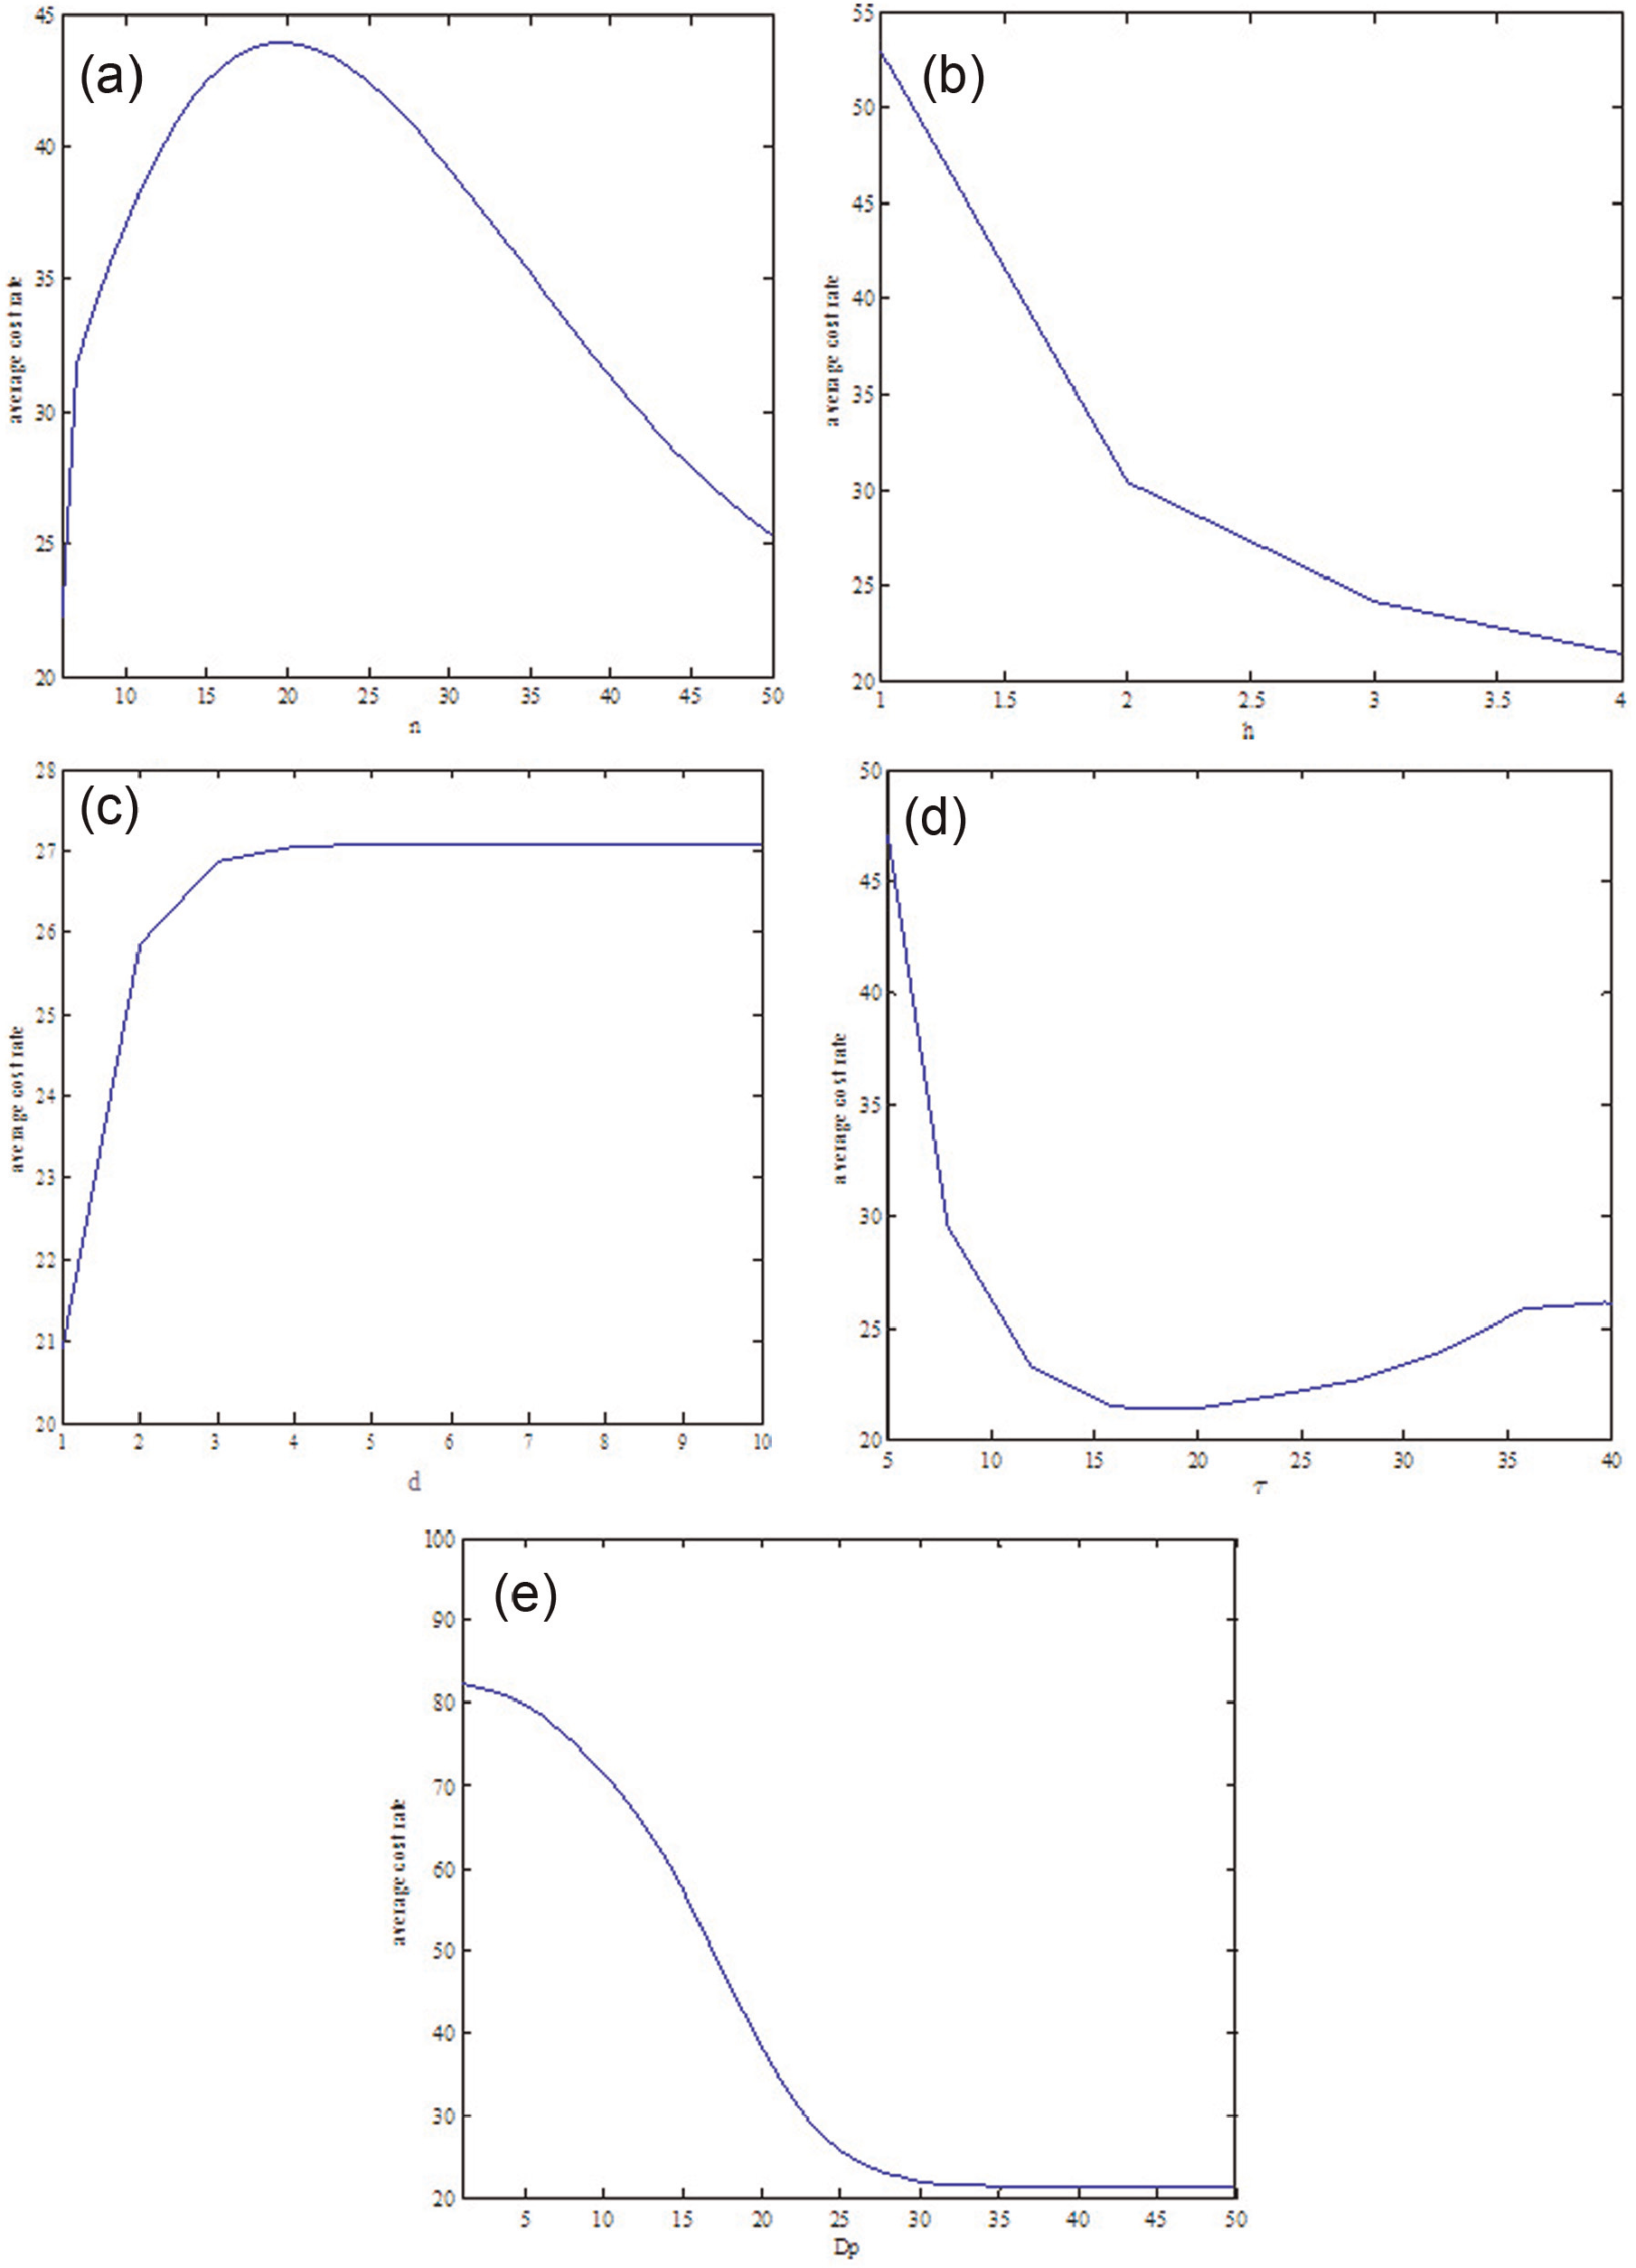
Effects of variables on the average cost rate: (a) effect of n on the average cost rate, (b) effect of h on the average cost rate, (c) effect of d on the average cost rate, (d) effect of τ on the average cost rate and (e) effect of Dp on the average cost rate.
Sensitivity analysis
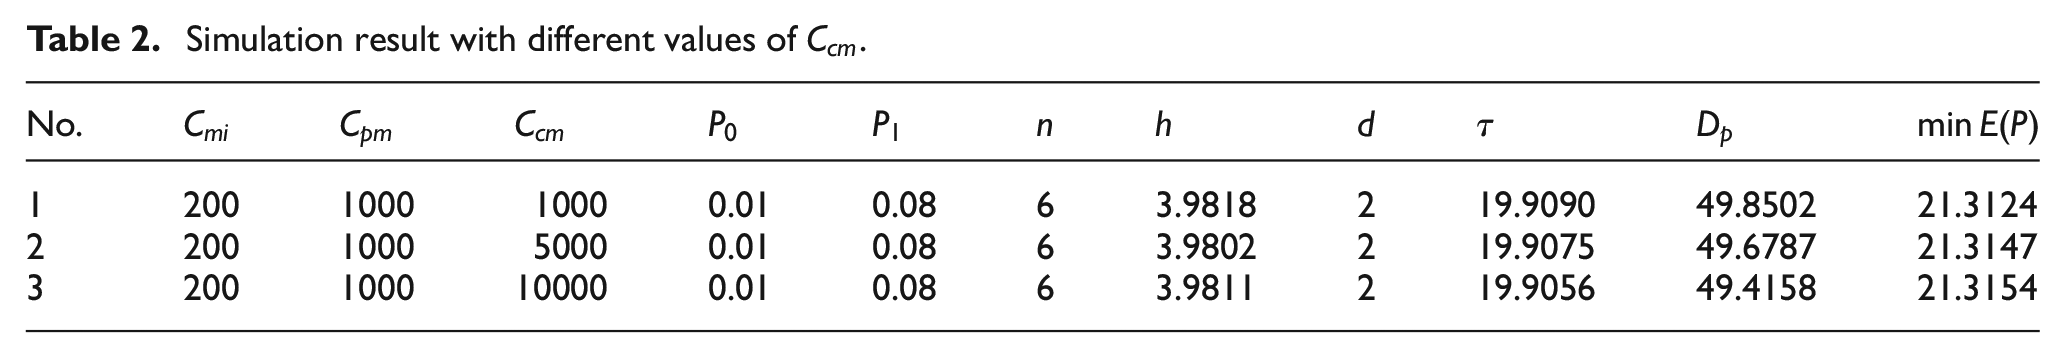
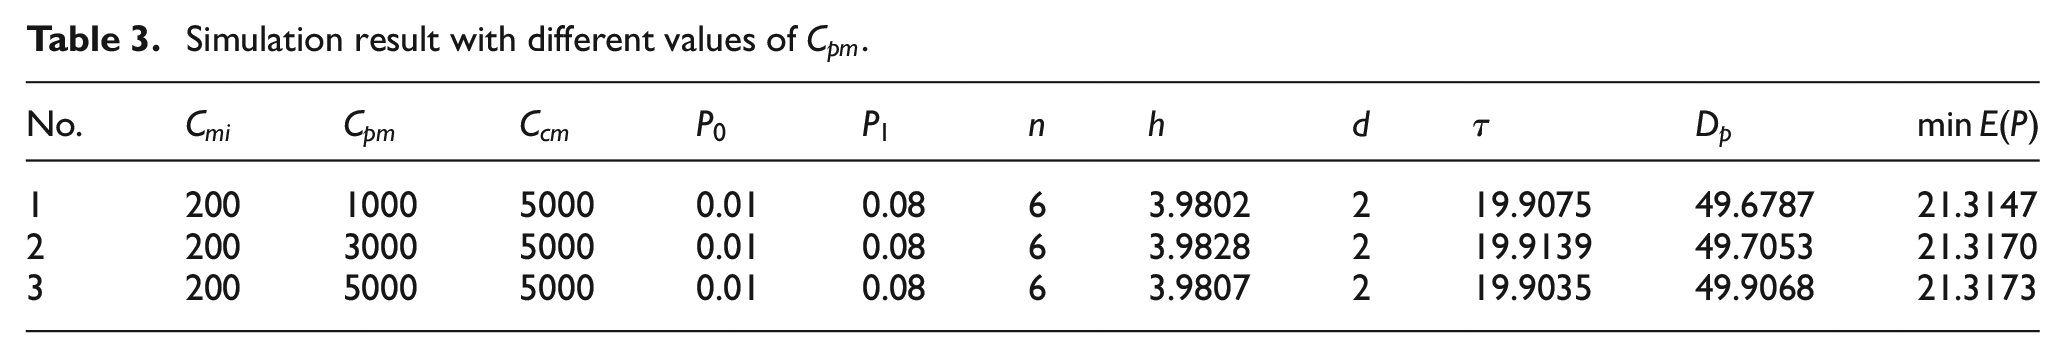
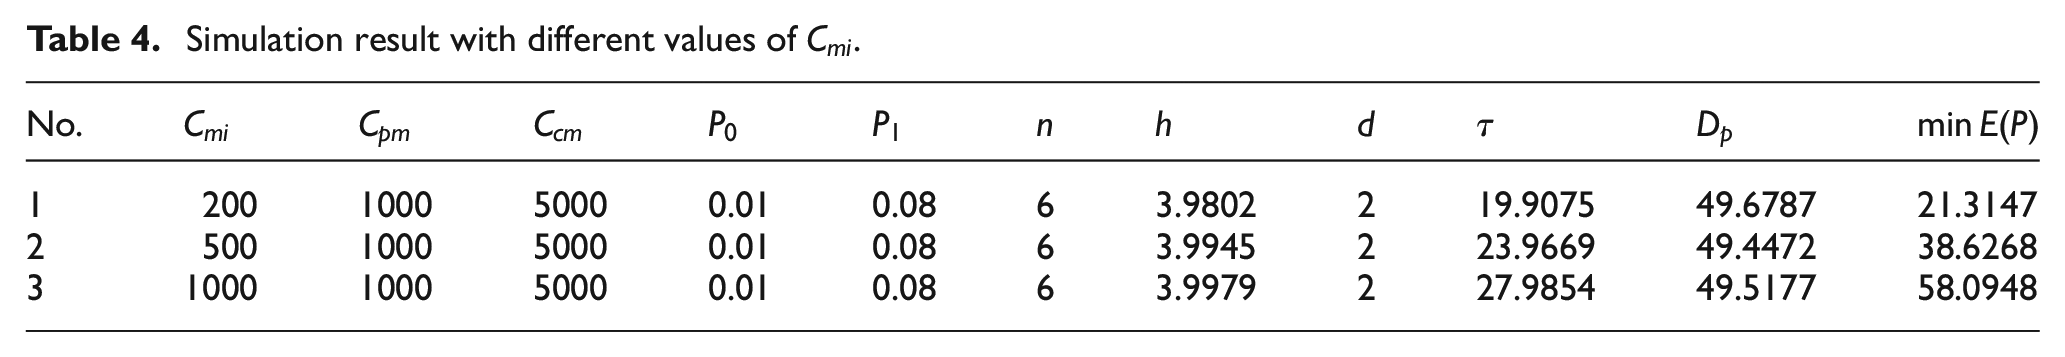
To evaluate the influence of every cost parameter and the defective rate in the result of the proposed model, sensitivity analysis is listed in Tables 2–6.
Simulation result with different values of
Simulation result with different values of
Simulation result with different values of
Simulation result with different values of

Simulation result with different values of
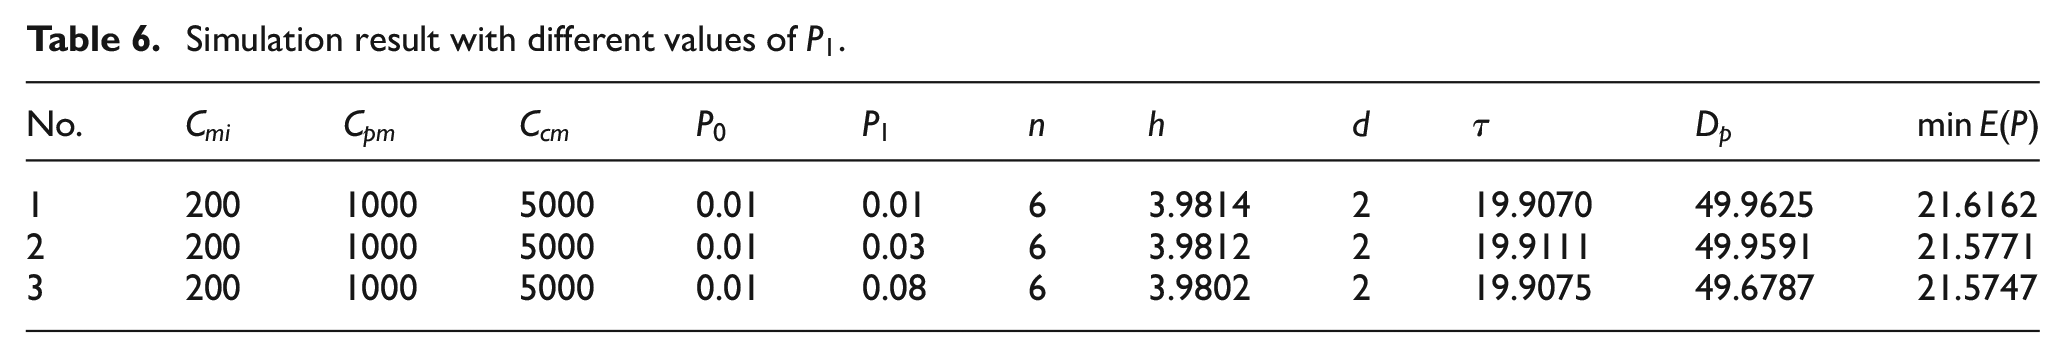
Table 2 shows that with the increase in the CM cost, the optimal PM threshold will decrease and the optimal equipment inspection interval will shorten. This implies that if the CM cost increases, the PM threshold should be reduced or the equipment inspection interval should be reduced. This method is helpful to reduce the probability of equipment failure.
From Table 3, the PM threshold will increase with an increase in the PM cost. This indicates that if the PM cost increases, the PM threshold should be increased to reduce the frequency of equipment maintenance.
In Table 4, the equipment inspection interval will lengthen with an increase in the equipment inspection cost. This indicates that if the equipment inspection cost increases, longer the equipment inspection interval should be extended to reduce the frequency of equipment inspection.
From Table 5, the quality inspection interval will lengthen with an increase in
Table 6 shows that the quality inspection interval will shorten with an increase in
Application example
The proposed model was applied to an automotive part manufacturing company. This company produces plastic car parts, such as auto clips and plastic rivet. They are produced by an injection moulding machine, which operates continuously. In the manufacturing processes, n samples were taken and product quality was inspected every h hours. The deterioration of the injection moulding machine occurred over time and its state was inspected periodically. As the major component, the screw was usually used to determine the deterioration state of the injection moulding machine.
21
The normal clearance between the screw and barrel of this injection moulding machine was limited to the range
With the above parameters and using genetic algorithm to solve the proposed model, the minimum average cost rate was 0.3376. In the actual production environment, 300 samples were taken and product quality was inspected every
Conclusion
In the manufacturing process, PM is necessary to reduce equipment failure and improve the utilization rate of equipment. According to the correlation between product quality and maintenance, a maintenance policy based on product quality control is proposed in this article. Integrated with the theory of SPC and equipment maintenance, np-chart is used to monitor the shift of product quality in this maintenance policy. The appropriate maintenance action is then decided by combining the monitoring result of product quality and the inspection result of the equipment state. Thus, an optimal maintenance model based on product quality control is proposed using renewal reward theory. This model is solved by genetic algorithm. The simulation analysis of the proposed maintenance model shows that the model is helpful for guiding the operations manager in making suitable maintenance decision. The proposed maintenance policy and model can assist both researchers and machine manufacturers in finding the optimum solution for improving production quality and machine utilization. This research is suitable for application to large production processes using deteriorating single-equipment deteriorating systems. In the future, owing to the increasing complexity of production systems, this research will be extended to the integrated approach of multivariate SPC and maintenance decisions for degrading multi-component systems.
Footnotes
Appendix 1
Declaration of conflicting interests
The author(s) declared no potential conflicts of interest with respect to the research, authorship, and/or publication of this article.
Funding
The author(s) disclosed receipt of the following financial support for the research, authorship, and/or publication of this article: This project is supported by the National Natural Science Foundation of China (No. 61573250) and the Postdoctoral Science Fund of Taiyuan University of Science & Technology (No. 20142018).