
Abstract
Ultra-precision raster milling induces phase changes and crystal orientation changes of Zn-Al alloy at its machined surface up to a thickness of several hundreds of nanometers. In this study, the phase change characteristics of Zn-Al alloy at different penetration depths have been discussed using X-ray diffraction and nano-indentation tests. A phase-change-distribution function to depth has been proposed to calculate phase change thickness based on the X-ray diffraction measurement, which was verified by the nano-indentation tests. It is found that phase changes sharply decrease along the penetration depth and the Bragg angle first decreases and then increases back, less than the original value. Significantly, the proposed method is nondestructive to characterize phase change characteristics and measure phase change thickness.
Introduction
Currently, many non-conventional machining approaches have been developed, such as laser machining, 1 magnetorheological finishing, 2 ion beam machining, 3 electrical discharge machining, 4 electrochemical machining, 5 bio-machining6,7 and ultra-precision raster machining (UPRM). 8 UPRM is an advanced manufacturing process for machining non-rotational symmetric freeform surfaces. The surface roughness and form accuracy of a machined surface can be up to several nanometers and a sub-micrometer without the need for any subsequent polishing. The deformation layer is at a thickness of several hundreds of nanometers. Surface integrity plays the role of critical issue. 9
In UPRM, some researchers have focused on studying the effects of various factors on surface generation. Cheung et al. 10 developed a model-based simulation system for prediction of form accuracy in UPRM of optical freeform surfaces, which majorly took into account cutting mechanics, cutting strategies, and cutting kinematics. A theoretical model was proposed by Cheng et al. 11 to predict surface roughness and to optimize cutting conditions (tool tip geometry, spindle speed, depth of cut, feed rate, swing distance, and step distance) and cutting strategies (horizontal cutting and vertical cutting) in UPRM. Kong et al. 12 proposed that cutting conditions, tool geometry, cutting strategies and tool wear take a major impact on surface roughness; cutting strategies, tool path generation and kinematic errors of sliders principally affect form accuracy. Vibration is a key factor influencing surface quality.13,14
UPRM also results in surface property changes further to degrade surface integrity. 15 Zn-Al alloy exhibits good strength, hardness, bearing and creep properties. It is a lightweight alloy suited for the applications of bearings, die-casting and thin wall decorations. Some research has also explored that UPRM induces phase decomposition, micro-structural change, phase precipitation and surface hardening of Zn-Al alloy.16,17 The induced phase changes further affect surface quality. 18
Zhu et al. 17 found that UPRM resulted in plastic deformation and phase decomposition of Zn-Al alloy at a thickness of about 250 nm. However, its phase change characteristics along the penetration depth have not been reported. No nondestructive method has been reported to measure its phase change thickness. X-ray diffraction (XRD) is a potential method, which has been employed to measure thickness of thin films.19–24 In this study, XRD was employed to detect its phase change characteristics at different penetration depths and measure its phase change thickness.
First, XRD with different incident angles was used to scan the machined surface of Zn-Al alloy to analyze its UPRM-induced phase change characteristics at different penetration depths. Second, a phase-change-distribution function to depth was built up to calculate its phase change thickness based on the XRD measurement. Third, nano-indentation was employed to measure its hardness and elastic modulus at different penetration/indentation depths, which was used to identify the theoretical result.
Experimental operations and XRD measurement
Experimental operations
A flat-cutting test was carried out on an UPRM machine (Precitech Freeform 705G, Precision Inc., USA), as shown in Figure 1. The UPRM machine system has three linear axes (X, Y and Z) and two rotational axes (B and C). The natural diamond tool is fixed with the spindle together being set up on the C axis intermittently to cut, and the workpiece is installed on the B axis rotation table.
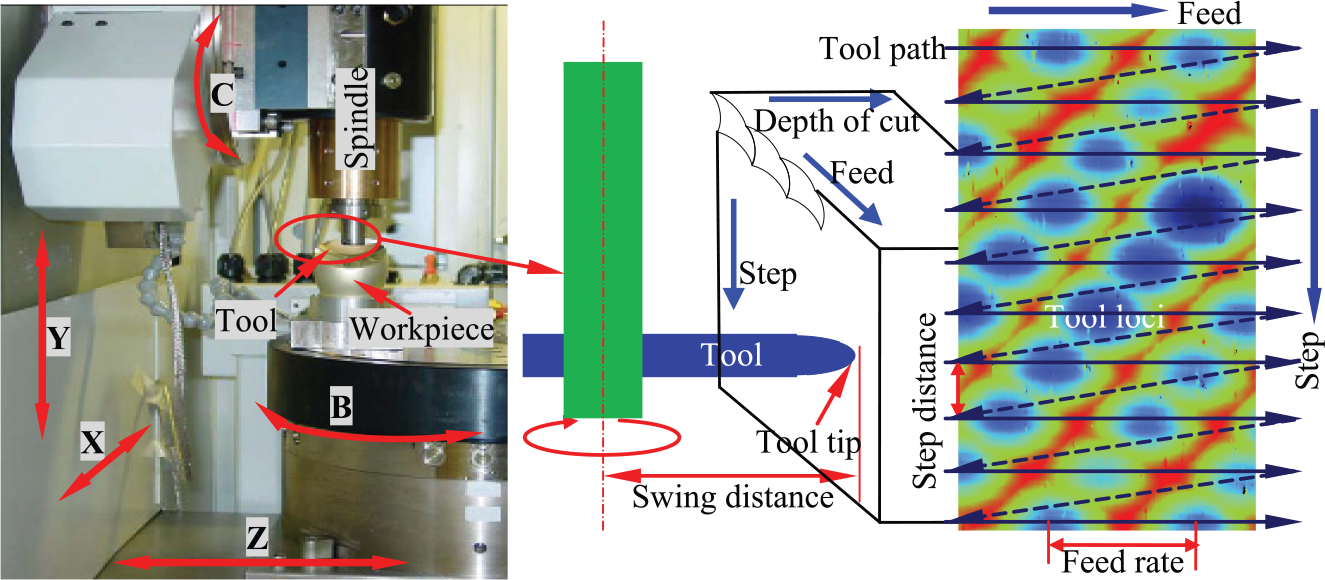
Ultra-precision raster milling with horizontal cutting under up-cutting.
As shown in Figure 1, the surface profile is formed by the repetition of the tool edge profile at intervals of the feed rate along the feed direction and then at intervals of a step distance along the raster direction under cutting conditions by two cutting strategies (Horizontal cutting that the feed direction is horizontal in the X-axial direction and vertical cutting that the feed direction is vertical in the Y-axial direction) under two cutting modes (Up-cutting that the tool cuts in from the new machined surface and cuts out from the un-machined surface and down-cutting reverse). In the flat-cutting test, the cutting strategy is horizontal cutting, and the cutting mode is up-cutting.
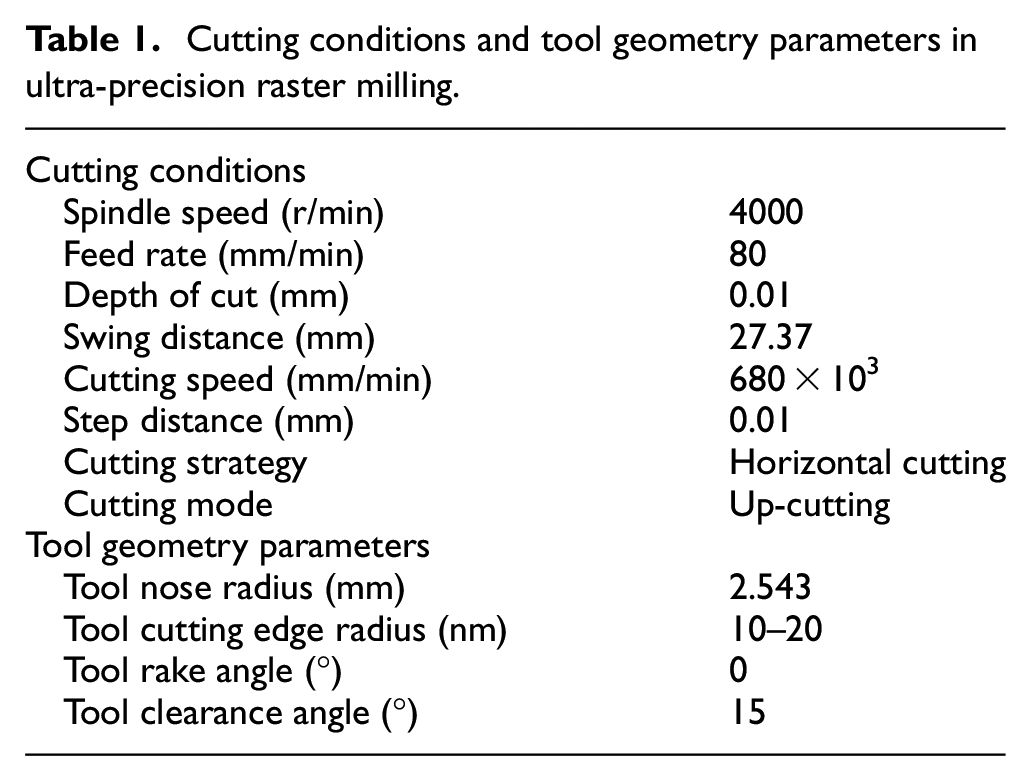
The cutting conditions are listed in Table 1 and the geometry parameters of the natural diamond tool are tabulated in Table 1. The cutting speed is very high up to 680 × 103 mm/min (2π × 4000 r/min × 27.37 mm) and the tool cutting edge radius is about 10–20 nm. The coolant Clairsol 330, mainly comprising petroleum distillates (hydro-treated light, kerosene-unspecified), was used to eliminate cutting heat effect on phase changes of Zn-Al alloy.
Cutting conditions and tool geometry parameters in ultra-precision raster milling.
Two pieces of eutectoid Zn-Al alloy cast ingots 75.3Zn–21.1Al–2.6Cu (wt%) in a diameter of around 12 mm were prepared after solution treated at 350 °C for 4 days and furnace cooled (FC) to room temperature. One was milled under the cutting conditions in Table 1 on the cross section of the cylindrical specimen, and the other was directly scanned by XRD as the standard specimen. At least five times previously raster milling was carried out under the same cutting conditions. Due to cutting force expansion, UPRM would result in a different phase change distribution along the penetration depth, which was further discussed in this study.
XRD was a prime tool to detect the phases of Zn-Al alloy, giving detailed and systematic information. The two specimens were detected, using a Philips XRD with nickel-filtered Cu Kα radiation (λ = 1.5406 Å). The scanning speed was 1°/min. The diffraction range is from 35° to 45° to achieve the strongest XRD with the accuracy of ±0.001°. Nano-indentation tests were carried out on Nano Indenter II (Nano Instruments Inc., Model IIs) with a Berkovich indenter head (a three-sided pyramidal diamond tip) at the tip radius of 200 nm to measure hardness and elastic modulus along the depth. The indentation/penetration depth resolution is 0.04 nm and the load accuracy can be kept as low as 500 µN. The displacements are obtained statistically together with the related loads. For each sample, 13 indentations were made at different points with different loads from 0.07 to 300 mN, which was repeated 10 times to calculate the average values of hardness and elastic modulus. The hardness and elastic modulus to depth were collected statistically, using the multi-measured method.
XRD measurement
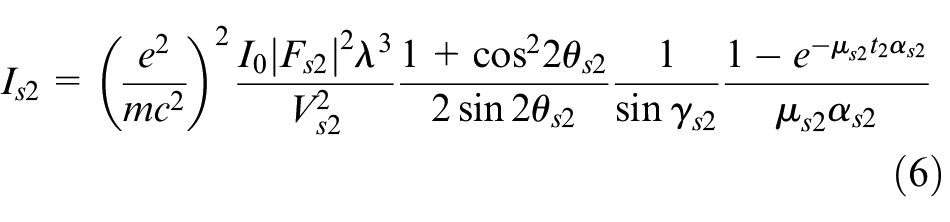
XRD is a powerful tool for phase quantification. 24 Figure 2 shows the Bragg case XRD from one specimen substrate. According to previous works,19–24 the change in the diffractive intensity of the diffracted beam from the specimen at the penetration depth x is described as
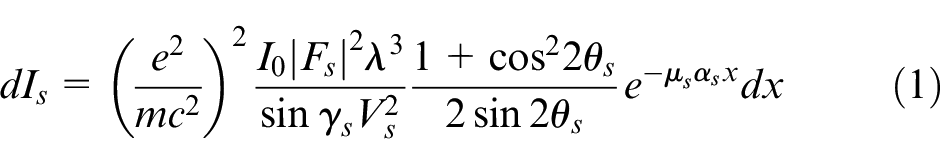
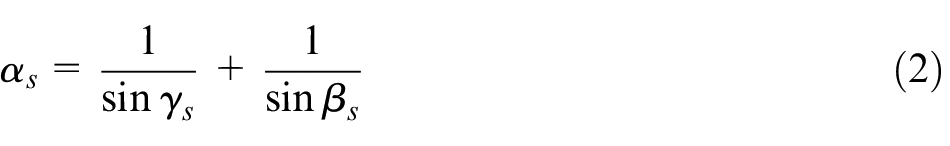

where x is also named the diffractive depth of X-ray in the specimen substrate, µs is the mass attenuation coefficient of the specimen, γs is the incident angle of X-ray, (e2/mc2)2 is the classical electron radius, I0 is the incident X-ray intensity, Fs is the structure factor for the substrate, which is influenced by the crystal orientation, Vs is the unit cell volume of the phase and is influenced by the relative volume fraction of the phase in the substrate, λ is the wavelength of X-ray, Is is the diffraction intensity and θs is the Bragg angle.
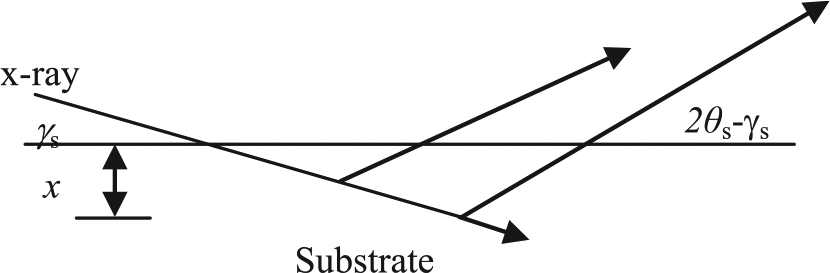
Schematic diagram of XRD from the substrate.
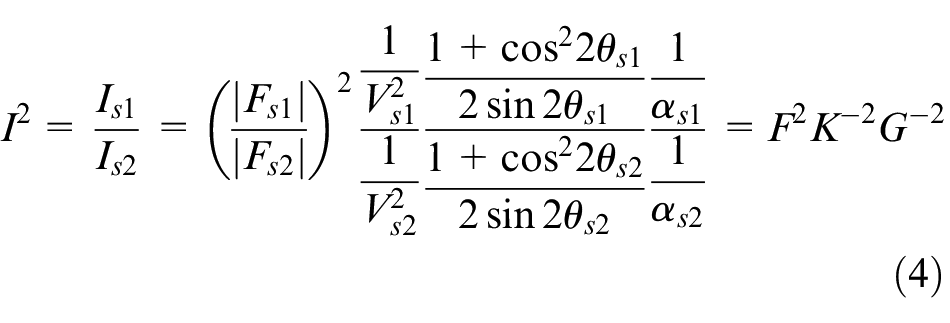
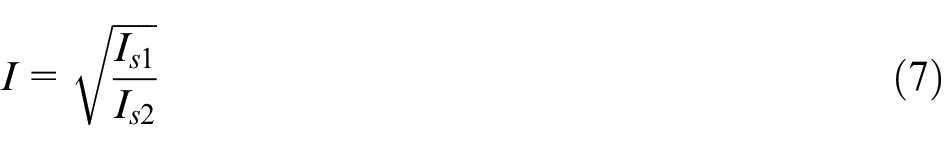
For multi-phase analysis, (Fs/Vs)2 is directly linear to phase quantity, so the relative intensity of one phase to another hints that XRD can be utilized to analyze phase changes for material study. In this study, the Rutherford Back Scattering experiment was conducted to analyze the Zn-Al alloy phase changes induced by UPRM. The phase S1 is the ηT (0002) phase (2θs1 = 36.73) and S2 is the ηFC (1011) phase (2θs2 = 43.31), and then the relative intensity for S1–S2 is described as
where

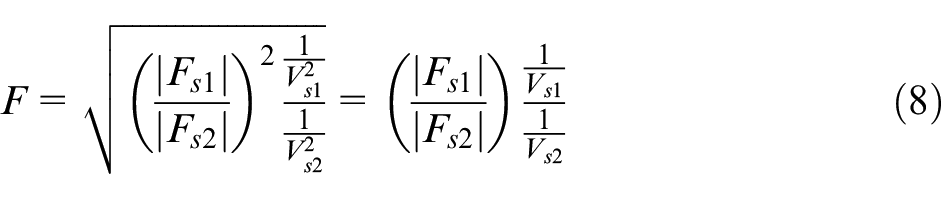
where
The criterion (x = +∞) depends on the sensitivity of the intensity measurements or on what is regarded as the negligible diffracted intensity, that is, dIs(x = t) is further less than dIs(x = 0), which determines the penetration depth (x = t) of XRD for a specimen. Then from equation (1), it is obtained
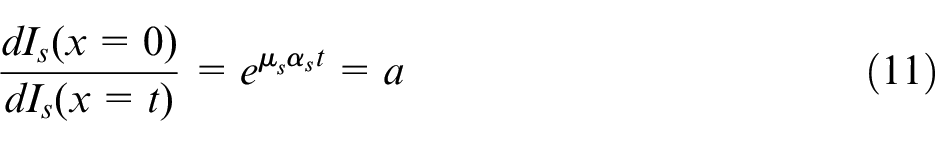
from which, the penetration depth t of X-ray for the specimen, as a function t of the X-ray incident angle γ, is expressed as
where ln a/µs is constant.
Results and discussion
Phase changes
The microstructures of the FC specimens consisted of two lamellar structures: coarse and fine lamellar and various metastable phases α, ε and ηFC formed in the FC alloy specimens. 25 In order to detect phase changes of the Zn-Al specimen, a low-angle XRD at 3° was applied to examine the surface for any micro-structural changes and phase decomposition within a layer of 0.5 µm thickness which is more than the efficient penetration depth for the specimen at the incident angle 3°. Figure 3 shows the characteristic XRD plots of the surfaces of the Zn-Al specimens, which include (0002)ηT/ηFC, (1010)ε, (111)α, (1010)ηT/ηFC, (0002)ε, (1011)ηT/ηFC and ε, and (200)α. The relative intensity is the ratio between any measured intensity and the measured intensity of (1011)ηFC.
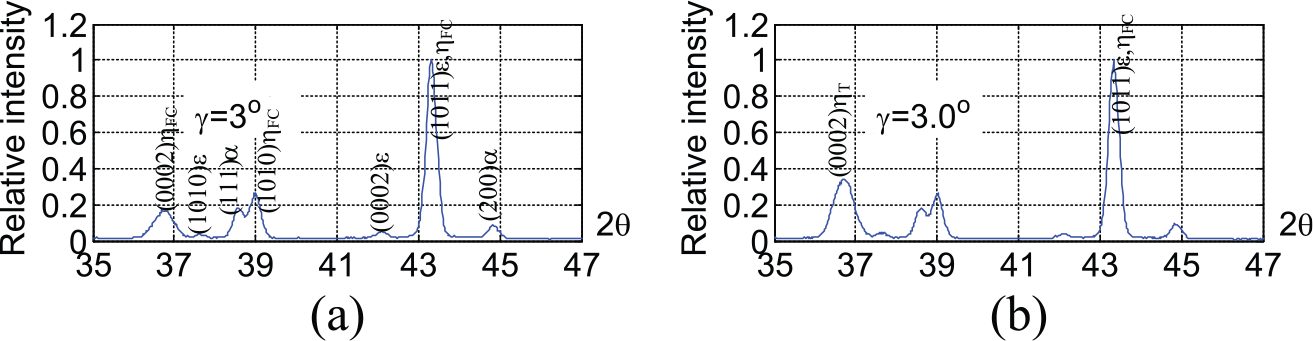
XRD patterns of Zn-Al alloy with an incident angle γ = 3°: (a) the standard specimen and (b) the milled specimen.
Figure 3(a) plots XRD relative intensity of the standard specimen with an incident angle γ = 3°, and Figure 3(b) plots XRD relative intensity of the milled specimen with an incident angle γ = 3°. The evolvement of (0002)ε, (111)α, (200)α and (1010)ηT implies that they are products of a four-phase transformation 26 induced by an external stress during UPRM, where the phase ηFC was transformed to the phase ηT, that is, the metastable phase ηT precipitates from the decomposition of ηFC, according to the paper. 26 It indicates that the relative intensity of phase S1 to phase S2 is related to the phase volume contribution along the penetration depth.
Penetration depth
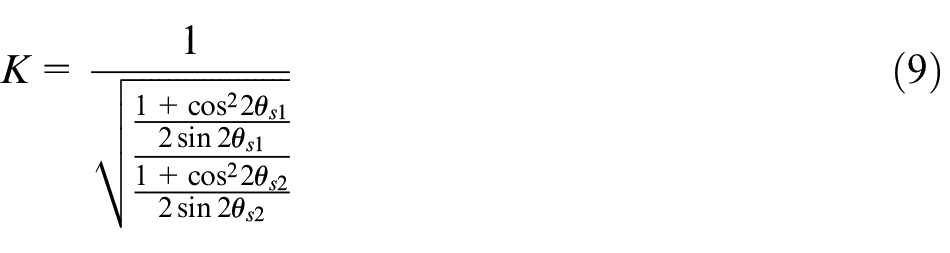
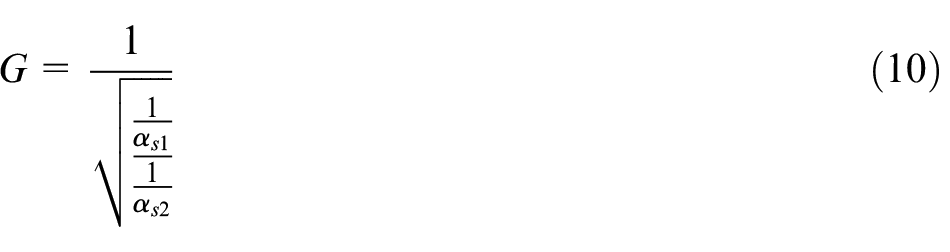
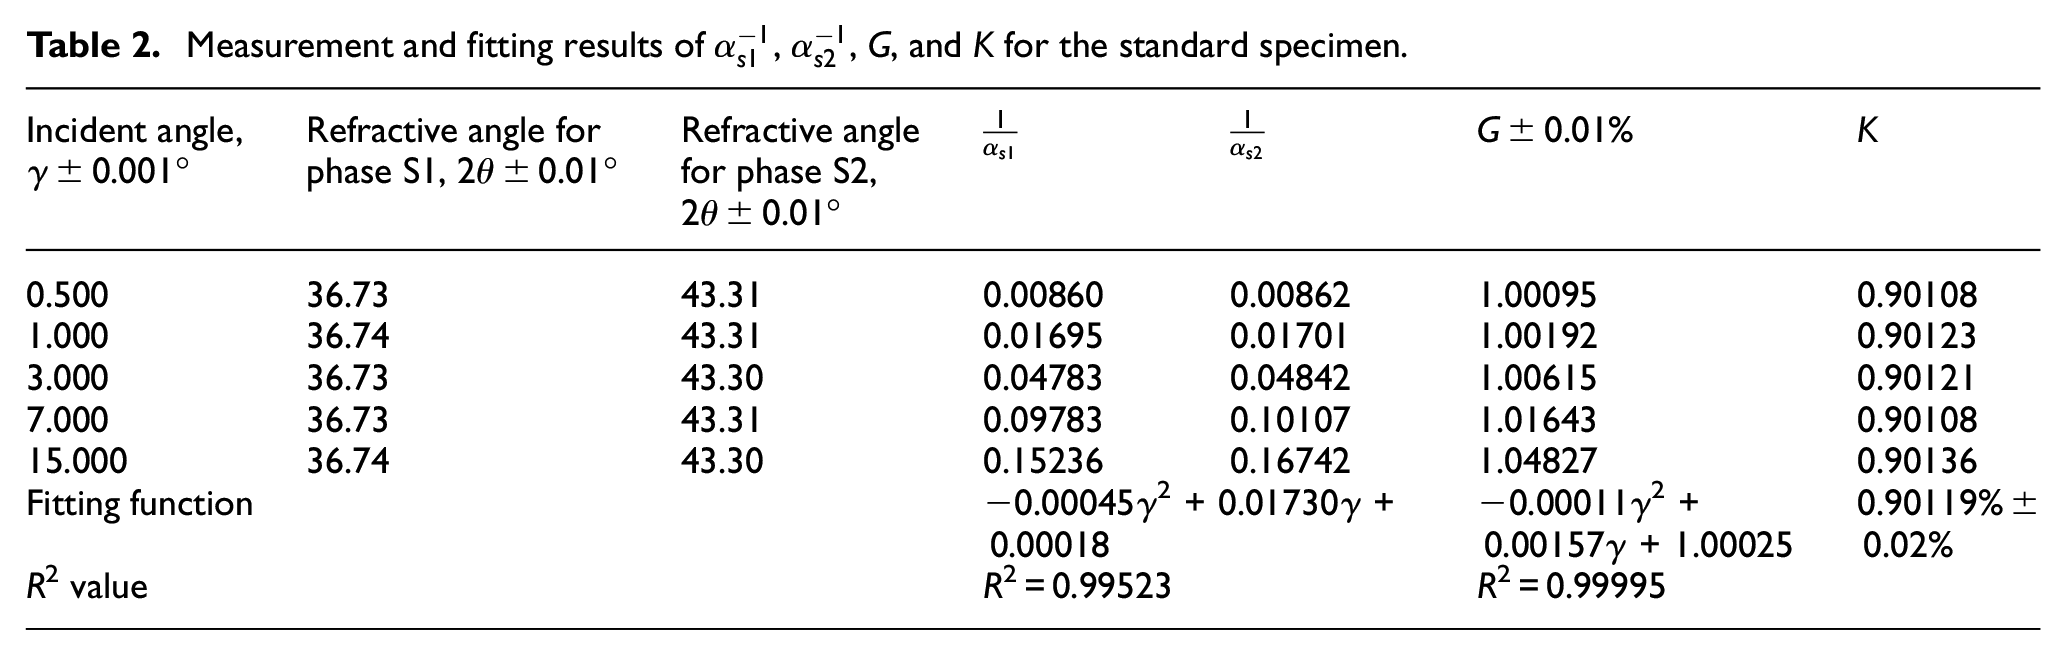
After solution treated at 350 °C for 4 days, the distribution of the phase S1 to the phase S2 in the FC alloy specimen is uniform. According to equation (4), the relative intensity of the phase S1 to the phase S2 is invariable. Using XRD with different incident angles to scan the standard specimen, the XRD patterns of the specimen are shown in Figure 4. It indicates that F is constantly not related to the penetration depth, which is a function of the incident angle as equation (1). The Bragg angles for the phase S1 and the phase S2 are tabulated in Table 2. Since, for the standard specimen, Fs, Vs, θs and µs are theoretically constant, according to equation (4), K and I should be constant, and G is the function of the incident angle γ. According to equations (2), (9) and (10), 1/αs, K and G with each incident angle for the phase S1 and the phase S2 are calculated, respectively, as shown in Table 2.
XRD patterns of the standard specimen with different incident angles γ.
Measurement and fitting results of
According to equation (12), the penetration depths ts1 for the phase S1 and ts2 for the phase S2 are different because the corresponding Bragg angles are not the same. In the experiments, t is only determined by the sensitivity of the intensity measurements and the incident angles. For the low incident angles, the least-square polynomial fitting method is utilized to modify equation (12), which is described as equation (13). Similarly, equation (10) is expressed as equation (14) with R2 values, respectively. R2 varying in the range from 0 to 1 means how well the regression curve matches the observed data. An R2 of 1.0 indicates that the regression curve perfectly fits the observed data
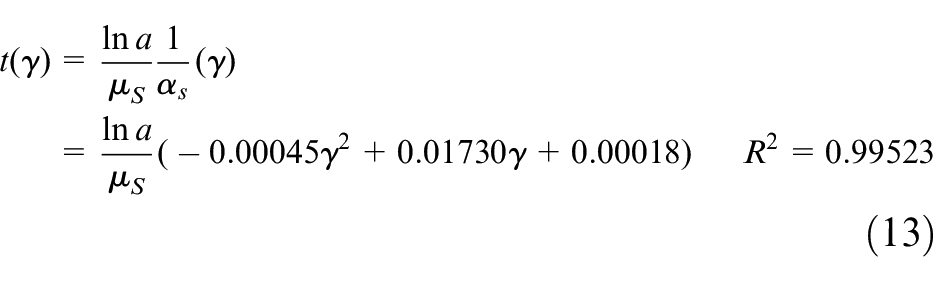
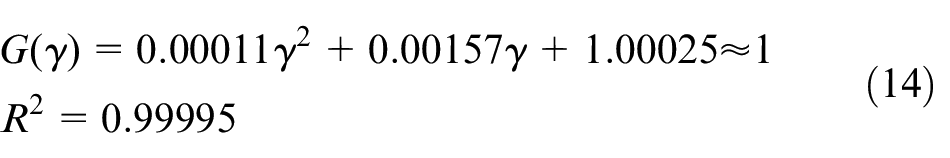
Table 2 shows the polynomial fitting of 1/αs to γ for the phase S1 and the phase S2 with the squared value 0.99523. It indicates that the penetration depths for the phase S1 and S2 are extremely close. Equation (13) can be sufficiently used to describe the relationship between the penetration depth t and the low incident angle γ for the phase S1 and phase S2. The relationship between G and γ is also shown in Table 2. For low incident angles, the maximal error G(γ) is equal to 0.01%. According to equation (14), I is constant, which is identified by the experimental result of Figure 4. R2 value indicates the fitting contribution. Therefore, for low incident angles, equation (13) with R2 = 0.99901 and equation (14) with R2 = 0.99995 can accurately express equations (12) and (10), respectively.
A film of Zn-Al alloy at the thickness t = 400 ± 20 nm was coated upon the surface of single crystal Cu(111) and XRD was employed to scan the sample at the different incident angles with an increment of 0.1° until the peak of Cu(111) occurred first. The result shows the penetration depth t = 400 ± 20 nm with the incident angle γ = 3° ± 0.1°. Substituting the penetration depth t = 400 nm with the incident angle γ = 3° into equation (13) to calculate the constant parameter ln a/µs, the function of the penetration depth t to the incident angle γ is
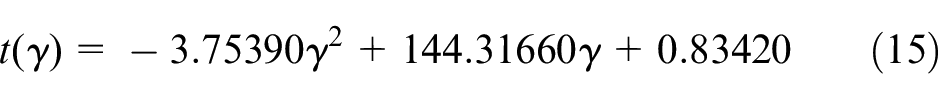
After calibrating, the function of the penetration depth t to the incident angle γ is developed as equation (15). The maximal error of F (deduced from equation (4)) is determined by the errors of I, K and G, which can be computed according to equation (16)
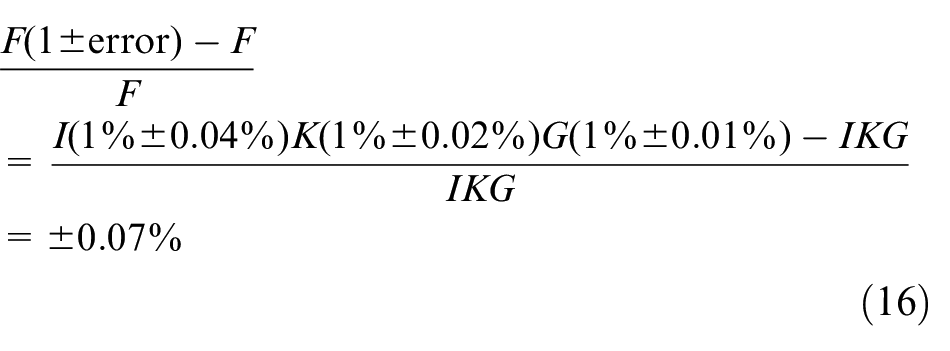
where I is obtained by measuring, which error originates from the measurement instrument, K = 0.90119% ± 0.02%, as shown in Table 2.
Phase change thickness
Figure 4 suggests that the relative intensity of the phase S1 to the phase S2 is stable. It means that I is constant for the standard specimen. When the phase changes take place, the relative quantity of the phase along the depth is different, that is, I is variable. According to equation (4), a relative volume fraction function of the phase distribution F(γ) to the low incident angle γ is expressed as equation (17)
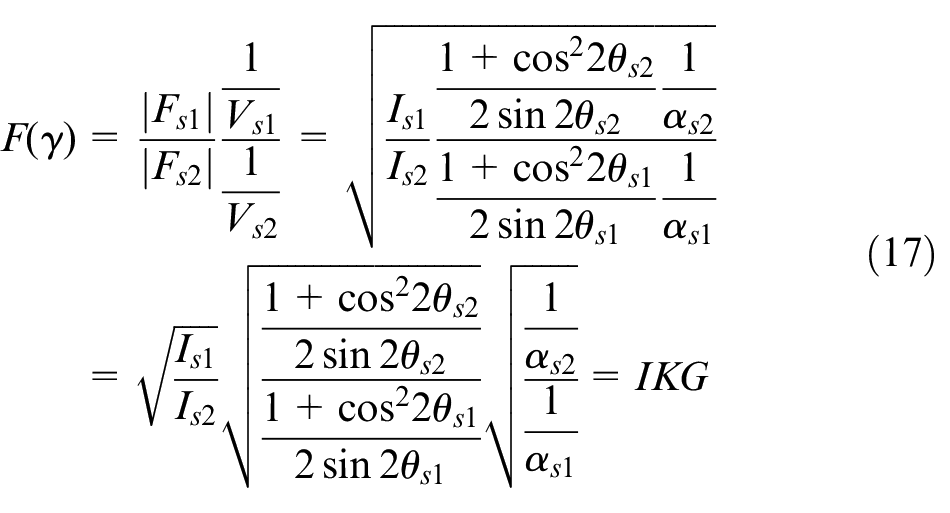
where K = 0.90119, G = −0.00011γ2 + 0.00153γ + 1.0003 = 1 and I is measured as tabulated in Table 3. Hence, the qualitative ratio of the phase S1 to the phase S2 is only related to its relative X-ray intensity. The result is tabulated in Table 3.
Measuring and fitting results of F to t for the milled specimen.
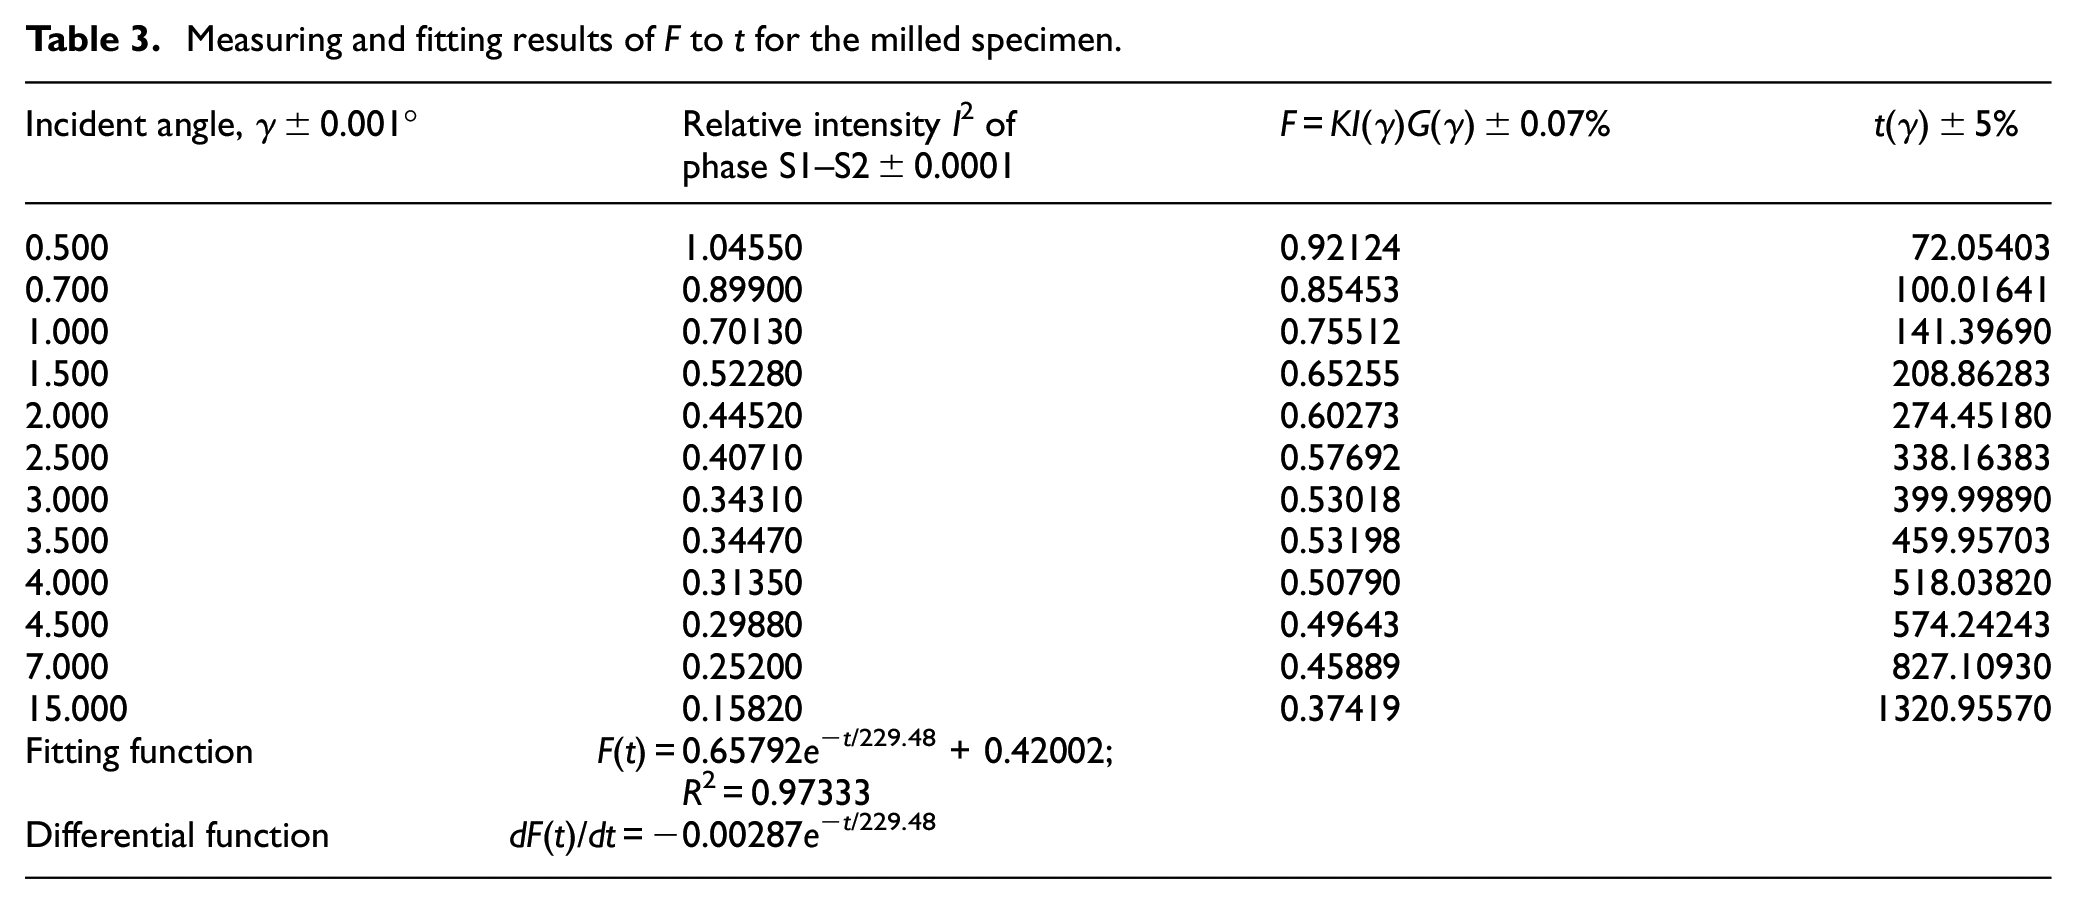
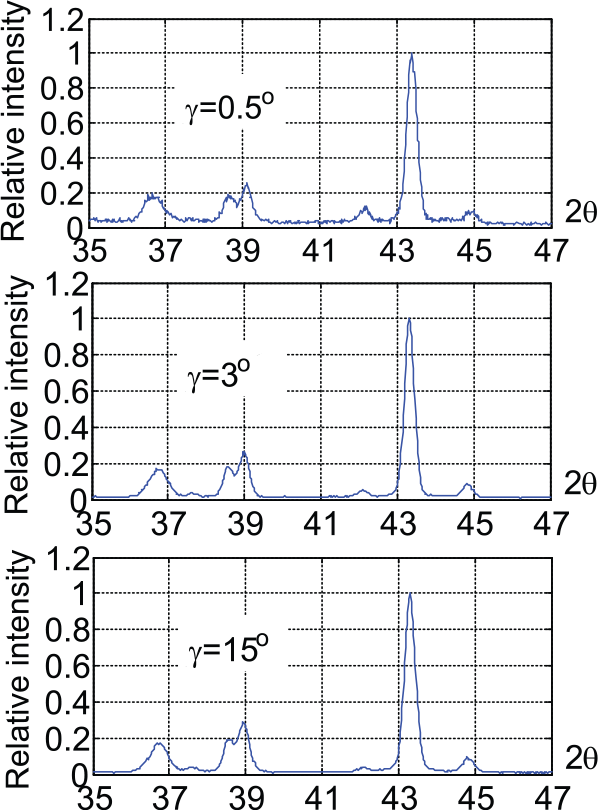
Figure 5 shows the XRD patterns of the milled specimen at different incident angles. The relative intensities of the phase S1 to the phase S2 are tabulated in Table 3. According to equation (15), the penetration depth is calculated as in Table 3. After exponential fitting, the function F(t) is described as equation (18) at R2 = 0.97333. Its differential function dF/dt named as a phase-change-distribution function is equation (19)
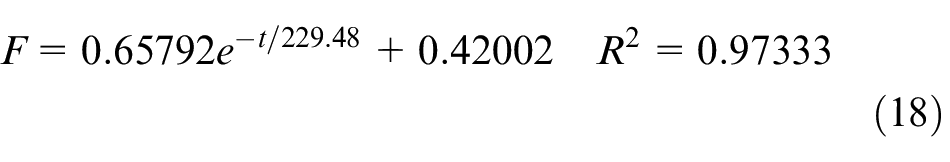
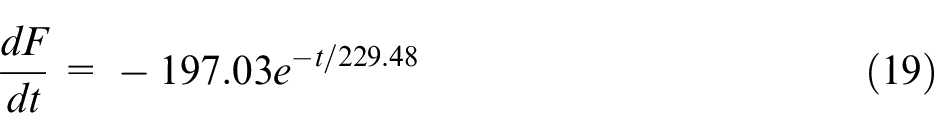
which is used to describe the phase change ratio of the relative volume fraction of the phase distribution to depth.
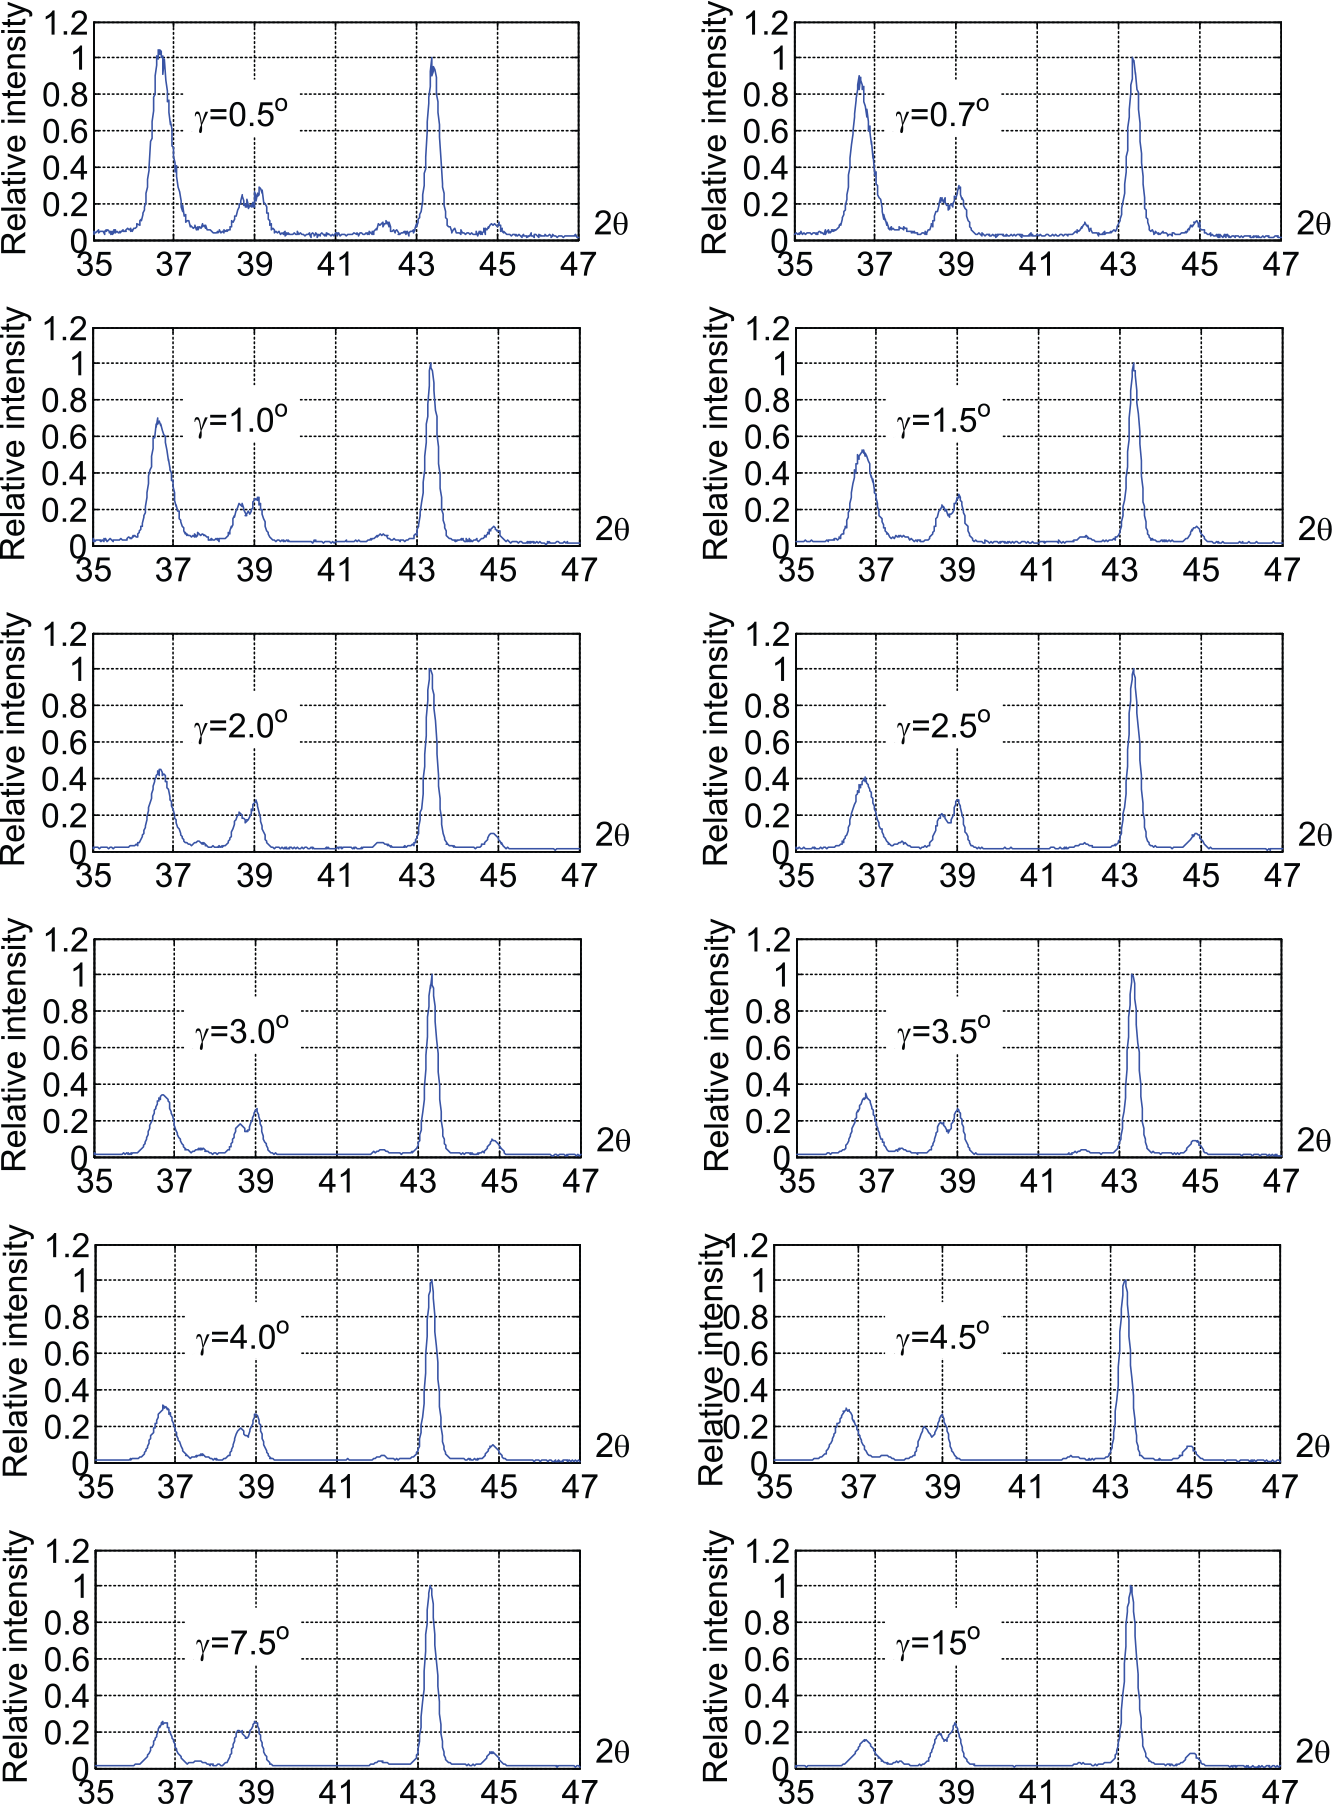
XRD patterns of the milled specimen with different incident angles γ.
Due to the error of F at 0.07%, when the increment of F to depth (i.e. dF/dt) is less than 0.07%, it is considered as the critical condition that the phase changes do not occur. Therefore, the phase change thickness is 323 ± 20 nm at 0.07%. Table 3 also reveals that the phase changes induced by UPRM steeply decreased along the penetration depth at the milled surface layer of Zn-Al alloy.
Preferred crystal orientation and nano-indentation
In Figure 5, the relative intensity of the phase S1 to the phase S2 reduces with the increment of the incident angle γ, as the penetration depth of X-rays is a function to the incident angle. The volume fraction of the phase S1 to the phase S2 decreases along the penetration depth. The XRD results show that the UPRM induced external stresses onto the milled specimens resulted in phase changes. With the increment of the penetration depth, the phase changes decelerated.
From Figure 5, the Bragg angles for the (0002) plane plots in Figure 6. The angle shifts, less than the original value 36.75°, which means that the phase S2 had decomposed to another phase S1. Ultra-precision machining–induced crystal orientation change has been observed in ultra-precision single-point diamond turning.25,26 In addition, along the penetration depth, the Bragg angle first decreases and then increases to the original value, as shown in Figure 6, which was first observed in this study. However, the result has not been found in ultra-precision single-point diamond turning. The main difference is that in ultra-precision single-point diamond turning the cutting speed used in To et al.25,26 is further lower than that in ultra-precision raster milling used in this study. The cutting speed might play a key role in influencing phase changes of Zn-Al in ultra-precision machining. It also indicates that the phase change thickness is around 300 nm, which well matches the calculated value 323 ± 20 nm.
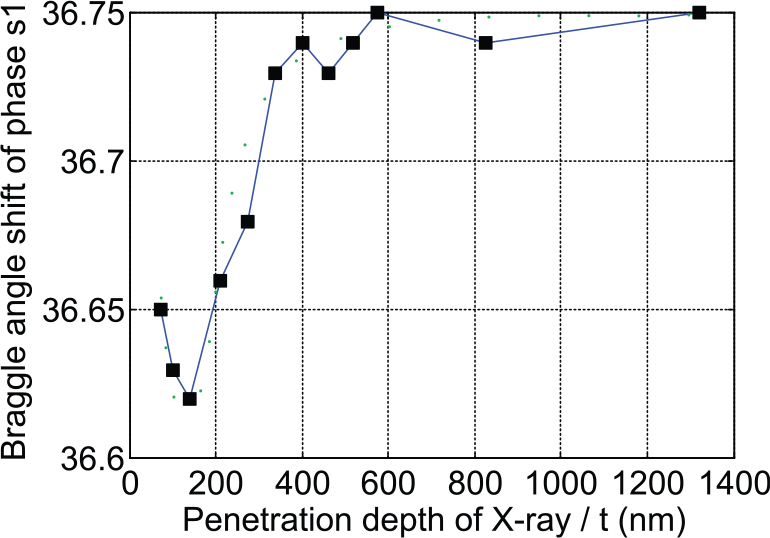
Bragg angles for phase S1.
To assess the phase change thickness left after raster milling, nano-indentation tests were conducted on the machined surface. Figure 7(a) plots the hardness of the milled specimen at different indentation/penetration depths. It shows that the hardness decreases with the depth increment and then it does not obviously change below the depth of about 300 nm. Figure 7(b) shows that the elastic modulus increases with the depth increment, and then it does decrease, where the key watershed happens at the depth of around 300 nm. The very thin layer is found at the milled specimen at the thickness of around 300 nm. The experimental results make a great agreement with the result calculated by the proposed method.
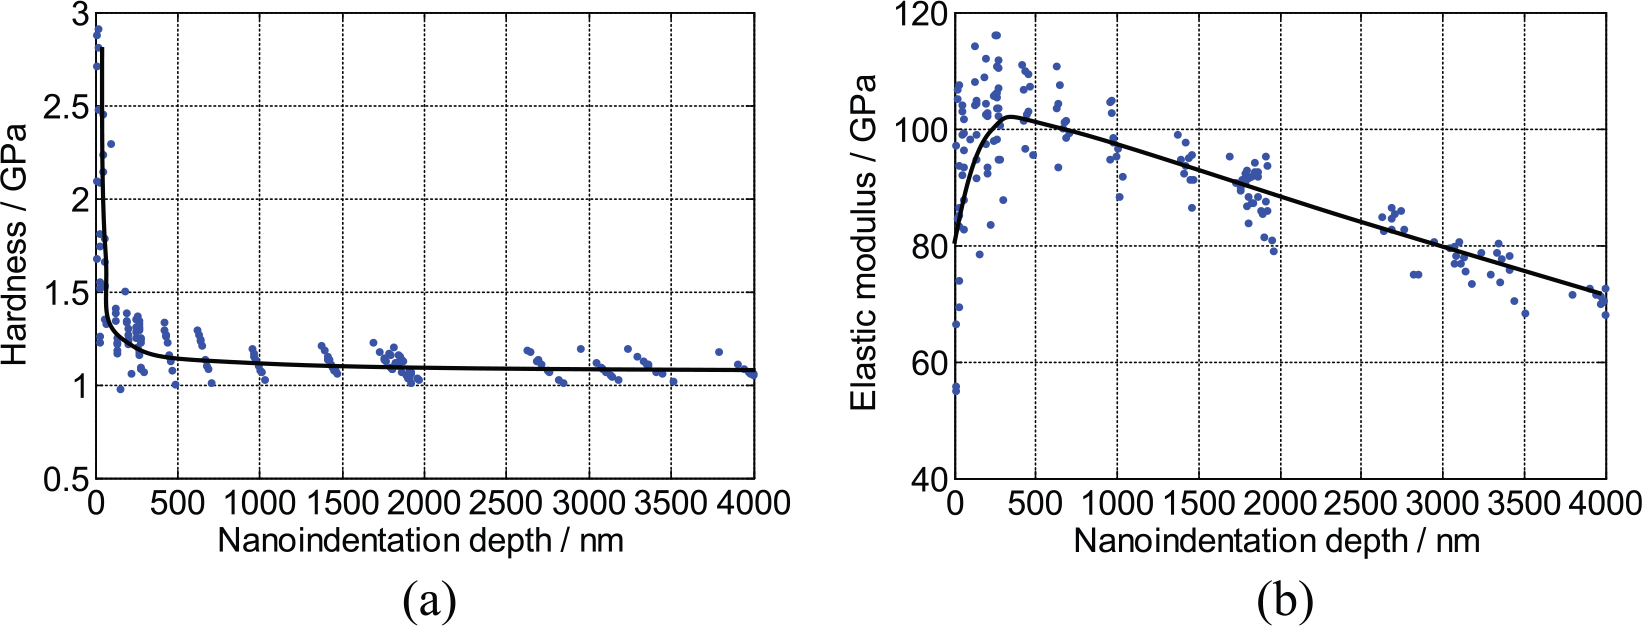
Nano-indentation tests of the machined specimen: (a) hardness and (b) elastic modulus.
Conclusion
Surface integrity plays the role of critical issue. Ultra-precision machining not only affects surface quality but also changes material properties of a machined surface. In ultra-precision raster milling (UPRM) of Zn-Al, external stress results in phase changes at the machined surface up to a thickness of several hundreds of nanometers. In this study, XRD with different incident angles was employed to analyze phase change characteristics at different penetration depths. A phase-change-distribution function was developed to calculate the phase change thickness based on the XRD measurement. The thickness was identified by surface hardness and elastic modulus at different penetration/indentation depths at the machined surface, using nano-indentation tests. The conclusive results are as follows:
UPRM-induced external stress results in phase changes and crystal orientation changes.
Along the penetration depth, phase changes steeply decrease.
The Bragg angle first decreases and then sharply increases back to the original value.
The phase change thickness is about several hundreds of nanometers.
The proposed method is nondestructive to detect phase change characteristics and thickness.
Footnotes
Declaration of Conflicting Interests
The author(s) declared no potential conflicts of interest with respect to the research, authorship and/or publication of this article.
Funding
The author(s) disclosed receipt of the following financial support for the research, authorship, and/or publication of this article: The work was partially supported by the National Natural Science Foundation of China (Grant nos 51405217 and 51275434), the Youth Science Foundation of Jiangxi Province of China (Grant no. 20142BAB216025) and the Youth Science Foundation of Jiangxi Educational Committee of China (Grant no. GJJ4210).